1. Introduction
In view of the need for assertive decisions in asset and maintenance management, methods and tools based on failure analysis, performance indicators, and risk analysis have obtained great visibility in industrial processes, leading to more consistent decision-making. On the other hand, maintenance management decision-making, through a logical and structured approach, aims to ensure high levels of productivity with costs and resources optimization, as well as personal, property and environment safety.
Currently, the most popular reliability-based maintenance planning technique is Reliability Centered Maintenance (RCM). That philosophy is a system-related approach that relies on the application of Failure Mode and Effects Analysis (FMEA) to define the most critical components regarding systems reliability. For those components, the method mainly suggests the application of preventive and predictive maintenance to avoid failure occurrence [
1,
2,
3]. As an evolution of RCM, Risk-Based Maintenance (RBM) was proposed in the 2000s and has attracted a significant attention in the process and offshore industries, since it provides a cost-effective tool to reduce the probability of failure in the critical components and associated consequences. The main goal of the methodology is to define the most critical scenarios in terms of risk and to select as most critical components the ones that are part of those critical scenarios [
4,
5]. Coupled to these methodologies, Decision-Making Process (DMP) is used to improve the prioritization of pieces of equipment with regard to maintenance planning. Besides risk and reliability factors, as prospected by the previously mentioned methods, maintenance investment, business interruption loss, and maintenance technique feasibility can be included as decision variables.
Accordingly, the design and implementation of maintenance plans becomes a complex problem, involving material, economic, social, and individual aspects [
6]. Thus, a successful implementation requires considering the opinion of different experts in a context of uncertainty and incomplete and inaccurate data [
7]. For example, the uncertainty of the RCM or Risk-Based Inspection (RBI) analysis is associated with expert judgment used to elaborate FMEA or other risk analysis techniques that use a numerical classification system to express probability of occurrence and consequences of system´s components failure modes. It is hard to reach a consensus when dealing with a great number of experts with different backgrounds [
8].
Several decision support systems have been developed to improve the determination of optimal maintenance plans [
9,
10,
11,
12], maintenance scheduling [
13,
14], and maintenance workload [
15,
16], as well as the determination of criticality levels of pieces of equipment [
17,
18,
19]. Generally, such criticalities are individually established, without explicitly considering potential differences between persons involved in the analysis or areas interested in the problem [
20]. In case of inexistence of consensus between the experts, the opinions should be weighted through the use of weighting factors that ideally must take into consideration the appropriateness and relevance of the expert in the field under analysis [
21]. Percentiles can be used to combine expert opinions and arithmetic and geometric averages can be used, although the results are dependent on the number of experts invited for the elicitation. The merits of using performance-based weighting schemes to combine judgments of different individuals (rather than assigning equal weights to individual experts) and the way that interaction between experts should be handled are still ongoing research topics [
22]. The expert opinion aggregation can become more challenging if the information provided by experts is contradictory. A family of so-called heterodox nonclassical logics, namely, Paraconsistent Logic (PL), whose main feature is the withdrawal of the principle of noncontradiction can aid in decision-making when the analyst is confronted with contradictory opinions [
23].
One of the techniques that belongs to such a family and deserves special attention is the Paraconsistent Annotated Logic (PAL) that allows a better decision-making when there are contradictory values or opinions through the attribution of favorable and unfavorable values (the degrees of belief and disbelief) in relation to any proposition, generating a logic that presents results in four states: true, false, inconsistent, and indeterminate [
23,
24,
25]. The method has been applied in qualitative and quantitative approaches, such as logic programming for robotics, artificial intelligence and automation, analysis of environmental problems, decision-making in industrial quality and logistics, logical-philosophical reasoning, applied mathematics in decision-making in matters of medicine and law, and complexity of computational systems (mainly assisting in inconsistent data mining). With this technique it is possible to obtain greater consistency and reduce the epistemic uncertainties (obtained by extractors of belief and disbelief in values) for the weights attributed by decision-makers in many decision processes.
A relatively new method proposed to improve quality and reliability of products and process is the Variation Mode and Effect Analysis (VMEA), which has been mainly used in the areas of project development and prototype testing in controlled environment. VMEA is a statistically based method used to analyze the effect of different sources of variation on a specific system. One of the main advantages of VMEA is to assist in the comprehension of these variations and to highlight the areas of the product or process in which improvement efforts should be directed. The method systematically assesses how Noise Factors (NF) affect the Key Product Characteristics (KPC) of a system’s components. The VMEA result is an index, the Variation Risk Priority Number (VRPN), which indicates the transfer of the variation of these NFs to the analyzed system, supporting the proposal of solutions that could minimize such effects and increase the robustness of the system [
26,
27,
28]. Considering the DMP context, these characteristics make the method a strong candidate for application in the maintenance management decision-making process.
However, despite the favorable performance of both methods in the aforementioned areas, the lack of application of such techniques in maintenance and reliability engineering decision-making processes, added to the difficulty in assertive decision-making in maintenance activities associated with infrastructure systems, such as power generation and petrochemical plants, are motivating factors for this research. In this way, the present work aims to adapt the VMEA method to analyze the sensitivity of the KPCs of the main items of an equipment, according to the potential and functional failure modes, which are considered as NFs. Due to the importance of the weight assignment process in the VMEA analysis, the Paraconsistent Bi-Annotated Logic (PAL2v)—Paraconsistent Annotated Logic with annotation of two values—is applied as a weight assignment tool for the variables involved in this analysis, which make up the indicators that measure the impact of failure modes on the variation of the key characteristics (main function) of the components of an equipment. As a result, the authors aim to obtain the VRPN indicator, which can guide the development of an adequate maintenance policy for each analyzed component, depending on its sensitivity (variation of its operation condition) to the presence of faults, directing the attention of analysts and maintainers to areas where such variations may be harmful.
The combined technique proposed in this work, so called PAL-VMEA, is an epistemic method, as it transforms the tacit knowledge of decision-makers (specialists) into explicit knowledge. With logical and mathematically structured consistency, this method brings the truth of the matter about the critical weight relative to each variable that affects the performance of the analyzed mechanical system, establishing validated scientific knowledge, for an assertive decision in the appropriate maintenance policy. For the process of extracting belief and disbelief from the values attributed by the decision-makers in the VMEA analysis, the Best-Worst Method (BWM) is also used, which made it possible to assess and balance the degree of knowledge of each decision-maker by establishing an index in the extraction process.
This article is structured as follows:
Section 2 and
Section 3 describe the literature review on VMEA and PAL, respectively.
Section 4 presents the BWM fundamentals.
Section 5 and
Section 6 describe the development steps of the LPA-VMEA method and its application in a case study considering the components of a Kaplan turbine hydrogenerator. A comparison of the proposed approach with indicators traditionally obtained by brainstorming is also presented in this section.
Section 7 presents a discussion about the application of the proposed method and the results obtained. The conclusion of the article is detailed in
Section 8.
2. Variation Mode and Effect Analysis (VMEA)
The concept of a robust product significantly contributed to the establishment of the Robust Design Methodology (RDM) as a methodology to improve product and process quality during the second half of the last century [
29]. Although the use of RDM-related methods is quite disseminated, it is clear that only to a limited extent, some systematic techniques are used in the industry for the original purpose, which indicates that there are lack of some elements for successful implementation [
30,
31,
32]. As a response to this gap and considering that variations in the manufacturing process affect the quality and performance characteristics of the final product in several ways and, also, that some of that characteristics are more sensitive to that variations than others, Chakhunashvili, Johansson, and Bergman [
32] introduced an engineering method, VMEA, developed to systematically look for NFs affecting KPCs in early product development phases.
Although it can be considered a derivation of Failure Mode and Effect Analysis (FMEA), a failure-oriented approach, VMEA emphasizes the assessment of risks related to excessive variations in the analyzed system. Originally focused on product design and analysis, in this work its objective is to identify and prioritize NFs that contribute significantly to the variability of KPCs and could generate undesired consequences in terms of safety, compliance with government regulations, and functional system requirements. The resulting index of the analysis, VRPN, directs the attention of analysts and maintainers to areas where reasonably predicted variations may be harmful. Based on the results obtained from VMEA, a design or maintenance strategy that seeks to prioritize actions that minimize or eliminate the causes of the observed variations can be formulated, facilitating the subsequent efforts to obtain a more robust and reliable system.
Johansson et al. [
26] presented a statistically based VMEA that, as the authors put it, could be used in situations where the transfer function, i.e., the relationship between the KPCs and the factors affecting them, is unknown. When the analytical expression of the transfer function is known, VMEA would correspond to the well-known method of moments. The VMEA procedure would be particularly useful to grasp information on the transfer function usually mastered by experts on the product under study. The results of the VMEA would then serve as a basis for attaining robust designs using traditional Design of Experiments (DoE) in the phases of parameter and tolerance design.
Carrying out a study about a jet engine components’ fatigue life in order to obtain a safety margin that would take into consideration all identifiable causes of uncertainty, Johansson et al. [
33] used the probabilistic branch of VMEA implemented as a first-order, second-moment reliability method. In their conclusions they stressed the fact that in addition to the use of both basic and enhanced VMEA in the early design stages for the identification of critical components, whenever either scatter or uncertainty need to be quantified, a more sophisticated probabilistic VMEA is required.
O’Brien, Clifford, and Southern [
34] included VMEA among the most usual engineering tools that have been used to improve and optimize processes. The authors reasoned that VMEA provided a scientific method to discover the actual main causes of variation, as opposed to the fact that often in process innovation engineers believe that they are instinctively aware of the main causes of variation, while in many cases, it is one of the unsuspecting parameters which is not high on the list of offenders that is the main cause of process problems and variation.
Pavasson et al. [
28] stated that the possibility of predicting the reliability of hardware for both components and systems is important in engineering design. So VMEA was used to investigate how different sources of variation affected the reliability of a wheel loader automatic transmission clutch shaft. The authors claimed that the upgraded probabilistic VMEA that was proposed could be used to identify, to asses, and to manage different variations to increase the system reliability. Besides, it could be used not only for existing products but also for new product development.
In order to investigate and compare how external parameters influence the fuel consumption of an articulated hauler, Cronholm [
27] used VMEA with a view to further apply an experimental design methodology—a two-level fractional factorial test—to create a reduced test plan that focuses on the most interesting parameters during the in service runs. It was concluded that the VMEA method may be useful even if the available information is limited.
Luo et al. [
35] contended that traditional FMEA is insufficient to consider detrimental variations, which lead to soft failure. Accordingly, the authors presented a method combining the FMEA technique with VMEA, which they named “F-VEMEA,” and applied it to the analysis of the characteristics of a jet pipe electrohydraulic servo valve.
Since there are several methods for improving the prediction of reliability, being VMEA a relatively new one, Pavasson and Karlberg [
36] set out to show how VMEA differs from Fault Tree Analysis (FTA) and FMEA in terms of requirements, limitations, and possibilities in the context of product development. It was concluded that the results from FMEA, FTA, and VMEA are somewhat complementary and useful during the whole product development process.
Andréasson and Catalano [
37] after having applied VMEA to a successful Six Sigma improvement project, proposed a new development, named “Process-VMEA (P-VMEA),” providing a framework for identifying, assessing, mitigating, and managing variations in a process. The deliveries of the framework were mainly directed towards decision-makers and aim to strengthen fact-based decisions. In their conclusions, however, the authors conceded that it was a statistical complex tool that required high knowledge about variation and how to conduct the analysis of data. Besides, due to restricted time, the P-VMEA had been applied only to one industrial case and needed further validation.
According to Sandström, Johannesson, and Sidenmar [
38], who have applied VMEA in the context of Ocean Harvesting Technologies (OHT) while carrying out the gear design for the rack pinion mechanism of a gravity accumulator device, this novel methodology proved to be useful where previous experience in designing was absent, allowing adequate safety factors to be set so the desired reliability could be achieved.
As a result of evaluating two design criteria for the structural reliability of the double rod pretension cylinder in a half-scale prototype Wave Energy Converter (WEC), Svensson and Johannesson [
39] concluded that the VMEA methodology can be a good basis for condition monitoring, where the accumulated equivalent fatigue load can be monitored and the uncertainties may be updated based on operational data. This gives the possibility to predict the remaining life and its uncertainty, which can be a valuable input to maintenance planning.
As presented, despite being a method with several applications and great potential, the use of VMEA for the area of maintenance and system reliability is still marginal.
3. Paraconsistent Annotated Logic (PAL)
Indeterminations, ambiguities, contradictions, or inconsistencies are often present in real-world situations, where Classical Logic, being binary (two truth values: true and false), can prove ineffective in solving problems. In contrast, PL is classified as a family of nonclassical logic, presenting a larger set of truth values, being, therefore, a better solution to deal with problems related to nonclassical logical systems that can present contradictions [
25,
40,
41].
PL’s are nontrivial and nonclassical logics and their origins are traced back to the first systematic studies that deal with the possibility of rejecting the principle of noncontradiction of classical logic [
41]. The first studies on PL were developed in 1958, when hierarchical systems were proposed. In 1987, the annotated logic was developed to provide a basis for PL programming, which evolved into PAL, a more robust PL for practical application in decision-making processes [
25,
42,
43,
44,
45].
An important characteristic of PL is that this nonclassical logic has found numerous applications in philosophy, quantum mechanics, artificial intelligence, traffic control, medicine, economics, finance, and computing, opening new directions for research in philosophy, science, and technology [
46]. In fact, when conducting a search in the Web of Science database (May, 2020) about application studies of PL, the authors found 601 articles from several application areas, as presented in
Figure 1. In this brief bibliometric analysis, the authors searched for journal articles, conference proceedings, and review articles with the following search algorithm: “Annotated Paraconsistent Logic*” OR “Paraconsistent Logic*” OR “Paracomplete* Logic*” OR “Annotated Logic*” OR “Paracompleteness Logic*” OR “Paraconsistency* Logic*.”
The articles related to the fields of industrial engineering, management, and operations Research management science are primarily focused on the application of PAL in product quality decision-making, logistics, environmental sciences, and behavioral situations, among others. Studies carried out in the areas of electrical and electronics engineering, automation, and computer science applied, for the most part, the PAL in the development of algorithms for automation and control of industrial systems and/or algorithms for data mining (for analysis of distributed and often inconsistent databases). The PL’s were also applied to examine inconsistencies from various sources in the creation and treatment of databases and knowledge bases, i.e., application of PL in data mining to improve the veracity of information [
47].
In the field of physics, Carnielli and Rodrigues [
41] present a formal paraconsistent system and a corresponding intended interpretation, according to which true contradictions are not tolerated. Contradictions are, instead, epistemically understood as conflicting evidence, where the evidence for proposition “A” is understood as reason for believing that “A” is true. The article defines a paraconsistent and paracomplete natural deduction system, called Basic Evidence Logic (BEL), and extends it to Logic of Evidence and Truth (LETJ). Da Costa and Ronde [
42] presented a study on the understanding of physical “superpositions” that exist in both classical and quantum physics. The authors presented a paraconsistent approach to quantum superpositions, which tries to explain the contradictory properties present in the interpretation of the meaning of quantum superpositions, which considers the contradiction as a key element of the formal structure of the theory.
In other fields of application, studies such as Takahashi, Umeda, and Sawamura [
48], developed a basic structure of argument (means of interaction) for Extended Generalized Annotated Logical Programs (EGAP), providing the theory of semantics and dialectical proof and proving the solidity, integrity, and equivalence of semantics well-reasoned. Bonilla et al. [
23] apply Paraconsistent Tri-Annotated Logic (PAL3v) in the analysis of a set of emergency indicators linked to ecological and environmental issues, aiming to assess sustainability and efficiency in minimizing the priority for the use of nonrenewable resources. Encheva, Tumin, and Kondratenk [
49] added the PAL in a support system to select optimal decisions in transport logistics, having as the main criterion for decision the quality of cargo delivery. Oshiyama et al. [
50] used PAL to classify medical equipment based on the ABC analysis of corrective maintenance data, developing alerts on deviations in equipment performance, which are identified when inconsistencies and indeterminations occur in the classification.
Summing up, PL helps to clarify the concepts of negation and contradiction, aiming to deal with contradictory situations. Many studies, mainly practical case studies, present results that consider the inconsistencies. For this reason, they are more propitious in framing problems caused by situations of contradictions, ideal for applying a nonclassical logic such as PAL in the decision-making process. Next are presented the fundamentals of BWM, applied in conjunction with the PAL-VMEA in this work.
4. Best-Worst Method (BWM)
According to Rezaei [
51], the Best-Worst Method (BWM) is a multicriteria decision-making technique where the best and worst choices, among the alternatives, are defined by means of a peer comparison between the analyzed alternatives (with a weight scale of 1–9 used for comparison). This method also stands out for its simple application and the reduction in the time for carrying out the peer comparison between the variables, in addition to the good performance in maintaining consistency between the judgments [
51,
52]. In this work, the BWM is used as an auxiliary tool for PAL2v, evaluating the ability (in percentage) of decision-makers (engineering experts) to assign weights to critical variables that affect (directly and indirectly) the performance of KPCs analyzed in the VMEA method.
In general applications, the algorithm to structure the Best-Worst Method is presented as follows [
51,
53]:
Step I: list the variables (decision criteria) involved in the decision process.
Step II: decision-makers must determine which criterion is the most important (BEST criterion) and which has the least impact on the decision (WORST criterion).
Step III: carry out the parity comparison (using Saaty’s scale: 1–9 [
54]) between the preference of BEST criteria over other criteria. The result of the Best-to-Others vector is AB = (
aB1,
aB2, …,
aBn), where
aBj indicates the degree of preference of the best criterion,
B, over criterion
j, and 1 ≤
j ≤
n.
Step IV: make the parity comparison (using Saaty’s scale: 1–9) between the preferences of the criteria involved in the decision-making process over the determined WORST criteria. The result of the Others-to-Worst vector is AW = (a1W, a2W, …, anW), where ajW indicates the degree of preference of the criterion j over the worst criterion, W.
Step V: obtain the optimal weights (percentages), (
w1*,
w2*, …,
wn*), of each criterion from the formulation of a Maximization and Minimization problem (MAX-MIN), given by Equation (1), in order to satisfy the conditions that for each (
wB/
wj) and (
wj/
wW), (
wB/
wj) =
aBj and (
wj/
wW) =
ajW, being
wB the importance weight of the best criterion and
wW the importance weight of the worst criterion.
The problem presented in Equation (1) can be simplified, as presented in Equation (2), in order to obtain
ξ*:
Step VI: Perform the consistency verification of the assigned values (weights) by the decision-makers for the criteria of the decision-making process. This verification can be performed by the Consistency Ratio calculated by Equations (3) and (4):
Being the maximum possible
ξ—max (
ξ)—called Consistency Index (CI), found as function of
aBW, according to
Table 1 [
51].
Once the consistency verification is done, the result of the percentage weight of each criterion involved in the decision-making process is obtained. In conclusion, BWM is an easy-to-apply method for determining the most appropriate weights for decision criteria, with guaranteed reliability of results, as it performs a consistency check of the judgments (even comparison between the criteria) made by the decision-makers.
5. The Proposed PAL-VMEA Method Conjugated with BWM
As previously mentioned, the present work aims to determine the appropriate maintenance policy for an equipment, through critical maintenance indicators (VRPN) defined through the application of the VMEA quality tool. The method based on the combination of PAL2v and BWM is used as a weight assignment tool to VMEA inputs, considering the epistemic uncertainty, which does not occur in decision processes where the experts’ opinions are combined based on statistical approach.
According to the flowchart of the proposed method presented in
Figure 2, the VMEA tool is initially applied to the critical analyzed components, which can be divided into subsystems. The key point of VMEA is the assessment of how variations in the characteristics of a product affect its final quality [
32]. In this work, however, the use of VMEA is proposed to analyze the condition of a system and, in this process of adapting the method to a new context related to maintenance, KPCs are translated as the main functions of the analyzed subsystems, as Sub-KPCs are understood as the flows (of information, matter, or energy) that integrate the components of these subsystems in the fulfillment of their functions. In this way, these flows are basically physical measurable quantities, in which variation outside the standards defined by the operational condition of the analyzed system is due to faults in its components, defined as the NF in this case. To demonstrate how each NF affects the analyzed KPC in a graphic way, an Ishikawa diagram can be used, as shown in
Figure 3 [
32].
From the Ishikawa diagram, it is possible to build a form for the VMEA, associating the weights to the considered KPCs and NFs, as presented in
Table 2.
The three weights considered in the VMEA form (Sub-KPC Weigh, Variation in NF, and Sensitivity of Sub-KPC to NF) must be determined, respectively, using the following criteria: criteria for assessing the transfer of variation from Sub-KPC to KPC, criteria for assessing the variability of noise factors, and criteria for assessing the sensitivity of Sub-KPC to noise factors. The values associated with the criteria for each weight are found in
Table 3,
Table 4 and
Table 5 [
32].
Subsequently, the PAL2v combined with the BWM methods are applied to assign the VMEA weights, previously presented in
Table 3,
Table 4 and
Table 5. For such application, it is necessary to develop the following constructs:
Analyze the level of knowledge of decision-makers in relation to the skills needed for weight allocation. List the skills necessary to assess the impact of failure modes on the functioning of the analyzed subsystems (variation of KPCs).
Conduct interviews with decision-makers to analyze the skills among each other and then apply the BWM to obtain the distribution of the weights of the expertise of each decision-maker. BWM is applied to assess and balance the degree of technical knowledge (%) of each decision maker, building the base of belief (beij) and disbelief extractors (deij). The decision-makers’ skills aggregated weights (W1 and W2) will be used in the extraction of belief and disbelief further. The weights W1 and W2 are structured, for each decision-maker, as: W1 is the sum of weights of knowledge concentrated on the assessment skills and W2 is the sum of weights of knowledge concentrated on other skills, of each KPC and NF.
After defining the weights of the skills (constructive basis of extractors of belief and disbelief), PAL
2v is applied through a structured table containing the Sub-KPCs and NFs to be evaluated (according to the failure modes) of each KPC. Thus, the decision-makers assign a value from 0 to 1 (0 meaning total disbelief and 1 total belief) for each value of the VMEA criteria (
Table 3,
Table 4 and
Table 5). This process is repeated for the evaluation of each KPC with the purpose of assigning the initial belief weight value (
aij) and subsequently, the determination of belief and disbelief (
bij) using the extractors developed in the presented method.
The weights added to the decision-makers’ skills are used in the extraction of belief (favorable evidence) and disbelief (unfavorable evidence) during the application of PAL
2v. The belief and disbelief extractors have the purpose of extracting uncertainties during the decision-making process from the values to be attributed to the failure modes. With the belief input value (
aij), the disbelief (
bij) is calculated, then the belief extractor (
beij) and disbelief extractor (
deij) are applied to these values (considering a scale from 0 to 10), using Equations (5)–(7), considering
W1 and
W2. In the final result, a weighted average of the extractors is computed.
To calculate the result for favorable (or belief,
aw) and unfavorable (or disbelief,
bw) evidences, both values obtained by the extraction process for each Sub-KPC and NF, a weighted average of the extractors is computed. In addition, for the estimation of the degree of certainty (
H) and uncertainty (
G), a degree of requirement (for decision-making considering the most consistent weight) must be established (generally, 0.5, i.e., a minimum of 50% of opinions must converge with certainty so that the value is established in the Truth zone). The requirement level determines the consistency of the analysis or the degree of caution to use the analysis, which depends on the further use of the results (such as an indicator for decision-making) and its implications. For a level of requirement of 50%, assessments will be carried on with at least 50% of certainty. Thus, the weight of each Sub-KPC and NF is established by the highest degree of certainty (
Hmax), with the indicators obtained by Equations (8) and (9).
If the same degree of certainty (H) is obtained for different weights, i.e., there is a contradiction of opinions establishing total indeterminacy (same level of favorable and unfavorable evidence), decision-makers should search for more information about the particularities of the analyzed variable for decision-making (and new weight assignment).
The favorable and unfavorable evidence results determined for each Sub-KPC and NF must be analyzed according to the zones that make up the para-analyzer algorithm plotted on the Unitary Square on the Cartesian Plane (USCP), as presented in
Figure 4 and
Table 6.
Once the weights (with greater consistency) of the variables (Sub-KPCs and NFs) involved in the VMEA analysis have been determined, the VRPN index is calculated. This indicator represents the impact that the variation of the functionalities of the components can have on the performance of the KPC of the analyzed subsystem.
It is worth mentioning that this novel method allows to mitigate the epistemic uncertainty present in the implementation of VMEA. The combination of PAL and VMEA aims to make the obtained VRPN values more robust and reliable. Once the proposed method is fully applied, the main resulting indexes of the analysis, i.e., the VRPN values, will direct the attention of analysts and maintainers to areas where reasonably predicted variations may be harmful. From these results, therefore, a design or maintenance strategy that seeks to prioritize actions that minimize or eliminate the causes of the observed variations can be formulated, facilitating the subsequent efforts to obtain a more robust and reliable system.
6. Case Study
Hydroelectric Power Plants (HPP’s) are responsible for generating more than 60% of the electric energy that make up the Brazilian energy matrix [
55]. The dependence on this energy source, both for the country’s industrial development and meeting the needs of modern society, determines the importance of ensuring the operational availability and reliability of the power generation system, aiming at the continuity of energy supply. In this way, the maintenance management of HPP’s assets must promptly adapt to meet the high standards of availability and reliability necessary to comply with the energy production and dispatch schedules.
When a fault affects the main functions of a hydrogenerator, it may result in the reduction and/or interruption of the generation capacity of the power plant. In these cases, penalties and/or high fines established by regulatory agencies may be attributed to the power plant generating company due to noncompliance with demand.
The weights established using the PAL-VMEA method aim to reduce the inconsistency in the information used to obtain the VRPN indicator. As this indicator reflects the equipment´s operation, maintenance, and risk to assets and employees’ safety, as well as how much the interconnected electric system can be impacted by the failures in the analyzed mechanical systems (considering the reliability and operational availability of the equipment), consistency is a key point in this decision process.
As a practical application of the proposed method, a case study is presented considering a Kaplan turbine hydrogenerator. The unit belongs to a run-of-the river power plant located in the Brazilian North region. According to its layout, a guide journal bearing is positioned near the turbine, two guide journal bearings are placed near the generator (one above and one below) and one thrust journal bearing is located near the shaft mid-span. The generated power output is around 150 MW. A simplified functional tree, covering the three main mechanical systems of the hydrogenerator, as well as the respective and most significant subsystems, is shown in
Figure 5.
From the chosen subsystems, eleven KPCs were considered for the VMEA analysis:
Oil pressure on the air-oil accumulator
Response time for the Kaplan mechanism
Water linear momentum for the water intake
Transmitted torque for the turbine blades
Control oil flow for the Kaplan head
Flow rate for the lubrication system
Oil pressure for the lubrication system
Lift force for the journal bearings
Angular moment for the shaft and joining elements
Oil outlet temperature for the heat exchanger
Transmission force for the servo motor actuator
Seven necessary skills were listed to assess the impact of failure modes on the variation of the eleven KPCs: reliability and risk analysis, maintenance management, product quality management (materials and manufacturing process), failure mechanisms analysis, professional experience in hydroelectric power plant, electrical and automation knowledge, and lubrication, hydraulics, and pneumatics knowledge.
Four experts participated in the interviews and in the evaluation and analysis process for each KPC. Together, these specialists have almost 100 years of experience in product design, reliability and risk analysis, quality management, and rotating machinery monitoring and diagnosis, among other abilities. From the application of BWM, the weight distribution of the skills of each decision-maker was obtained.
Table 7 shows the result of applying this method to define the weight of skills for each decision-maker. Note that the sum of the knowledge weights of each evaluator is equal to 1. It is worth mentioning that the method does not limit the number of participating experts and, although the time consumed by the analysis increases, a greater number of participating specialists tends to increase the accuracy of the results.
For each analyzed sub-KPC, NFs were associated according to the considered failure modes. In each case, an Ishikawa diagram was created to represent the transfer between the variations of the NF and the KPCs analyzed. To illustrate the process, the air-oil accumulator subsystem (from the speed governor system) will be considered, as presented in
Figure 6.
In this case, the KPC associated with the oil pressure is the capacity of the air-oil accumulator subsystem to pressurize the control fluid. The factors (weights) to be designated by the evaluators are: the probability of the sub-KPC’s oil volume (F1) and air pressure (F2) transferring or contributing to a significant variation in the analyzed KPC; the variability of the NF’s oil leakage (F3), clogging of the oil pipeline (F4) and leakage in the air pipeline (F5) with the equipment in steady state, and the sensitivity of each sub-KPC to its NFs (F6 for oil leakage, F7 for oil pipeline clogging, and F8 for air pipeline leakages). The necessary knowledge to attribute the beliefs of each weight are given in
Table 8, while
Table 9,
Table 10,
Table 11, and
Table 12, respectively, present the degree of favorable evidence (belief) attributed by each expert to each weight associated with the VMEA attributes (as presented in
Table 3,
Table 4 and
Table 5). It is worth mentioning that the results in
Table 8 were obtained through brainstorm sessions with the experts, who reached consensus on which skills would be needed to assess each factor.
Applying the evidence values associated with each weight (
Table 9,
Table 10,
Table 11 and
Table 12), as well as the weights related to each knowledge necessary for the evaluation of each weight (
Table 7 and
Table 8), the results presented in
Table 13 are achieved for each VMEA weight.
The favorable and unfavorable evidence results of each evaluated factor, for the given example, plotted in the USCP are shown in
Figure 7.
Considering the obtained results for the sub-KPC’s oil volume (F1 = 9) and air pressure (F2 = 9); the variability of the NF’s oil leakage (F3 = 2), clogging of the oil pipeline (F4 = 3) and leakage in the air pipeline (F5 = 1); and the sensitivity of each sub-KPC to its NFs (F6 = 9, for oil leakage, F7 = 8, for oil pipeline clogging, and F8 = 10, for air pipeline leakages), presented in
Table 13, the VMEA form completed for this case study is shown in
Table 14.
Table 14 presents the expected result of the proposed method, i.e., the VMEA form filled with values where epistemic uncertainty was properly worked out in order to increase the robustness of the results.
The interpretation of this table is relatively simple, since the VRPN values (both for the NF and for the Sub-KPC) clearly indicate which disturbance (failure) the analyzed system is more sensitive, in the case of VRPN (NF), as well as which physical quantity (Sub-KPC) should be monitored in order to predict the occurrence of the failure in question, in the case of VRPN (Sub-KPC). These two pieces of information are essential for proper maintenance planning, especially in the Reliability-Centered Maintenance (RCM) case.
In order to create a reference for the obtained results, the same experts who participated in the PAL-VMEA process evaluated the VMEA weights and, through meetings and the classic brainstorming process, arrived at the results presented in
Table 15.
Seeking to determine a comparison between the results obtained with the PAL-VMEA method and the brainstorming process, the 66 NFs and 24 KPCs of the entire analyzed system were evaluated and the result are shown in
Figure 8a,b, respectively.
In this case, each point represents an ordered pair formed by the result of the two processes (PAL-VMEA and brainstorming) for the same NF or KPC. The diagonal line represents the total correspondence between the results of the two methods, i.e., NFbrainstorm = NFPAL-VMEA and KPCbrainstorm = KPCPAL-VMEA. The colors intensity in the graphs represents the distance between the results, with the yellow zone representing the region of equivalence between results, the red zone representing the region in which the results found via brainstorm are greater than PAL-VMEA results, and the green zone representing the opposite.
It is noted that the results of the two methods have some correlation, which is equal to 0.757 in the case of NFs and 0.840 in the case of KPCs, but the variation between results for the same criterion is significant. In most cases, the values found with the PAL-VMEA method are greater than those obtained via the brainstorming process (which would mean a more conservative result for the former), especially in the case of KPCs. It is also interesting to bear in mind that in the brainstorming process, a consensus must be reached among evaluators, even though not always in a truly democratic way, especially if there are different hierarchical levels involved. On the other hand, in the proposed method, the weighting is done individually, therefore emphasizing the experience of each expert. In this way, the result would not derive from the “average” of the appraisers’ experiences, but from their “sum.”
The results obtained can be analyzed more deeply, being of great interest, e.g., to investigate and translate the position of each factor evaluated in the USCP from a physical point of view, considering the failure mechanism involved.
7. Results and Discussion
The PAL-VMEA method culminates in the presentation and analysis of the VMEA form for each system and subsystem analyzed. This form, when correctly interpreted, provides the maintainer and maintenance planner with information of great value for assertive decisions regarding maintenance management, as previously presented. However, it can be said that the application of the PAL-VMEA is an example that the journey can be as important as the arrival.
When interpreting the positioning of the favorable and unfavorable evidences of each factor (weight) evaluated in relation to the quadrants of the USCP, e.g., it is possible to verify, and understand, some fundamentals related to failure modes, and their observability, that can affect the analyzed system. Analyzing these positions, considering this first example, the following conclusions are reached:
For the F1 factor, the value found for assessing the transfer of variation from Sub-KPC to KPC criteria is equal to 9, which translates into a very high sensitivity, i.e., a change in noise factor is very likely to cause a significant deviation in Sub-KPC. Being the result in the Quasi-true tending to paracomplete zone, it is understood, in this case, that if there is a small loss of oil, it may not affect the pressurization of the air-oil accumulator as the air pressure would compensate (with the filling of the bladder). However, this compensation has a limit, once it is exceeded, the oil pressurization drops, so the variation of the oil volume starts to affect the accumulator pressurization capacity, being able to interrupt the hydrogenerator operation.
The weight value F2, which also refers to the transfer of variation from the Sub-KPC to KPC criteria, is equal to 9, translating into a very high sensitivity, which points out that the decision falls in the zone of Truth probably because the decision-makers have full knowledge of the failure mechanism. Without air pressure, it is not possible to pressurize the air-oil accumulator, which may interrupt the operation of the entire generator.
The third weight, F3, is associated with the criteria for assessing the variability of NFs. Being equal to 2, it indicates a very low variability of NF in operating conditions. In this case, it is understood that, for being in the Quasi-false tending to inconsistent zone, practically bordering on quasi-false tending to paracomplete zone, the following assumptions were taken into account: as the origin of oil leaks in the air-oil accumulator can be due to cracks in the pressure vessel and/or failures in the joints and connections, it is impossible to make a consistent measurement over time. So, measuring the derivative of such a measurement (indicator of variability) is an almost impossible task and the decision-makers do not have accurate data for an assessment with complete certainty.
The fourth factor, F4, also related to the variability of the NFs, has a value equal to 3, indicating a low variability of NF in operating conditions. Being in the Quasi-false tending to paracomplete zone, it is understood that measuring clogging in the intake or exit pipeline of the accumulator is a complex task, requiring specific equipment and techniques, such as ultrasonic testing. Therefore, it is difficult to make a consistent measurement of the variability of the clogging over time. So, decision-makers do not have accurate data for an assessment with complete certainty.
The F5 factor, also related to the variability of the NFs, is equal to 1. This value indicates a very low variability of NF in operating conditions. Being in the Quasi-false tending to inconsistent zone, overlapping the F3 factor, this result is related to the fact that measuring the leakage in the air pipeline could be a complex task. Since the maintainer does not have easy access to the entire length of the pipeline to inspect it, specific techniques and instruments are needed to solve the problem. If there was information about the leak over time, the decision-makers’ opinions would likely converge on the truth zone (due to the more consistent monitoring data).
The F6 factor, associated with the sensitivity of Sub-KPC to NF, is equal to 9, demonstrating a very high sensitivity, i.e., a change in the NF is very likely to cause a significant deviation in Sub-KPC. Being practically on the edge of the Truth zone, the result is an indication that the existence of leaks directly affects the volume of oil, regardless of the variability of the leak. As the variation in volume is directly proportional to the variation in leakage, the opinions of decision-makers converged with full certainty to identify that the volume of oil is affected by any occurrence of leakage.
The seventh factor, F7, is also associated with the sensitivity of Sub-KPC to NF. Its value is equal to 8, indicating a high sensitivity, i.e., a change in noise factor is likely to cause a significant deviation in Sub-KPC, and it is located at the Quasi-true tending to paracomplete zone. Despite the lack of consistent data regarding the variability of the clogging, characterizing the lack of information for decision-making, the opinions of decision-makers converge. This agreement occurs because if there is any indication of clogging, there will be a great influence on the oil volume, as the failure mechanism is known.
The last and eighth factor in this analysis, F8, is also associated with the sensitivity of Sub-KPC to NF. With a value equal to 10, result is found in the zone of Truth. The analysis was based on the concept of functional failure. A very small leak could be compensated by the action of the compressor, not leading to the loss of function of the air-oil accumulator. However, when there is an impact on the function of the equipment, any variation in leaks affects the air pressure. Thus, the opinions of the decision-makers converged with full certainty to identify that the air pressure has a high sensitivity due to the variability of leaks.
The method was applied to all other considered subsystems, totaling 10 subsystems. The number of KPCs, Sub-KPCs, and NFs varies significantly from case to case, totaling more than 140 analyzed factors. From all of these analyzes, the conclusions regarding the positioning of the weights in the USCP were reached as presented in
Table 16.
Regarding the VMEA form, the results obtained for the different VRPNs can be considered individually for each subsystem or jointly, considering each system or even the hydrogenerator in its entirety. The largest VRPNs demonstrate which NFs and Sub-KPCs need more attention.
8. Conclusions
The PAL-VMEA method combined with the BWM method, presented in this work, is a variation of the VMEA method with the inclusion of a mechanism for assessing the epistemic uncertainty inherent in knowledge-based methods, such as the FMEA itself and its offspring.
The VMEA method, originally created to fill a gap in the RDM area, is a technique that assesses how NFs (disturbances) can affect the quality of a product’s KPCs. When taken to the maintenance area, NFs can be translated as failure modes and KPCs as the main functions of a system. In this way, the Sub-KPCs translate into the way of observing the effect of the NFs, being basically physical quantities that quantify the flows between the components of the evaluated system.
In this way, the result obtained with the VMEA, the VRPN index, points to the failure modes, considering the VRPN (NF), that most affect the analyzed system, as well as which quantities must be monitored, considering the VRPN (Sub-KPC), so that the symptoms related to each failure mode can be observed, helping in decision-making regarding maintenance planning and management.
The PAL method, since it belongs to a family of nonclassical methods, rejects the principle of noncontradiction, therefore being a very robust tool for the evaluation of epistemic uncertainty. Epistemic uncertainty can be considered an issue in several processes, and this is no different regarding decision-making, planning, and maintenance management.
By combining the PAL with the VMEA, the authors seek to make the valuation of the weights associated with the VMEA more robust and thereby allow more accurate decisions for the maintainers who apply the method in their systems. However, seeking to consider the individual experience of each evaluator in the final result, BWM was also combined with PAL-VMEA, making the proposed method even more robust.
To demonstrate the application of the method, a Kaplan hydrogenerator was considered as an example case, being subdivided into three large systems that, in turn, were subdivided in subsystems, totaling 10 subsystems. One of these subsystems (the speed governor air-oil accumulator, which can be considered the heart of a hydrogenerator) was chosen to demonstrate the development of the method, reaching the final result, the VMEA form. In this example, clogging in the oil pipeline was considered the failure mode for which the equipment shows greater sensitivity, as well as the volume of oil in the accumulator as the most relevant quantity to be monitored.
The favorable and unfavorable evidence results determined for each Sub-KPC and NF were also analyzed according to the zones that make up the para-analyzer algorithm plotted on the USCP. This analysis demonstrated the coherence of the method, also serving as a guide for other applications due to the logic of the results.
In addition to the advantages already demonstrated, a factor that makes the application of PAL-VMEA even more interesting is the way that specialists evaluate and value weights. As the evaluation by the proposed method is individual, the consensus between the different opinions, which is usually obtained via brainstorming with debates and discussions, is found in this case from a logical and mathematical process.
The method ends up requiring the action of a mediator, who will be responsible for the calculations, being an additional element to the team of experts. Besides that, the method proves to be quite laborious for the mediator when applied to a large system, and its automation can be advantageous. Standardized forms can assist in interviews and information collection. Moreover, as a future work and natural continuation of this article, based on its results, it is possible to seek the development of a framework aiming at adequate maintenance policy for the components of a hydrogenerator systems and promoting greater reliability and operational availability to the power generation process.
Author Contributions
Conceptualization, M.M.B., M.A.C.M., A.H.A.M., A.C.N., C.A.M., and G.F.M.S.; methodology, M.M.B., M.A.C.M., A.H.A.M., A.C.N., C.A.M., and G.F.M.S.; validation, M.M.B., M.A.C.M., A.H.A.M., A.C.N., C.A.M., and G.F.M.S.; formal analysis, M.M.B., M.A.C.M., A.H.A.M., A.C.N., C.A.M., and G.F.M.S.; investigation, M.M.B., M.A.C.M., A.H.A.M., A.C.N., C.A.M., and G.F.M.S.; resources, M.M.B., M.A.C.M., A.H.A.M., A.C.N., C.A.M., and G.F.M.S.; data curation, M.M.B., M.A.C.M., A.H.A.M., A.C.N., C.A.M., and G.F.M.S.; writing—original draft preparation, M.M.B., M.A.C.M., A.H.A.M., A.C.N., C.A.M., and G.F.M.S.; writing—review and editing, M.M.B., M.A.C.M., A.H.A.M., A.C.N., C.A.M., and G.F.M.S.; visualization, M.M.B., M.A.C.M., A.H.A.M., A.C.N., C.A.M., and G.F.M.S.; supervision, G.F.M.S.; project administration, G.F.M.S.; funding acquisition, G.F.M.S. All authors have read and agreed to the published version of the manuscript.
Funding
This study was financed in part by the Coordenação de Aperfeiçoamento de Pessoal de Nível Superior—Brasil (CAPES)—Finance Code 001. The authors thank the financial support of FDTE (Fundação para o Desenvolvimento Tecnológico da Engenharia), CAPES, CNPq (Conselho Nacional de Desenvolvimento Científico e Tecnológico), and EDP Brasil for the development of the present research as part of an ANEEL P&D Project.
Conflicts of Interest
The authors declare no conflict of interest. The funders had no role in the design of the study; in the collection, analyses, or interpretation of data; in the writing of the manuscript; or in the decision to publish the results.
References
- Rausand, M. Reliability Centered Maintenance. Reliab. Eng. Syst. Saf. 1998, 60, 121–132. [Google Scholar] [CrossRef]
- Moubray, J. Reliability Centered Maintenance, 2nd ed.; Industrial Press: New York, NY, USA, 1997; ISBN 0831131462. [Google Scholar]
- Karajagikar, J.S.; Sonawane, B.U. Reliability-Centered Maintenance (RCM) Approach for a Process Industry: Case Study. In Optimization Methods in Engineering. Lecture Notes on Multidisciplinary Industrial Engineering; Tyagi, M., Sachdeva, A., Sharma, V., Eds.; Springer: Singapore, 2021; pp. 429–442. [Google Scholar]
- Khan, F.I.; Haddara, M.M. Risk-based maintenance (RBM): A quantitative approach for maintenance/inspection scheduling and planning. J. Loss Prev. Process Ind. 2003, 16, 561–573. [Google Scholar] [CrossRef]
- Arunraj, N.S.; Maiti, J. Risk-based maintenance—Techniques and applications. J. Hazard. Mater. 2007, 142, 653–661. [Google Scholar] [CrossRef] [PubMed]
- Vidal, R.V.V. Operational research: A multidisciplinary field. Pesqui. Oper. 2006, 26, 69–90. [Google Scholar] [CrossRef][Green Version]
- Mingers, J.; Rosenhead, J. Problem structuring methods in action. Eur. J. Oper. Res. 2004, 152, 530–554. [Google Scholar] [CrossRef]
- Liu, H.C.; Chen, X.Q.; Duan, C.Y.; Wang, Y.M. Failure mode and effect analysis using multi-criteria decision making methods: A systematic literature review. Comput. Ind. Eng. 2019, 135, 881–897. [Google Scholar] [CrossRef]
- Bevilacqua, M.; Braglia, M. Analytic hierarchy process applied to maintenance strategy selection. Reliab. Eng. Syst. Saf. 2000, 70, 71–83. [Google Scholar] [CrossRef]
- Bertolini, M.; Bevilacqua, M. A combined goal programming—AHP approach to maintenance selection problem. Reliab. Eng. Syst. Saf. 2006, 91, 839–848. [Google Scholar] [CrossRef]
- Ghosh, D.; Roy, S. A decision-making framework for process plant maintenance. Eur. J. Ind. Eng. 2010, 4, 78–98. [Google Scholar] [CrossRef]
- Papakostas, N.; Papachatzakis, P.; Xanthakis, V.; Mourtzis, D.; Chryssolouris, G. An approach to operational aircraft maintenance planning. Decis. Support Syst. 2010, 48, 604–612. [Google Scholar] [CrossRef]
- Lamptey, G.; Labi, S.; Li, Z. Decision support for optimal scheduling of highway pavement preventive maintenance within resurfacing cycle. Decis. Support Syst. 2008, 46, 376–387. [Google Scholar] [CrossRef]
- Koornneef, H.; Verhagen, W.J.C.; Curran, R. A decision support framework and prototype for aircraft dispatch assessment. Decis. Support Syst. 2020, 135, 113338. [Google Scholar] [CrossRef]
- Dinis, D.; Teixeira, Â.P.; Barbosa-Póvoa, A. ForeSim-BI: A predictive analytics decision support tool for capacity planning. Decis. Support Syst. 2020, 131, 113266. [Google Scholar] [CrossRef]
- Melani, A.H.A.; Murad, C.A.; Caminada Netto, A.; Souza, G.F.M.; Nabeta, S.I. Maintenance Strategy Optimization of a Coal-Fired Power Plant Cooling Tower through Generalized Stochastic Petri Nets. Energies 2019, 12, 1951. [Google Scholar] [CrossRef]
- Chen, C.C. A developed autonomous preventive maintenance programme using RCA and FMEA. Int. J. Prod. Res. 2013, 51, 5404–5412. [Google Scholar] [CrossRef]
- Melani, A.H.A.; Murad, C.A.; Caminada Netto, A.; de Souza, G.F.M.; Nabeta, S.I. Criticality-based maintenance of a coal-fired power plant. Energy 2018, 147, 767–781. [Google Scholar] [CrossRef]
- De Melani, A.H.A.; Da Silva, R.F.; De Andrade Melani, A.H.; De Carvalho Michalski, M.A.; Martha de Souza, G.F.; Nabeta, S.I. Defining Maintenance Significant Items Based on ISO 55000 and AHP: A Hydropower Plant Case Study. In Proceedings of the 29th European Safety and Reliability Conference (ESREL), Hannover, Germany, 22–26 September 2019; Research Publishing Services: Singapore, 2019; pp. 3437–3444. [Google Scholar]
- Dhanisetty, V.S.V.; Verhagen, W.J.C.; Curran, R. Multi-criteria weighted decision making for operational maintenance processes. J. Air Transp. Manag. 2018, 68, 152–164. [Google Scholar] [CrossRef]
- Ayyub, B.M.; Klir, G.J. Uncertainty Modeling and Analysis in Engineering and the Sciences; Chapman and Hall/CRC: Boca Raton, FL, USA, 2006; ISBN 9781420011456. [Google Scholar]
- Hanea, A.M.; McBride, M.F.; Burgman, M.A.; Wintle, B.C. The value of performance weights and discussion in aggregated expert judgments. Risk Anal. 2018, 38, 1781–1794. [Google Scholar] [CrossRef] [PubMed]
- Bonilla, S.H.; Papalardo, F.; Tassinari, C.A.; Sacomano, J.B.; de Carvalho, F.R. Contribution of the Paraconsistent Tri-Annotated Logic to emergy accounting and decision making. Ecol. Modell. 2019, 393, 98–106. [Google Scholar] [CrossRef]
- De Carvalho, F.R.; Abe, J.M. A Paraconsistent Decision-Making Method; Smart Inno.; Springer: Berlin/Heidelberg, Germany, 2018; ISBN 9783319741093. [Google Scholar]
- da Costa, N.C.A.; Subrahmanian, V.S.; Vago, C. The Paraconsistent Logics PJ. Zeitschrift für Math. Logik und Grundlagen der Math. 1991, 37, 139–148. [Google Scholar] [CrossRef]
- Johansson, P.; Chakhunashvili, A.; Barone, S.; Bergman, B. Variation Mode and Effect Analysis: A Practical Tool for Quality Improvement. Qual. Reliab. Eng. Int. 2006, 22, 865–876. [Google Scholar] [CrossRef]
- Cronholm, K. Design of experiment based on VMEA (Variation Mode and Effect Analysis). Procedia Eng. 2013, 66, 369–382. [Google Scholar] [CrossRef][Green Version]
- Pavasson, J.; Cronholm, K.; Strand, H.; Karlberg, M. Reliability Prediction Based on Variation Mode and Effect Analysis. Qual. Reliab. Eng. Int. 2013, 29, 699–708. [Google Scholar] [CrossRef]
- Genichi, T. Introduction to Quality Engineering: Designing Quality into Products and Processes; Quality Resources: Ibaragi, Japan, 1986; ISBN 9283310845. [Google Scholar]
- Gremyr, I.; Arvidsson, M.; Johansson, P. Robust design methodology: Status in the Swedish manufacturing industry. Qual. Reliab. Eng. Int. 2003, 19, 285–293. [Google Scholar] [CrossRef]
- Arvidsson, M.; Gremyr, I.; Johansson, P. Use and knowledge of robust design methodology: A survey of Swedish industry. J. Eng. Des. 2003, 14, 129–143. [Google Scholar] [CrossRef]
- Chakhunashvili, A.; Johansson, P.M.; Bergman, B.L.S. Variation mode and effect analysis. In Proceedings of the Annual Symposium Reliability and Maintainability, 2004-RAMS, Los Angeles, CA, USA, 26–29 January 2004; pp. 364–369. [Google Scholar]
- Johannesson, P.; Svensson, T.; Samuelsson, L.; Bergman, B.; de Maré, J. Variation mode and effect analysis: An application to fatigue life prediction. Qual. Reliab. Eng. Int. 2009, 25, 167–179. [Google Scholar] [CrossRef]
- O’Brien, E.; Clifford, S.; Southern, M. Knowledge Management for Process, Organizational and Marketing Innovation: Tools and Methods, 1st ed.; IGI Global: Hershey, PA, USA, 2010; ISBN 1615208291. [Google Scholar]
- Luo, M.; Zeng, S.; Guo, J.; Yang, C. Reliability analysis approach for variation by integrating FMEA with VMEA. In Proceedings of the 2014 Prognostics and System Health Management Conference, PHM 2014, Zhangiiaijie, China, 24–27 August 2014; pp. 525–529. [Google Scholar]
- Pavasson, J.; Karlberg, M. Variation Mode and Effect Analysis compared to FTA and FMEA in Product Development. In Proceedings of the 19th AR2TS Advances in Risk and Reliability Technology Symposium, Nottingham, UK, 12–14 April 2011; pp. 252–260. [Google Scholar]
- Andréasson, I.; Catalano, G. Variation Risk Management and Decision Making—P-VMEA: A New Developed Application Area of Variation Mode and Effect Analysis for Robust Process Design. Master’s Thesis, Chalmers University of Technology, Göteborg, Sweden, 2014. [Google Scholar]
- Sandström, J.; Johannesson, P.; Sidenmark, M. Reliability Analysis with VMEA of a Rack and Pinion Mechanism in a Wave Energy Gravity Accumulator; RISE Research Institutes of Sweden: Gothenburg, Sweden, 2018. [Google Scholar]
- Svensson, T.; Johannesson, P. Reliability Evaluation of CorPower Pre-tension Cylinder Using VMEA; RISE Research Institutes of Sweden: Gothenburg, Sweden, 2018. [Google Scholar]
- da Costa, N.C.A.; Krause, D.A.; Bueno, O.A. Paraconsistent Logics and Paraconsistency. Philos. Log. 2007, 791–911. [Google Scholar] [CrossRef]
- Carnielli, W.; Rodrigues, A. An epistemic approach to paraconsistency: A logic of evidence and truth. Synthese 2019, 196, 3789–3813. [Google Scholar] [CrossRef]
- da Costa, N.; de Ronde, C. The Paraconsistent Logic of Quantum Superpositions. Found. Phys. 2013, 43, 845–858. [Google Scholar] [CrossRef]
- da Costa, N.C.A.; Alves, E.H. A semantical analysis of the calculi Cn. Notre Dame J. Form. Log. 1977, 18, 621–630. [Google Scholar] [CrossRef]
- Martin, B. In defence of dialetheism: A reply to Beziau and Tkaczyk. Log. Log. Philos. 2018, 27, 205–233. [Google Scholar] [CrossRef]
- Akama, S. Towards Paraconsistent Engineering; Springer: Berlin/Heidelberg, Germany, 2016; Volume 110, ISBN 978-3-319-40417-2. [Google Scholar]
- Beziau, J.; Chakraborty, M.; Dutta, S. New Directions in Paraconsistent Logic; Beziau, J.-Y., Chakraborty, M., Dutta, S., Eds.; Springer Proceedings in Mathematics & Statistics; Springer: New Delhi, India, 2015; Volume 152, ISBN 978-81-322-2717-5. [Google Scholar]
- Grant, J.; Subrahmanian, V.S. Applications of Paraconsistency in Data and Knowledge Bases. Synthese 2000, 125, 121–132. [Google Scholar] [CrossRef]
- Takahashi, T.; Umeda, Y.; Sawamura, H. Formal Argumentation Frameworks for the Extended Generalized Annotated Logic Programs. In Lecture Notes in Artificial Intelligence 2773; Palade, V., Howlett, R.J., Jains, L., Eds.; Springer: Berlin/Heidelberg, Germany, 2003; pp. 28–38. [Google Scholar]
- Encheva, S.; Tumin, S.; Kondratenko, Y. Application of paraconsistent annotated logic in intelligent systems. Lect. Notes Comput. Sci. (Incl. Subser. Lect. Notes Artif. Intell. Lect. Notes Bioinform.) 2007, 4681 LNCS, 702–710. [Google Scholar] [CrossRef]
- Oshiyama, N.F.; Bassani, R.A.; D’Ottaviano, I.M.L.; Bassani, J.W.M. Medical equipment classification: Method and decision-making support based on paraconsistent annotated logic. Med. Biol. Eng. Comput. 2012, 50, 395–402. [Google Scholar] [CrossRef] [PubMed]
- Rezaei, J. Best-worst multi-criteria decision-making method. Omega 2015, 53, 49–57. [Google Scholar] [CrossRef]
- Mi, X.; Tang, M.; Liao, H.; Shen, W.; Lev, B. The state-of-the-art survey on integrations and applications of the best worst method in decision making: Why, what, what for and what’s next? Omega 2019, 87, 205–225. [Google Scholar] [CrossRef]
- Karimi, H.; Sadeghi-Dastaki, M.; Javan, M. A fully fuzzy best–worst multi attribute decision making method with triangular fuzzy number: A case study of maintenance assessment in the hospitals. Appl. Soft Comput. J. 2020, 86, 105882. [Google Scholar] [CrossRef]
- Saaty, T.L. How to make a decision: The analytic hierarchy process. Eur. J. Oper. Res. 1990, 48, 9–26. [Google Scholar] [CrossRef]
- De Melani, A.H.A.; Murad, C.A.; de Carvalho Michalski, M.A.; Netto, A.C.; Martha de Souza, G.F.; Nabeta, S.I. Updating a Hydro Power Plant Monitoring System Through Failure Modes and Symptoms Analysis. In Proceedings of the 29th European Safety and Reliability Conference (ESREL), Hannover, Germany, 22–26 September 2019; Research Publishing Services: Singapore, 2019; pp. 3468–3475. [Google Scholar]
Figure 1.
Number of articles found in the Web of Science database (May 2020) about Paraconsistent Annotated Logic (PAL), by application area.
Figure 1.
Number of articles found in the Web of Science database (May 2020) about Paraconsistent Annotated Logic (PAL), by application area.
Figure 2.
PAL-Variation and Mode Effect Analysis (VMEA) method framework.
Figure 2.
PAL-Variation and Mode Effect Analysis (VMEA) method framework.
Figure 3.
Variation transfer model—Ishikawa diagram.
Figure 3.
Variation transfer model—Ishikawa diagram.
Figure 4.
Unitary square of the Cartesian plane of the PAL2v.
Figure 4.
Unitary square of the Cartesian plane of the PAL2v.
Figure 5.
Analyzed system simplified functional tree.
Figure 5.
Analyzed system simplified functional tree.
Figure 6.
Air-oil accumulator variation transfer Ishikawa diagram.
Figure 6.
Air-oil accumulator variation transfer Ishikawa diagram.
Figure 7.
Air-oil accumulator example Unitary Square on the Cartesian Plane (USCP).
Figure 7.
Air-oil accumulator example Unitary Square on the Cartesian Plane (USCP).
Figure 8.
Comparison between the PAL-VMEA method and the brainstorming process results for (a) Noise Factors and (b) Key Product Characteristics.
Figure 8.
Comparison between the PAL-VMEA method and the brainstorming process results for (a) Noise Factors and (b) Key Product Characteristics.
Table 1.
Consistency Index.
Table 1.
Consistency Index.
| aBW | 1 | 2 | 3 | 4 | 5 | 6 | 7 | 8 | 9 |
| CI | 0.00 | 0.44 | 1.00 | 1.63 | 2.30 | 3.00 | 3.73 | 4.47 | 5.23 |
Table 2.
Variation and Mode Effect Analysis (VMEA) form.
Table 2.
Variation and Mode Effect Analysis (VMEA) form.
| System: System’s Name | Subsystem: Subsystem’s Name | KPC: Subsystem’s Function |
|---|
| Sub-KPC | Sub-KPC Weight | NF | Variation in NF | Sensitivity of Sub-KPC to NF | VRPN (NF) | VRPN
(Sub-KPC) |
|---|
| Sub-KPC 1 | w1 | NF 11 | v11 | s11 | w1 × v11 × s11 | ∑(w1 × v1m × s1m) |
| NF 12 | v12 | s12 | w1 × v12 × s12 |
| ... | ... | ... | ... |
| NF 1m | v1m | s1m | w1 × v1m × s1m |
| Sub-KPC 2 | w2 | NF 21 | v21 | s21 | w2 × v21 × s21 | ∑(w2 × v2m × s2m) |
| NF 22 | v22 | s22 | w2 × v22 × s22 |
| ... | ... | ... | ... |
| NF 2m | v2m | s2m | w2 × v2m × s2m |
| ... | ... | ... | ... | ... | ... | ... |
| Sub-KPC n | wn | NF n1 | vn1 | sn1 | wn × vn1 × sn1 | ∑(wn × vnm × snm) |
| NF n2 | vn2 | sn2 | wn × vn2 × sn2 |
| ... | ... | ... | ... |
| NF nm | vnm | snm | wn × vnm × snm |
Table 3.
Criteria for assessing the transfer of variation from Sub-KPC to KPC [
32].
Table 3.
Criteria for assessing the transfer of variation from Sub-KPC to KPC [
32].
| Criteria | Weight |
|---|
| Very low probability that the sub-KPC will transfer or contribute with considerable amount of variation to the selected KPC, causing significant impact on product safety, compliance with governmental regulations, functional requirements, or customer satisfaction | 1–2 |
| Low probability that the sub-KPC will transfer or contribute with considerable amount of variation to the selected KPC, causing significant impact on product safety, compliance with governmental regulations, functional requirements, or customer satisfaction | 3–4 |
| Moderate probability that the sub-KPC will transfer or contribute with considerable amount of variation to the selected KPC, causing significant impact on product safety, compliance with governmental regulations, functional requirements, or customer satisfaction | 5–6 |
| High probability that the sub-KPC will transfer or contribute with considerable amount of variation to the selected KPC, causing significant impact on product safety, compliance with governmental regulations, functional requirements, or customer satisfaction | 7–8 |
| Very high probability that the sub-KPC will transfer or contribute with considerable amount of variation to the selected KPC, causing significant impact on product safety, compliance with governmental regulations, functional requirements, or customer satisfaction | 9–10 |
Table 4.
Criteria for assessing the variability of noise factors [
32].
Table 4.
Criteria for assessing the variability of noise factors [
32].
| Criteria | Weight |
|---|
| Very low variability of noise factor in operating conditions, i.e., regardless of the operating conditions, the dispersion in noise factor remains very small | 1–2 |
| Low variability of noise factor in operating conditions, i.e., regardless of the operating conditions, the dispersion in noise factor remains small | 3–4 |
| Moderate variability of noise factor in operating conditions, i.e., regardless of the operating conditions, the dispersion in noise factor remains fairly small | 5–6 |
| High variability of noise factor in operating conditions, i.e., the dispersion in the noise factor is large | 7–8 |
| Very high variability of noise factor in operating conditions, i.e., the dispersion in the noise factor is very large | 9–10 |
Table 5.
Criteria for assessing the sensitivity of Sub-KPC to noise factors [
32].
Table 5.
Criteria for assessing the sensitivity of Sub-KPC to noise factors [
32].
| Criteria | Weight |
|---|
| Very low sensitivity. A change of in noise factor is very unlikely to cause a significant deviation in Sub-KPC | 1–2 |
| Low sensitivity. A change in noise factor is unlikely to cause a significant deviation in Sub-KPC | 3–4 |
| Moderate sensitivity. A change in noise factor is quite likely to cause a significant deviation in Sub-KPC | 5–6 |
| High sensitivity. A change in noise factor is likely to cause a significant deviation in Sub-KPC | 7–8 |
| Very high sensitivity. A change in noise factor is very likely to cause a significant deviation in Sub-KPC | 9–10 |
Table 6.
Unitary square of the Cartesian plane zones.
Table 6.
Unitary square of the Cartesian plane zones.
| Extreme Logical State | f | False |
| T | Inconsistent |
| v | True |
| ⊥ | Paracomplete |
Non-Extreme
Logical State | Qf → ⊥ | Quasi-false tending to paracomplete |
| Q⊥ → f | Quasi-paracomplete tending to false |
| Qf → T | Quasi-false tending to inconsistent |
| Q⊥ → v | Quasi-paracomplete tending to true |
| QT → f | Quasi-inconsistent tending to false |
| Qv → ⊥ | Quasi-true tending to paracomplete |
| QT → v | Quasi-inconsistent tending to true |
| Qv → T | Quasi-true tending to inconsistent |
Table 7.
Experts technical skills weights—Best-Worst Method (BWM) results.
Table 7.
Experts technical skills weights—Best-Worst Method (BWM) results.
| Applied Technical Knowledge (K) | Expert #1 | Expert #2 | Expert #3 | Expert #4 |
|---|
| Reliability and risk analysis (K1) | 0.123 | 0.349 | 0.091 | 0.059 |
| Maintenance management (K2) | 0.123 | 0.222 | 0.299 | 0.137 |
| Product quality management (K3) | 0.379 | 0.148 | 0.299 | 0.027 |
| Failure mechanisms (K4) | 0.123 | 0.089 | 0.121 | 0.206 |
| Professional experience in hydroelectric power plant (K5) | 0.030 | 0.028 | 0.026 | 0.330 |
| Electrical and automation (instrumentation) (K6) | 0.099 | 0.074 | 0.091 | 0.103 |
| Lubrication, hydraulics, and pneumatics (K7) | 0.123 | 0.089 | 0.073 | 0.137 |
Table 8.
Necessary knowledge versus VMEA weights.
Table 8.
Necessary knowledge versus VMEA weights.
| | K1 | K2 | K3 | K4 | K5 | K6 | K7 |
|---|
| F1 | | X | | X | | | X |
| F2 | | X | | X | | | X |
| F3 | | X | | X | | | X |
| F4 | | X | X | X | | | X |
| F5 | | X | | X | | | X |
| F6 | | X | | X | | | X |
| F7 | | X | X | X | | | X |
| F8 | | X | | X | | | X |
Table 9.
Expert #1 favorable evidence degree versus VMEA weights.
Table 9.
Expert #1 favorable evidence degree versus VMEA weights.
| | 1 | 2 | 3 | 4 | 5 | 6 | 7 | 8 | 9 | 10 |
|---|
| F1 | 0.00 | 0.00 | 0.00 | 0.00 | 0.00 | 0.00 | 0.90 | 0.90 | 1.00 | 1.00 |
| F2 | 0.00 | 0.00 | 0.00 | 0.00 | 0.00 | 0.00 | 0.90 | 0.90 | 1.00 | 1.00 |
| F3 | 0.30 | 0.30 | 0.50 | 0.50 | 1.00 | 1.00 | 0.50 | 0.50 | 0.30 | 0.30 |
| F4 | 0.30 | 0.30 | 0.50 | 0.50 | 1.00 | 1.00 | 0.50 | 0.50 | 0.30 | 0.30 |
| F5 | 0.30 | 0.30 | 0.50 | 0.50 | 1.00 | 1.00 | 0.70 | 0.70 | 0.50 | 0.50 |
| F6 | 0.00 | 0.00 | 0.00 | 0.00 | 0.30 | 0.30 | 0.90 | 0.90 | 1.00 | 1.00 |
| F7 | 0.00 | 0.00 | 0.00 | 0.00 | 0.10 | 0.10 | 0.90 | 0.90 | 1.00 | 1.00 |
| F8 | 0.00 | 0.00 | 0.00 | 0.00 | 0.00 | 0.00 | 0.90 | 0.90 | 1.00 | 1.00 |
Table 10.
Expert #2 favorable evidence degree versus VMEA weights.
Table 10.
Expert #2 favorable evidence degree versus VMEA weights.
| | 1 | 2 | 3 | 4 | 5 | 6 | 7 | 8 | 9 | 10 |
|---|
| F1 | 0.00 | 0.00 | 0.00 | 0.00 | 0.30 | 0.50 | 0.50 | 0.30 | 0.00 | 0.00 |
| F2 | 0.00 | 0.00 | 0.00 | 0.00 | 0.00 | 0.00 | 0.10 | 0.30 | 0.70 | 0.20 |
| F3 | 0.30 | 0.30 | 0.30 | 0.30 | 0.00 | 0.00 | 0.00 | 0.00 | 0.00 | 0.00 |
| F4 | 0.30 | 0.30 | 0.30 | 0.30 | 0.00 | 0.00 | 0.00 | 0.00 | 0.00 | 0.00 |
| F5 | 0.30 | 0.30 | 0.30 | 0.30 | 0.00 | 0.00 | 0.00 | 0.00 | 0.00 | 0.00 |
| F6 | 0.00 | 0.00 | 0.00 | 0.30 | 0.30 | 0.30 | 0.30 | 0.00 | 0.00 | 0.00 |
| F7 | 0.00 | 0.00 | 0.00 | 0.00 | 0.30 | 0.30 | 0.30 | 0.30 | 0.00 | 0.00 |
| F8 | 0.00 | 0.00 | 0.00 | 0.00 | 0.00 | 0.00 | 0.20 | 0.60 | 0.60 | 0.60 |
Table 11.
Expert #3 favorable evidence degree versus VMEA weights.
Table 11.
Expert #3 favorable evidence degree versus VMEA weights.
| | 1 | 2 | 3 | 4 | 5 | 6 | 7 | 8 | 9 | 10 |
|---|
| F1 | 0.10 | 0.10 | 0.10 | 0.10 | 0.50 | 0.50 | 0.80 | 0.80 | 0.90 | 0.90 |
| F2 | 0.10 | 0.10 | 0.10 | 0.10 | 0.50 | 0.50 | 0.80 | 0.80 | 0.90 | 0.90 |
| F3 | 0.10 | 0.10 | 0.10 | 0.10 | 0.40 | 0.40 | 0.80 | 0.80 | 1.00 | 1.00 |
| F4 | 0.00 | 0.00 | 0.00 | 0.00 | 0.10 | 0.10 | 0.20 | 0.20 | 0.20 | 0.20 |
| F5 | 0.10 | 0.10 | 0.10 | 0.10 | 0.60 | 0.60 | 0.80 | 0.80 | 0.90 | 0.90 |
| F6 | 0.00 | 0.00 | 0.00 | 0.00 | 0.50 | 0.50 | 0.60 | 0.60 | 1.00 | 1.00 |
| F7 | 0.00 | 0.00 | 0.00 | 0.00 | 0.10 | 0.10 | 0.20 | 0.20 | 0.20 | 0.20 |
| F8 | 0.10 | 0.10 | 0.10 | 0.10 | 0.60 | 0.60 | 0.80 | 0.80 | 0.90 | 0.90 |
Table 12.
Expert #4 favorable evidence degree versus VMEA weights.
Table 12.
Expert #4 favorable evidence degree versus VMEA weights.
| | 1 | 2 | 3 | 4 | 5 | 6 | 7 | 8 | 9 | 10 |
|---|
| F1 | 0.00 | 0.00 | 0.00 | 0.00 | 0.00 | 0.00 | 0.30 | 0.70 | 0.90 | 0.50 |
| F2 | 0.00 | 0.00 | 0.00 | 0.00 | 0.00 | 0.00 | 0.00 | 0.30 | 0.70 | 1.00 |
| F3 | 0.70 | 0.90 | 0.50 | 0.00 | 0.00 | 0.00 | 0.00 | 0.00 | 0.00 | 0.00 |
| F4 | 0.50 | 0.90 | 0.80 | 0.20 | 0.00 | 0.00 | 0.00 | 0.00 | 0.00 | 0.00 |
| F5 | 0.90 | 0.70 | 0.20 | 0.00 | 0.00 | 0.00 | 0.00 | 0.00 | 0.00 | 0.00 |
| F6 | 0.00 | 0.00 | 0.00 | 0.00 | 0.00 | 0.00 | 0.20 | 0.50 | 1.00 | 0.70 |
| F7 | 0.00 | 0.00 | 0.00 | 0.00 | 0.00 | 0.20 | 0.50 | 1.00 | 0.80 | 0.50 |
| F8 | 0.00 | 0.00 | 0.00 | 0.00 | 0.00 | 0.00 | 0.00 | 0.00 | 0.50 | 1.00 |
Table 13.
VMEA weights results.
Table 13.
VMEA weights results.
| | Value | aw | bw | H | G |
|---|
| F1 | 9.00 | 0.7146 | 0.3113 | 0.4033 | 0.0260 |
| F2 | 9.00 | 0.8201 | 0.1712 | 0.6489 | −0.0086 |
| F3 | 2.00 | 0.4089 | 0.6069 | −0.1980 | 0.0158 |
| F4 | 3.00 | 0.3640 | 0.5334 | −0.1694 | −0.1026 |
| F5 | 1.00 | 0.4089 | 0.6069 | −0.1980 | 0.0158 |
| F6 | 9.00 | 0.7705 | 0.2658 | 0.5047 | 0.0363 |
| F7 | 8.00 | 0.5795 | 0.3620 | 0.2175 | −0.0586 |
| F8 | 10.00 | 0.8799 | 0.1288 | 0.7511 | 0.0087 |
Table 14.
VMEA form—air-oil accumulator example.
Table 14.
VMEA form—air-oil accumulator example.
System:
Speed Governor | Subsystem:
Air-Oil Accumulator | KPC:
Pressurize the Control Fluid |
|---|
| Sub-KPC | Weighting of Sub-KPC | NF | Size of variation in NF | Sensitivity of Sub-KPC to NF | VRPN
(NF) | VRPN
(Sub-KPC) |
|---|
| Oil Volume | 9 | Leakage | 2 | 9 | 162 | 378 |
| Clogging | 3 | 8 | 216 |
| Air Pressure | 9 | Leakage | 1 | 10 | 90 | 90 |
Table 15.
VMEA form—air-oil accumulator example (brainstorming).
Table 15.
VMEA form—air-oil accumulator example (brainstorming).
System:
Speed Governor | Subsystem:
Air-Oil Accumulator | KPC:
Pressurize the Control Fluid |
|---|
| Sub-KPC | Weighting of Sub-KPC | NF | Size of variation in NF | Sensitivity of Sub-KPC to NF | VRPN
(NF) | VRPN
(Sub-KPC) |
|---|
| Oil Volume | 8 | Leakage | 2 | 6 | 96 | 176 |
| Clogging | 2 | 5 | 80 |
| Air Pressure | 8 | Leakage | 2 | 6 | 96 | 96 |
Table 16.
Results discussion regarding Unitary Square on the Cartesian Plane (USCP) zones.
Table 16.
Results discussion regarding Unitary Square on the Cartesian Plane (USCP) zones.
| USCP Zones | Results Discussions |
|---|
| Zone of Truth | The evaluators understand (believe) and agree with the proposed failure mode cause and effect mechanism, having sufficient information (well-defined physical principles or measurement data) to analyze the mechanism during the system operation and have a converging opinion |
| Falsehood Zone | The evaluators have doubts, disbelief, do not understand or do not agree with the proposed failure mode cause and effect mechanism, although they have sufficient information for the analysis (measurement data) and their opinions are convergent |
| Inconsistency zone | The evaluators’ opinion is divergent, regardless of their agreement or belief in the proposed failure mode cause and effect mechanism and the level of information available |
| Paracomplete zone | The information available for the analysis of the failure mode during the system operation is insufficient, regardless of the evaluators agreement or belief in the proposed cause and effect mechanism and the convergence of their opinion |
| Quasi-true tending to paracomplete and Quasi-paracomplete tending to true zones | The evaluators understand and agree with the proposed failure mode cause and effect mechanism and their opinion about it is convergent. However, they do not have enough information to analyze the mechanism during the system operation. The relationship between the level of understanding and the level of information available determines whether the answer will be in the Quasi-true tending to paracomplete zone or Quasi-paracomplete tending to true zone |
| Quasi-true tending to inconsistent and Quasi-inconsistent tending to true zones | Evaluators understand and agree with the proposed failure mode cause and effect mechanism and have enough information to analyze it during the system operation. However, their opinions about it are divergent. The relationship between the level of divergence and understanding of the evaluators defines whether the answer will be in the Quasi-true tending to inconsistent zone or Quasi-inconsistent tending to true zone |
| Quasi-false tending to paracomplete and Quasi-paracomplete tending to false zones | The evaluators have doubts, do not understand, or do not agree with the proposed failure mode cause and effect mechanism and do not have enough information to analyze the mechanism during the system operation. The relationship between the level of information and the understanding of the mechanism determines whether the answer will be in the Quasi-false tending to paracomplete zone or Quasi-paracomplete tending to false zone |
| Quasi-false tending to inconsistent and Quasi-inconsistent tending to false zones | The evaluators have doubts, do not understand, or do not agree with the proposed failure mode cause and effect mechanism and their opinions are divergent. The relationship between the level of understanding and divergence determines whether the answer will be in the Quasi-false tending to inconsistent zone or Quasi-inconsistent tending to false zone |
| Center | Undefined analysis. No conclusion can be reached |
| Publisher’s Note: MDPI stays neutral with regard to jurisdictional claims in published maps and institutional affiliations. |
© 2020 by the authors. Licensee MDPI, Basel, Switzerland. This article is an open access article distributed under the terms and conditions of the Creative Commons Attribution (CC BY) license (http://creativecommons.org/licenses/by/4.0/).

 ,
, 


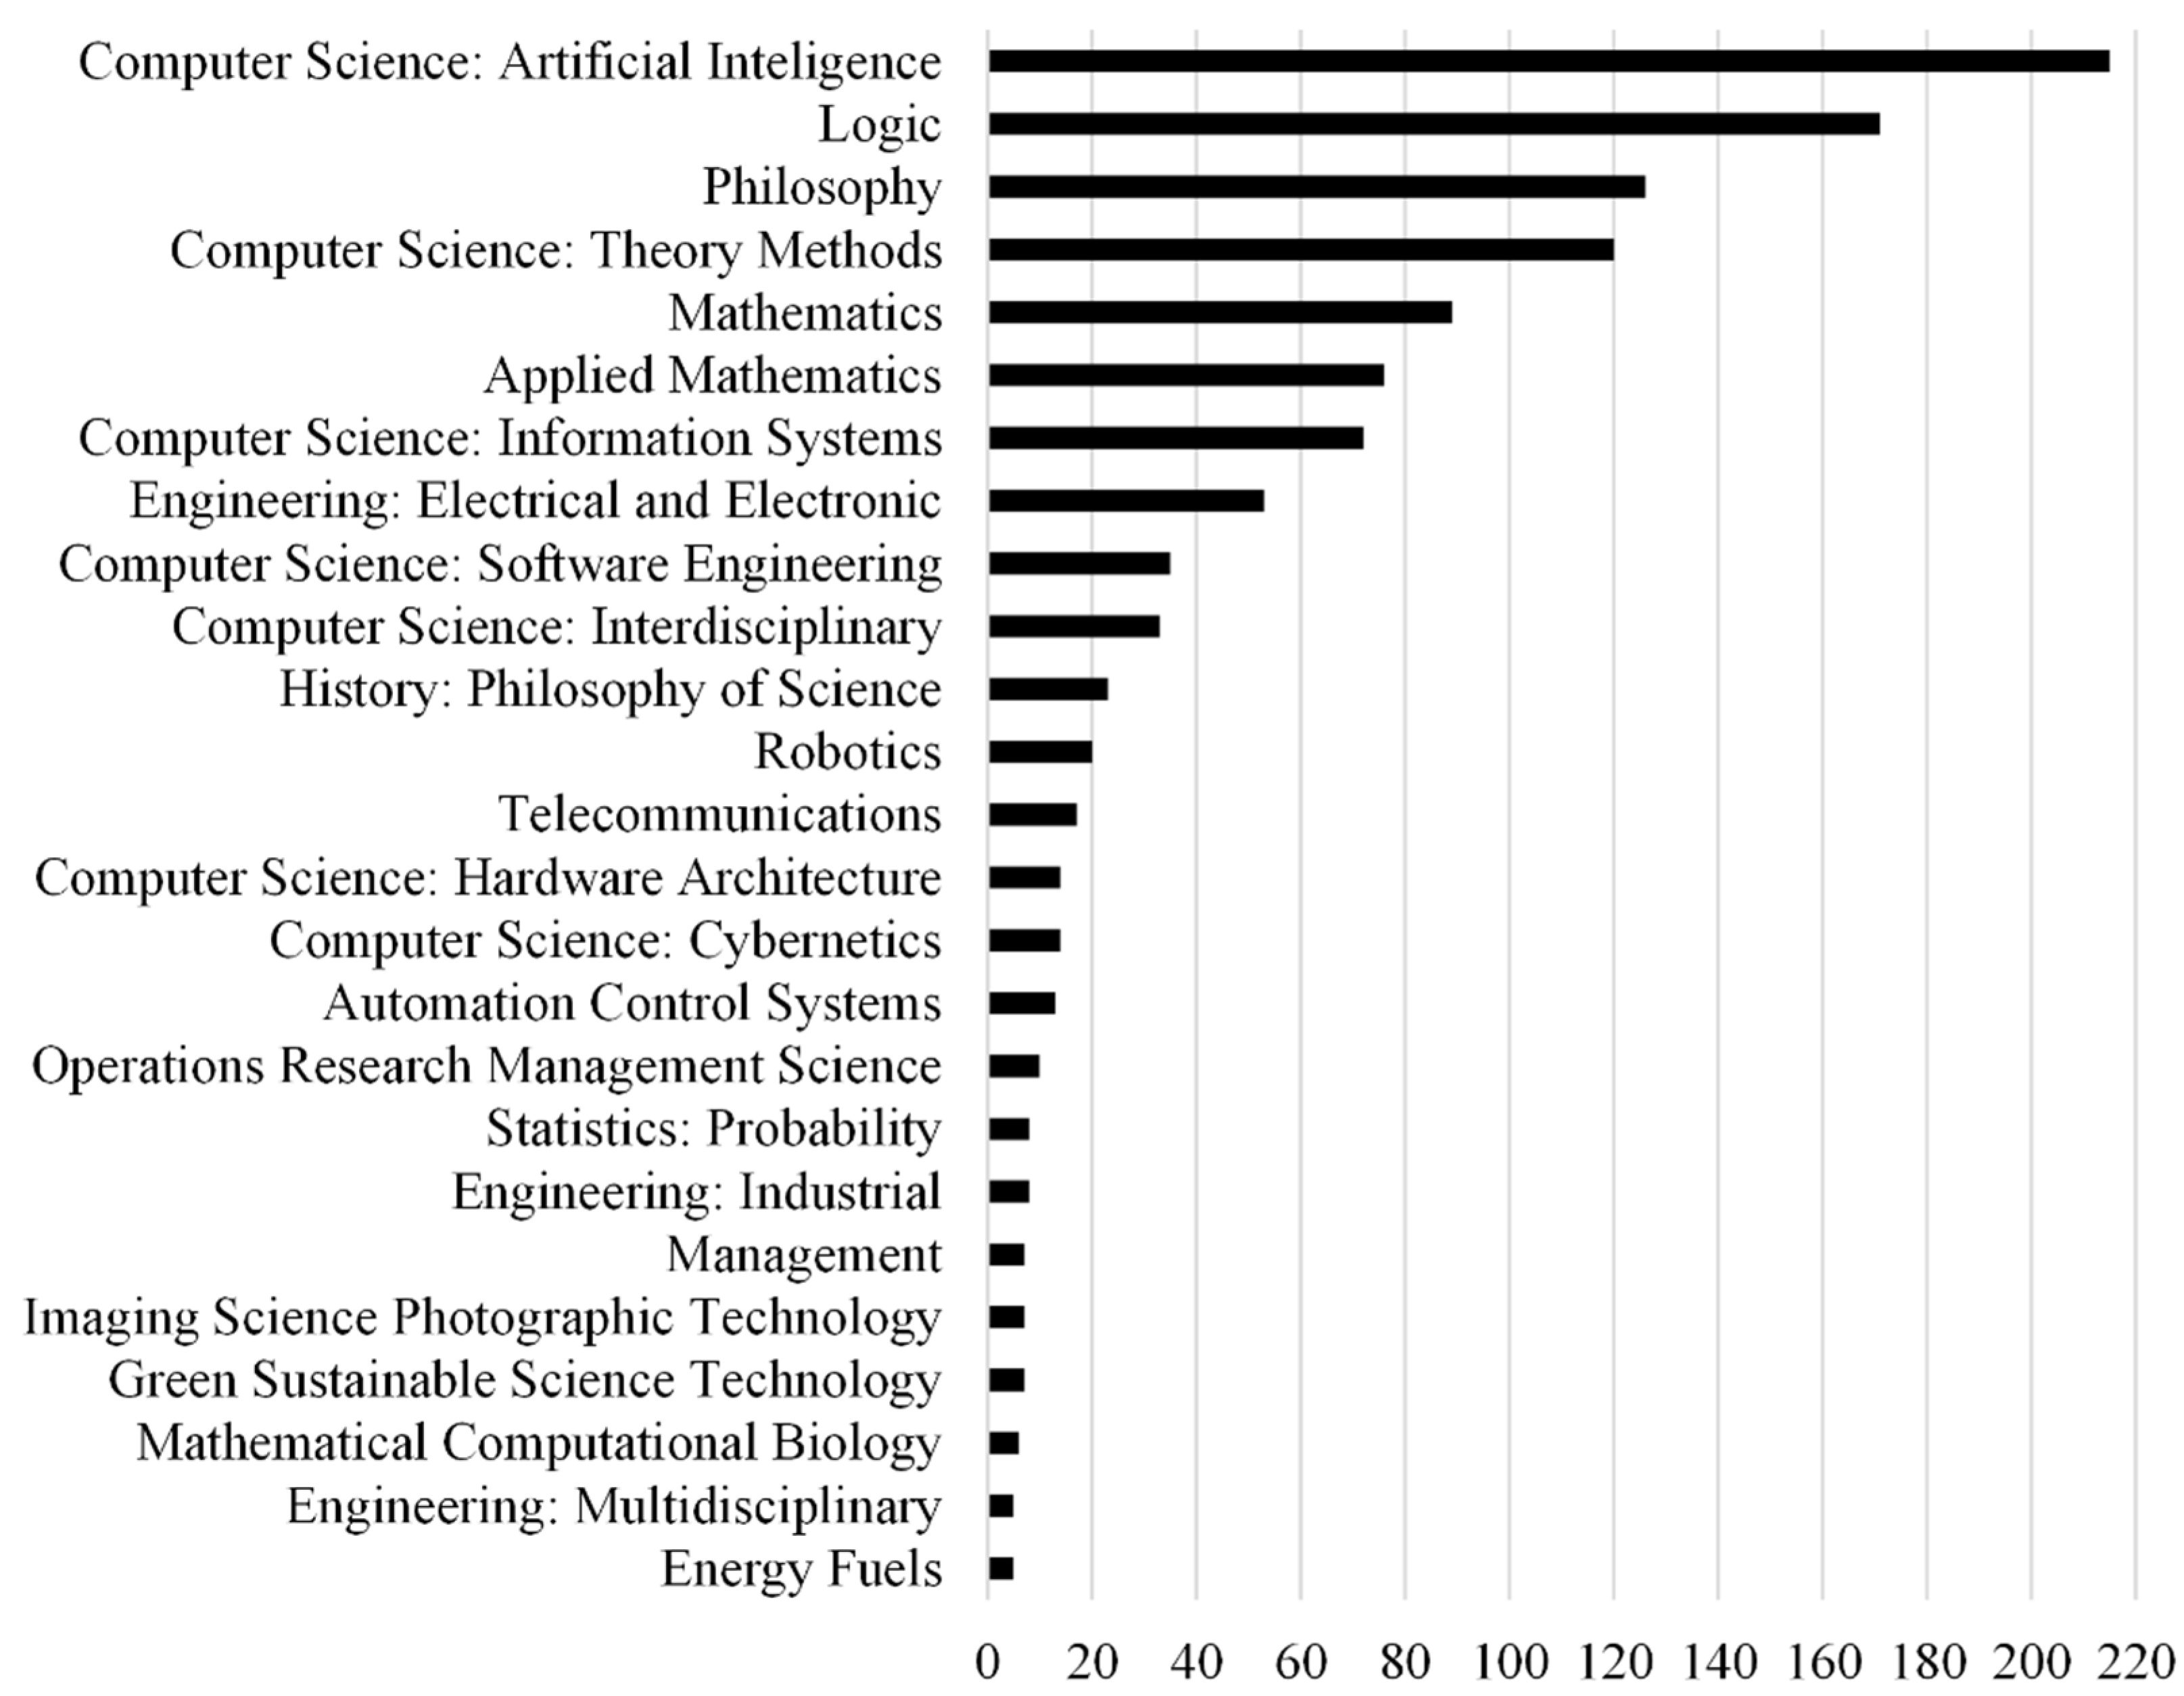
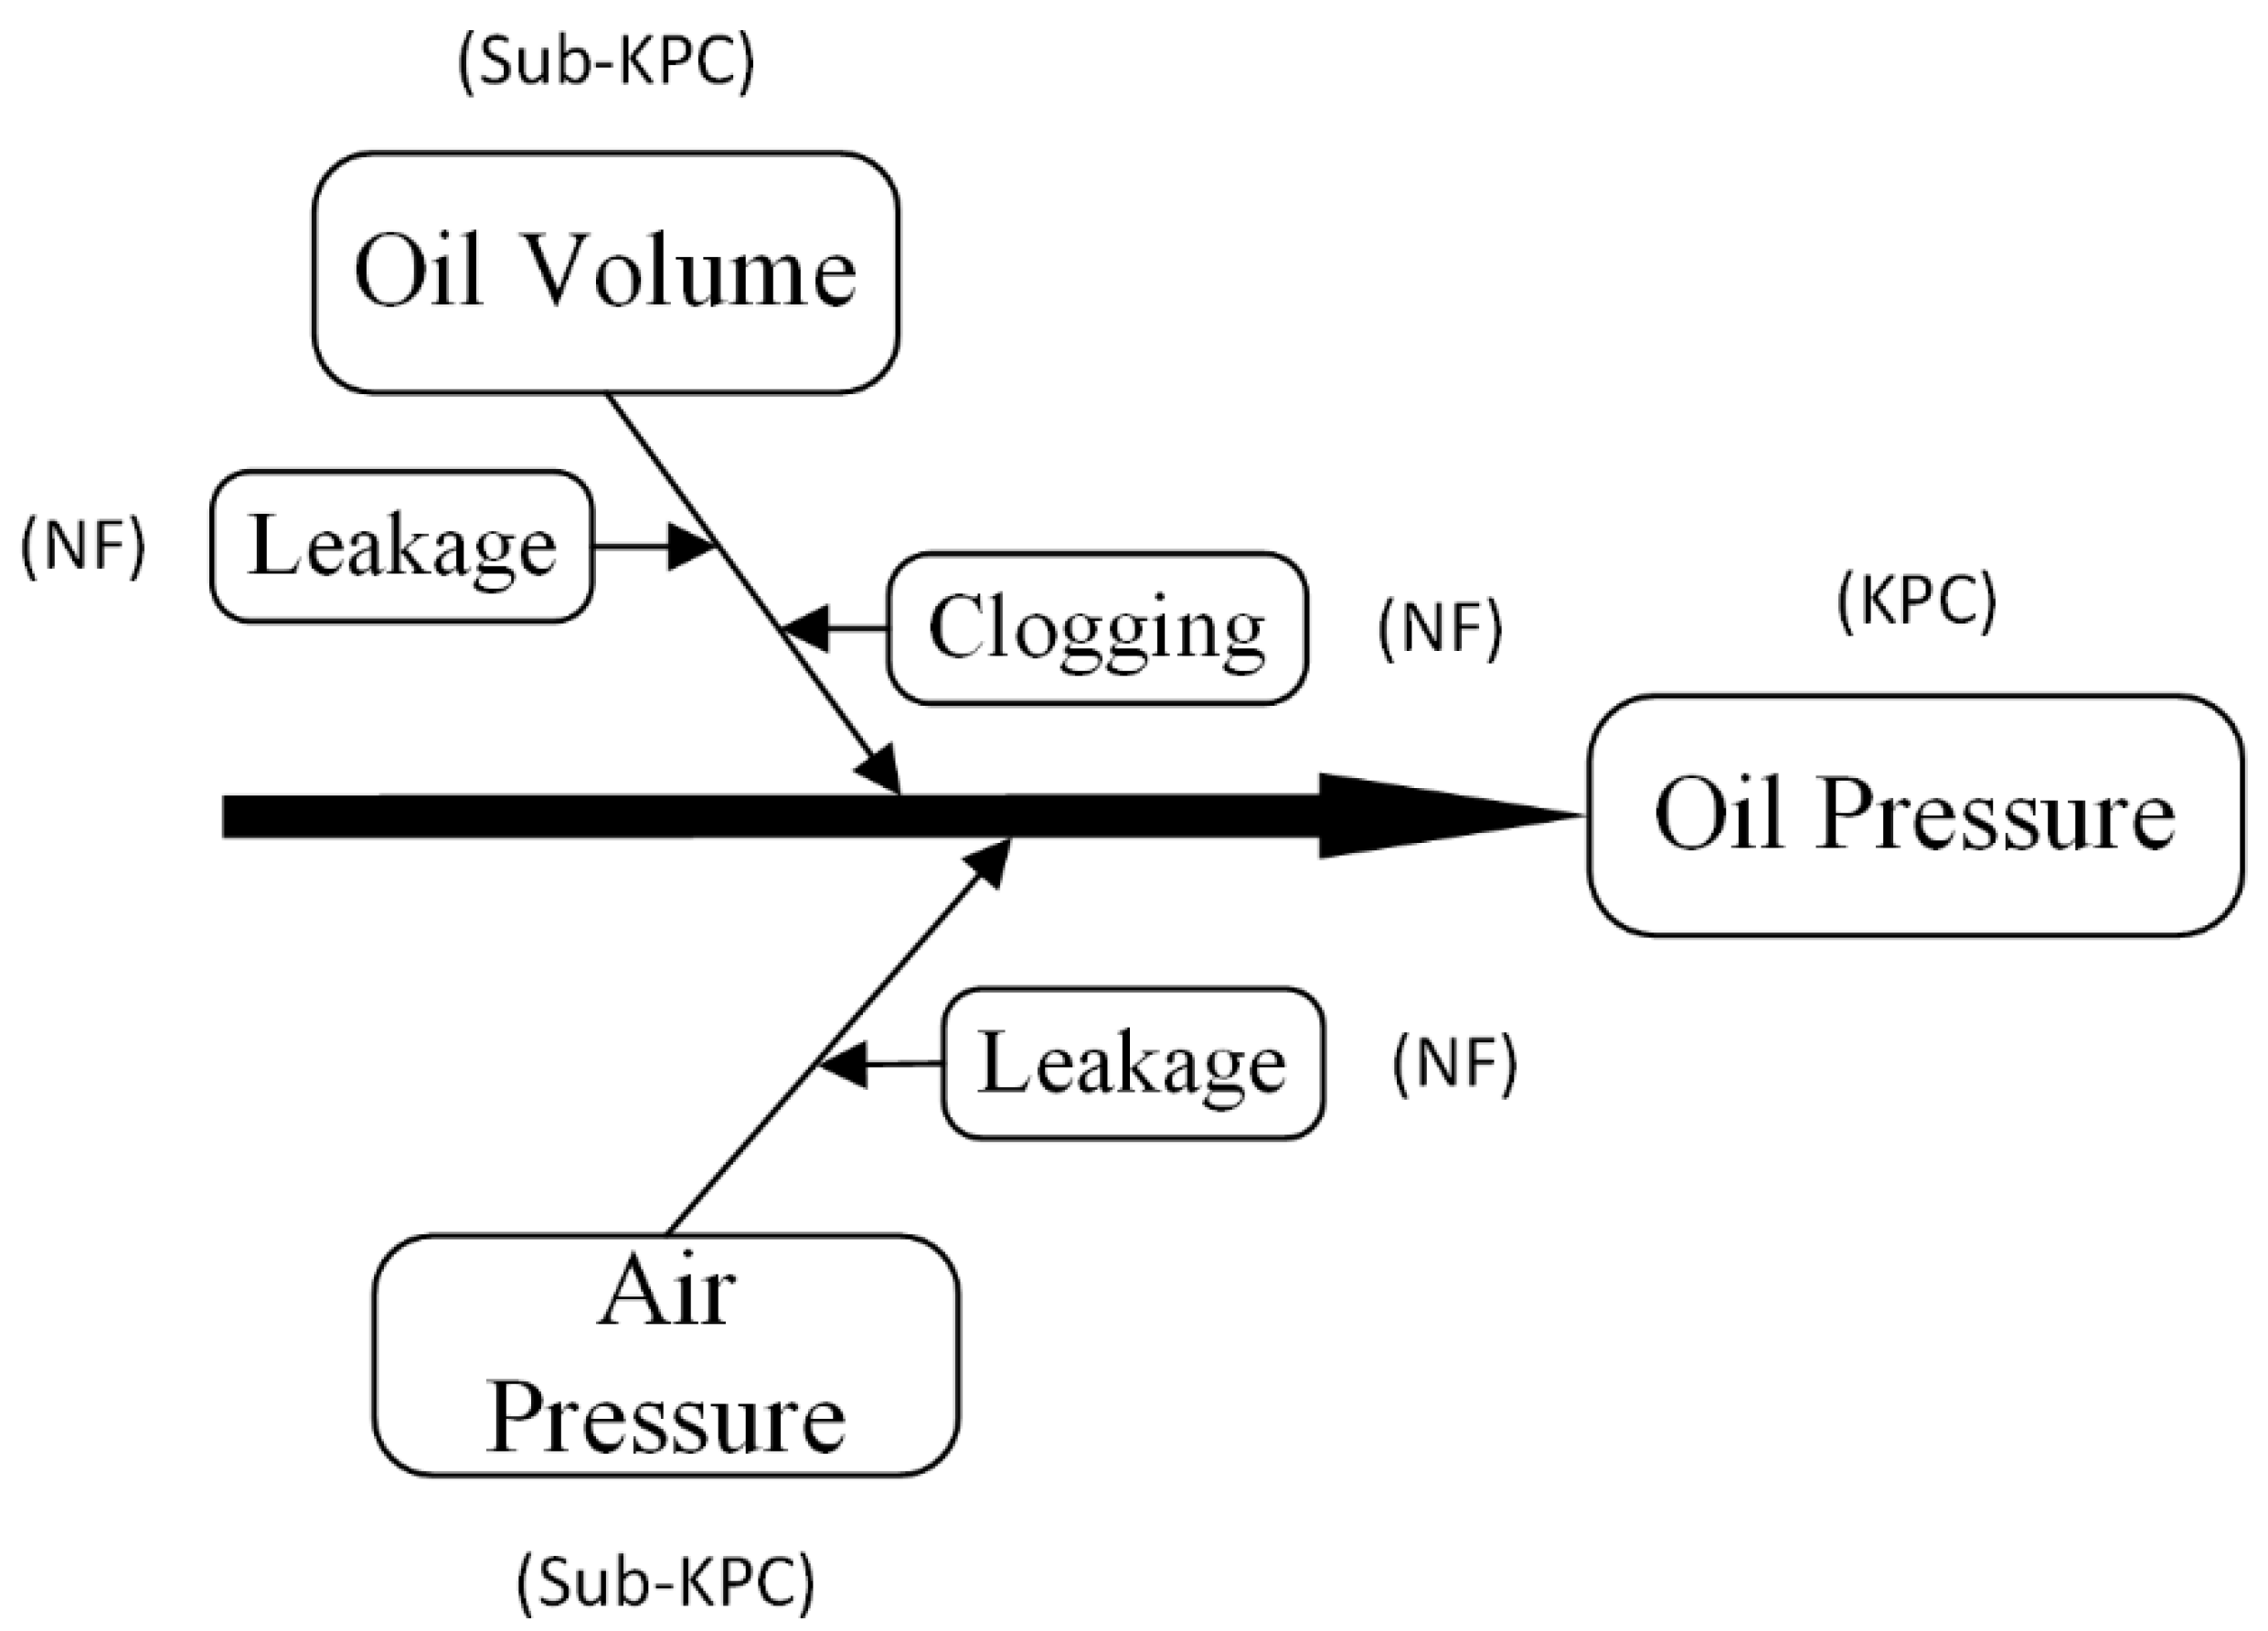
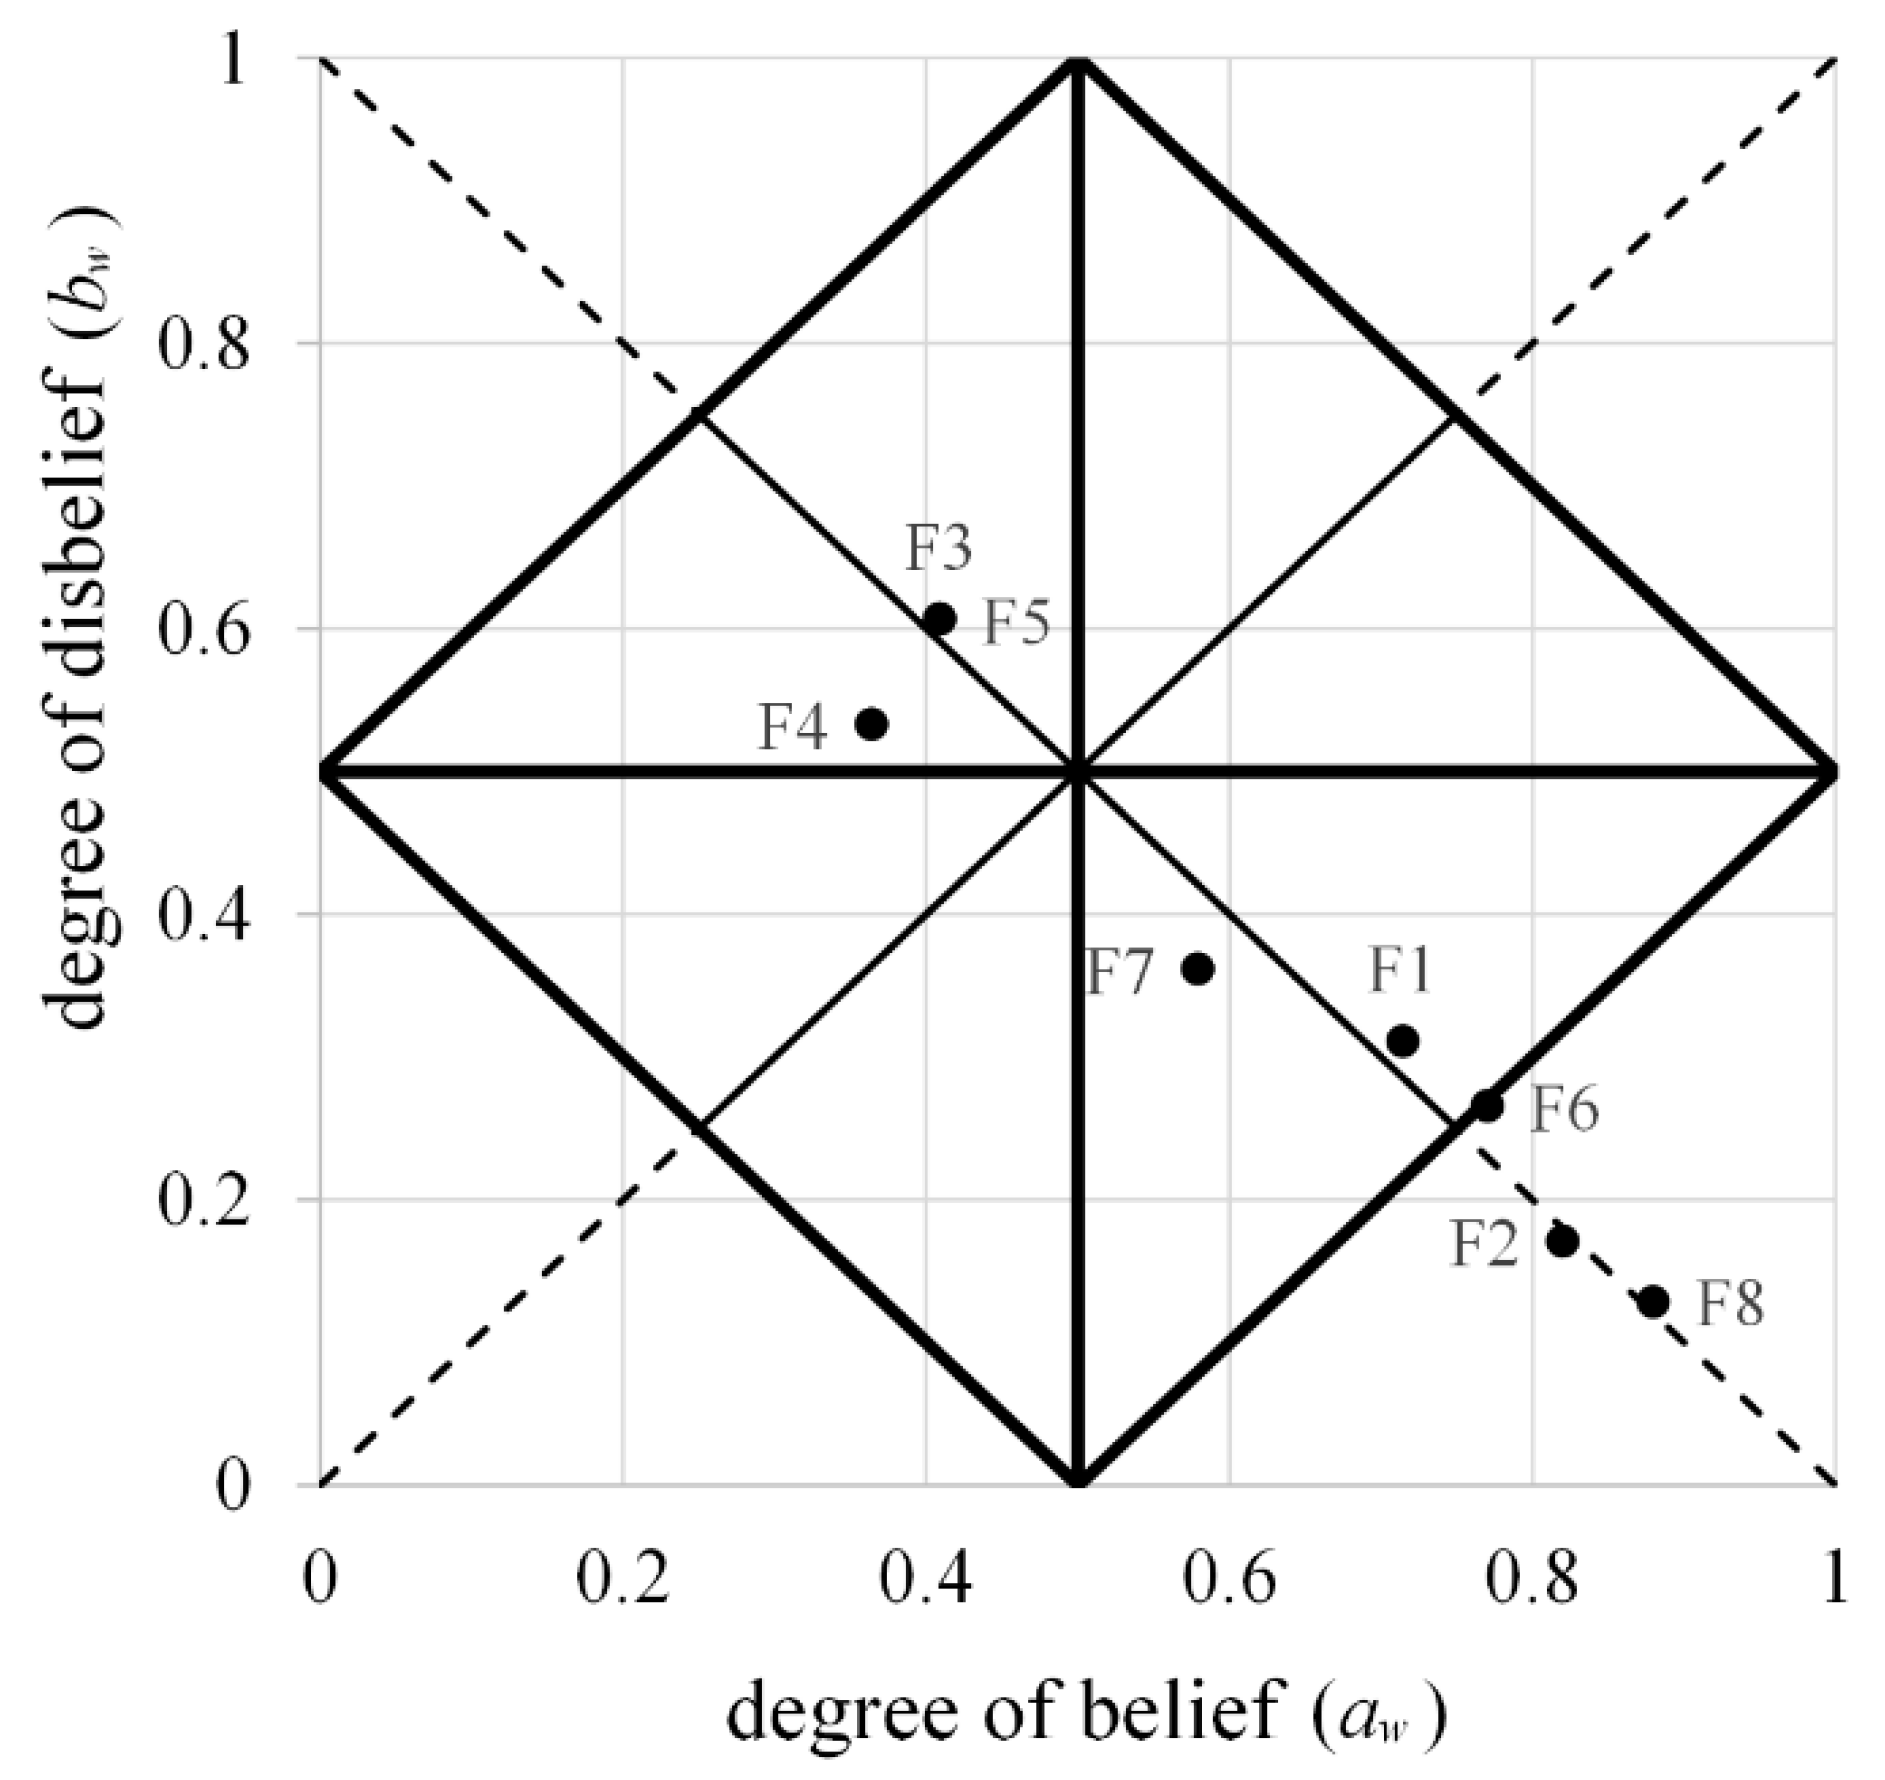