Article

Preclinical, Multi-Aspect Assessment of the Reliability of a Photoplethysmography-Based Telemonitoring System to Track Cardiovascular Status

1
Institute of Translational Medicine, Semmelweis University, 1092 Budapest, Hungary
2
E-Med4All Europe ltd., 1036 Budapest, Hungary
3
Department of Biophysics and Radiation Biology, Semmelweis University, 1094 Budapest, Hungary
*
Authors to whom correspondence should be addressed.
Appl. Sci. 2020, 10(22), 7977; https://doi.org/10.3390/app10227977
Submission received: 28 September 2020 / Revised: 6 November 2020 / Accepted: 8 November 2020 / Published: 10 November 2020
(This article belongs to the Section Applied Biosciences and Bioengineering)

Abstract

:
Telemonitoring systems equipped with photoplethysmography-based contour analysis of the digital arterial volume pulse (DVP) can be optimal tools for remote monitoring of cardiovascular patients; however, the method is known to be sensitive to errors. We aimed to show that DVP analysis is a reliable method to track cardiovascular status. We used our proprietary SCN4ALL telemedicine system and analyzed nine parameters derived from the DVP and its second derivative (SDDVP). First, we assessed the repeatability of system measurements by detecting artificial signals. Then test–retest reliability of human measurements was evaluated in healthy individuals under standardized conditions. The SCN4ALL system analyzed each parameter with high accuracy (coefficients of variation (CVs) < 1%). Test–retest reliability of most parameters (stiffness index, reflection index, left ventricular ejection time index, b/a, heart rate) was satisfactory (CVs < 10%) in healthy individuals. However, aging index and d/a ratio derived from the SDDVP were more variable. Photoplethysmography-based pulse contour analysis is a reliable method to monitor cardiovascular status if measurements are performed with a system of high accuracy. Our results highlighted that SDDVP parameters can be interpreted with limitations due to (patho)physiological variations of the DVP. We recommend the evaluation of these parameters only in measurements where all inflections of SDDVP are detected reliably.

1. Introduction

Despite the enormous effort invested in research and development of new treatments to break the dominance of cardiovascular diseases in morbidity and mortality statistics, they are still among the leading causes of death [1,2]. A potential breakthrough could be achieved by launching extensive home surveillance programs that allow close follow-up of cardiovascular patients. The pandemic months of COVID-19 underline the need for reliable telemedicine surveillance tools to reduce the need for personal visits to outpatient clinics, thus reducing the chance of infection of the highest risk population.
Development of a cardiovascular telemonitoring system requires the incorporation of a cardiovascular measurement that is noninvasive, easy-to-use for the patient, convenient, timesaving, and not least provides clinically relevant information about the current cardiovascular status of the patient. The detection and analysis of digital arterial volume pulse (DVP) recorded by the photoplethysmographic (PPG) method is a perfect option as it fits all these requirements. In fact, the DVP tracks the changes of vessel diameter and blood volume in the arteries which occur due to arterial pulsation [3,4], and hence its shape is identical to the digital arterial pulse wave.
Mechanistically, the arterial pulse wave is a pressure wave that is initiated by cardiac ejection and runs through the arterial system. It is an invaluable source of information about the cardiovascular status of the patient, as its amplitude and contour are influenced by the dynamics of cardiac function, the elasticity of the arteries, and also by the pressure augmentation caused by the superimposing reflected pressure wave [5], which is highly affected by the tone of the resistance vessels. Moreover, all these factors are dependent on the current status of the autonomic nervous system. Not surprisingly, altered cardiovascular conditions (both physiological and pathological) cause well-defined characteristic changes in the shape and propagation velocity of the pulse wave [6,7,8,9,10,11]. Therefore, by detecting the changes in pulse wave contour, it is possible to establish the cardiovascular status of the patient.
Mathematical analysis of the pulse wave and DVP is well established in the literature [4,12,13,14]. Several cardiovascular indices, termed pulse contour parameters, derived from the raw curve and from its first and second derivatives have been identified as measures of various elements of cardiac and vascular function (Figure 1). Alterations of these indices have been associated with cardiovascular pathologies such as arterial stiffness, atherosclerosis, hypertension, aging, diabetes, coronary heart disease, and heart failure [12,13,14,15,16,17,18,19].
Undoubtedly, these scientifically well-established characteristics of PPG-based detection and analysis of DVP make this method an optimal tool for remote cardiovascular monitoring. Despite this, it has not gained ground in clinical practice so far. The reason behind this is that there are controversies about the applicability of this method in clinical diagnostics and the lack of large-population studies that could establish the guidelines for follow-up and those patient groups in which it would have the highest benefit.
One reason why the applicability of the method is debated that the parameters computed from DVP are sensitive to errors and cannot be detected reliably as they fluctuate from one measurement to another even if the cardiovascular status of the patient is stable [20,21,22,23]. However, this controversy is fostered in part by the fact that no data are available in the scientific literature about the reliability of the measurements. This issue is particularly emphasized in the case of those parameters which are derived from the second derivative of the DVP. The second derivative of the DVP (often referred to as acceleration plethysmogram) has several distinguished points from which valuable cardiovascular indices can be calculated (Figure 1). Among these, c and d points have been introduced as characteristics that may facilitate our understanding of the dynamics of wave reflection and the pulse wave analysis based evaluation of the severity of arterial aging [14,24,25,26,27,28]. However, the detection of these points has become a challenge for mathematical algorithms to identify [8,29,30].
This study was designed to address these controversies in order to show that the detection and computation of DVP contour parameters is a reliable method. We postulated that fluctuations in measured values most probably reflect real changes in cardiovascular functioning and are not caused by poor reliability of DVP analysis. To answer our specific questions, we used a PPG-based telemedicine system which has been developed with the participation of our research team (SCN4ALL ver.1.0, E-Med4All Europe Ltd., Budapest, Hungary) (Figure 2), and we analyzed nine pulse contour parameters, the medical significance of which has been proposed by various studies (Figure 1). Our specific questions addressed not only the reliability of DVP analysis in general, but also the measurement reliability of our system.
In this context, firstly we assessed the measurement error of our telemedicine system to rule out its relevant contribution to measurement variability in human tests.
As a next step, we aimed to test the reliability (test–retest variability) of PPG-based pulse contour analysis in human measurements. As a satellite question, we also aimed to clarify whether using different fingers for the measurement has an influence on the measurement of pulse contour indices.
Finally, using the results of the performed measurements, we evaluated the applicability of our proprietary algorithm to detect c and d points on the acceleration plethysmograph.

2. Materials and Methods

2.1. Subjects

Healthy, informed, consenting volunteers participated in the study. Volunteers who smoked, received any kind of medication, were pregnant, or had BMI > 30 were excluded. The study was approved by the Regional and Institutional Committee of Science and Research Ethics at Semmelweis University (approval number 120/2018).

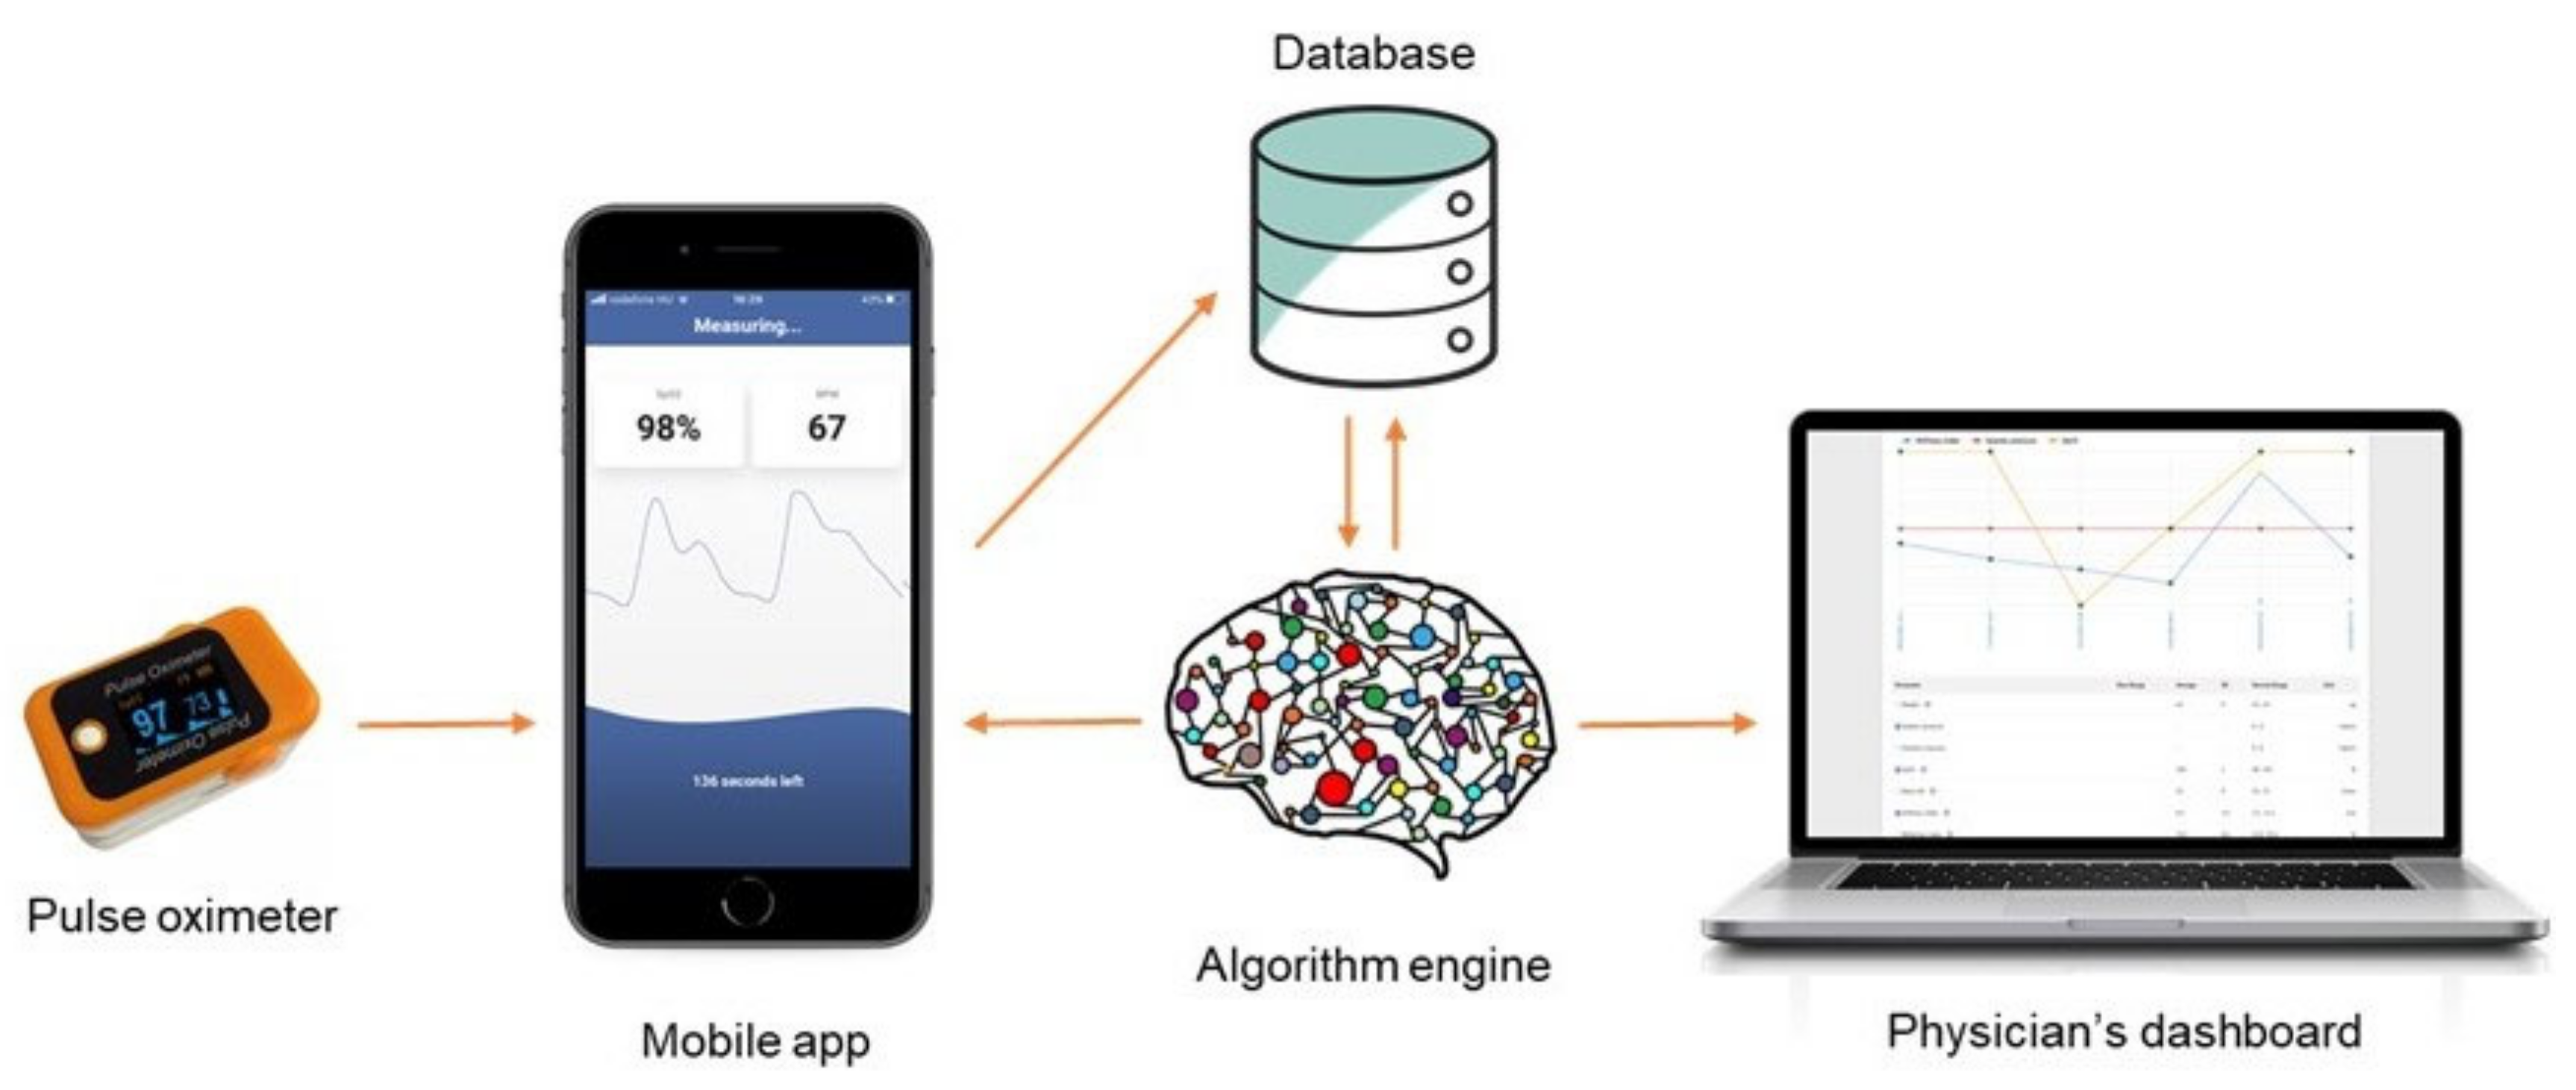
2.2. Measurements with the SCN4ALL System

In each investigational protocol, pulse wave detection and analysis were performed by the 1.0 version of the SCN4ALL telemedicine system (E-Med4All Europe Ltd., Budapest, Hungary). Pulse wave was recorded as DVP detected by a commercially available transmission pulse oximeter (Berry Pulse Oximeter, Shanghai Berry Electronic Tech Co., Ltd., Shanghai, China; hardware: 32-bit AD converter, 200 Hz sampling rate). The device emits light to the tissues of the finger from an LED light source and detects the transmitted light by a photodiode. Vessel diameter and blood volume in the arteries change with pulsation, and so does the amount of transmitted light, enabling the detection of a continuous DVP. The pulse oximeter device communicates via Bluetooth connection with a mobile application that initiates and terminates a 2-min-long data acquisition and transmits the recording to a cloud-based automated algorithm that was developed by our research group (Figure 2).
Signal preprocessing by the algorithm starts with upsampling the 200 Hz sampling frequency of the device to 1 kHz. In order to condition the PPG signal, a digital bandpass filter—fourth-order Butterworth—with −3 dB points at 0.1 and 10 Hz is applied. Then, the algorithm identifies the pulse cycles. Afterward, within each cycle, particular distinct points of the DVP (primary curve, first and second derivatives) are identified. Then, contour parameters are computed for every individual cycle. Afterward, the means of all cycles are calculated and displayed on an internet platform for the physician. In this study, these averages were exported as spreadsheets for further analysis. The measurement data are stored at a cloud-based server (Amazon Web Services, Amazon Web Services EMEA SARL, 1855 Luxembourg, Luxemburg) equipped with safe data protection that conforms to the applicable regulations ((EU) 2016/679).
The automatically calculated pulse contour parameters that this study focuses on are as follows: mean interbeat interval (IBI, ms), heart rate (HR, 1/min), stiffness index (calculated as the height of the subject over pulse transit time (PTT), m/s [4,6]), reflection index (the ratio of the amplitude of the diastolic peak to the amplitude of the systolic peak), left ventricular ejection time index (LVETI, ejection time (ET) normalized for heart rate using the formulae LVETI = 1.7 × heart rate + ET and LVETI = 1.6 × heart rate + ET in males and females, respectively [13]), b/a (parameter relating the amplitude of the second wave of the DVP second derivative to the first wave), d/a (ratio of the fourth and first inflection points of the second derivative of the DVP), aging index (a parameter derived from the amplitudes of inflections of the second derivative of the DVP as (b − c − d − e)/a [31]), and c–d point detection ratio (a value that specifies the percentage of those pulse cycles in the 2-min recording in which c and d points of the second derivative were successfully identified by the algorithm) (Figure 2).

2.3. Protocols

2.3.1. Measurement Reliability of the Telemedicine System

In order to exclude major effects of measurement error of our telemedicine system on the evaluation of human pulse contour readings, we explored the repeatability of measurements. To define measurement error by the SCN4ALL system (combined error of DVP recording, data processing, and analysis), we recorded artificial signals generated by a pulse simulator device (MS100 SpO2 Simulator, Contec Medical Systems Co., Ltd., Qinhuangdao, China). Besides the generation of high-quality, physiological simulated pulse signals (“normal”—SpO2: 98%, heart rate: 55/min), the simulator offers signals which model frequent signal variants, “Abnormal 1” (titled “geriatric” in the simulator’s software) (SpO2: 92%, heart rate: 95/min) and “Abnormal 2” titled “weak” in the software (SpO2: 90%, heart rate: 95/min) signal settings. The latter simulates a pulse wave in which the detectable signal is of low intensity (Figure 3). We performed five repeated measurements for each signal setting (Normal, Abnormal 1, Abnormal 2) with five different pulse oximeters of the same product release.

2.3.2. Reliability of Human Pulse Wave Measurements at Standard Conditions

The reliability of human DVP measurements was assessed by measuring test–retest variability by performing consecutive measurements on healthy individuals under standardized conditions, in which physiological fluctuations of cardiovascular functioning are supposed to be minimal. We performed 10 repeated 2-min-long measurements on 10 young healthy volunteers (M/F: 5/5, Age: 19–35, Mean ± SD: 25.3 ± 4.3) under standard conditions. The course of successive measurements took approximately 30 min. We defined ‘standard condition’ as the set of measurement conditions which we recommend our users to maintain when they perform their daily morning measurements during follow-up. The criteria for standard conditions are as follows: measurement takes place in a quiet room at room temperature; in the morning hours at least two hours after the last meal and coffee; and in a sitting, resting position, with hands held quietly on a table. Moreover, consumption of energy drinks and alcoholic beverages and intensive physical activity on the day of the measurement were avoided in this study. For these measurements, the pulse oximeter was placed on the left index finger.

2.3.3. Parallel Measurement on Four Fingers

To investigate whether a different anatomical disposition of the fingers affects the measured pulse contour parameters, we placed four pulse oximeters on four fingers (left and right indices and ring fingers) and made parallel 2-min measurements. We made two consecutive pulse recordings on 25 healthy individuals (M/F: 17/8; Age: 19–49, Mean ± SD: 29.4 ± 8.4), and took the average of the two measurements for each individual.

2.4. Data Analysis and Statistics

Cycles with irregular durations and unusual morphology were automatically excluded from the analysis by the algorithm (in each case <5% of all recorded cycles). Afterward, the means of values calculated for the individual pulse cycles of the 2-min-long recording were calculated for each parameter. For the present analysis, means were exported from the system in spreadsheets. These mean values were used for further characterizations. The descriptive statistics are presented as mean with its 95% confidence interval. To estimate variability between repeated measurements of the artificial signal (repeatability) and to characterize test–retest variability of repeated human measurements under standard conditions, we used coefficient of variation (CV = (SD/mean × 100) × (1 + 1/4 n) where n is the sample size) [32]. For repeatability measurements, we predefined the criterion of acceptance for CV as 2%, whereas this was defined as 10% for test–retest variability measurements. For the four-finger measurements, we calculated intraclass correlation coefficients (ICC) to show the correlation between fingers and assess the contribution of interpersonal variability to overall variability. The ICC calculation was based on a linear mixed-effects model. All statistical analyses were performed by using IBM SPSS Statistics for Windows, version 26 (Armonk, NY, USA: IBM Corp.).

3. Results

3.1. Measurement Reliability of the Telemedicine System

Before addressing our main goal, i.e., that of assessing the reliability of human DVP measurements in general, we determined the repeatability of measurements made by our telemedicine system. Measurement error was assessed by detecting stable artificial signals generated by a pulse oximeter simulator (Figure 3). The overall measurement error of the telemedical system may be produced by the data analyzing algorithm, the measurement error of a single pulse oximeter, or the variability due to using different pulse oximeter devices to detect the pulse signals. Firstly, in order to assess the combined contribution of the algorithm and the error of a single pulse oximeter to the overall measurement error, we detected the normal pulse signals of the simulator with a single, randomly chosen pulse oximeter and repeated it five times (Table 1; Normal condition, 1st column). The results showed that the measurement was stable: the confidence intervals (CIs) were very close to the mean of the five measurements, and the coefficient of variation was below 1% for each calculated variable.
Then, we randomly chose four other pulse oximeters of the same release, repeated the measurements as described above, and averaged the results of the 25 measurements. These showed that the output data had low variability as evidenced by narrow CIs and small (lower than 1%) CVs for each parameter (Table 1; Normal condition, 2nd column).
After proving that our system detects and analyzes normal pulse signals reliably, we repeated the measurements described above with signal presets of the simulator, which simulate abnormal conditions. For this purpose, we used the Abnormal 1 and the Abnormal 2 presets (Figure 3). The former preset of the simulator generates a signal with high heart rate (95/min). In this setting, the reliability of pulse detection and analysis was similar to that of the Normal condition except for the calculation of the aging index and d/a parameter, as the second derivative of this preset has no detectable c and d points (Table 1; Abnormal 1 condition).
The Abnormal 2 signal preset mimics a condition where the signal is of low intensity (a typical source of error in DVP detection). Similar to what we observed with the Abnormal 1 signals, the results of these measurements also showed stable detection and analysis for most parameters, except for the aging index and the d/a ratio—for the same reasons as in Abnormal 1 (Table 1; Abnormal 2 condition).

3.2. Reliability of Human Pulse Wave Measurements at Standard Conditions

In order to address our main goal of assessing the reliability of human pulse wave measurements in general, we evaluated the test–retest variability of pulse wave parameter analysis under standard conditions. For this purpose, resting measurements were repeated 10 times in 10 healthy individuals. After calculating the coefficient of variation for each individual, the CVs of the 10 subjects were averaged. The mean CVs for each parameter are presented in Table 2. These show that b/a, left ventricular ejection time index, mean interbeat interval, stiffness index, and mean heart rate are parameters that remain stable under standard measurement conditions (CVs lower than 10%). However, the aging index is slightly variable (CV: 13.6%), and d/a and c–d point detection ratio are highly variable even when measured under unchanged conditions.
In order to visualize how the detected test–retest (intrapersonal) variability relates to interpersonal variability, Figure 4 displays the mean of measurements obtained from the 10 subjects for each sequential measurement time point, with confidence intervals (CIs), along with the individual graphs of the subjects. The graphs show that for each parameter, individual curves appear similar and show no trend, only random fluctuations. The mean curves show no trends or extremes and have homogeneous confidence intervals. The variability of the individual curves among measurements and the variability between the individual curves look comparable.

3.3. Parallel Measurements on Four Fingers

Concomitant measurements on four different fingers were also performed in 25 individuals to test how slightly different anatomic disposition of the fingers affects the detected pulse wave parameters. The results are summarized in Table 3. The mean measurements of the four fingers are presented, showing no relevant difference between the fingers. Moreover, the intraclass correlation coefficients were over 99% for mean interbeat interval, mean heart rate, and left ventricular ejection time index, indicating that the effect of using different fingers for measurement is negligible. The intraclass correlation coefficients (ICCs) for stiffness index and c–d point detection ratio were about 90%, and they were over 80% for reflection index, b/a, d/a, and aging index. These confirm that the effect of using different fingers on variability is much less than that of the interindividual differences for these parameters (see Table 3 for exact values for the different parameters).

4. Discussion

Home monitoring of cardiovascular patients is a promising approach in patient care which is expected to gain ground in the upcoming decades and may constitute a relevant breakthrough in primary and secondary prevention of cardiovascular diseases. Implementation of noninvasive simple measurements, which give a deep insight into the momentary cardiovascular condition of the patient and thus allow extensive evaluation, and reliable fast data analysis are basic requirements for such telemedical systems. Incorporation of photoplethysmography-based analysis of the digital pulse wave in telemedical systems may be an optimal solution for cardiovascular telecare; however, its reliability is debated [21,33,34]. Our main purpose was to address the controversies related to the reliability of PPG-based cardiovascular evaluation. We showed that measurement and evaluation of most pulse contour parameters are reliable when analyzed with the SCN4ALL automated system, which is able to track stable signals with high repeatability. This was confirmed by low test–retest variability of repeated measurements performed under apparently constant cardiovascular conditions. Our study also showed that otherwise valuable pulse contour parameters derived from the second derivative of the DVP curve can only be evaluated with limitations. The detection of c and d deflections on this curve is prone to errors, which interferes with the reliable interpretation of the aging index and d/a parameter, which are indices of arterial stiffening and aging [14,24,25,26,27,28]. These limitations are related to typical alterations of pulse wave morphology rather than inaccuracies in analysis, as the automated algorithm used in this study was proven to detect c and d points reliably on normal stable curves. In conclusion, our study showed that PPG-based pulse wave analysis performed in this study operates reliably with acceptable measurement errors and is capable of monitoring subtle alterations in cardiovascular functioning.
Although the reliability of PPG-based pulse contour analysis is debated, no data are available on the repeatability of the systems which are used for analysis in research studies. However, as these systems are complex and comprise several sources of measurement errors, it is impossible to validly interpret biological data obtained by PPG-based systems if information concerning repeatability is not available. Therefore, we firstly checked the repeatability of the pulse contour measurements of our telemonitoring system. This was assessed by calculating the variability of the DVP parameters obtained from successive measurements of stable artificial pulse signals, which simulated healthy pulse waves and were generated by a pulse oximeter simulator device. Such variability can be caused by measurement errors of the pulse oximeter instrument and also by the automated algorithm analyzing the detected pulse wave. The combined effect of these two factors on measurement variability was investigated by testing the agreement among the results of five successive measurements performed by the same randomly chosen pulse oximeter device. The variation was smaller than the predefined 2% criterion of acceptance for each parameter (Table 1; Normal condition). Afterward, we extended the investigation to four additional instruments with which we performed the same measurements. We pooled the 5 × 5 measurements and calculated the overall CVs, which then reflected the combined variation caused by measurement error of a single pulse oximeter, analysis by the algorithm, and also the “interinstrumental” variability of several pulse oximeters of the same product. The CVs calculated in this way were also below the limit of acceptance (Table 1; Normal condition), showing that measurements are highly repeatable even if different pulse oximeters are used. Testing of pulse oximeter reliability was relevant in this setting because the applied devices had only been tested for the reliability of oxygen saturation and heart rate calculations by the manufacturers, but it was unknown whether they accurately track a continuous pulse wave for minutes.
After proving that our system reliably tracks stable signals, we addressed our main question of determining whether PPG-based monitoring and analysis of the DVP are reliable. We aimed to resolve the controversy in which it is often doubted that PPG-based methods can be used as diagnostic tools [21,33,34] because they are highly sensitive to errors, causing pulse contour parameters to fluctuate even if there is no alteration in cardiovascular functioning. However, we postulate that these alterations reflect real changes in cardiovascular condition. To show this, we measured test–retest variability under standardized measurement conditions. Measurements were performed in a quiet room at room temperature; in the morning hours, preferably at least two hours after the last meal and coffee; in a sitting, resting position, with hands held calm on a table. Speaking, moving, and mental activity were avoided during data collection [24,26,35,36]. Naturally, this standardization does not remove variability completely. However, the output contour parameters of our telemedical system showed minimal test–retest variability for most of the parameters, namely for b/a, left ventricular ejection time index, mean interbeat interval, stiffness index, and mean heart rate (CVs lower than 10%; Table 2). This indicates that these parameters are suitable for patient follow-up and may well support clinical decision, as the deviation of a measurement from the standard individual value most probably indicates real, physiological, or pathological alterations in cardiovascular function. Anyway, to enhance the precision of pulse contour analysis, we need to advise the users of PPG-based telemedical systems to perform their daily measurements preferably under standard conditions. This standardization does not require any particular cooperation from users; the recommendations are as simple as those for blood pressure measurement and are confined to those conditions which have been reported to influence pulse contour parameters [24,26,35,36].
In our study, we also provided preliminary data on the interpersonal variability of the studied contour parameters (Figure 4). Based on our observations, we can conclude that interpersonal and intrapersonal variabilities of the studied parameters are in the same range for healthy individuals when measurements are performed under standard conditions. This indicates that normal ranges can be identified for these parameters and that deviations from these ranges may reflect DVP—and hence cardiovascular—abnormalities both at individual (when compared to other results of the same patient) and at population levels (when data are compared to values of healthy individuals). However, larger studies should be conducted to define the normal reference ranges for the contour parameters computed by telemedicine systems and to determine which alterations can be considered clinically relevant. Indeed, reference ranges for these parameters are scant in the literature, and they have only limited validity for larger populations [6,14,25,27,28,37,38,39,40].
As a satellite question, we also tested in this study how different anatomical disposition of the fingers affects the results of pulse contour analysis. Without question, we recommend the use of the same finger for each measurement. However, for some reason, the occasional use of another finger may occur, which may limit the valid remote interpretation of the recordings. Therefore, we need to be aware of whether this error causes significant alterations in the output results. In healthy individuals, we could observe that there was no relevant difference in pulse contour parameters when measured in parallel on the index and ring fingers of the two hands (Table 3). The calculated ICCs showed that the effect of using different fingers on the variability of the outcomes is much less than the effect of interpersonal differences. Therefore, changing to different fingers does not constitute a relevant measurement error. However, we need to keep in mind that pathological alterations and diseases of the supplying arterial tree may have an impact on the blood flow of the digital arteries. For this reason, at the first patient visit, it is recommended to record pulse signals on several fingers on both sides and analyze whether there are differences in the output parameters.
Finally, we evaluated the reliability of our proprietary analysis engine to detect and analyze distinguished deflections of the second derivative PPG curve. Pulse wave analysis was originally extended to the second derivative of the DVP by Takazawa et al. [14]. They defined notable points of the curve which facilitate understanding of the pressure wave. Since then, several research groups have related the height of the b, c, and d waves to the a-wave to create measures that can index vascular pathologies (vascular aging, hypertension, arterial stiffness) and predict cardiovascular endpoints [14,28,41,42]. Among these points, c and d points are particularly valuable, as they are supposed to hold information about wave reflection [14], and the parameters derived from them provide information about arterial stiffening [14,35]. However, detection of c and d inflections has reportedly become a challenge for automated algorithms as their position and amplitude change along with pathophysiological alterations of the PPG [8,22,43]. In this study, we analyzed the success of c and d point identification by our algorithm and variability of parameters (namely d/a and aging index) derived from these points. When we tracked the stable, normal artificial signal of the pulse oximeter stimulator, the ratio of those cycles in which we could detect c and d points was 100% and the variability of the aging index and d/a was minimal (CVs below 1%) (Table 1; Normal condition). This shows that our engine reliably analyzes the second derivative curve. However, when we analyzed the abnormal signals offered by the pulse oximeter simulator, the success of c and d point detection became less reliable. We tested two different abnormal signal settings: Abnormal 1 setting generates a pulse signal of high heart rate and almost totally absent second derivative c–d points, whereas Abnormal 2 is a signal that simulates a weak pulse wave (e.g., similar to that observed in case of vasoconstriction due to cold). Second derivative c–d points are absent in this setting as well. With these settings, the calculation of other pulse contour parameters was still highly repeatable (CVs below 2%). However, c–d point detection ratio, the parameter which expresses the percent of those pulse cycles in which c and d points are recognized by the algorithm, fell below 5% for each setting (Table 1; Abnormal 1 and Abnormal 2 conditions). This increased the variability of all the parameters that are derived from c and d values, namely aging index and d/a.
When performing repeated human measurements, we also observed diminished reliability of c and d point analysis. Parameters derived from c and d points of the second derivative of the DVP became more variable (aging index, d/a) (Table 2). This concurs with the relatively high variations in c–d point detection ratio of consecutive measurements.
The optimum solution for this problem is to improve the automated algorithm in order to make the identification of second derivative c and d points more reliable. However, literature data suggest that this may have limitations (reviewed by M. Elgendi [22]). Although we recognize that attempts to make c–d point detection more precise are inevitable, we also propose the use of the c–d point detection ratio as a tool that aids clinical assessment of parameters derived from the second derivative. If the c–d point detection ratio reaches a certain value, we can reliably use parameters derived from the second derivative to support patient evaluation; however, when it is low, these parameters should be neglected. Determination of the minimum c–d point detection ratio that allows valid second derivative parameter interpretation requires further studies; however, based on our preliminary observations, it is around 30% (data not shown). Moreover, in the follow-up of a patient, a sudden or progressive change in c–d point detection may be evaluated as a warning for pulse wave abnormalities.

5. Conclusions

In this study, we characterized the reliability of using PPG-based pulse contour analysis to support clinical decision. For this purpose, we applied our self-developed SCN4ALL telemedical system and used a multidirectional approach to explore and characterize the possible measurement errors in depth in order to establish the reliability of this diagnostic tool. We showed that if we use a PPG-based telemedicine system, which is proven to track artificial signals with high repeatability, it can analyze most pulse contour parameters (e.g., stiffness index, reflection index, left ventricular ejection time index) with high precision in human measurements. This allows high-fidelity evaluation of these parameters and the detection of small cardiovascular alterations. However, correct evaluation of some parameters derived from the second derivative of the pulse wave (i.e., aging index, d/a) can be hindered by pathophysiological alterations or normal variants of the pulse wave which make c and d point identification difficult. To handle this limitation, we recommend the introduction of the c–d point detection ratio in pulse wave analysis and the consideration of second derivative parameters only if its value is acceptable. In summary, we can claim that PPG-based pulse wave analysis is a reliable measurement tool and meets the requirements set for cardiovascular telemonitoring devices. Clearly, further, large-population studies are warranted to establish the guidelines for its application in patient follow-up.

Author Contributions

Conceptualization, D.K., S.K., and Z.M.; methodology, F.A., D.K., and Z.M.; validation, S.K., and Z.M.; investigation, F.A., Z.M., D.K., and D.W.; resources, S.K.; data curation, D.S.V. and K.I.L.; writing—Original draft preparation, F.A., D.K., and Z.M.; writing—Review and editing, Z.M. and D.S.V.; visualization, F.A., K.I.L., and D.W.; supervision, Z.M.; project administration, F.A. and D.W.; funding acquisition, D.K. and S.K. All authors have read and agreed to the published version of the manuscript.

Funding

This research was funded by E-Med4All Europe Ltd.; Z.M. receives financial support from the Higher Education Institutional Excellence Program of the Ministry of Human Capacities in Hungary, within the framework of the Molecular Biology thematic program of the Semmelweis University, and D.S.V. receives financial support from the Thematic Excellence Programme (TKP) of the Ministry of Innovation and Technology of Hungary, within the framework of the BIOImaging Excellence programme at Semmelweis University.

Acknowledgments

The authors acknowledge the skilled contribution of László Szűcs, who provided and prepared the datasets for analysis. Authors express their special thanks for the great work of Balázs Szabó, who wrote the automated algorithm and leads the development of the software that is the core of the given telemedicine system.

Conflicts of Interest

D.K., F.A., K.I.L., S.K., and Z.M. are in financial terms with E-Med4All Europe Ltd. (D.K. and S.K. as co-owners, F.A. as employee, and K.I.L. and Z.M. as subcontractors). D.S.V. and D.W. did not receive compensation for their contribution by financial or any other means.

References

  1. GBD Causes of Death Collaborators. Global, regional, and national age-sex-specific mortality for 282 causes of death in 195 countries and territories, 1980–2017: A systematic analysis for the Global Burden of Disease Study 2017. Lancet 2018, 392, 1736–1788. [Google Scholar] [CrossRef] [Green Version]
  2. Yusuf, S.; Joseph, P.; Rangarajan, S.; Islam, S.; Mente, A.; Hystad, P.; Brauer, M.; Kutty, V.R.; Gupta, R.; Wielgosz, A.; et al. Modifiable risk factors, cardiovascular disease, and mortality in 155 722 individuals from 21 high-income, middle-income, and low-income countries (PURE): a prospective cohort study. Lancet 2020, 395, 795–808. [Google Scholar] [CrossRef] [Green Version]
  3. Ghamari, M. A review on wearable photoplethysmography sensors and their potential future applications in health care. Int. J. Biosens. Bioelectron. 2018, 4, 195–202. [Google Scholar] [CrossRef] [PubMed] [Green Version]
  4. Elgendi, M. On the Analysis of Fingertip Photoplethysmogram Signals. Curr. Cardiol. Rev. 2012, 8, 14–25. [Google Scholar] [CrossRef] [PubMed]
  5. O’Rourke, M.F.; Pauca, A.; Jiang, X.-J. Pulse wave analysis. Br. J. Clin. Pharmacol. 2001, 51, 507–522. [Google Scholar] [CrossRef]
  6. Millasseau, S.; Kelly, R.; Ritter, J.; Chowienczyk, P. Determination of age-related increases in large artery stiffness by digital pulse contour analysis. Clin. Sci. 2002, 103, 371–377. [Google Scholar] [CrossRef] [Green Version]
  7. Wesselink, R. Blood Pressure Waveform Analysis in Cardiogenic Shock & Acute Myocardial Infarction. Master’s Thesis, University of Twente, Enschede, The Netherlands, 2016. Available online: https://essay.utwente.nl/69815/2/Wesselink_MA_TNW.pdf (accessed on 10 November 2020).
  8. Pilt, K.; Meigas, K.; Ferenets, R.; Temitski, K.; Viigimaa, M. Photoplethysmographic signal waveform index for detection of increased arterial stiffness. PubMed. Physiol. Meas. 2014, 35, 2027–2036. [Google Scholar] [CrossRef] [Green Version]
  9. Smulyan, H.; Safar, M.E. Systolic Blood Pressure Revisited. J. Am. Coll. Cardiol. 1997, 29, 1407–1413. [Google Scholar] [CrossRef]
  10. Steppan, J.; Barodka, V.; Berkowitz, D.E.; Nyhan, D. Vascular Stiffness and Increased Pulse Pressure in the Aging Cardiovascular System. Cardiol. Res. Pr. 2011, 2011, 1–8. [Google Scholar] [CrossRef] [Green Version]
  11. Avolio, A.; Butlin, M.; Walsh, A. Arterial blood pressure measurement and pulse wave analysis—their role in enhancing cardiovascular assessment. PubMed. Physiol. Meas. 2010, 31. [Google Scholar] [CrossRef]
  12. Inoue, N.; Kawakami, H.; Yamamoto, H.; Ito, C.; Fujiwara, S.; Sasaki, H.; Kihara, Y. Second derivative of the finger photoplethysmogram and cardiovascular mortality in middle-aged and elderly Japanese women. Hypertens. Res. 2016, 40, 207–211. [Google Scholar] [CrossRef] [PubMed]
  13. Haiden, A.; Eber, B.; Weber, T. U-Shaped Relationship of Left Ventricular Ejection Time Index and All-Cause Mortality. Am. J. Hypertens. 2014, 27, 702–709. [Google Scholar] [CrossRef] [PubMed] [Green Version]
  14. Millasseau, S.C.; Guigui, F.G.; Kelly, R.P.; Prasad, K.; Cockcroft, J.R.; Ritter, J.M.; Chowienczyk, P.J. Noninvasive Assessment of the Digital Volume Pulse. Hypertension 2000, 36, 952–956. [Google Scholar] [CrossRef] [PubMed] [Green Version]
  15. Takazawa, K.; Tanaka, N.; Fujita, M.; Matsuoka, O.; Saiki, T.; Aikawa, M.; Tamura, S.; Ibukiyama, C. Assessment of Vasoactive Agents and Vascular Aging by the Second Derivative of Photoplethysmogram Waveform. Hypertension 1998, 32, 365–370. [Google Scholar] [CrossRef] [PubMed] [Green Version]
  16. Nirala, N.; Periyasamy, R.; Singh, B.K.; Kumar, A. Detection of type-2 diabetes using characteristics of toe photoplethysmogram by applying support vector machine. Biocybern. Biomed. Eng. 2019, 39, 38–51. [Google Scholar] [CrossRef]
  17. Paradkar, N.; Chowdhury, S.R. Coronary artery disease detection using photoplethysmography. In Proceedings of the 2017 39th Annual International Conference of the IEEE Engineering in Medicine and Biology Society (EMBC), Seogwipo, Korea, 11–15 July 2017; Volume 2017, pp. 100–103. [Google Scholar] [CrossRef]
  18. Huotari, M.; Vehkaoja, A.; Määttä, K.; Kostamovaara, J. Photoplethysmography and its detailed pulse waveform analysis for arterial stiffness. J. Struct. Mech. 2011, 44, 345–362. [Google Scholar]
  19. Weber, T.; Auer, J.; O’Rourke, M.F.; Kvas, E.; Laßnig, E.; Berent, R.; Eber, B. Arterial Stiffness, Wave Reflections, and the Risk of Coronary Artery Disease. Circulation 2004, 109, 184–189. [Google Scholar] [CrossRef] [Green Version]
  20. Korhonen, I.; Yli-Hankala, A. Photoplethysmography and nociception. Acta Anaesthesiol. Scand. 2009, 53, 975–985. [Google Scholar] [CrossRef]
  21. Von Wowern, E.; Östling, G.; Nilsson, P.M.; Olofsson, P. Digital Photoplethysmography for Assessment of Arterial Stiffness: Repeatability and Comparison with Applanation Tonometry. PLoS ONE 2015, 10, e0135659. [Google Scholar] [CrossRef] [Green Version]
  22. Elgendi, M. Detection of c, d, and e waves in the acceleration photoplethysmogram. Comput. Methods Programs Biomed. 2014, 117, 125–136. [Google Scholar] [CrossRef]
  23. Jago, J.R.; Murray, A. Repeatability of peripheral pulse measurements on ears, fingers and toes using photoelectric plethysmography. Clin. Phys. Physiol. Meas. 1988, 9, 319–329. [Google Scholar] [CrossRef] [PubMed]
  24. Bortolotto, L.A.; Blacher, J.; Kondo, T.; Takazawa, K.; Safar, M.E. Assessment of vascular aging and atherosclerosis in hypertensive subjects: second derivative of photoplethysmogram versus pulse wave velocity. Am. J. Hypertens. 2000, 13, 165–171. [Google Scholar] [CrossRef] [Green Version]
  25. Imanaga, I.; Hara, H.; Koyanagi, S.; Tanaka, K. Correlation between Wave Components of the Second Derivative of Plethysmogram and Arterial Distensibility. Jpn. Hear. J. 1998, 39, 775–784. [Google Scholar] [CrossRef] [PubMed] [Green Version]
  26. Hashimoto, J.; Chonan, K.; Aoki, Y.; Nishimura, T.; Ohkubo, T.; Hozawa, A.; Suzuki, M.; Matsubara, M.; Michimata, M.; Araki, T.; et al. Pulse wave velocity and the second derivative of the finger photoplethysmogram in treated hypertensive patients. J. Hypertens. 2002, 20, 2415–2422. [Google Scholar] [CrossRef] [PubMed]
  27. Otsuka, T.; Kawada, T.; Katsumata, M.; Ibuki, C. Utility of Second Derivative of the Finger Photoplethysmogram for the Estimation of the Risk of Coronary Heart Disease in the General Population. Circ. J. 2006, 70, 304–310. [Google Scholar] [CrossRef] [PubMed] [Green Version]
  28. Baek, H.J.; Kim, J.S.; Kim, Y.S.; Lee, H.B.; Park, K.S. Second Derivative of Photoplethysmography for Estimating Vascular Aging. In Proceedings of the 2007 6th International Special Topic Conference on Information Technology Applications in Biomedicine, Tokyo, Japan, 8–11 November 2007; Institute of Electrical and Electronics Engineers (IEEE): New York, NY, USA, 2007; pp. 70–72. [Google Scholar] [CrossRef]
  29. Pilt, K.; Ferenets, R.; Meigas, K.; Lindberg, L.-G.; Temitski, K.; Viigimaa, M. New Photoplethysmographic Signal Analysis Algorithm for Arterial Stiffness Estimation. Sci. World J. 2013, 2013, 1–9. [Google Scholar] [CrossRef] [PubMed]
  30. Segers, P.; Kips, J.; Trachet, B.; Swillens, A.; Vermeersch, S.; Mahieu, D.; Rietzschel, E.; De Buyzere, M.; Van Bortel, L. Limitations and pitfalls of non-invasive measurement of arterial pressure wave reflections and pulse wave velocity. Artery Res. 2009, 3, 79–88. [Google Scholar] [CrossRef]
  31. Takazawa, K. Second derivative of photoplethysmogram—Comment on Tanaka et al., page 43-48. Vasa 2015, 44, 3–4. [Google Scholar] [CrossRef]
  32. Sokal, R.R.; Rohlf, F.J. Biometry: The Principles and Practice of Statistics in Biological Research; Sokal, R.R., Rohlf, F.J., Eds.; W.H. Freeman: New York, NY, USA, 2012; Volume 937, ISBN 9780716786047. [Google Scholar]
  33. Lee, J.; Yang, S.; Lee, S.; Kim, H.C. Analysis of Pulse Arrival Time as an Indicator of Blood Pressure in a Large Surgical Biosignal Database: Recommendations for Developing Ubiquitous Blood Pressure Monitoring Methods. J. Clin. Med. 2019, 8, 1773. [Google Scholar] [CrossRef] [Green Version]
  34. Allen, J. Photoplethysmography and its application in clinical physiological measurement. PubMed. Physiol. Meas 2007, 28, R1–R39. [Google Scholar] [CrossRef] [Green Version]
  35. Otsuka, T.; Kawada, T.; Katsumata, M.; Ibuki, C.; Kusama, Y. Independent Determinants of Second Derivative of the Finger Photoplethysmogram among Various Cardiovascular Risk Factors in Middle-Aged Men. Hypertens. Res. 2007, 30, 1211–1218. [Google Scholar] [CrossRef] [PubMed] [Green Version]
  36. Inuma, J.; Murakoshi, M.; Kobayashi, T.; Io, H.; Kaneko, K.; Takahashi, T.; Hamada, C.; Horikoshi, S.; Tomino, Y. Relationship between acceleration plethysmography and aortic calcification index in chronic kidney disease patients. Hong Kong J. Nephrol. 2012, 14, 48–53. [Google Scholar] [CrossRef] [Green Version]
  37. Padilla, J.M.; Berjano, E.; Sáiz, J.; Rodriguez, R.; Fácila, L. Pulse Wave Velocity and Digital Volume Pulse as Indirect Estimators of Blood Pressure: Pilot Study on Healthy Volunteers. Cardiovasc. Eng. 2009, 9, 104–112. [Google Scholar] [CrossRef]
  38. Padilla, J.M.; Berjano, E.J.; Saiz, J.; Facila, L.; Diaz, P.; Merce, S. Assessment of relationships between blood pressure, pulse wave velocity and digital volume pulse. In Proceedings of the 2006 Computers in Cardiology, Valencia, Spain, 17–20 September 2006; IEEE Conference Publication: New York, NY, USA, 2006; pp. 893–896. [Google Scholar]
  39. Alty, S.R.; Angarita-Jaimes, N.; Millasseau, S.C.; Chowienczyk, P.J. Predicting Arterial Stiffness from the Digital Volume Pulse Waveform. IEEE Trans. Biomed. Eng. 2007, 54, 2268–2275. [Google Scholar] [CrossRef] [PubMed]
  40. Aiba, Y.; Ohshiba, S.; Horiguchi, S.; Morioka, I.; Miyashita, K.; Kiyota, I.; Endo, G.; Takada, H.; Iwata, H. Peripheral Hemodynamics Evaluated by Acceleration Plethysmography in Workers Exposed to Lead. Ind. Health 1999, 37, 3–8. [Google Scholar] [CrossRef] [PubMed]
  41. Kohjitani, A.; Miyata, M.; Iwase, Y.; Sugiyama, K. Responses of the second derivative of the finger photoplethysmogram indices and hemodynamic parameters to anesthesia induction. Hypertens. Res. 2011, 35, 166–172. [Google Scholar] [CrossRef] [Green Version]
  42. Millasseau, S.C.; Ritter, J.M.; Takazawa, K.; Chowienczyk, P.J. Contour analysis of the photoplethysmographic pulse measured at the finger. J. Hypertens. 2006, 24, 1449–1456. [Google Scholar] [CrossRef]
  43. Elgendi, M.; Norton, I.; Brearley, M.; Abbott, D.; Schuurmans, D. Detection of a and b waves in the acceleration photoplethysmogram. Biomed. Eng. Online 2014, 13, 139. [Google Scholar] [CrossRef] [Green Version]
Figure 1. Pulse contour parameters calculated by the SCN4ALL system. Representative pulse wave recording (panel A), and its first (panel B) and second derivative curves (panel C). ET represents ejection time measured as the duration between the foot of the pulse wave and the dicrotic notch. ET was normalized for heart rate to calculate left ventricular ejection time index (LVETI) using the formulae LVETI = 1.7 × heart rate + ET and LVETI = 1.6 × heart rate + ET in males and females, respectively. Pulse transit time (PTT) is the duration measured between the systolic and diastolic peaks of the curve. PTT was used to calculate stiffness index as the height of the subject over PT. IBI represents interbeat interval, which is the pulse duration measured from peak to peak. Here, x and y are amplitudes of the systolic and diastolic peaks, respectively, and are used for calculation of the reflection index as x/y. Points a–e represent notable inflection points of the second derivative curve. Second derivative inflection points were used to calculate b/a, d/a, aging index (calculated as (b − c − d − e)/a), and c–d point detection ratio (the percentage of pulse cycles in the 2-min recording in which c and d points were successfully identified by the algorithm).
Applsci 10 07977 g001
Figure 2. Outline of the SCN4ALL telemedicine system. Peripheral arterial pulse wave is detected by a transmission pulse oximeter. The device (Berry Pulse Oximeter, Shanghai Berry Electronic Tech Co., Ltd., Shanghai, China) communicates via Bluetooth connection with a mobile application (SCN4ALL) which initiates and terminates the 2-min-long data acquisition and transmits the recording to a cloud database. A cloud-based automated algorithm calculates the pulse contour variables which are then reported to the dashboard of the physician and, in brief form, to the mobile application of the user.
Applsci 10 07977 g002
Figure 3. Representative recordings obtained on a healthy individual and the pulse oximeter stimulator. (Panel A) shows representative recording of one of our healthy subjects. (Panel B) shows recording of an artificial pulse wave generated by the Normal setting of the pulse oximeter simulator. Recordings of (panels C and D) demonstrate pulse waves generated by the Abnormal 1 and Abnormal 2 signal settings of the pulse oximeter simulator device. Both are high heart rate signals (95/min) and are characterized by disappearance of c and d inflections of the second derivative curve. Abnormal 2 setting was a low-intensity signal but was still recorded accurately with the SCN4ALL system. In each panel, the upper graph shows the recorded digital volume pulse (DVP), whereas the middle and lower panels show the first and second derivatives of the DVP, respectively. AU: arbitrary units.
Applsci 10 07977 g003
Figure 4. Graphs demonstrating the relationship between interpersonal variability and intrapersonal variations of the computed pulse contour parameters. Measurements were performed on 10 healthy volunteers 10 times repeatedly under standardized conditions. Means (±confidence intervals) are presented (red solid line) for each consecutive measurement along with individual measurement data (black lines). Individual lines are similar to each other and to the average line. The variability of the individual curves among measurements and the variability between the individual curves seem to fall in the same order of magnitude.
Applsci 10 07977 g004
Table 1. Results of repeatability measurements. Means (and confidence intervals (CIs)) and coefficients of variation (CVs) of pulse contour variables measured by the SCN4ALL telemedicine system. In order to evaluate the repeatability of the measurements by the system, we detected and analyzed artificial pulse signals generated by a pulse oximeter simulator device. Three different signal settings of the simulator were selected (Normal, Abnormal 1, and Abnormal 2). For each setting, measurements were repeated 5 times with a single randomly chosen pulse oximeter (n = 5 columns), and then these measurements were supplemented with the repeated measurements from 4 other pulse oximeters of the same release (n = 25 columns, showing the results of 5 × 5 measurements).
NormalAbnormal 1Abnormal 2
n = 5n = 25n = 5n = 25n = 5n = 25
VariablesMean [CI]CV (%)Mean [CI]CV (%)Mean [CI]CV (%)Mean [CI]CV (%)Mean [CI]CV (%)Mean [CI]CV (%)
Aging index−1.13 [−1.14; −1.12]0.41−1.14 [−1.14; −1.13]0.57−3.37 [−4.45; −2.29]27.1−3.12 [−3.46; −2.79]26.1−3.71 [−4.60; −2.81]20.4−3.84 [−4; −3.69]9.9
b/a−1.78 [−1.79; −1.78]0.26−1.79 [−1.79; −1.78]0.32−1.59 [−1.59; −1.59]0.29−1.59 [−1.60; −1.59]0.32−1.60 [−1.60; −1.59]0.36−1.60 [−1.59; −1.56]0.33
c-d point detection ratio (%)100 [100; 100]0100 [100; 100]00.60 [0.08; 1.28]95.90.44 [0.23; 0.65]1162 [0.48; 3.52]64.32.70 [2.25; 3.19]42.2
d/a−0.75 [−0.75; −0.74]0.77−0.75 [−0.75; −0.75]0.37−0.48 [−1.01; −0.06]95.9−0.35 [0.18–0.52]116−0.64 [−1.09; −0.20]58.7−0.71 [−0.79; −0.63]26.9
Left ventricular ejection time index (ms)552 [552; 554]0.22553 [552; 553]0.27462 [461; 462]0.06462 [462; 462]0.05462 [462; 463]0.06462 [462; 463]0.07
Heart rate (1/min)55 [55; 55]055 [55; 55]095 [95; 95]095 [95; 95]095 [95; 95]095 [95; 95]0
Interbeat interval (ms)1089 [1089; 1089]01089 [1088; 1090]0.21631 [631; 631]0631 [631; 631]0.19630 [630; 631]0.07631 [631; 632]0.18
Reflection index (%)35.5 [35.5; 35.6]0.1335.5 [35.5; 35.6]0.1132.7 [32.7; 32.8]0.1232.7 [32.7; 32.8]0.1332.8 [32.6; 32.9]0.3532.8 [32.7; 32.8]0.42
Stiffness index (m/s)4.62 [4.62; 4.63]0.104.62 [4.62; 4.63]0.267.34 [7.34; 7.34]07.34 [7.33; 7.34]0.187.34 [7.33; 7.36]0.167.34 [7.33; 7.35]0.34
Table 2. Results of test–retest variability measurements. Test–retest variability of pulse contour parameters measured by the SCN4ALL telemedicine system. Measurements were performed on 10 healthy volunteers 10 times repeatedly under standardized conditions. Coefficient of variation (CV) for the results of the consecutive measurements was calculated for each individual. Afterwards individual CVs were averaged; they are presented in the table along with bracketed confidence intervals (CI).
Pulse Contour VariablesCV % [CI]
Aging index13.6 [4.78; 22.5]
b/a3.84 [2.13; 5.55]
c–d point detection ratio (%)33.6 [17.1; 50.1]
d/a83.9 [9.5; 177]
Left ventricular ejection time (ms)1.30 [0.75; 1.84]
Heart rate (1/min)3.19 [1.99; 4.39]
Interbeat interval (ms)3.23 [2.11; 4.35]
Reflection index (%)7.43 [2.79; 12.1]
Stiffness index (m/s)4.34 [2.20; 6.48]
Table 3. Results of measurements performed in parallel on 4 separate fingers on 25 healthy individuals. For each individual, 2 consecutive 4-finger measurements were taken, and the average of the 2 was used for further calculations. The results of the 25 subjects were averaged for each finger separately and are presented in the table with bracketed confidence intervals (CIs). Intraclass coefficients (ICC) were calculated to assess the correlation of results within the same individuals.
Left Index FingerLeft Ring FingerRight Index FingerRight Ring FingerICC
Pulse contour
variables
n = 25n = 25n = 25n = 25
Mean [CI]Mean [CI]Mean [CI]Mean [CI]
Aging index−1.29 [−1.46; −1.13]−1.30 [−1.47; −1.13]−1.34 [−1.15; −1.12]−1.47 [−1.17; −1.25]0.81
b/a−1.21 [−1.26; −1.152]−1.22 [−1.29; −1.16]−1.25 [−1.312; −1.20]−1.24 [−1.30; −1.17]0.83
c–d point detection ratio (%)33.8 [25.3; 42.4]31.3 [23.1; 39.5]31.9 [22.9; 40.8]32.3 [23.9; 40.78]0.90
d/a−0.15 [−0.24; −0.06]−0.16 [−0.26; −0.07]−0.17 [−0.29; −0.06]−0.10 [−0.21; −0.01]0.82
Left ventricular
ejection time index (ms)
148 [56; 240]148 [57; 240]147 [56; 238]147 [56; 237]>0.99
Heart rate (1/min)70.6 [67.1; 74.2]71.0 [67.5; 74.2]70.9 [67.4; 74.4]71.0 [67.4; 74.5]>0.99
Interbeat interval (ms)862 [817; 906]862 [818; 908]862 [816; 907]861 [817; 907]>0.99
Reflection index (%)62.2 [59.2; 65.1]60.8 [57; 64.6]61.5 [58.4; 64.5]61.3 [57.6; 65.0]0.81
Stiffness index (ms)7.74 [7.37; 8.10]7.71 [7.32; 8.10]7.58 [7.20; 7.97]7.59 [7.13; 8.05]0.90
Publisher’s Note: MDPI stays neutral with regard to jurisdictional claims in published maps and institutional affiliations.

