Article

Improvement and In-Situ Application of an Evaluation Method of Ballasted-Track Condition Using Digital 2-D Image Analysis

1
Track & Roadbed Research Team, Korea Railroad Research Institute (KRRI), Cheoldobangmulgwan-ro 176, Uiwang-si, Gyeonggi-do 16105, Korea
2
Railroad Structure Research Team, Korea Railroad Research Institute (KRRI), Cheoldobangmulgwan-ro 176, Uiwang-si, Gyeonggi-do 16105, Korea
*
Author to whom correspondence should be addressed.
Appl. Sci. 2020, 10(21), 7946; https://doi.org/10.3390/app10217946
Submission received: 23 October 2020 / Revised: 6 November 2020 / Accepted: 6 November 2020 / Published: 9 November 2020
(This article belongs to the Special Issue Monitoring and Maintenance Systems for Railway Infrastructure)

Abstract

:
The advancement in digital image analysis methods has led to the development of various techniques, i.e., quantification of ballast gravel abrasion. In this study, the recognition rate of gravel aggregates has been significantly increased by improving the image analysis methods. The correlation between the track quality index (TQI), which is the standard deviation of vertical track irregularity and represents the condition of a high-speed railway, and the number of maintenance works was analyzed by performing an image analysis on the samples collected from various locations of a high-speed railway. The results revealed that roundness has the highest correlation with the TQI, whereas sphericity has the highest correlation with the number of maintenance works. The ballast replacement would be performed to improve maintenance efficiency if the abrasion of the ballast aggregates becomes approximately 10%.

1. Introduction

Ballasted tracks are commonly used because their initial construction cost is low and ground settlement can be managed flexibly; however, settlement may occur owing to continuous train load, which may cause differential settlement. Maintenance work, such as tamping, should be performed regularly to prevent such phenomena. However, repeated maintenance works can result in the deterioration of ballast [1]. When maintenance work is performed for a section with differential settlement, the severity of differential settlement is reduced while increasing the abrasion loss of the ballast aggregates, thereby ultimately reducing the ballast resistance against settlement [2,3,4]. Afterwards, differential settlement occurs again when a train load is applied, and performing maintenance work to reduce the differential settlement will further increase the abrasion loss of gravels. As this phenomenon is repeated, the abrasion loss of gravels increases, and the period for maintenance works shortens; hence, ballast cleaning, i.e., ballast renewal will be required.
A kind of ballast aggregates in Korea is rhyolitic tuff. In Korea railroad corporation standards [5], there are some requirements for ballast properties. Fresh ballast size is between 22.4~63 mm and abrasion loss is under 25%. The railroad maintenance guidelines of the Korea National Railway [6] define the following four criteria to perform ballast cleaning: when the soil contents in the ballast for a normal railroad is 25% or greater; when the ballast layer has 20% or higher of fine materials passing 22.4 mm sieve; when high fouling level and poor drainage; and when ballast layer has poor resistance against settlement due to abrasion. Among these criteria, the objective criterion for high-speed railways without considering the subjective opinions of workers is the second one; fine materials passing. For railways in operation, regular maintenance works can be performed at night only when trains are not operating. Owing to such a time constraint and difficulties with sampling ballast gravels, observing the condition of ballast gravels based on this criterion has limitations. Therefore, studies have been conducted with regard to measuring the abrasion of gravels based on image analysis methods.
An aggregate imaging system involves the analysis of images using black and white images which are taken with back-lighting, and gray images which are taken with top-lighting [7,8]. The University of Illinois Aggregate Image Analyzer used three cameras to capture the front, top, and side views to reconstruct the 3-D shape of aggregates [9,10]. Kim et al. deduced a correlation between the abrasion loss of gravels and the shape index by performing 2-D digital image analysis and applied the correlation at fields to prove the relationship among the abrasion loss, shape index, and maintenance work [11].
Furthermore, image analysis based on a 3-D image has been studied. Kim et al. proposed wavelet-based 3-D particle descriptors to characterize stone aggregate morphology using a 3-D laser scanner [12]. Tolppanen analyzed aggregates image with a 3-D laser scanning technique and analysis method based on the fast Fourier and power spectrum analyses [13]. Garboczi acquired 3-D particle images through X-ray tomography to characterize concrete aggregate [14]. Ouhbi et al. used point clouds from 3-D digitization of the particle to characterize the shape of ballast [15].
Relying on only 2-D images to analyze the characteristics of gravels used can be rather inaccurate, because the characteristics of gravels may vary significantly depending on the axis from which the images are taken [16]. However, 3-D image analysis appears inappropriate for application to actual practice as special equipment, such as an X-ray or a 3-D laser scanner, for taking 3-D images and relatively more time than 2-D image analysis are required.
In this study, we improve the image analysis method developed by Kim et al. [11] to increase the recognition rate of gravel aggregates. Moreover, the field applicability of the image analysis method is verified by comparing the results of applying the image analysis method to different fields, and a guideline for evaluating the status of ballasted tracks is proposed.

2. Image Analysis Method

2.1. Summary of Previous Research

Previous studies hypothesized the following.
(1)
All gravels used for high-speed railways are provided by the same supplier.
(2)
Mud pumping in the roadbed rarely occurs owing to reinforced roadbeds in the lower part of high-speed railways.
If the relationships between the abrasion loss and shape index can be deduced for the same gravels as those used for high-speed railways under the aforementioned assumptions, the abrasion loss of gravels at actual high-speed railways can be traced back using the shape index based on such relation.
The L.A. abrasion test [17,18] was conducted to measure the abrasion loss of gravels. The L.A. abrasion loss is defined as follow
Abrasion   loss   % = m 1 m 2 m 1 × 100
where m1 is the total mass of the gravels before L.A. abrasion test and m2 is the mass of the gravels larger than 1.7 mm after L.A. abrasion test.
The abrasion loss was measured according to the number of revolutions in the L.A. abrasion test, and the shape indices of gravels were calculated using the image analysis method. Roundness, sphericity, aspect ratio, and angularity were employed for the shape indices of gravels. The same shape index may be calculated differently depending on the researcher [19,20]. In the present study, the shape indices were calculated as follows:
(1)
Roundness was the ratio of the area of a circle, with the major axis of the gravel as the diameter, to the aggregate area, and is calculated using the equation proposed by Ferreira et al. [21].
Roundness = A π L m a j o r 2 / 4
where A is the area of a gravel aggregate, and Lmajor is the major axis length of the gravel. A small roundness indicates that particle is angular, while a large roundness indicates that particle is circular.
(2)
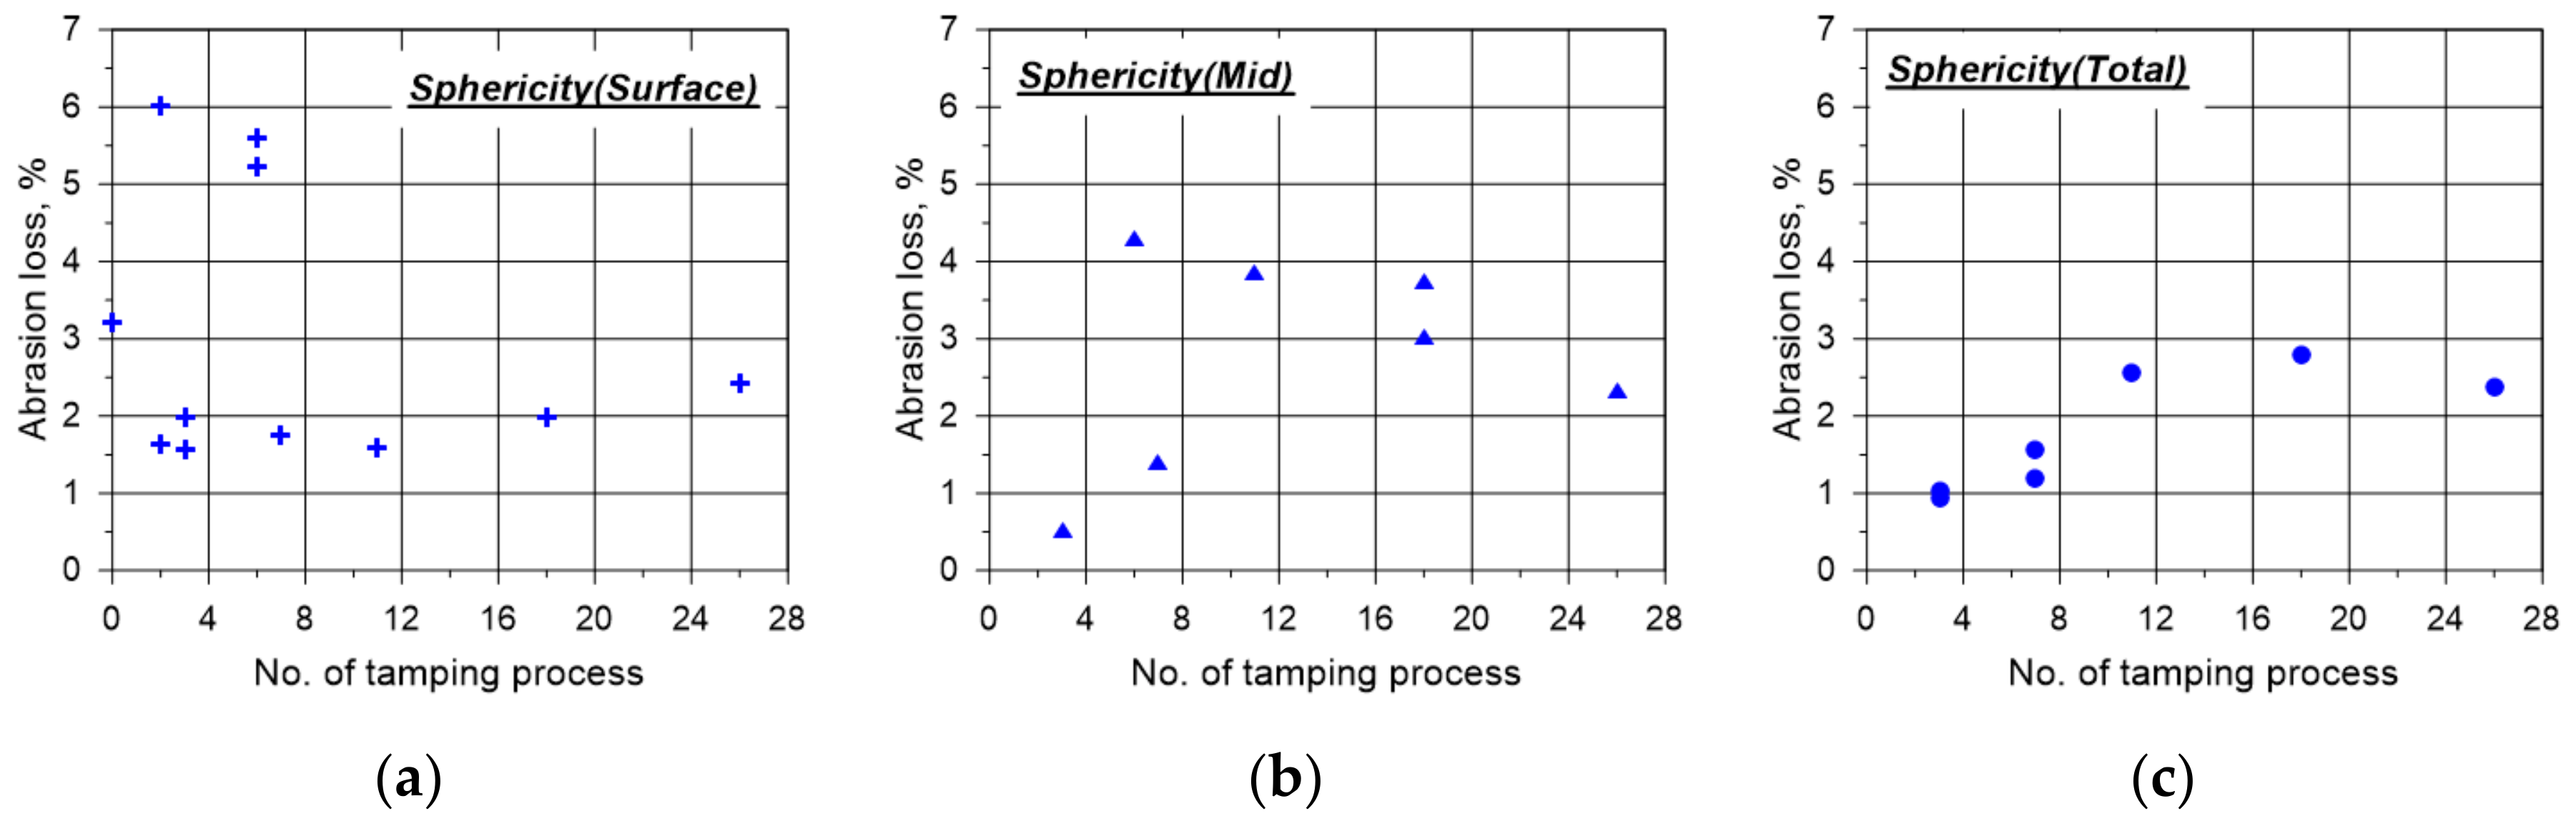
Sphericity was the ratio of the circumference of a circle, with the same area as the gravel aggregate, to the circumference of the gravel particle, and is calculated using the equation proposed by Altuhafi et al. [22].
Sphericity = L e L a
where Le is circumference of a circle that has the same area as the gravel aggregate, and b is the circumference of the gravel particle. A small sphericity indicates that surface of particle is coarse, while a large sphericity indicates that surface of particle is smooth.
(3)
Aspect ratio was calculated as the ratio of the major axis to the minor axis of the gravel; thus, its value is always greater than 1.0, unlike other shape indices.
(4)
Angularity was calculated as proposed by Wang et al. [23], in which the shape of gravel aggregates is represented using Fourier coefficients and then calculated as the sum of the squares of the coefficients of high-frequency bands.
The relationships between abrasion loss according to the number of revolutions in the L.A. abrasion test and shape indices calculated using an image analysis method were derived as shown in Figure 1. The correlation among the abrasion loss, shape indices, and maintenance work was proved by applying these relationships to actual practice.
As shown in Figure 2, the characteristics of gravel particles can be divided into three categories according to the scale [24]. Morphology (large scale) is an index that represents the overall shape of gravel particles; the roundness and aspect ratios used in this study, which demonstrate the closeness of gravel particles to a circle, are the shape indices belonging to this type. Roundness texture (intermediate scale) is an index that represents how angled the particle surface is, and sphericity belongs to this type. Surface texture (small scale) is an index that represents the detailed shape of the particle surface, and angularity belongs to this type. Table 1 presents the shape indices in this research according to scale. The term ‘Roundness’ in this research is different from ‘Roundness texture’ in intermediate scale shape characterization.

2.2. Improvement of Image Analysis Method

The most important step in image analysis method is to separate ballasts and background precisely. To improve separation ability by previous method, specific algorithm using HSV (Hue, Saturation, Value) color model with chromatic color background were applied.

2.2.1. Change in Background Color

The background color for taking the images of gravels was changed from black to blue. Considering that the color of gravels is mostly achromatic, such as black or gray, using a chromatic color background, such as blue, makes it easy to distinguish gravel aggregates from the background.

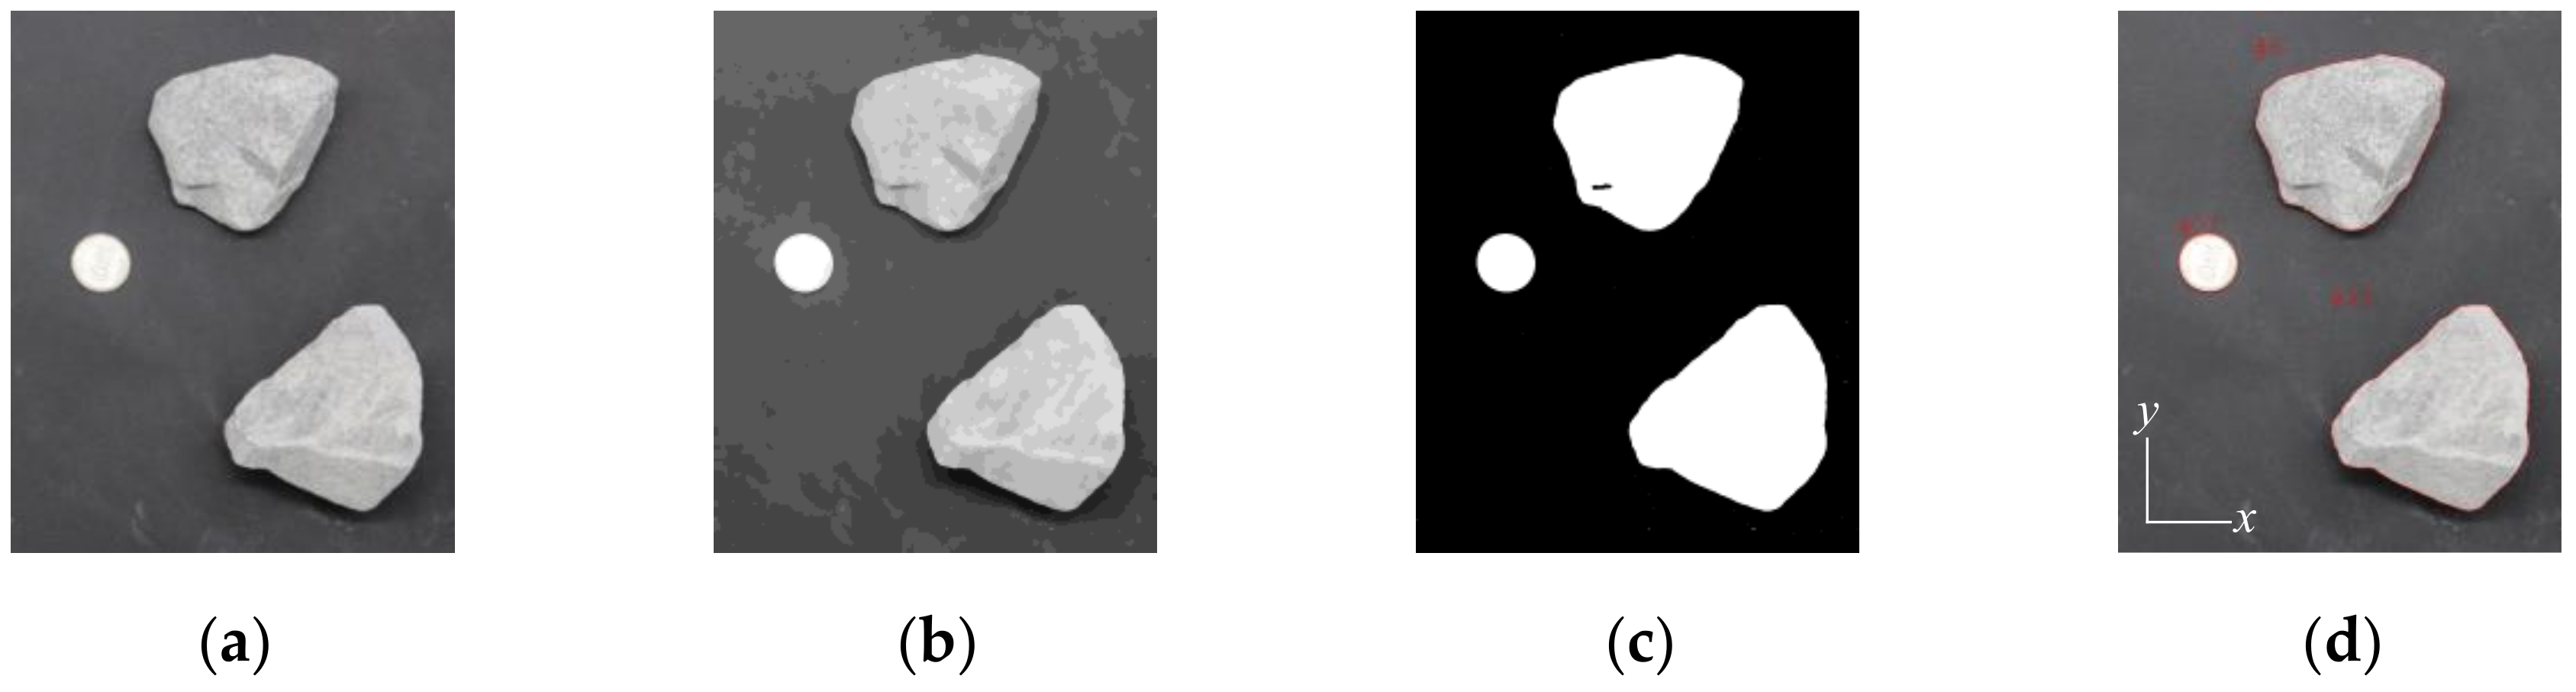
2.2.2. Change in the Aggregate Segmentation Procedure Algorithm

The algorithm for aggregate segmentation was also improved, in addition to the change in the background color for capturing the images of gravels. Figure 3 shows the previous algorithm for distinguishing aggregates from the background in order [11]. First, the image of the aggregates is captured with a digital camera (Figure 3a). Noise is removed by applying pyramid mean shift filtering to the original image (Figure 3b). The image is then converted to gray-scale, and the threshold is applied to obtain a black and white image of gravels (Figure 3c). Lastly, the watershed algorithm [25] is applied to detect the coordinates of the gravel image (Figure 3d).
The aggregate segmentation procedure of the improved algorithm is shown in Figure 4. The HSV color model is used in the improved algorithm. The RGB image of the aggregates is converted to an HSV image. An appropriate threshold value is set for the S-channel (Saturation) in the converted color model to obtain a binary image of gravel aggregates, and then the boundaries of each gravel aggregate are obtained.

2.2.3. Result of the Improved Aggregate Segmentation

The improved image analysis method was tested on ballast aggregates collected from Gyeongbu high-speed railways in South Korea. Table 2 presents the results of aggregate segmentation and Figure 5 shows the segmented aggregates using image analysis when the previous method and the improved method are applied. As shown in the Table 2, the previous method exhibited varying percentages of aggregate segmentation depending on the image shooting condition. The maximum percentage of aggregate segmentation was 100% for a favorable image shooting condition, but the percentage dropped to 51% for a poor image shooting condition. However, the improved method exhibited 100% aggregate segmentation for all images regardless of the image shooting condition.

2.2.4. Development of Image Analysis Software

An image analysis software that operates on Windows was developed. The programming language was Microsoft Visual Studio.Net 2017 and OpenCV 3.4.6 library was used for image analysis. Figure 6 shows the screen windows of an image analysis software and analysis result report. The program can be executed by importing the image of aggregates, and the aggregates can be distinguished from the background with the simple click. Images that have either a colored background or a black ground can be analyzed with this program. Furthermore, each aggregate distinguished from the background is numbered automatically, and the shape index of each aggregate is calculated to export the results as a.csv file. The analysis results can be printed on a screen.

3. Field Test

3.1. Field Test Overview

To verify the field applicability of the improved image analysis method, the samples were collected from the Gyeongbu high-speed railway and then the abrasion loss was estimated for each location. Table 3 shows the summary of the locations from which the samples were collected. Excavation was performed manually and aggregates at surface, mid depth, and bottom were collected for reviewing the applicability of the image analysis according to depth.

3.2. Image Analysis Results

3.2.1. Applicability of Shape Indices

The image analysis was performed for the samples collected from each location to calculate the average value of the four shape indices. Moreover, the abrasion of aggregates was estimated per location using the relationship between the shape index and abrasion derived in the previous study [11]. The estimated abrasion, the track quality index (TQI) of each sampling location, and the number of maintenance works were compared. TQI, i.e., standard deviation of track irregularity of a specific section, is an index representing the overall track condition of a certain length of track. In Korea, track irregularity is inspected once a month using a track inspection vehicle such as Roger-1000k. However, because the sampling and inspection dates do not always tally exactly, the track irregularity data on the date closest to the sampling date was used for calculating the TQI. The number of maintenance works is counted by the number of machine tamping performed at each location from April 2004, when the high-speed railway was first opened, to July 2018. If ballast replacement work was performed at the respective location at a specific period, only the number of machine tamping performed from that point until July 2018 was counted.
Figure 7 and Figure 8 show relationships abrasion loss based on shape indices versus TQI and maintenance history, i.e., number of tamping process. The results showed that roundness is highly correlated with TQI (Figure 7a), while sphericity has a high correlation with the number of maintenance works (Figure 8b). Moreover, aspect ratio and angularity did not have a significant correlation with any variables. These phenomena were caused by shape characterization of shape indices and limitation of datasets.
Roundness, which shows if the overall shape of aggregate is angular or circular, has good correlation with TQI (Figure 7a). When most particles are angular (small average of roundness), settlement may occur less because large voids between particles could be formed depending on the particle arrangement. On the other hand, when most particles are circular (large average of roundness), settlement may occur more because voids between particles would be small [26]. Therefore, the correlation between roundness representing the particle shape and TQI was high in the result.
Sphericity, which shows the surface condition of aggregate, has good correlation with number of tamping (Figure 8b). Tamping results in aggregates abrasion, which means surface of aggregate become smoother. Hence, the correlation between sphericity and the number of tamping was also high in the result. Santamarina et al. [26] also concluded that sphericity and friction angle are inversely proportional. As sphericity increases, which mean surface of particle become smoother, the friction angle is decreased.
Aspect ratio belongs to the large scale, but it is a ratio of the major axis to the minor axis of gravel particles, which may be inadequate to represent the overall shape. Thus, its correlation with TQI or maintenance work also is relatively low.
Angularity is an index representing the detailed features of the particle surface, and thus, it is significantly affected by the precision and resolution of the experiment. However, the image analysis method employed in this study was not conducted with the high precision and resolution; therefore, the accuracy of angularity was measured to be lower than that for the other shape indices. This can be verified through the coefficient of variation of each shape index. In Figure 9, the coefficient of variation shows the relative distribution in which the standard deviation is divided by average. The coefficient of variation of angularity is 35–50%, which is larger than that of the other shape indices. This implies that estimating the exact abrasion loss of the respective section using angularity is difficult, which is resulted in a low correlation with the TQI or maintenance work.
The limitation of datasets means that some shape indices have relatively large error range. The 95% confidence interval for the population mean is expressed as follow
95 %   Confidence   Intervals = μ ± 1.96 × σ n
where, μ is a sample mean, σ is a standard deviation of samples, and n is the number of aggregates. If coefficient of variation of aggregates is small or the number of aggregates is big, error range could be minimized. As can be seen in Figure 9, the coefficient of variation is approximately 5% for sphericity, 15–20% for roundness and aspect ratio and 35–50% for angularity. In case of sphericity, error range for the population mean are ±2% when the number of aggregates is 20. However, when the number of aggregates for roundness, aspect ratio and angularity is 140, 140 and 990 respectively, error range for the population mean are ±2%. In this research, the number of aggregates were 50–100 except two sampling points. This made large error range for population mean for aspect ratio and angularity and there would not be very clear trend. For roundness, sample mean is relatively small in comparison with aspect ratio so error range is also relatively small.

3.2.2. Image Analysis Results According to the Sampling Depth

Abrasion according to sampling depth was investigated comparing with the TQI and the number of maintenance works at each sampling location. As described in Section 3.2.1, roundness exhibited a high correlation with TQI and sphericity did so with the number of maintenance works; thus, roundness was compared with the TQI and sphericity was compared with the number of maintenance works.
As shown in Figure 10 and Figure 11, both roundness and sphericity had a relatively low correlation with TQI and the number of maintenance works in the case of using only the aggregates from surface or middle layer. The aggregates collected from the middle layer may be insufficient to reflect the severity of settlement.
When sphericity was calculated for the samples collected from the surface, it was distributed within 2% in most sections, regardless of the number of tamping works performed. It can be implied that aggregates on the surface are mainly abraded by factors other than tamping, such as weathering or train load.

3.2.3. Sieve Analysis Results According to the Sampling Depth

Figure 12 shows the results of the sieve analysis performed for the samples collected at different sampling depths. As shown in the figure, the samples collected from the surface are larger than those collected from the middle layer, which indicates that the abrasion occurred less in the gravels on the surface. Furthermore, the samples collected from the surface had a similar particle distribution regardless of the sampling location, which corresponds to the fact that the sphericity distribution of the samples was also similar. Specifically, surface gravels are mostly abraded by external factors, such as weathering or train load, rather than the tamping work; thus, they have a uniform abrasion loss and particle distribution across all locations.

4. Track Condition Evaluation Based on the Image Analysis Method

The criteria for ballast replacement on high-speed railways based on the image analysis method without performing the sieve analysis of ballast layer is suggested.
In a study by Kim et al. [11], the L.A. abrasion test was performed on the ballast gravels used for high-speed railways, followed by the sieve analysis (See Table 4). According to the railroad maintenance guidelines of the Korea National Railway [6], the ballast replacement is required when the ballast layer has 20% or higher of fine materials which passing 22.4 mm sieve. The table shows that 20% fine materials passing occur when the number of revolutions in the L.A. abrasion test is between 500 and 1000. When linear interpolation is applied to estimate the number of revolutions, the passing rate is exactly 20% when the number of revolutions is 703. When this number of revolutions is applied to the relationship among the number of revolution-abrasion loss-shape index defined in the study by Kim et al. [11], ballast replacement should be performed when the abrasion of ballast on high-speed railways is approximately 10% (See Table 5).

5. Conclusions

In this study, the method for evaluating the status of ballasted tracks of a high-speed railway using a 2-D image analysis was improved, and the following conclusions were drawn.
  • When the background color for taking images of gravel aggregates was changed and the image analysis algorithm was improved, the aggregate segmentation rate was significantly increased. The segmentation rate of a previous method ranged from 51 to 100%, as it was considerably affected by the image shooting environment, whereas that of the improved method was 100% regardless of the image shooting environment.
  • When the image analysis was performed on the samples collected from various location of a high-speed railway, the results revealed that roundness has the highest correlation with TQI, whereas sphericity has the highest correlation with the number of maintenance works. However, aspect ratio and angularity exhibited a low correlation with other shape indices owing to over simplification of a gravel shape and the limitation of the analysis method.
  • It was discovered that the correlation can be detected when the gravel samples are collected from the surface, as well as from the middle layer of a high-speed railway for the image analysis.
  • If the abrasion of the ballast aggregates approaches to about 10%, the ballast layer would be replaced in order to enhance maintenance efficiency.
Applying a 3-D image analysis method is more suitable for high-speed rail ballast than a 2-D image analysis method as explained previously; however, a 2-D image analysis method was proposed in this study for track status evaluation of the ballasted tracks of a high-speed railway, considering time, cost, and field applicability at high-speed railways. To increase the reliability of the developed method, the correlation should be examined and supplemented by comparing with the result of a 2-D image analysis method with that of a 3-D image analysis method.
When the images of the field gravels were analyzed, the abrasion loss of gravels was less than 4%. However, the relationship between the abrasion loss and shape index used in this study considered the abrasion loss of up to 21%, which indicates that an accurate analysis is required for sections with a smaller abrasion loss. Thus, an additional image analysis on the low number of revolutions in the L.A. abrasion test must be conducted.
Also, it is required to conduct more field tests to find out clear trend between ballast abrasion loss and TQI or maintenance.

Author Contributions

Conceptualization, Y.-T.C., B.P.; data collection, B.P., Y.-T.C.; data analysis, B.P., Y.-T.C., H.K.; manuscript writing, B.P.; manuscript review and editing, Y.-T.C.; funding acquisition, H.K. All authors have read and agreed to the published version of the manuscript.

Funding

This research was supported by a grant from R&D Program of the Korea Railroad Research Institute, Republic of Korea.

Conflicts of Interest

The authors declare no conflict of interest.

References

  1. Kumara, J.J.; Hayano, K. Deformation characteristics of fresh and fouled ballasts subjected to tamping maintenance. Soils Found. 2016, 56, 652–663. [Google Scholar] [CrossRef]
  2. Boler, H.; Qian, Y.; Tutumluen, E. Influence of size and shape properties of railroad ballast on aggregate packing statistical analysis. Transp. Res. Rec. 2014, 2448, 94–104. [Google Scholar] [CrossRef] [Green Version]
  3. Indraratna, B.; Salim, W.; Rujikiatkamjorn, C. Advanced Rail Geotechnology-Ballasted Track; CRC Press: Boca Raton, FL, USA, 2011. [Google Scholar]
  4. Salim, W. Deformation and Degradation Aspects of Ballast and Constitutive Modelling under Cyclic Loading. Ph.D. Thesis, University of Wollongong, Wollongong, NSW, Australia, 2004. [Google Scholar]
  5. Korea Railroad Corporation. Korea Railroad Corporation Standard: Ballast (KRCS A015-07); Korea Railroad Corporation: Daejeon, Korea, 2017. [Google Scholar]
  6. Korea National Railway. Railway Track Maintenance Guidelines; Korea National Railway: Daejeon, Korea, 2016. [Google Scholar]
  7. Masad, E.; Fletcher., T. Aggregate Imaging System (AIMS): Basics and Application; Texas Transportation Institute: Dallas, TX, USA, 2005; Volume Report 5-1.
  8. Mahmoud, E.; Gates, L.; Masad, E.; Erdoğan, S.; Garboczi, E. Comprehensive evaluation of AIMS texture, angularity, and dimension measurements. J. Mater. Civ. Eng. 2010, 22, 369–379. [Google Scholar] [CrossRef]
  9. Tutumluer, E.; Rao, C.; Stefanski, J.A. Video Image Analysis of Aggregates; Federal Highway Administration: IL, USA, 2000.
  10. Tutumluer, E.; Pan, T.; Carpenter, S.H. Investigation of Aggregate Shape Effects on Hot Mix Performance Using an Image Analysis Approach; Federal Highway Administration: Springfield, IL, USA, 2005.
  11. Kim, J.; Park, B.-S.; Woo, S.I.; Choi, Y.-T. Evaluation of ballasted-track condition based on aggregate-shape characterization. Constr. Build. Mater. 2020, 232, 117082. [Google Scholar] [CrossRef]
  12. Kim, H.; Haas, C.T.; Rauch, A.F.; Browne, C. Wavelet-Based Three-Dimensional Descriptors of Aggregate Particles. Transp. Res. Rec. 2002, 1787, 109–116. [Google Scholar] [CrossRef]
  13. Tolppanen, P. 3-D Characterization and Degradation Analysis of Rock Aggregates. Ph.D. Thesis, Royal Institute of Technology, Stockholm, Sweden, 2001. [Google Scholar]
  14. Garboczi, E.J. Three-dimensional mathematical analysis of particle shape using X-ray tomography and spherical harmonics: Application to aggregates used in concrete. Cem. Concr. Res. 2002, 32, 1621–1638. [Google Scholar] [CrossRef]
  15. Ouhbi, N.; Voivret, C.; Perrin, G.; Roux, J.N. Railway Ballast: Grain Shape Characterization to Study its Influence on the Mechanical Behaviour. Procedia Eng. 2016, 143, 1120–1127. [Google Scholar] [CrossRef] [Green Version]
  16. Guo, Y.; Markine, V.; Zhang, X.; Qiang, W.; Jing, G. Image analysis for morphology, rheology and degradation study of railway ballast: A review. Transp. Geotech. 2019, 18, 173–211. [Google Scholar] [CrossRef]
  17. Korean Agency for Technology and Standards. Method of Test for Resistance to Abrasion of Coarse Aggregate by Use of the Los Angeles Machine(KS F 2508-2007); Korean Agency for Technology and Standards: Chungcheongbuk-do, Korea, 2007. [Google Scholar]
  18. ASTM International. Standard Test Method for Resistance to Degradation of Large -Size Coarse Aggregate by Abrasion and Impact in the Los Angeles Machine(ASTM C131/C131M-14); ASTM International: West Conshohocken, PA, USA, 2014. [Google Scholar]
  19. Barrett, P. The shape of rock particles, a critical review. Sedimentology 1980, 27, 291–303. [Google Scholar] [CrossRef]
  20. Rodriguez, J.M.; Edeskär, T.; Knutsson, S. Particle shape quantities and measurement techniques—A review. Electron. J. Geotech. Eng. 2013, 18, 169–198. [Google Scholar]
  21. Ferreira, T.; Rasband, W. ImageJ User Guide IMAGEJ/FIJI 1.46; IJ 1.46r; 2012. Available online: http://imagej.nih.gov/ij/docs/guide/user-guide.pdf (accessed on 8 November 2020).
  22. Altuhafi, F.N.; Coop, M.R.; Georgiannou, V.N. Effect of particle shape on the mechanical behavior of natural sands. J. Geotech. Geoenviron. Eng. 2016, 142. [Google Scholar] [CrossRef]
  23. Wang, L.; Park, J.; Mohammad, L. Quantification of Morphology Characteristics of Aggregate from Profile Images. In Proceedings of the 82nd Transportation Research Board Annual Meeting, Washington, DC, USA, 12–16 January 2003; pp. 1–23. [Google Scholar]
  24. Mitchell, J.K.; Soga, K. Fundamentals of Soil Behavior, 3rd ed.; John Wiley & Sons: Hoboken, NJ, USA, 2005. [Google Scholar]
  25. Beucher, S. The Watershed Transformation Applied to Image Segmentation. In Proceedings of the 10th Pfefferkorn Conference on Signal and Image Processing in Microscopy and Microanalysis, Cambridge, UK, 27–30 September 1991; pp. 299–314. [Google Scholar]
  26. Santamarina, J.C.; Cho, G.C. Soil behaviour: The role of particle shape. In Proceedings of the Advances in Geotechnical Engineering: The Skempton Conference—Proceedings of a Three Day Conference on Advances in Geotechnical Engineering, organised by the Institution of Civil Engineers, London, UK, 29–31 March 2004; Thomas Telford: London, UK, 2004; Volume 1, pp. 604–617. [Google Scholar]
Figure 1. Relationships between abrasion loss and the shape indices: (a) roundness; (b) sphericity; (c) aspect ratio; (d) angularity.
Applsci 10 07946 g001
Figure 2. Scale-dependent particle shape characterization [24].
Applsci 10 07946 g002
Figure 3. Aggregate segmentation procedure used in previous research [11]: (a) original image; (b) fray-scaled; (c) binary image; (d) boundaries.
Applsci 10 07946 g003
Figure 4. Changed aggregate segmentation procedure: (a) original image; (b) HSV image; (c) S-channel of HSV image; (d) binary image; (e) boundaries.
Applsci 10 07946 g004
Figure 5. Segmented aggregates using image analysis: (a) previous method; (b) improved method.
Applsci 10 07946 g005
Figure 6. Image analysis software: (a) main window; (b) analysis results summary window.
Applsci 10 07946 g006
Figure 7. Abrasion loss based on shape index vs. TQI: (a) roundness; (b) sphericity; (c) aspect ratio; (d) angularity.
Applsci 10 07946 g007
Figure 8. Abrasion loss based on shape index vs. maintenance history: (a) roundness; (b) sphericity; (c) aspect ratio; (d) angularity.
Applsci 10 07946 g008aApplsci 10 07946 g008b
Figure 9. Coefficient of variation of shape indices.
Applsci 10 07946 g009
Figure 10. Abrasion loss based on roundness vs. TQI: (a) surface; (b) mid; (c) total.
Applsci 10 07946 g010
Figure 11. Abrasion loss based on sphericity vs. number of tamping: (a) surface; (b) mid; (c) total.
Applsci 10 07946 g011
Figure 12. Sieve analysis results.
Applsci 10 07946 g012
Table 1. Shape indices according to scale.
ScaleShape CharacterizationShape Index in This Research
LargeMorphologyRoundness, Aspect ratio
IntermediateRoundness textureSphericity
SmallSurface textureAngularity
Table 2. Result of aggregate segmentation.
Sampling PointNo.
of Total Aggregates
No. of Segmented Aggregates
Previous MethodImproved Method
Location 111890 (76%)118 (100%)
Location 21713 (76%)17 (100%)
Location 37036 (51%)70 (100%)
Location 43532 (91%)35 (100%)
Location 54034 (85%)40 (100%)
Location 64941 (84%)49 (100%)
Location 74237 (88%)42 (100%)
Location 85755 (96%)57 (100%)
Location 94646 (100%)46 (100%)
Location 108787 (100%)87 (100%)
Table 3. Details of field testing.
Year of MeasurementSection NameLocationStructure CategorySampling DepthNo. of Aggregates
2017Galhang overpassT2 241k295Bridge-46
Wunyong overpass 1T2 078k465Earthwork-54
Wunju
tunnel
T1 112k000Tunnel-337
Seobong
tunnel 2
T1 053k562Tunnel-445
2018Shinhue overpassT2 085k400BridgeSurface118
Godeung tunnelT2 107k270EarthworkSurface, Mid, Bottom52, 17, 18
T2 107k440TunnelSurface70
Pungsae
Bridge
T1 099k700EarthworkSurface35
T2 099k700EarthworkSurface, Mid40, 43
T2 100k300BridgeSurface, Mid49, 61
T2 100k500BridgeSurface42
Yongwa
tunnel
T2 089k110TunnelSurface57
T2 089k310EarthworkSurface, Mid46, 76
Paengseong overpass 1T2 075k570EarthworkMid88
T2 075k670BridgeSurface, Mid54, 57
Geumgang BridgeT1 183k220EarthworkMid59
T1 183k430EarthworkSurface, Mid78, 87
Table 4. Result of sieve analysis.
No. of CycleResidual Weight (kg)% of Passing (22.4 mm)
50 mm40 mm31.5 mm22.4 mmEtc.Total
02.023.382.801.810.0010.000.0
2001.083.112.542.230.959.929.6
3001.113.052.412.051.299.9113.0
5000.772.432.442.511.739.8717.6
10000.382.302.352.412.289.7223.5
20000.272.302.102.312.629.6027.3
Table 5. No. of cycle, abrasion loss and shape index relationship.
No. of CycleAbrasion Loss (%)Shape Index
RoundnessSphericityAspect RatioAngularity
00.000.5950.8361.2600.00209
2003.050.6180.8541.2530.00176
3003.990.6260.8621.2420.00176
5008.410.6380.8681.2350.00166
70310.570.6460.8711.2310.00160
100013.730.6510.8741.2240.00159
200021.030.6650.8811.2140.00139
Publisher’s Note: MDPI stays neutral with regard to jurisdictional claims in published maps and institutional affiliations.

