Abstract
Globally there are several viable sources of renewable, low-temperature heat (below 130 °C), particularly solar energy, geothermal energy, and energy generated from industrial wastes. Increased exploitation of these low-temperature options has the definite potential of reducing fossil fuel consumption with its attendant very harmful greenhouse gas emissions. Researchers have universally identified the organic Rankine cycle (ORC) as a practicable and suitable system to generate electrical power from renewable sources based on its beneficial usage of volatile organic fluids as working fluids (WFs). In recent times, researchers have also shown a preference towards deployment of zeotropic mixtures as ORC WFs because of their capacity to improve thermodynamic performance of ORC systems, a feat enabled through the greater matching of the temperature profiles of the WF and the heat source/sink. This paper demonstrates the thermodynamic, economic and sustainability feasibility, and the notable advantages of using zeotropic mixtures as WFs through a simulation study of an ORC system. The study examines first the thermodynamic performance of ORC systems using zeotropic mixtures to generate electricity powered by a low-temperature solar heat source for building applications. A thermodynamic model is developed with a solar-driven ORC system both with and excluding a regenerator. Twelve zeotropic mixtures with varying compositions are evaluated and compared to identify the best combinations of mixtures that can yield high performance and high efficiency in their system cycles. The study also examines the effects of the volume flow ratio, and evaporation and condensation temperature glides on the ORC’s thermodynamic performance. Following a detailed analysis of each mixture, R245fa/propane and butane/propane are selected for parametric study to investigate the influence of operating parameters on the system’s efficiency and sustainability index. For zeotropic mixtures, results disclosed that there is an optimal composition range within which binary mixtures are inclined to perform more efficiently than the component pure fluids. In addition, a substantial enhancement in cycle efficiency can be obtained by a regenerative ORC, with cycle efficiency ranging between 3.1–9.8% and 8.6–17.4% for ORC both without and with regeneration, respectively. Results also revealed that exploiting zeotropic mixtures could enlarge the limitation experienced in selecting WFs for low-temperature solar ORCs. Moreover, a detailed economic with a sensitivity analysis of the solar ORC system was performed to evaluate the cost of the electricity and other economic criteria. The outcome of this investigation should be useful in the thermo-economic feasibility assessments of solar-driven ORC systems using working fluid mixtures to find the optimum operating range for maximum performance and minimum cost.
1. Introduction
Climate change remains a critical and topical issue affecting every aspect of the natural environment. The climate crisis is the biggest single threat to all of humanity, with devastating consequences that have the potential to reverse decades of progress and to thrust people into poverty. It is acknowledged that climate change is the direct result of natural causes, but predominantly attributable to anthropogenic activities, and numerous scientific studies firmly establish that global warming is responsible severely altering the balance in the globe’s climate through the release of damaging greenhouse gases (GHGs). Energy expended in buildings alone accounts for an approximate one-third of total energy utilisation while being responsible for 20% of global GHG emissions [1].
The seriousness of the climate change problem caused largely by the extravagant use of fossil fuels creates the impetus to minimise or eliminate their consumption and thereby alleviate this troubling environmental malady. Thus, substitution of fossil fuels with renewable energies such as solar energy, wind energy, biomass and geothermal energy for combined heat and power (CHP) generation has been explored and very well received with increasing popularity in the last two decades. This has followed previous efforts at developing a micro-grid by deploying solar-based and renewable energy systems for building applications.
In thermodynamic cycles, the organic Rankine cycle (ORC) has become increasingly deployed in CHP systems. ORC is currently being researched as a promising technology-based power system with a great potential for growth and which would likely compete with fossil fuels, particularly natural gas.
Alike to the steam power cycle in which the working fluid (WF) used is vapour water, ORC also employs hydrocarbons (organic constituents) that have extra capacity than water to lower heat source temperatures for the intents of both power and CHP. Since ORC has the advantage of special features including an uncomplicated structure, greater reliability, and simpler repairs over other cycles, it is a convenient system for converting energy from low-temperature heat sources such as solar systems. Moreover, this device enables micro-scale utilisations in buildings [2,3,4,5,6,7,8].
The broad spectrum of potential applications have stimulated and inspired more investigations to derive suitable ORC-based solutions. Researchers and engineers are finding that the ORC system’s technical performance is likely influenced by thermodynamic cycle design, expander technology and working fluid assortment. Increasingly, they are also examining positive or volumetric displacement expanders for the purpose of low-temperature and micro-scale ORC. Researchers are continuing to examine various micro-ORCs built for generating power [9,10,11,12].
Thermodynamic cycle design, expander technology and WF choice tend to impact the technical performance of an ORC system in fundamental ways. Similarly, since ORC systems are powered by solar energy, it is crucial to select the appropriate WFs in order to achieve an operation that is both harmless and effective. Apart from thermophysical properties, other indices, especially those of chemical stability and the environmental effect, in addition to the cost factor require further research in order to accomplish desired results. WFs have been carefully considered and selected for solar-powered ORC systems. An ORC system’s economics are mainly associated with a WF’s thermodynamic requirements. A suitable WF would have certain definite properties, especially medium pressure within heat exchangers, small specific volumes and high efficiency, small ozone depletion potential (ODP), low global warming potential (GWP), and minor toxicity. Modest pricing would naturally be an additional factor for suitability. If the selection is inappropriate, it could result in a costly and ineffectual machine. Several researchers have found it necessary and pertinent to outline specific qualifying criteria for a suitable WF in ORC systems. These are summarised for example, in [13,14,15].
Generally, pure fluids (composed of a single chemical constituent), were largely explored to be the operating medium of ORC machines. This study proposes binary mixtures as an alternative to single refrigerants such as WFs in ORC applications. Research has proved binary WF mixtures to be an effective method to enhance the performance of ORCs. Researchers have also suggested mixtures for different heat sources. Such WFs are able to match the temperature profile of the heat source by a non-isothermal phase change that decreases the irreversibility in the evaporator and the condenser. In other terms, a zeotropic mixture may better match the temperature profiles throughout evaporation and condensation based on temperature glides with changing constituent concentrations in every phase of the mixture.
Mixtures of either hydrocarbons or siloxanes were explored by Angelino and Colonna Di Paliano [16]. For multicomponent mixtures, improved performance was seen, because the cooling device required less power. Mago et al. [17] analysed a regenerative ORC system utilising four dry organic fluids to convert waste energy to power from low-grade heat sources. They confirmed that the composition of the WFs has significant impact on the ORC performance. Wang and Zhao [18] compared three diverse compositions of R245fa/R152a to pure R245fa at a low temperature solar ORC. Wang et al. [19] carried out experimental comparisons for a low-temperature solar regenerative ORC system. They used R245fa as the pure fluid and compared the system performance to that with zeotropic mixtures of R245fa/R152a (0.9/0.1) and R245fa/R152a (0.7/0.3). They performed experiments at a heat source temperature of 110 °C with a constant volume flow rate. They found the average power output of R245fa/R152a (0.7/0.3) was 28.03% higher than that of R245fa/R152a (0.9/0.1) and 29.10% higher than that of R245fa. The average overall efficiency of R245fa, R245fa/R152a (0.9/0.1), and R245fa/R152a (0.7/0.3) was 0.88%, 0.92%, and 1.28%, respectively. The average estimated power output was between 6 and 8 W, and the average Rankine cycle efficiency was calculated to be between 4% and 6%, which both increases with the R152a content. Heberle et al. [20] investigated the performance of R227ea, isobutane, R245fa, isopentane, and their mixtures for geothermal heat source temperatures below 120 °C and arrived at the outcome that the second law efficiency of the mixtures increased in range between 4.3% and 15% compared to the best efficient pure component. Chys et al. [21] found that a possible increase of 16% and 6% in cycle efficiency is obtained using mixtures for 150 °C and 250 °C heat sources. Garg et al. [22] assessed isopentane, R245fa, and their mixtures’ performance in ORC for 106–151 °C heat sources and recommended isopentane/R245fa (0.7/0.3). Andreasen et al. [23] maximised the net power output on an ORC system by means of two cases with hot fluid inlet temperatures at 120 °C and 90 °C. They found that the optimised ethane/propane generated 12.9% higher net power output than the pure ethane with the hot fluid temperature of 120 °C. Liu et al. [24] assessed the effect of the temperature glide during the zeotropic condensing process on the thermal efficiency and output work of the ORC system. Lecompte et al. [25] examined the performance of eight pure WFs and their mixtures for a 150 °C heat source and the outcomes indicated that an increase in the second law efficiency in range of 7.1% to 14.2% was derived by the mixtures compared to pure WFs. Kang et al. [26] found that R245fa/R600a (0.9/0.1) was the best mixture among 10 groups of mixtures for a 120 °C geothermal heat source. Feng et al. [27,28] provided a performance comparison of low-grade ORC using R245fa, pentane and their mixtures based on the thermo-economic multi-objective optimisation and decision makings, and tested the operation characteristic of a R123-based ORC subject on WF mass flow rates and heat source temperatures. Applying the same objective function of maximum net power output on geothermal ORC system, Liu et al. [29] concluded that R600a/R601 mixtures generated between 11% and 4% extra power than R600a for geothermal water inlet temperatures between 110 °C and 150 °C, respectively. Sadeghi et al. [30] observed that using zeotropic mixtures as the WF in lieu of a pure fluid such as R245fa, results to more than 24% increase in power production for ORC with 100 °C geothermal water. Xi et al. [31] identified that WF mixture is more cost-effective than pure WF and R245fa/isopentane and R245fa/pentane were suggested for 100–180 °C heat sources amid four mixtures and five pure WFs. Wu et al. [32] analysed the performance of ORC using zeotropic mixtures of R227ea/R245fa, butane/R245fa and RC318/R245fa for a 120 °C hot air heat source. Outcomes revealed, however, that the mixtures can deliver high thermal efficiency but result in a poor economic performance. Abadi and Kim [33] reviewed the zeotropic mixtures used in ORC, described both the advantages and problems based on previous studies for the specific heat sources. Pang et al. [34] investigated experimentally R245fa, R123 and their mixtures to produce maximum net power on simulated low-temperature industrial waste heat. Four mass fractions of R245fa:R123 were used to test the system performance at the heat source temperatures of 110 °C and 120 °C with a specified mass flow rate of a heat source of 0.15 kg/h. They found that the case of pure R245fa generated a maximum net power of 1.56 kW with an electrical efficiency of about 3.9% when heat source temperature is fixed at 110 °C, while, the case of mixture R245fa:R123 = 2:1 generated a maximum net power of 1.66 kW with an electrical efficiency of about 4.4% when heat source temperature input was fixed at 120 °C. Zhai et al. [35] provided provisional design procedures of zeotropic mixture WFs for ORC. They showed that the estimated mixtures have superior performance than the ideal pure WF. They recommended that the proposed zeotropic mixtures would have the identical basic characteristics like the best pure WFs and as well possess temperature glide matching with the cooling source.
The numerous studies described above indicate the increasing attention to the subject of ORC applications for low-temperature applications and use of WF mixtures. However, in spite of this proliferation of studies trying to solve an ORC system’s performance using mixtures, and their contribution to the ORC application’s use particularly in low-grade heat source, to the authors’ knowledge, there is still insufficient research into or investigation of the micro-scale solar ORC system’s using mixtures for use in buildings detailed and complete thermo-economic and sustainability performance investigations.
Hence, the present study attempts to demonstrate the thermo-economic feasibility, sustainability, and potential advantages of using zeotropic mixtures as WFs in an ORC system to generate heat and power driven by low-temperature solar heat sources for building applications.
A thermodynamic model has been developed with an ORC using mixtures with and without heat regeneration. Twelve zeotropic WF mixtures with various compositions of R245fa/R152a, R245fa/propane, R245fa/hexane, R245fa/heptane, butane/propane, butane/hexane, butane/heptane, isobutane/propane, isobutane/hexane, pentane/hexane, and isopentane/hexane were evaluated and compared through baseline, parametric, and optimisation performance studies to identify the best combinations of mixtures for yielding both high system cycle efficiencies and power outputs at optimum conditions, taking into account effects of the volume ratio, and the evaporation and condensation temperature glides of the zeotropic mixtures on the ORC thermodynamic performance. In the second part of the investigation, a sustainability analysis and a detailed economic assessment were performed to find the cost of energy per kWh by means of energy analysis, sensitivity analysis and payback period. The results of this analysis offer new understanding into the thermo-economic and sustainability performance of solar-driven regenerative ORC systems using sustainable working fluid mixtures for building applications and should prove useful in the feasibility assessments to find the optimum operating range for maximum performance and minimum cost.
2. Thermodynamic Analysis of the Solar ORC System with Zeotropic Mixtures
2.1. Description of the System
The solar ORC system comprises essentially six elements, i.e., a pump, an evaporator, an expander, an optional regenerator, a condenser, and a generator for electricity production. Figure 1 illustrates a basic schematic of a solar-powered regenerative ORC system. Figure 2 shows a diagram of the equivalent cycle in temperature-entropy (T-s) diagram. The pump transfers the organic WF to the evaporator, where the fluid is preheated by the regenerator and vaporised. The vapour flows into the expander where it is expanded to the condensing pressure and lastly, it is condensed to saturated liquid in the condenser by rejecting heat to atmosphere. A heat exchanger working as regenerator is employed to recuperate the heat at the expander outlet and preheat the compressed liquid before inflowing in the evaporator to enhance the system efficiency. This system contains a solar energy collecting system, which includes a solar flat plat collector (FPC) or evacuated tube collector (ETC); a thermal energy storage system which is utilised when solar radiation is not sufficient, and to supply the ORC. In general, solar FPCs can deliver hot water at 50–90 °C and solar ETCs can provide 60–150 °C. When its temperature falls below the reference temperature, a standby heater is used to rise the temperature of the storage tank to the suitable setting point.
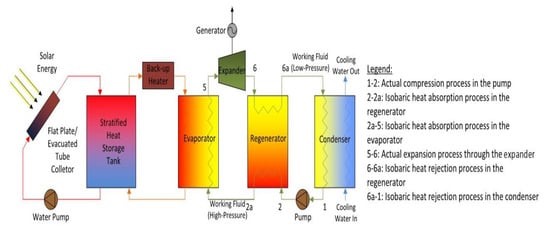
Figure 1.
Flow diagram of the solar-driven regenerative organic Rankine cycle (ORC) system.
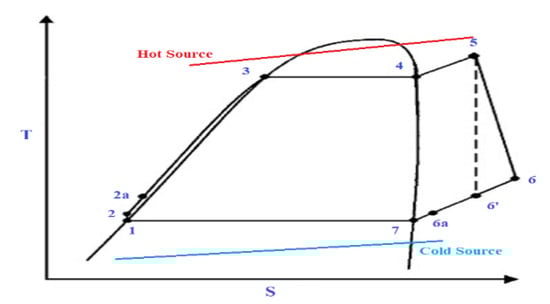
Figure 2.
Temperature-entropy diagram of an ORC.
2.2. Working Fluid Mixtures
The working fluid mixtures of the ORC system used in this study are R245fa/R152a, R245fa/propane, R245fa/hexane, R245fa/heptane, butane/propane, butane/hexane, butane/heptane, isobutane/propane, isobutene/hexane, pentane/hexane, and isopentane/hexane. These fluids are selected such that they would be available in the next 10 years to be implemented in a micro-co/trigeneration system for residential and commercial building applications. The temperature-entropy, temperature-mass fraction, and pressure-mass fraction diagrams for all the WF mixtures are provided in Appendix A. All the properties of mixtures and the processing of the above-mentioned diagrams are taken or calculated from the REFPROP database [36] to state the thermodynamic properties of the organic mixtures. REFPROP is a programming library that implements equations of state for pure and pseudo-pure fluids, mixtures, psychometric mixtures, and incompressible fluids.
2.3. Thermodynamic Model and Boundary Conditions
A low-temperature solar–driven ORC system was simulated to provide the output parameters of the ORC using different zeotropic mixtures as WFs. The calculations are carried out with and without the regenerator to analyse the effect of its performance on every working fluid mixture. The ORC system performances are computed in respect of expressing the energy balance in every single component formerly defined, the thermal and electrical powers, efficiencies, and the cycle efficiency.
The next hypotheses have been done in this study:
- Steady state conditions are presumed.
- The ORC system is powered by the net thermal power generated by a solar source in which the pump energy consumption and other inherent losses of the solar energy system loop are pre-accounted for. It is the case for the back-up as well.
- Kinetic energy and potential energies of operating modes are neglected.
- Pressure drops and heat lossses are disregarded in the heat exchangers, condenser, evaporator, and pipes.
- The flow directions of WFs in the heat exchangers, condenser, evaporators, and regenerator are counter-current.
- The formulations of the zeotropic mixtures do not vary during the ORC mode.

Table 1.
Inputs of the ORC system.
Table 2.
Outputs of the ORC system.
The equations developed to calculate the thermodynamic performance of each component of the ORC cycle with and without regeneration, based on Figure 1 and Figure 2 and Table 1 and Table 2, are given below:
Solar collector-evaporator heat inlet without regenerator:
Solar collector-evaporator heat inlet with regenerator:
Expansion work outlet:
Heat transfer in regenerator:
Condenser heat rejected without regenerator:
Condenser heat rejected with regenerator:
Pump work inlet:
Net power outlet:
The thermodynamic efficiency of the ORC cycle is computed by means of the next equation:
Carnot cycle efficiency:
The second law efficiency is estimated based on a work by Wu et al. [32] on thermal analysis on zeotropic mixtures for ORC. The exergy of the absorbed heat is calculated using the following equation:
where is the dead-state temperature, is the heat absorbed by the evaporator and is the mean temperature of the evaporator. The latter is calculated as follows:
where and are the inlet and outlet temperature of the working fluid, respectively.
The second law efficiency is calculated as follows:
where and are the net power output and the exergy of the absorbed heat, respectively.
The simplified flow diagram for the solar-driven ORC micro-CHP system simulation procedure is presented in Figure 3.
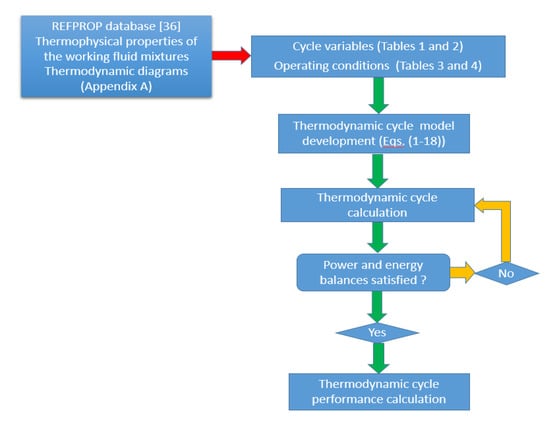
Figure 3.
Flow diagram of the solar-driven ORC system.
2.4. Model Validation
Available experimental data in the literature for an ORC system utilising mixtures of R245fa/R123 as the working fluid with four mass fractions of R245fa mass fractions, i.e., 0, 0.33, 0.66, and 1 at the same operating conditions, i.e., hot source temperature of 120 °C and mass flowrate of 0.15 kg/s, by Pang et al. [34] have been utilised to validate the thermodynamic model in this work, as shown in Figure 4. The assumptions of the thermodynamic model are listed in Section 2.2. Kinetic energy and potential energies of operating modes are neglected. Pressure drops and heat losses are disregarded in the heat exchangers, condenser, evaporator, and pipes. Comparison of cycle efficiency simulation results by means of the present model and the available experimental data at different R245fa mass fractions shows an uncertainty range of 3.4% to 6.6%, which can reasonably be considered as a good agreement in the context where the measurements uncertainty range is somewhat similar. As a result, the current model can be utilised for further analysis with supporting reliability of the calculations.
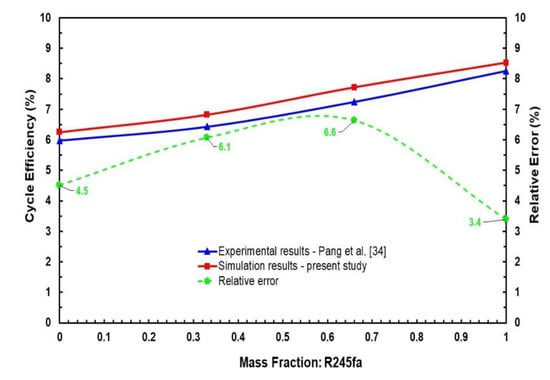
Figure 4.
Comparison between simulation and experimental results in ORC system using R245fa/R123 working fluid mixtures for validation study.
3. Results and Discussion
This section provides the results and discussion of the (i) baseline study, (ii) parametric study, and (iii) comparison between R245fa/propane and butane/propane on the performance of the solar-powered ORC system with and without regenerator using zeotropic working fluid mixtures.
3.1. Baseline Case Study of the Solar ORC System Performance
The parameters of interest to this baseline study include the working fluid mixture components, mass fraction of each component, hot source temperature, and cold source temperature. The standard operating conditions are listed in Table 3.
Table 3.
Parameters of the baseline case study.
In order to accomplish the objective of implementing the ORC with a flat plate solar collector, hot and cold source temperatures at 85 °C and 25 °C, respectively are tested for each working fluid to determine the ORC’s capacity to operate at these temperatures. An evacuated tube solar collector can be used to achieve temperatures up to 110 °C. Many of the working fluid mixtures do not yield results for overly high temperature above 85 °C and for low temperature below 25 °C, so it is necessary to find mean temperatures that would allow those mixtures to operate in solar ORC systems.
Several parameters in the ORC model are adjusted to ensure that reasonable results can be derived. These parameters are listed in Table 4 for each working fluid mixture. The expander efficiency is assumed to be 80% and the superheating amount to be 5 °C; these are reasonable assumptions for the ORC performance analysis. The overall mass flow rate of the mixture is evaluated using the weighted linear interpolation method. For each component, the mass flow rate is considered to be the average of its minimum and maximum mass flow rates in Equation (19).
where is the mass flow rate of the mixture, is the average mass flow rate of the first component of the mixture, is the mass fraction of the first component, is the average mass flow rate of the second component of the mixture, and is the mass fraction of the second component.
Table 4.
Unchanging parameters.
3.1.1. Cycle Efficiency
The cycle efficiency is evaluated to provide a broad indication of the influence of each factor on the performance of the ORC. The effect of mass fraction on efficiency depends on which fluid components make up the mixture. In general, increasing the hot source temperature will increase efficiency. Table 5 shows both the maximum and minimum values of the cycle efficiency with and without using the regenerator, respectively. It can be seen that the difference between the maximum and minimum cycle efficiency values can be as high as 10%, especially when the regenerator is used. It is observed that cycle efficiency with the use of the regenerator is higher than without its use. Using a regenerator is advantageous in the situation of the zeotropic mixtures due to their non-isothermal condensation. Zeotropic mixtures possess a better capacity to recuperate the low-temperature heat after the expander as against to the pure fluid. However, it is to be noted that these fluids are being operated at higher temperature than 85 °C; hence, in normal conditions of 85 °C, R245fa/propane and isobutane/propane a have high cycle efficiency.
Table 5.
Cycle efficiency of working fluid mixtures with and without regenerator.
Figure 5 and Figure 6 depict cycle efficiency as a function of mass fraction. It is observed that the relationship between cycle efficiency and mass fraction is non-linear for all the mixtures. However, it can be noticed that the mixtures with heptane and hexane as components undergo a drastic change in the cycle efficiency when the regenerator is added. For instance, isobutane/heptane has the lowest cycle efficiency with the composition of 0.25 of isobutane; however, with the regenerator it has the highest cycle efficiency with the composition of 0.4. For the remaining mixtures, the trend remains almost the same in that pure fluids have the highest cycle efficiencies and there is a local minimum, but when regenerator is added, the relationship between cycle efficiency and mass fraction for these mixtures becomes more stable, ranging between 8.6% and 17.4% compared to without regenerator, in which case it ranges between 3.0% and 10%.
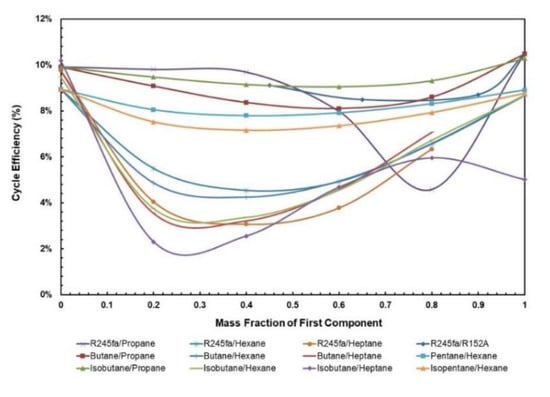
Figure 5.
Cycle efficiency vs. mass fraction of all mixtures without regenerator.
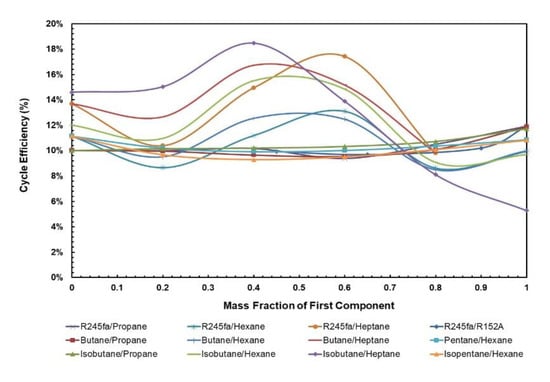
Figure 6.
Cycle efficiency vs. mass fraction of all mixtures with regenerator.
3.1.2. Net Power Output
Since the net power output of the ORC is not affected by the addition of a regenerator, it generally follows the same trend as the cycle efficiency of the ORC without the regenerator, the solar input is drastically reduced with the addition of regenerator for these mixtures. The influence of mass fraction depends on the components being used in the mixture. Figure 7 presents the net power output for various mass fractions of WF mixtures. It can be seen that mixtures with heptane and hexane as components have a low net work output even though they are being operated at relatively higher temperatures.
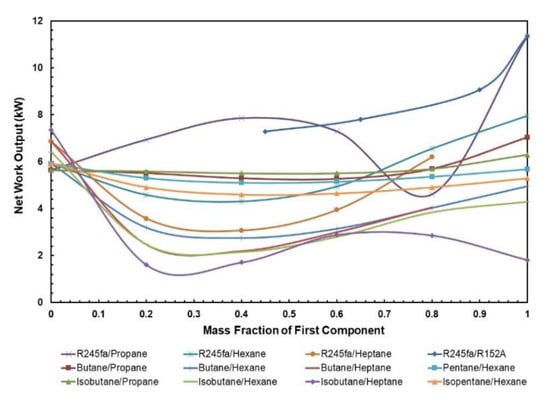
Figure 7.
Net work output vs. mass fraction for all mixtures.
The optimal net work output of ORC system with mixtures can be found in Table 6. The range of optimal net work output is from 2.88 to 9.07 kW, where the highest net work output is obtained from R245fa/R152a (0.9/0.1) mixture i.e., 9.07 kW.
Table 6.
Optimal net work output for working fluid mixtures.
3.1.3. Volume Ratio
The volume flow ratio is termed as the ratio of specific volume value at the expander exit and expander entry; it is a parameter that indicates what extent the fluid volume rises during the process of expansion. Ideally, a lower volume ratio means cheaper expanders are required to operate in the ORC. The normal trend that can be seen in Figure 8 is that the mixtures have a lower volume ratio in comparison to the pure fluids, and this certainly signifies that mixtures are less expensive than pure fluids. In particular, R245fa/Propane (0.8/0.2) has a significantly lower volume ratio, in comparison to other mixtures of R245fa/R152a, isobutane/propane, and butane/propane that are being operated at the hot source temperature of 85 °C. For mixtures containing heptane and hexane, their volume ratios are the lowest amongst all other fluids. However, one must also keep in mind that the net work output for these mixtures is significantly low and that they are being operated at higher temperatures that can affect the costing of solar equipment within the ORC system.
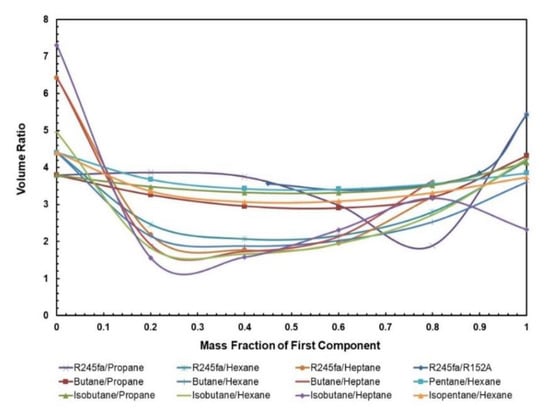
Figure 8.
Volumet ratio vs. mass fraction for all mixtures.
3.1.4. Condensation and Evaporation Temperature Glides
Figure 9 and Figure 10 present the effect of the temperature glides on the working fluid mass fraction. The figures show that the trends for every mixture’s evaporation and condensation temperature glide are identical. In general, the temperature glides for all mixtures have a local maximum and are 0 at pure fluids. The mixtures R245/fa with hexane and heptane have a higher temperature glide compared to other mixtures, whereas the R245fa/heptane mixture has the highest evaporation and temperature glides. Within the mixtures operating at standard conditions, i.e., at hot and cold source temperatures of 85 °C and 25 °C, respectively, R245fa/propane reaches the maximum condensation and evaporation temperature glides of 33 °C and 27.42 °C at a ratio of 0.8/0.2, followed by butane/propane at a ratio of 0.6/0.4 (Figure 11 and Figure 12). Non-isothermal condensation and evaporation in mixtures can improve regeneration when both the condensation and evaporation temperature glides are both near to the cold and hot source temperature increases. In such a situation, heat transfer irreversibility in the condenser and evaporator is minimised. However, temperature glides in the condensation and evaporation should be checked systematically because a sizeable glide can trigger a pinch point, which hinders efficient heat recovery.
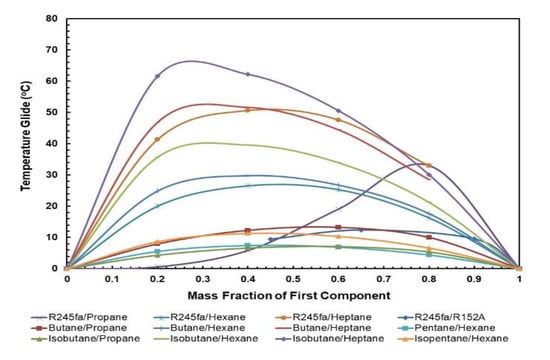
Figure 9.
Condensation temperature glide vs. mass fraction for all mixtures.
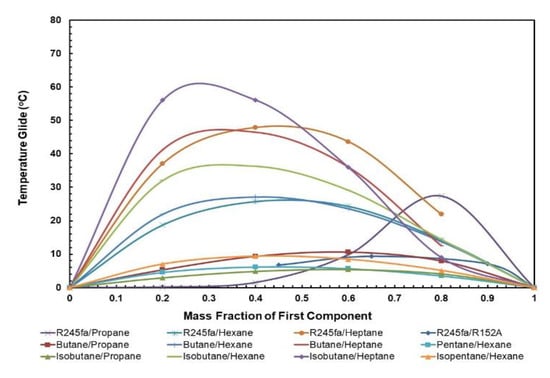
Figure 10.
Evaporation temperature glide vs. mass fraction for all mixtures.
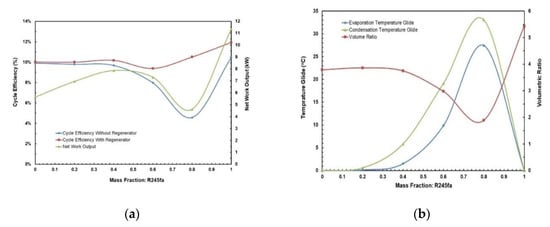
Figure 11.
(a) Cycle efficiency and net work output; (b) temperature glides and volume ratio vs. mass fraction for R245fa/propane mixture.
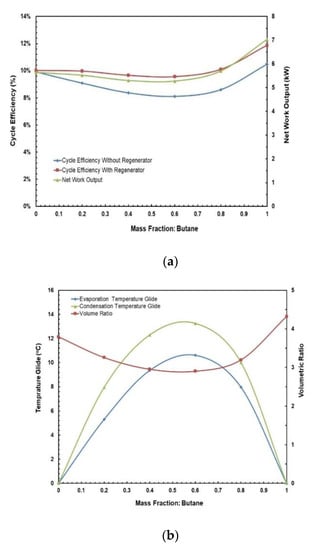
Figure 12.
(a) Cycle efficiency and net work output; (b) temperature glides and volume ratio vs. mass fraction for butane/propane mixture.
3.2. Parametric Study
After analysing all the graphs in the previous section for each mixture, R245fa/propane and butane/propane are chosen for parametric study. As per the graphs above, these mixtures have significantly higher cycle efficiency at lower operating conditions (T-Hot = 85 °C; T-Cold = 25 °C) and also have lowest volume ratio and highest temperature glides among other fluids operating at the same conditions. This parametric study is carried out by varying three parameters: hot and cold source temperatures of the ORC and the mass fraction of the mixtures. This study also considers the second law efficiency of the ORC system that is being evaluated at the dead-state temperature of 20 °C. The conditions are outlined in Table 7. The hot source temperature between 80 °C to 95 °C is selected for the use with a flat plate solar collector and the cold source temperature between 20 °C to 35 °C. A total of 64 cases for each working fluid mixture are deployed for the simulation.
Table 7.
Parametric study variables for R245fa/propane and butane/propane mixtures.
Figure 13 and Figure 14 depict the effects of hot and cold source temperatures on the cycle efficiency and net power output for the two working fluid mixtures (Table 7). It can be seen that the cycle efficiency and net power output are directly proportional to the hot source temperature. Furthermore, as the cold source temperature decreases, the cycle efficiency trend moves vertically up. The highest cycle efficiency is achieved at hot source temperature of 95 °C and cold source temperature of 20 °C, with a net power output of 9.59 kW and 7.5 kW for R245/propane and butane/propane mixtures, respectively.
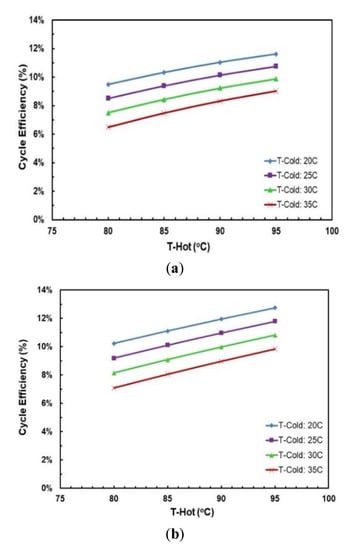
Figure 13.
Cycle efficiency vs. hot source temperature for different cold source temperatures and with regenerator for mixtures: (a) R245fa/propane (0.6/04; (b) butane/propane (0.8/0.2).
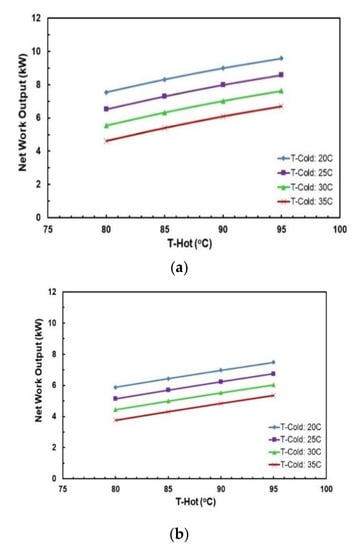
Figure 14.
Net work output vs. hot source temperature for different cold source temperatures and with regenerator for mixtures: (a) R245fa/propane (0.6/04); (b) butane/propane (0.8/0.2).
Figure 15a,b present the effects of mass fraction and hot source temperatures on the cycle efficiency for the two working fluid mixtures. Figure 15a shows that for hot source temperatures of 80 °C and 85 °C there is a local minimum cycle efficiency at R245fa/propane ratio of 0.6/0.4. However, for hot source temperatures of 90 °C and 95 °C there is a local maximum cycle efficiency at the same ratio (0.6/0.4). In Figure 15b it can be seen that highest cycle efficiency is at mixture butane/propane (0.8/0.2). There is a local minimum at mixture butane/propane (0.6/0.4). The trend shifts vertically up with increasing hot temperature.
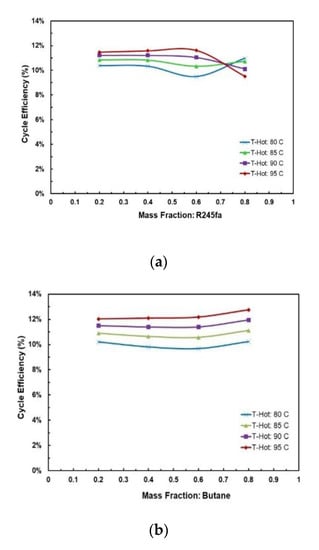
Figure 15.
Cycle efficiency vs. mass fraction for different hot source temperatures at cold source temperature of 20 °C and with regenerator: (a) R245fa/propane and (b) butane/propane.
Figure 16a,b depict the effects of hot and cold source temperatures on the second law cycle efficiency. It can be seen that the second law cycle efficiency is directly proportional to hot source temperatures and as the cycle efficiency trends in Figure 15a,b show, decreasing the cold temperatures tends to trigger an upward vertical movement of the cycle efficiency. The highest second law efficiency is achieved at hot temperature of 95 °C and cold temperature of 20 °C.
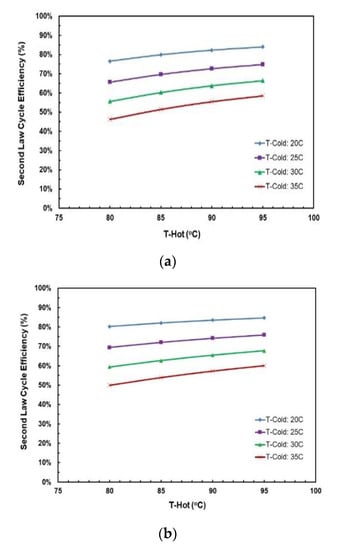
Figure 16.
Second law cycle efficiency vs. hot source temperatures for different cold source temperatures for (a) R245fa/Propane (0.6/0.4); (b) butane/propane (0.8/0.2).
Figure 17a,b show the effects of mass fraction and hot source temperature on the second law cycle efficiency for the two working fluid mixtures. Figure 17a shows that the second law cycle efficiency decreases as the mass fraction of R245fa is increased. In compositions between 0.2 and 0.4, the second law efficiency is almost identical at different hot source temperatures, which shows that hot source temperature does not significantly affect the second law efficiency in these compositions. In Figure 17b the highest second law efficiency is achieved at the mixture butane/propane (0.2/0.8). There is a local minimum at the mixture butane/propane (0.6/0.4). The trend shifts vertically up when the hot temperature increases; however, the shift is small which shows that changing hot temperatures have little effect on the second law efficiency.
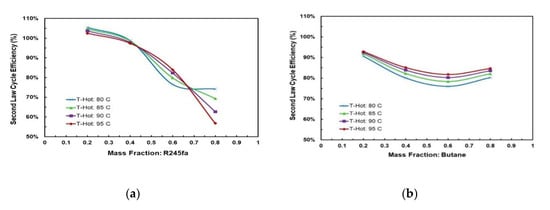
Figure 17.
R245fa/propane second law cycle efficiency at cold source temperature of 20 °C for different hot source temperatures vs. mass fraction of (a) R245fa and (b) butane/propane.
3.3. Comparison Between R245fa/Propane and Butane/Propane Mixtures
The optimal mass compositions for the mixtures are identified from previous Section 3.2 for mixtures R245fa/propane and butane/propane by analysing the cycle efficiencies. These are provided in Table 8 below.
Table 8.
Optimal mass composition for mixtures.
3.3.1. Net Power and Cycle Efficiency at Optimal Conditions for the R245fa/Propane and Butane/Propane Mixtures
Figure 18 and Figure 19 present the effects of hot and cold source temperatures on the net work output and cycle efficiency at optimal conditions (Table 8) for the two working fluid mixtures. It can be observed that both mixtures follow the same trend; net work output and cycle efficiency are directly proportional to hot and cold source temperatures. In general, butane/propane (0.8/0.2) has a higher cycle efficiency than R245fa/propane (0.6/0.4). Both of them have the highest cycle efficiency at the hot temperature 95 °C and the cold temperature 20 °C as seen in the previous section. However, at lower hot temperatures, the difference in the cycle efficiencies of these mixtures is small, but it increases as the hot temperature increases.
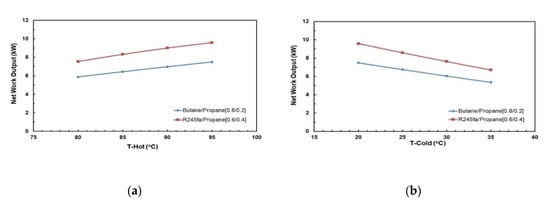
Figure 18.
Net power output at cold temperature 20 °C for optimal mixtures vs. (a) hot source temperature; (b) cold source temperature.
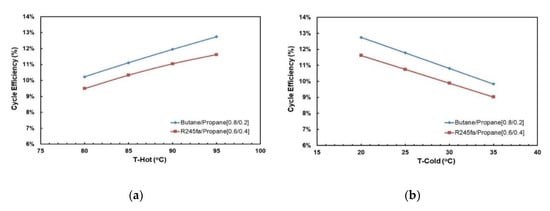
Figure 19.
Cycle efficiency at cold temperature 20 °C for optimal mixtures vs. (a) hot source temperature; (b) cold source temperature.
3.3.2. Second Law Efficiency at Optimal Conditions
Figure 20a,b show the effects of hot and cold source temperatures on the second law cycle efficiency at optimal conditions (Table 8) for the two working fluid mixtures. Similarly to the cycle efficiency (Figure 19a,b), the second law cycle efficiency is directly proportional to the hot temperature for both mixtures. In general, butane/propane (0.8/0.2) has a higher second law efficiency than R245fa/propane. Both of them have the highest second law cycle efficiency at the hot temperature 95 °C and the cold temperature 20 °C. Unlike the cycle efficiency, the difference in second law cycle efficiency is higher at lower hot temperatures and is almost identical at higher hot temperatures.
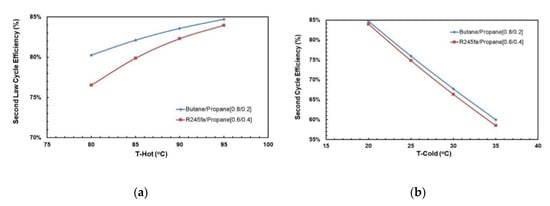
Figure 20.
Second law cycle efficiency at cold temperature 20 °C for optimal mixtures vs. (a) hot source temperature; (b) cold source temperature.
3.3.3. Sustainability Index at Optimal Conditions
The optimal mass composition for the mixtures is identified from the previous section by analysing the cycle efficiencies. For comparison purposes, the dead-state temperature is also varied for this mixture and sustainability index is evaluated. The Sustainability Index gives a good measure of the sustainability on the basis of exergy that represents the imperfections and irreversibility in the ORC. A higher sustainability index means better sustainability of the overall system. It is evaluated as follows [37]:
where is the second law efficiency.
Figure 21a,b depict the effect of dead-state temperature on the second law cycle efficiency for both the working fluid mixtures considered in this study. In Figure 21a, it can be seen that second law cycle efficiency is directly proportional to the dead-state temperature. In general, butane/propane (0.8/0.2) has a higher second law cycle efficiency than R245fa/propane (0.6/0.4); however, at a higher dead-state temperature they are almost identical. Similarly, in Figure 21b, it can be observed that the sustainability index rises as the dead-state temperature rises. The sustainability index of both mixtures are almost identical to each other; at a lower dead-state temperature (5–20 °C), butane/propane (0.8/0.2) has slightly higher sustainability index than R245fa/propane (0.6/0.4) but at higher dead-state temperatures (>25 °C), R245fa/propane has higher sustainability index.
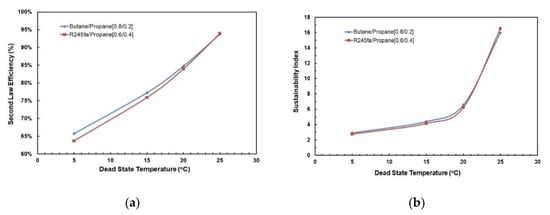
Figure 21.
(a) Second law cycle efficiency; (b) Sustainability index vs. dead-state temperature at optimal conditions (hot and cold source temperatures of 95 °C and 20 °C).
4. Economic Analysis of the Solar ORC System
A detailed economic analysis of the solar-driven ORC system is provided in the following sub-sections.
4.1. Selection of Mixtures
The economic analysis is carried out for solar-powered ORC system using mixtures R245fa/R152a, R245fa/propane and butane/propane. The solar ORC performance is evaluated at the standard operating conditions (hot source temperature: 85 °C; cold source temperature: 25 °C). For the purpose of this analysis, the mass composition that correlates with the optimal net work output for these mixtures is chosen. They can be found in Table 9.
Table 9.
Optimal Net Work Output of Selected Mixtures.
4.2. Evaluation of Investment Cost
Thermo-economic analysis is carried out to estimate the cost of the electricity per year (kWh/year). In addition, the payback ratio, Internal Rate of Return and Benefit–Cost Ratio are also calculated. The cost of common equipment among the mixtures are estimated per the quotations obtained from local suppliers [38,39,40]. The equipment costs are provided in Table 10.
Table 10.
Cost of Common Equipment Among the Mixtures.
The cost of the working fluid mixture is estimated by taking a weighted average of individual cost of the fluid using the mass fraction. The individual cost of the working fluids are found from Alibaba.com [41]. The fuel costs are as provided in Table 11.
Table 11.
Working fluid mixture costs.
The operational cost and maintenance cost are estimated to be 1% of electromechanical equipment each and the insurance cost is 0.65% of the electromechanical components. Annual Cost of the solar-powered ORC system is the sum of Operational Cost, Maintenance Cost and Insurance Cost. The Annual Cost for mixtures is is provided in Table 12.
Table 12.
Annual cost of solar ORC system with different mixtures.
4.3. Economic Analysis of Solar ORC System
For the economic analysis purposes, the construction period for the system has been assumed to be one year. The economic lifetime is assumed to be 20 years and has no salvage value at the end of 20 years. An interest rate of 6% is used for the analysis. The operating hours for the system is considered to be 2084 h that corresponds to the average total annual sunlight hours in Ottawa, Canada [42]. Using the above parameters, the annual cash flow, present values, and annual equivalent cost (AEC) can be calculated [43]. Annual equivalent cost is a crucial parameter to evaluate the cost of electricity per kWh. It can be evaluated as follows:
where is the initial investment, is the interest rate, and is the economic lifetime of the system.
The net present value of all the cash flows can be evaluated as follows:
where is the net present value of the investment, is benefit of the investment each year and is the cost of investment each year.
The benefit–cost ratio is an index of the ratio of the present values of the benefit cash flows and cost cash flows. It is evaluated as follows:
The payback period is the total years required for NPV to reach 0. It is evaluated by solving the expression below:
The internal rate of return (IRR) is the critical rate of interest where NPV = USD 0. For investment to be economically feasible, IRR has to be more than or equal to the interest rate. It is evaluated by solving the expression below:
The annual cost of electricity is evaluated using two methods. One uses annual benefit and the other uses EAC as minimum benefit required to sustain the investment.
For this economic analysis, the payback period is assumed to be equal to the economic life cycle of the system i.e., 20 years since it is being considered as a community benefit investment.
Figure 22a,b present the annual cash flow and net present value during the life cycle of the ORC system for various working fluid mixtures. The cash flows and NPV for the three different mixtures are almost identical to each other. However, the solar ORC system with R245fa/R1252a (0.9/0.1) has the highest initial investment and Butane/Propane (0.8/0.2) has the lowest initial investment. In Figure 22a, negative cash flow means expenditure, and positive cash flow means benefits. In Figure 22b, negative NPV means that the investment is losing money. It can also be observed in Figure 22b that NPV = 0 at 20 years that is set to be the payback period for this economic analysis.
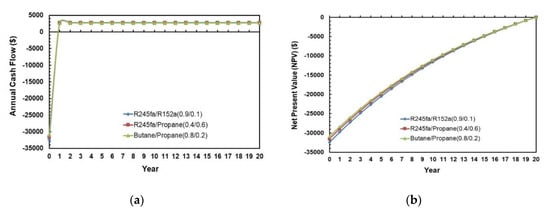
Figure 22.
(a) Annual cash flows; (b) Net present values during the life cycle of the ORC system for different mixtures.
Figure 23 illustrates the comparison between the selling price of electricity using the annual benefit and the EAC as the minimum benefit required to sustain the investment. The annual cost of electricity is evaluated using two methods. One uses Annual Benefit and the other uses Electricity Annual Cost methods as per Equations (26) and (27). It can be seem that there is a clear trend that selling price of electricity is higher if one takes Annual Benefit as the minimum benefits to sustain the investment. In general, R245fa/R152a (0.9/0.1) is the most economical of all, mostly due to its higher net work output production in similar operating conditions. The highest selling price of electricity is for butane/propane mixture, which is 0.29 USD/kWh.
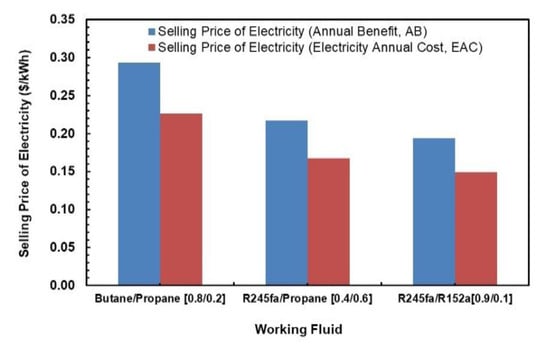
Figure 23.
Selling price of electricity comparisons.
4.4. Sensitivity Analysis
A sensitivity analysis provides an overview of the effects of the parameters on the NPV of the investment, selling price of the electricity, Benefit–cost Ratio, and the Payback Period. The different scenarios that are considered for the sensitivity analysis can be found in Table 13.
Table 13.
Scenarios examined in this study.
Table 14 represents the results of the NPV of NPV of all scenarios for ORC System with R245fa/R152a (0.9/0.1) working fluid and Figure 24a–c show the variation of NPV as different variables change for the solar ORC system with working fluid mixtures (a) R245fa/R152a (0.9/0.1); (b) R245fa/propane (0.4/0.6); (c) butane/propane (0.8/0.2). It can be noticed that the change in Annual Benefit (Scenarios 4–5) affects NPV the most followed by the change in investment cost (Scenario 2–3). NPV is least affected by the change in annual cost (Scenarios 6–7). The negative NPV means that one is losing money on its investment which can be seen in Scenarios 2, 5, 6, and 8. It can be concluded that increasing Annual Benefit and decreasing Investment Cost, Annual Benefit, and Interest Rate increases NPV.
Table 14.
NPV of all scenarios for ORC system with R245fa/R152a (0.9/0.1) mixture.
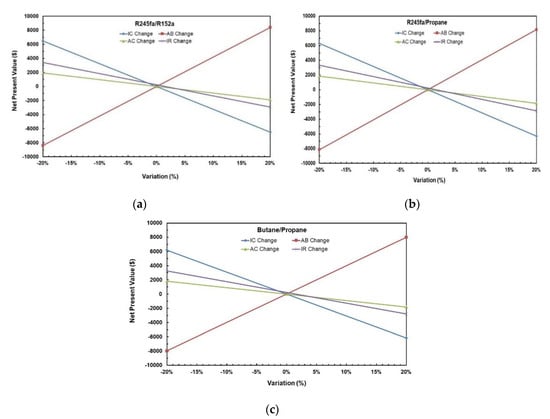
Figure 24.
Variation of NPV as different variables change for solar ORC system with working fluid mixtures (a) R245fa/R152a (0.9/0.1); (b) R245fa/propane (0.4/0.6); (c) butane/propane (0.8/0.2).
Table 15 provides the results of the investment criteria of all scenarios for the ORC system with R245fa/R152a (0.9/0.1) mixture. The selling price of the electricity with regards to Annual Benefits changes from 0.19 USD/kWh to 0.23 USD/kWh, whereas with regards to EAC, it changes from 0.15 USD/kWh to 0.18 USD/kWh. BCR lower than one and a high payback period are also not a good indication of a profitable investment. Best scenario as per the investment criteria is Scenario 4, which has the highest NPV, BCR, IRR and the lowest payback period and the selling price of electricity with regards to EAC. Although the payback period for the solar ORC system is relatively high, 14 years, which is nearly equal to life cycle of the system, the selling price is competitive to the average residential price of electricity. The average residential price of electricity in Canada is USD 0.174 per kWh. This price comprises both fixed and variable costs, and is derived on an average monthly utilisation of 1000 kWh. The average price reduces to USD 0.135 if the territories are omitted (14 February 2020) [44]. Therefore, this solar-driven ORC micro-CHP system is a promising system and would be an alternative to photovoltaic systems. It would be also well be used in remote locations as stand-alone system or in areas of hot developing countries where the electricity grid infrastructure is deficient.
Table 15.
Investment criteria of all scenarios for ORC system with R245fa/R152a (0.9/0.1) mixture.
5. Sustainable Development within Solar-Driven ORC System
Sustainable development is the progress that sustains the necessaries of the current without conceding the forthcoming demands. Since ORC is being operated through solar energy, it significantly reduces the production of greenhouse gas emissions if fossil fuels are used instead, and provides an alternative way to produce electricity which can be beneficial for especially developing countries or remote locations lacking electricity. In the event that a solar-driven ORC system is utilised as an alternative of petroleum-based plants for electricity purposes, the saved petroleum and the reduced CO2 emissions, can be estimated by the following equations [45,46]:
where is the annual sunlight hours of the city; for this analysis, the city of Ottawa’s average annual sunlight hours, 2084 h, is considered; and are the quantity of petroleum consumed to produce 1 kW of electricity and the quantity of CO2 emissions if 1 kW electric energy is generated by a petroleum-based plant, respectively. For this analysis, these amounts are taken as 0.266 L/kWh and 0.894 kg/kWh, respectively [45,46].
Figure 25a,b depict a comparison of predicted savings in petroleum and reduction in CO2 emissions for different mixtures. Two cases were considered for each fluid; one with normal sunlight hours and the other with a storage tank that would double the normal hours. It can be clearly observed from these figures that the mixtures R245fa/R152a (0.9/0.1) followed by the R245/propane have the most savings in petroleum as well as the highest reduction in CO2 emissions. These values significantly increase if a storage tank is added to the system.
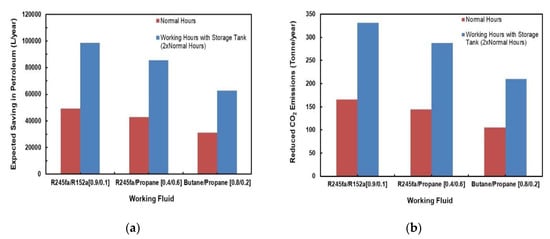
Figure 25.
Comparison of predicted (a) savings in petroleum; (b) reduction in CO2 emissions for different mixtures.
Sustainability Index is also evaluated for these mixtures using Equation (20). Figure 26 illustrates a comparison of the Sustainability Index for the different mixtures assessed. It can be seen that R245fa/Propane (0.4/0.6) has the highest sustainability index followed by butane/propane (0.8/0.2) and R245fa/R152a (0.9/0.1).
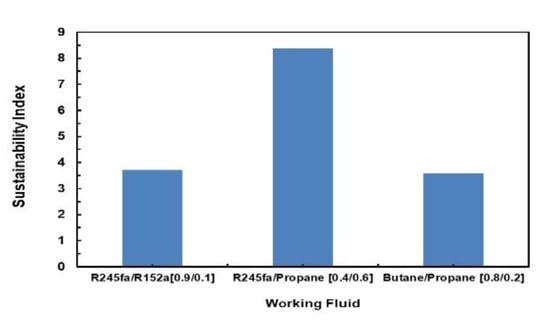
Figure 26.
Comparison of sustainability index for different mixtures.
6. Conclusions
This study investigated the thermodynamic, economic, and sustainability feasibility of a solar-driven ORC system for micro-cogeneration application in buildings. A thermodynamic model was developed for simulating an ORC both with and without a regenerator and with zeotropic working fluid mixtures. Twelve zeotropic mixtures with various compositions of R245fa/R152a, R245fa/propane, R245fa/hexane, R245fa/heptane, butane/propane, butane/hexane, butane/heptane, pentane/hexane, isobutane/propane, isobutane/hexane, isobutane/heptane, and isopentane/hexane were evaluated and compared to identify the best combinations of mixtures for deriving high system cycle efficiency. The study also examined the effects of the volume ratio, the evaporation, and condensation temperature glides of the zeotropic mixtures on the ORC thermodynamic performance. Following a detailed analysis of each mixture, R245fa/propane and butane/propane are selected for parametric study to examine the effects of operating parameters on the system’s efficiency and sustainability index. Appropriate operating conditions selected to simulate available waste heat from industrial processes or solar water heaters where possible and municipal water supply for cooling the working fluid. All fluid mixtures with the exception of mixtures with heptane and hexane compositions would have the potential to be implemented with a solar energy system or waste heat for the heating source. Most of the working fluid mixtures exhibit potential for power generation at a residential scale. Each working fluid could be cooled by existing water sources from the local municipality or ground water.
The thermodynamic performance results disclosed that for zeotropic mixtures, there is an optimal composition range within which binary mixtures tend to achieve higher system efficiency than the component pure fluids. In addition, a substantial increase of cycle efficiencies can be obtained with a regenerative ORC, with cycle efficiencies in the range of 2.3–9.8% and 8.1–18.5% for ORC without and with regeneration, respectively. The maximum net power output of the ORC system using mixtures corresponded to an optimal mixture that provided the best temperature glides but not always the highest temperature glides. Using zeotropic mixtures could expand the limitations of using WFs for low-temperature solar organic Rankine cycles. Results also revealed that butane/propane and R245fa/propane have the optimal outputs at operating condition with hot source temperature of 85 °C, where R245fa/propane (0.4/0.6) has net work output of 7.86 kW followed by butane/propane (0.8/0.2) with the net work output of 5.7 kW. With parametric study on these fluids, it was found that the optimal conditions for these mixtures were at the hot source temperature 95 °C and cold temperature 20 °C with mixture compositions R245fa/Propane (0.6/0.4) and butane/propane (0.8/0.2) and with cycle efficiencies of 9.59% and 7.49%, respectively.
In the subsequent part of this study, a detailed economic analysis and a sensitivity analysis of the solar ORC systems with mixtures R245fa/R152a (0.9/0.1), R245fa/propane (0.4/0.6), and butane/propane (0.8/0.2), were performed to evaluate the selling price of produced electricity and to assess the influence in the NPV of the solar ORC system. Results disclosed that using a R245fa/R152a (0.9/0.1) mixture was the most economical mixture out of three in terms of selling price of electricity, about 0.15 USD/kWh, with a payback period of 14 years. While the payback period for the system is relatively high, which is nearly equal to life cycle of the system, the selling price is competitive to the average residential price of electricity. Therefore, this solar-driven ORC micro-CHP system is a promising system and would be an alternative to photovoltaic systems. It would be well used in remote locations as stand-alone system or in areas of countries where the electricity grid infrastructure is deficient. R245fa/R152a (0.9/0.1) mixture also had the most savings in petroleum as well as the highest reduction in CO2 emissions. However, R245fa/propane mixture has the highest sustainability index out of the three mixtures.
Finally, it is hoped that the present work will help in accurate designs and assessments of thermo-economic and sustainability performance of solar-driven regenerative ORC systems using ecological working fluid mixtures for use in buildings, as well as to find the optimum operating conditions for maximum performance and minimum cost.
Author Contributions
W.Y. and E.E. proposed the core idea and developed the methodology. W.Y. developed the models. W.Y., P.T. and M.L. performed the simulations, exported the results and analysed the data. P.T. and M.L. contributed to the design of the methodology. W.Y., E.E., P.T. and M.L. contributed to the writing of the paper. W.Y. and E.E. revised the paper. All authors have read and agreed to the published version of the manuscript.
Funding
Funding for this work was provided by Natural Resources Canada through the Program of Energy Research and Development.
Acknowledgments
The authors would like to thank the Office of Energy Research and Development (OERD) of Natural Resources Canada for their valuable financial support.
Conflicts of Interest
The authors declare no conflict of interest.
Nomenclature
| AB | annual benefit |
| AC | annual cost |
| AEC | annual equivalent cost |
| BCR | Benefit–cost ratio |
| CHP | combined heat and power |
| GHG | greenhouse gas |
| HC | hydrocarbon |
| HFC | hydrofluorocarbon |
| IC | investment cost |
| IR | interest rate |
| IRR | internal rate of return |
| NPV | net present value |
| ORC | organic Rankine cycle |
| O and M | operation and maintenance |
| R134a | 1,1,1,2-Tetrafluoroethane (CF3CH2F) |
| R152a | 1,1-Difluoroethane (C2H4F2) (replacement for R134a) |
| R245fa | 1,1,1,3,3-Pentafluoropropane is a hydrofluorocarbon (C3H3F5) |
| R290 | n-propane (C3H8) |
| R600 | n-butane(C4H10) |
| R600a | isobutane (C4H10) |
| R601 | n-pentane (C5H12) |
| R601a | isopentane (C5H12) |
Appendix A. Thermodynamic Diagrams of Working Fluid Mixtures
The temperature-entropy (T-s), temperature-masse fraction and pressure-mass fraction diagrams for R245fa/propane (R290), R245fa/hexane, R245fa/heptane, butane (R600)/propane (R290), butane (R600)/hexane, butane (R600)/heptane, isobutene (R600a)/propane (R290), isobutene (R600a)/hexane, pentane (R601)/hexane, isopentane (R600a)/hexane, and R245fa/R152a mixtures are provided in Figure A1, Figure A2, Figure A3, Figure A4, Figure A5, Figure A6, Figure A7, Figure A8, Figure A9, Figure A10, Figure A11 and Figure A12. All the properties of mixtures and the processing of the above-mentioned diagrams are taken or calculated from REFPROP database [36].

Figure A1.
Thermodynamic diagrams of R245fa/propane mixture.
Figure A1.
Thermodynamic diagrams of R245fa/propane mixture.


Figure A2.
Thermodynamic diagrams of R245fa/hexane mixture.
Figure A2.
Thermodynamic diagrams of R245fa/hexane mixture.


Figure A3.
Thermodynamic diagrams of R245fa/heptane mixture.
Figure A3.
Thermodynamic diagrams of R245fa/heptane mixture.


Figure A4.
Thermodynamic diagrams of butane/propane.
Figure A4.
Thermodynamic diagrams of butane/propane.


Figure A5.
Thermodynamic diagrams of butane/hexane.
Figure A5.
Thermodynamic diagrams of butane/hexane.


Figure A6.
Thermodynamic diagrams of butane/heptane.
Figure A6.
Thermodynamic diagrams of butane/heptane.


Figure A7.
Thermodynamic diagrams of isobutane/propane.
Figure A7.
Thermodynamic diagrams of isobutane/propane.


Figure A8.
Thermodynamic diagrams of isobutane/hexane.
Figure A8.
Thermodynamic diagrams of isobutane/hexane.


Figure A9.
Thermodynamic diagrams of isobutane/heptane.
Figure A9.
Thermodynamic diagrams of isobutane/heptane.


Figure A10.
Thermodynamic diagrams of pentane/hexane.
Figure A10.
Thermodynamic diagrams of pentane/hexane.


Figure A11.
Thermodynamic diagrams of isopentane/hexane.
Figure A11.
Thermodynamic diagrams of isopentane/hexane.


Figure A12.
Thermodynamic diagrams of R245fa/R152a mixture.
Figure A12.
Thermodynamic diagrams of R245fa/R152a mixture.

References
- International Energy Agency. Energy Technology Perspectives. Towards Sustainable Urban Energy Systems. 2016. Available online: https://www.iea.org/publications/freepublications/publication/EnergyTechnologyPerspectives2016_ExecutiveSummary_EnglishVersion.pdf (accessed on 5 October 2020).
- Goswami, D.; Vijayaraghavan, S.; Lu, S.; Tamm, G. New and emerging developments in solar energy. Sol. Energy 2004, 76, 33–43. [Google Scholar] [CrossRef]
- Chen, H.; Goswami, D.Y.; Stefanakos, E.K. A review of thermodynamic cycles and working fluids for the conversion of low-grade heat. Renew. Sustain. Energy Rev. 2010, 14, 3059–3067. [Google Scholar] [CrossRef]
- Chan, C.; Ling-Chin, J.; Roskilly, A. A review of chemical heat pumps, thermodynamic cycles and thermal energy storage technologies for low grade heat utilisation. Appl. Therm. Eng. 2013, 50, 1257–1273. [Google Scholar] [CrossRef]
- Peris, B.; Navarro-Esbri, J.; Moles, F.; Gonzalez, M.; Mota-Babiloni, A. Experimental characterization of an ORC (organic Rankine cycle) for power and CHP (combined heat and power) applications from low grade heat sources. Energy 2015, 82, 269–276. [Google Scholar] [CrossRef]
- Pereira, J.S.; Ribeiro, J.B.; Mendes, R.; Vaz, G.C.; André, J.C. ORC based micro-cogeneration systems for residential application—A state of the art review and current challenges. Renew. Sustain. Energy Rev. 2018, 92, 728–743. [Google Scholar] [CrossRef]
- Yaici, W.; Entchev, E.; Longo, M. Performance analysis of regenerative organic Rankine cycle system for solar micro combined heat and power generation application. In Proceedings of the IEEE 2018 7th International Conference on Renewable Energy Research and Applications (ICRERA), Paris, France, 14–17 October 2018; pp. 549–554. [Google Scholar]
- Yaïci, W.; Entchev, E. Thermodynamic and performance study of solar regenerative organic Rankine cycle system for use in residential micro-combined heat and power generation. In Proceedings of the ASME 2019 13th International Conference on Energy Sustainability, Bellevue, WA, USA, 14–17 July 2019. [Google Scholar]
- Bao, J.; Zhao, L. A review of working fluid and expander selections for organic Rankine cycle. Renew. Sustain. Energy Rev. 2013, 24, 325–342. [Google Scholar] [CrossRef]
- Tocci, L.; Pal, T.; Pesmazoglou, I.; Franchetti, B. Small Scale Organic Rankine Cycle (ORC): A Techno-Economic Review. Energies 2017, 10, 413. [Google Scholar] [CrossRef]
- Rahbar, K.; Mahmoud, S.; Al-Dadah, R.K.; Moazami, N.; Mirhadizadeh, S.A. Review of organic Rankine cycle for small-scale applications. Energy Convers. Manag. 2017, 134, 135–155. [Google Scholar] [CrossRef]
- Mahmoudi, A.; Fazli, M.; Morad, M. A recent review of waste heat recovery by Organic Rankine Cycle. Appl. Therm. Eng. 2018, 143, 660–675. [Google Scholar] [CrossRef]
- Tchanche, B.F.; Papadakis, G.; Lambrinos, G.; Frangoudakis, A. Fluid selection for a low-temperature solar organic Rankine cycle. Appl. Therm. Eng. 2009, 29, 2468–2476. [Google Scholar] [CrossRef]
- Lakew, A.A.; Bolland, O. Working fluids for low-temperature heat source. Appl. Therm. Eng. 2010, 30, 1262–1268. [Google Scholar] [CrossRef]
- Rayegan, R.; Tao, Y. A procedure to select working fluids for Solar Organic Rankine Cycles (ORCs). Renew. Energy 2011, 36, 659–670. [Google Scholar] [CrossRef]
- Angelino, G.; Colonna Di Paliano, P. Multi-component working fluids for organic Rankine Cycles (ORCs). Energy 1998, 23, 449–463. [Google Scholar] [CrossRef]
- Mago, P.J.; Chamra, L.M.; Srinivasan, K.; Somayaji, C. An examination of regenerative organic Rankine cycles using dry fluids. Appl. Therm. Eng. 2008, 28, 998–1007. [Google Scholar] [CrossRef]
- Wang, X.; Zhao, L. Analysis of zeotropic mixtures used in low-temperature solar Rankine cycles for power generation. Sol. Energy 2009, 83, 605–613. [Google Scholar] [CrossRef]
- Wang, J.; Zhao, L.; Wang, X. A comparative study of pure and zeotropic mixtures in low-temperature solar Rankine cycle. Appl. Energy 2010, 87, 3366–3373. [Google Scholar] [CrossRef]
- Heberle, F.; Preißinger, M.; Brüggemann, D. Zeotropic mixtures as working fluids in Organic Rankine Cycles for low-enthalpy geothermal resources. Renew. Energy 2012, 37, 364–370. [Google Scholar] [CrossRef]
- Chys, M.; Broek, M.V.D.; Vanslambrouck, B.; De Paepe, M. Potential of zeotropic mixtures as working fluids in organic Rankine cycles. Energy 2012, 44, 623–632. [Google Scholar] [CrossRef]
- Garg, P.; Kumar, P.; Srinivasan, K.; Dutta, P. Evaluation of isopentane, R-245fa and their mixtures as working fluids for organic Rankine cycles. Appl. Therm. Eng. 2013, 51, 292–300. [Google Scholar] [CrossRef]
- Andreasen, J.G.; Larsen, U.; Knudsen, T.; Pierobon, L.; Haglind, F. Selection and optimization of pure and mixed working fluids for low grade heat utilization using organic Rankine cycles. Energy 2014, 73, 204–213. [Google Scholar] [CrossRef]
- Liu, Q.; Duan, Y.; Yang, Z. Effect of condensation temperature glide on the performance of organic Rankine cycles with zeotropic mixture working fluids. Appl. Energy 2014, 115, 394–404. [Google Scholar] [CrossRef]
- Lecompte, S.; Ameel, B.; Ziviani, D.; Broek, M.V.D.; De Paepe, M. Exergy analysis of zeotropic mixtures as working fluids in Organic Rankine Cycles. Energy Convers. Manag. 2014, 85, 727–739. [Google Scholar] [CrossRef]
- Kang, Z.; Zhu, J.; Lu, X.; Li, T.; Wu, X. Parametric optimization and performance analysis of zeotropic mixtures for an organic Rankine cycle driven by low-medium temperature geothermal fluids. Appl. Therm. Eng. 2015, 89, 323–331. [Google Scholar] [CrossRef]
- Feng, Y.; Hung, T.; Zhang, Y.; Li, B.; Yang, J.; Shi, Y. Performance comparison of low-grade ORCs (organic Rankine cycles) using R245fa, pentane and their mixtures based on the thermoeconomic multi-objective optimization and decision makings. Energy 2015, 93, 2018–2029. [Google Scholar] [CrossRef]
- Feng, Y.-Q.; Hung, T.-C.; Wu, S.-L.; Lin, C.-H.; Li, B.-X.; Huang, K.-C.; Qin, J. Operation characteristic of a R123-based organic Rankine cycle depending on working fluid mass flow rates and heat source temperatures. Energy Convers. Manag. 2017, 131, 55–68. [Google Scholar] [CrossRef]
- Liu, Q.; Shen, A.; Duan, Y. Parametric optimization and performance analyses of geothermal organic Rankine cycles using R600a/R601a mixtures as working fluids. Appl. Energy 2015, 148, 410–420. [Google Scholar] [CrossRef]
- Sadeghi, M.; Nemati, A.; Ghavimi, A.; Yari, M. Thermodynamic analysis and multi-objective optimization of various ORC (organic Rankine cycle) configurations using zeotropic mixtures. Energy 2016, 109, 791–802. [Google Scholar] [CrossRef]
- Xi, H.; Li, M.-J.; He, Y.-L.; Zhang, Y. Economical evaluation and optimization of organic Rankine cycle with mixture working fluids using R245fa as flame retardant. Appl. Therm. Eng. 2017, 113, 1056–1070. [Google Scholar] [CrossRef]
- Wu, Y.; Zhu, Y.; Yu, L. Thermal and economic performance analysis of zeotropic mixtures for Organic Rankine Cycles. Appl. Therm. Eng. 2016, 96, 57–63. [Google Scholar] [CrossRef]
- Abadi, G.B.; Kim, K.C. Investigation of organic Rankine cycles with zeotropic mixtures as a working fluid: Advantages and issues. Renew. Sustain. Energy Rev. 2017, 73, 1000–1013. [Google Scholar] [CrossRef]
- Pang, K.-C.; Chen, S.-C.; Hung, T.-C.; Feng, Y.-Q.; Yang, S.-C.; Wong, K.-W.; Lin, J.-R. Experimental study on organic Rankine cycle utilizing R245fa, R123 and their mixtures to investigate the maximum power generation from low-grade heat. Energy 2017, 133, 636–651. [Google Scholar] [CrossRef]
- Zhai, H.; An, Q.; Shi, L. Zeotropic mixture active design method for organic Rankine cycle. Appl. Therm. Eng. 2018, 129, 1171–1180. [Google Scholar] [CrossRef]
- Lemmon, E.W.; Huber, M.L.; McLinden, M.O. NIST Standard Reference Database 23: Reference Fluid Thermodynamic and Transport. Properties-REFPROP; Version 10.0; National Institute of Standards and Technology, Standard Reference Data Program: Gaithersburg, MD, USA, 2018. [Google Scholar]
- Dincer, I.; Rosen, M.A. Exergy, Environment and Sustainable Development; Elsevier BV: Amsterdam, The Netherlands, 2007; pp. 36–59. [Google Scholar]
- Enerworks. Available online: https://enerworks.com/ (accessed on 23 October 2020).
- Solacity. Available online: https://www.solacity.com/ (accessed on 23 October 2020).
- iGen Technologies. Available online: http://igentechnologies.ca/ (accessed on 23 October 2020).
- Alibaba.com. Available online: https://www.alibaba.com/product-detail/Eco-friendly-refrigerant-gas-r245fa-price_60582435211.html?spm=a2700.7724857.normalList.7.4bcd431fuhTV3C&s=p (accessed on 5 October 2020).
- Current Results-Weather and Science Facts. Sunshine in Canadian Cities: Average Hours & Days a Year. Available online: https://www.currentresults.com/Weather/Canada/Cities/sunshine-annual-average.php (accessed on 5 October 2020).
- Park, C.S. Engineering Economics; Prentice Hall: Upper Saddle River, NJ, USA, 2007. [Google Scholar]
- Urban, R. Electricity Prices in Canada 2020. 14 February 2020. Available online: https://energyhub.org/wp-content/uploads/Electricity-Prices-in-Canada-2020.pdf and https://www.energyhub.org/electricity-prices/#:~:text=The%20average%20residential%20price%20of,if%20you%20exclude%20the%20territories (accessed on 5 October 2020).
- Yamaguchi, H.; Zhang, X.; Fujima, K.; Enomoto, M.; Sawada, N. Solar energy powered Rankine cycle using supercritical CO2. Appl. Therm. Eng. 2006, 26, 2345–2354. [Google Scholar] [CrossRef]
- Baral, S.; Kim, D.; Yun, E.; Kim, K.C. Experimental and Thermoeconomic Analysis of Small-Scale Solar Organic Rankine Cycle (SORC) System. Entropy 2015, 17, 2039–2061. [Google Scholar] [CrossRef]


Publisher’s Note: MDPI stays neutral with regard to jurisdictional claims in published maps and institutional affiliations. |
© 2020 by the authors. Licensee MDPI, Basel, Switzerland. This article is an open access article distributed under the terms and conditions of the Creative Commons Attribution (CC BY) license (http://creativecommons.org/licenses/by/4.0/).