Article

In Vitro Evidences of Different Fibroblast Morpho-Functional Responses to Red, Near-Infrared and Violet-Blue Photobiomodulation: Clues for Addressing Wound Healing

by
Flaminia Chellini
1,†,
Alessia Tani
1,†,
Sandra Zecchi-Orlandini
1,
Marco Giannelli
2 and
Chiara Sassoli
1,*
1
Department of Experimental and Clinical Medicine, Section of Anatomy and Histology, University of Florence, Largo Brambilla 3, 50134 Florence, Italy
2
Odontostomatologic Laser Therapy Center, Dioscoride Center, Via dell’Olivuzzo 162, 50143 Florence, Italy
*
Author to whom correspondence should be addressed.
These authors contributed equally to the work.
Appl. Sci. 2020, 10(21), 7878; https://doi.org/10.3390/app10217878
Submission received: 12 October 2020 / Revised: 30 October 2020 / Accepted: 31 October 2020 / Published: 6 November 2020
(This article belongs to the Special Issue Biomedical Optics and Engineering)

Abstract

:
Although photobiomodulation (PBM) has proven promising to treat wounds, the lack of univocal guidelines and of a thorough understanding of light–tissue interactions hampers its mainstream adoption for wound healing promotion. This study compared murine and human fibroblast responses to PBM by red (635 ± 5 nm), near-infrared (NIR, 808 ± 1 nm), and violet-blue (405 ± 5 nm) light (0.4 J/cm2 energy density, 13 mW/cm2 power density). Cell viability was not altered by PBM treatments. Light and confocal laser scanning microscopy and biochemical analyses showed, in red PBM irradiated cells: F-actin assembly reduction, up-regulated expression of Ki67 proliferation marker and of vinculin in focal adhesions, type-1 collagen down-regulation, matrix metalloproteinase-2 and metalloproteinase-9 expression/functionality increase concomitant to their inhibitors (TIMP-1 and TIMP-2) decrease. Violet-blue and even more NIR PBM stimulated collagen expression/deposition and, likely, cell differentiation towards (proto)myofibroblast phenotype. Indeed, these cells exhibited a higher polygonal surface area, stress fiber-like structures, increased vinculin- and phospho-focal adhesion kinase-rich clusters and α-smooth muscle actin. This study may provide the experimental groundwork to support red, NIR, and violet-blue PBM as potential options to promote proliferative and matrix remodeling/maturation phases of wound healing, targeting fibroblasts, and to suggest the use of combined PBM treatments in the wound management setting.

Graphical Abstract

1. Introduction

Photobiomodulation (PBM) is a medical technique emerging as a promising therapy to treat different medical conditions including wounds [1,2,3]. It represents a painless and non-invasive approach, consisting in the direct application on the target tissue of light in the visible or near-infrared (NIR) spectral regions—wavelengths (λ) ranging from 400 to 1100 nm—with a power density less than 100 mW/cm2 and energy density less than 10 J/cm2 at the target, which may be delivered by different devices such as a laser (coherent light) or LED (light emitting diode, non-coherent light). These light wavelengths have been demonstrated to penetrate through tissues wherein they act at the cellular and molecular levels, mainly absorbed by endogenous mitochondrial photoacceptor/chromophores and/or activating membrane ion channels. In turn photo-physical and photo-chemical reactions are induced, which result in the modulation of different cellular processes [1,4,5,6]. Given these light features, the light-induced thermal, sound or vibration effects are negligible, and no cell/tissue damages generally occur. In particular, the ability of PBM to stimulate many key processes necessary for the effective accomplishment of wound healing such as inflammatory reaction reduction, angiogenesis promotion, fibroblast proliferation, collagen production and granulation tissue formation has been demonstrated [3,7,8,9,10,11,12,13,14,15,16,17]. On the other hand, some studies have reported limited effectiveness or inefficacy or even inhibitory effects of PBM treatments for wound management, thus questioning the use of PBM in the clinical practice as actual therapeutic option for promotion of wound healing [18,19,20,21,22,23,24,25,26,27,28]. The main reason for these discordant results may certainly depend on the individual clinical conditions, the heterogeneity of the current clinical trials, the chosen animal experimental model, as well as the type and severity of the lesion, but most likely on the high degree of complexity inherent to this technology. Indeed, a large number of devices and parameters, including wavelength, energy density, power density, pulse structure, irradiation time, and repetition regimen, have been tested [1,29,30]. In addition it must be considered that the occurrence of a biphasic dose-response (whereby low levels and high levels of light exert stimulatory and inhibitory effects respectively, and there is an optimum value of PBM energy density) reported for PBM in multiple studies may account for discordant results [6,31]. Moreover, it is worthy to say that another issue possibly preventing the mainstream adoption of this therapy is the lack of full comprehension of the interactions between light and tissues at the cellular and even molecular levels [5,6]. Therefore, studies aimed at the identification of the most appropriate light wavelengths and the optimum operating parameters of a PBM treatment able to impact on the functionality of the key cellular elements involved in the wound healing process and thereby able to really elicit biological effects, improving tissue repair/regeneration, are strongly encouraged. Such kind of studies may indeed contribute to define univocal standardized guidelines and to arrange protocols, still lacking, for an effective use of PBM in wound healing, able to elicit positive clinical outcomes. On these bases, the aim of the present study was to compare the effects of three different PBM treatments by red (635 nm), NIR (808 nm), and violet-blue (405 nm) light delivered at a constant energy density of 0.4 J/cm2 and power density of 13 mW/cm2 by diode lasers (635 and 808 nm) and LED (405 nm), with a single exposure on cultured in vitro fibroblasts, actually the first cell type migrating and accumulating at the lesion site, responsible for the provisional extracellular matrix (ECM) deposition and traction/contraction force generation to facilitate wound closure [32,33]. The rationale of the choice of the tested wavelengths is based on the fact that the optical spectral range of red and NIR is widely regarded as optical therapeutic window for wound management wherein the light penetration efficiency in the tissue is maximum. However, also shorter wavelengths in the range of green or blue have been demonstrated to elicit biological effects and exert benefits for wound healing [6,10,13]. In particular, we focused the investigation on some cellular morpho-functional aspects, namely cell morphology, cytoskeleton assembly, proliferation, collagen synthesis, and remodeling. The findings of the present study highlight that red PMB treatment mainly promotes fibroblast proliferation and the cellular capability to degrade/remodel collagen, whereas violet-blue and even more so NIR PBM, stimulate the synthetic and secretive activities of the cells in terms of collagen expression and deposition, and likely the cell differentiation towards proto- or myofibroblast phenotype.

2. Materials and Methods

2.1. Cell Culture

Murine NIH/3T3 fibroblasts (American Type Culture Collection, ATCC, Manassas, VA, USA) and human dermal HDF-α fibroblasts (ScienCell, Carlsbad, CA, USA), were routinely cultured in different plastic culture plates (6-well plate, well diameter: 30 mm; 24-well plate, well diameter: 18 mm) or on glass coverslips put on the bottom of a 6-well plate in proliferation medium (PM: DMEM plus 10% fetal bovine serum (FBS) and 1% penicillin/streptomycin; Sigma, Milan, Italy). After exposure to PBM treatments, the cells were cultured in fresh PM for further 24 h or 5 days. Cells not subjected to PBM treatments served as controls.

2.2. PBM Treatments

PBM treatments were performed by using two diode lasers one emitting at λ = 635 ± 5 nm and the other one (GaAlAs laser) emitting at λ = 808 ± 10 nm or by using a LED emitting at λ = 405 ± 5 nm (Dental Laser System 4 × 4TM, General Project Ltd., Montespertoli, Florence, Italy). The three light devices are included in a single instrument. Detailed device specifications and parameters are reported in Table 1.
The irradiation was performed in continuous wave, in non-contact mode for 30 s (single exposure of each well containing the cells). The culture plate target diameter /surface irradiated area were 30 mm/706.9 mm2 and 18 mm/273 mm2. The power density was 12.59 mW/cm2 and the energy density at target was 0.378 J/cm2. To avoid scattered irradiation and overlapping, cells were seeded in separated, distant wells. Moreover, a black shield was employed to isolate each single well during irradiation. The cells undergoing the different PBM treatments were seeded in different culture plates. The handpieces (Figure 1) were kept at distance (see Table 1) with a delivery arm precisely positioned above the target and perpendicular to the irradiated surface area.
All treatments were performed under ‘‘clean bench’’ conditions and the temperature was monitored and maintained below thermal damage threshold as previously reported [34].

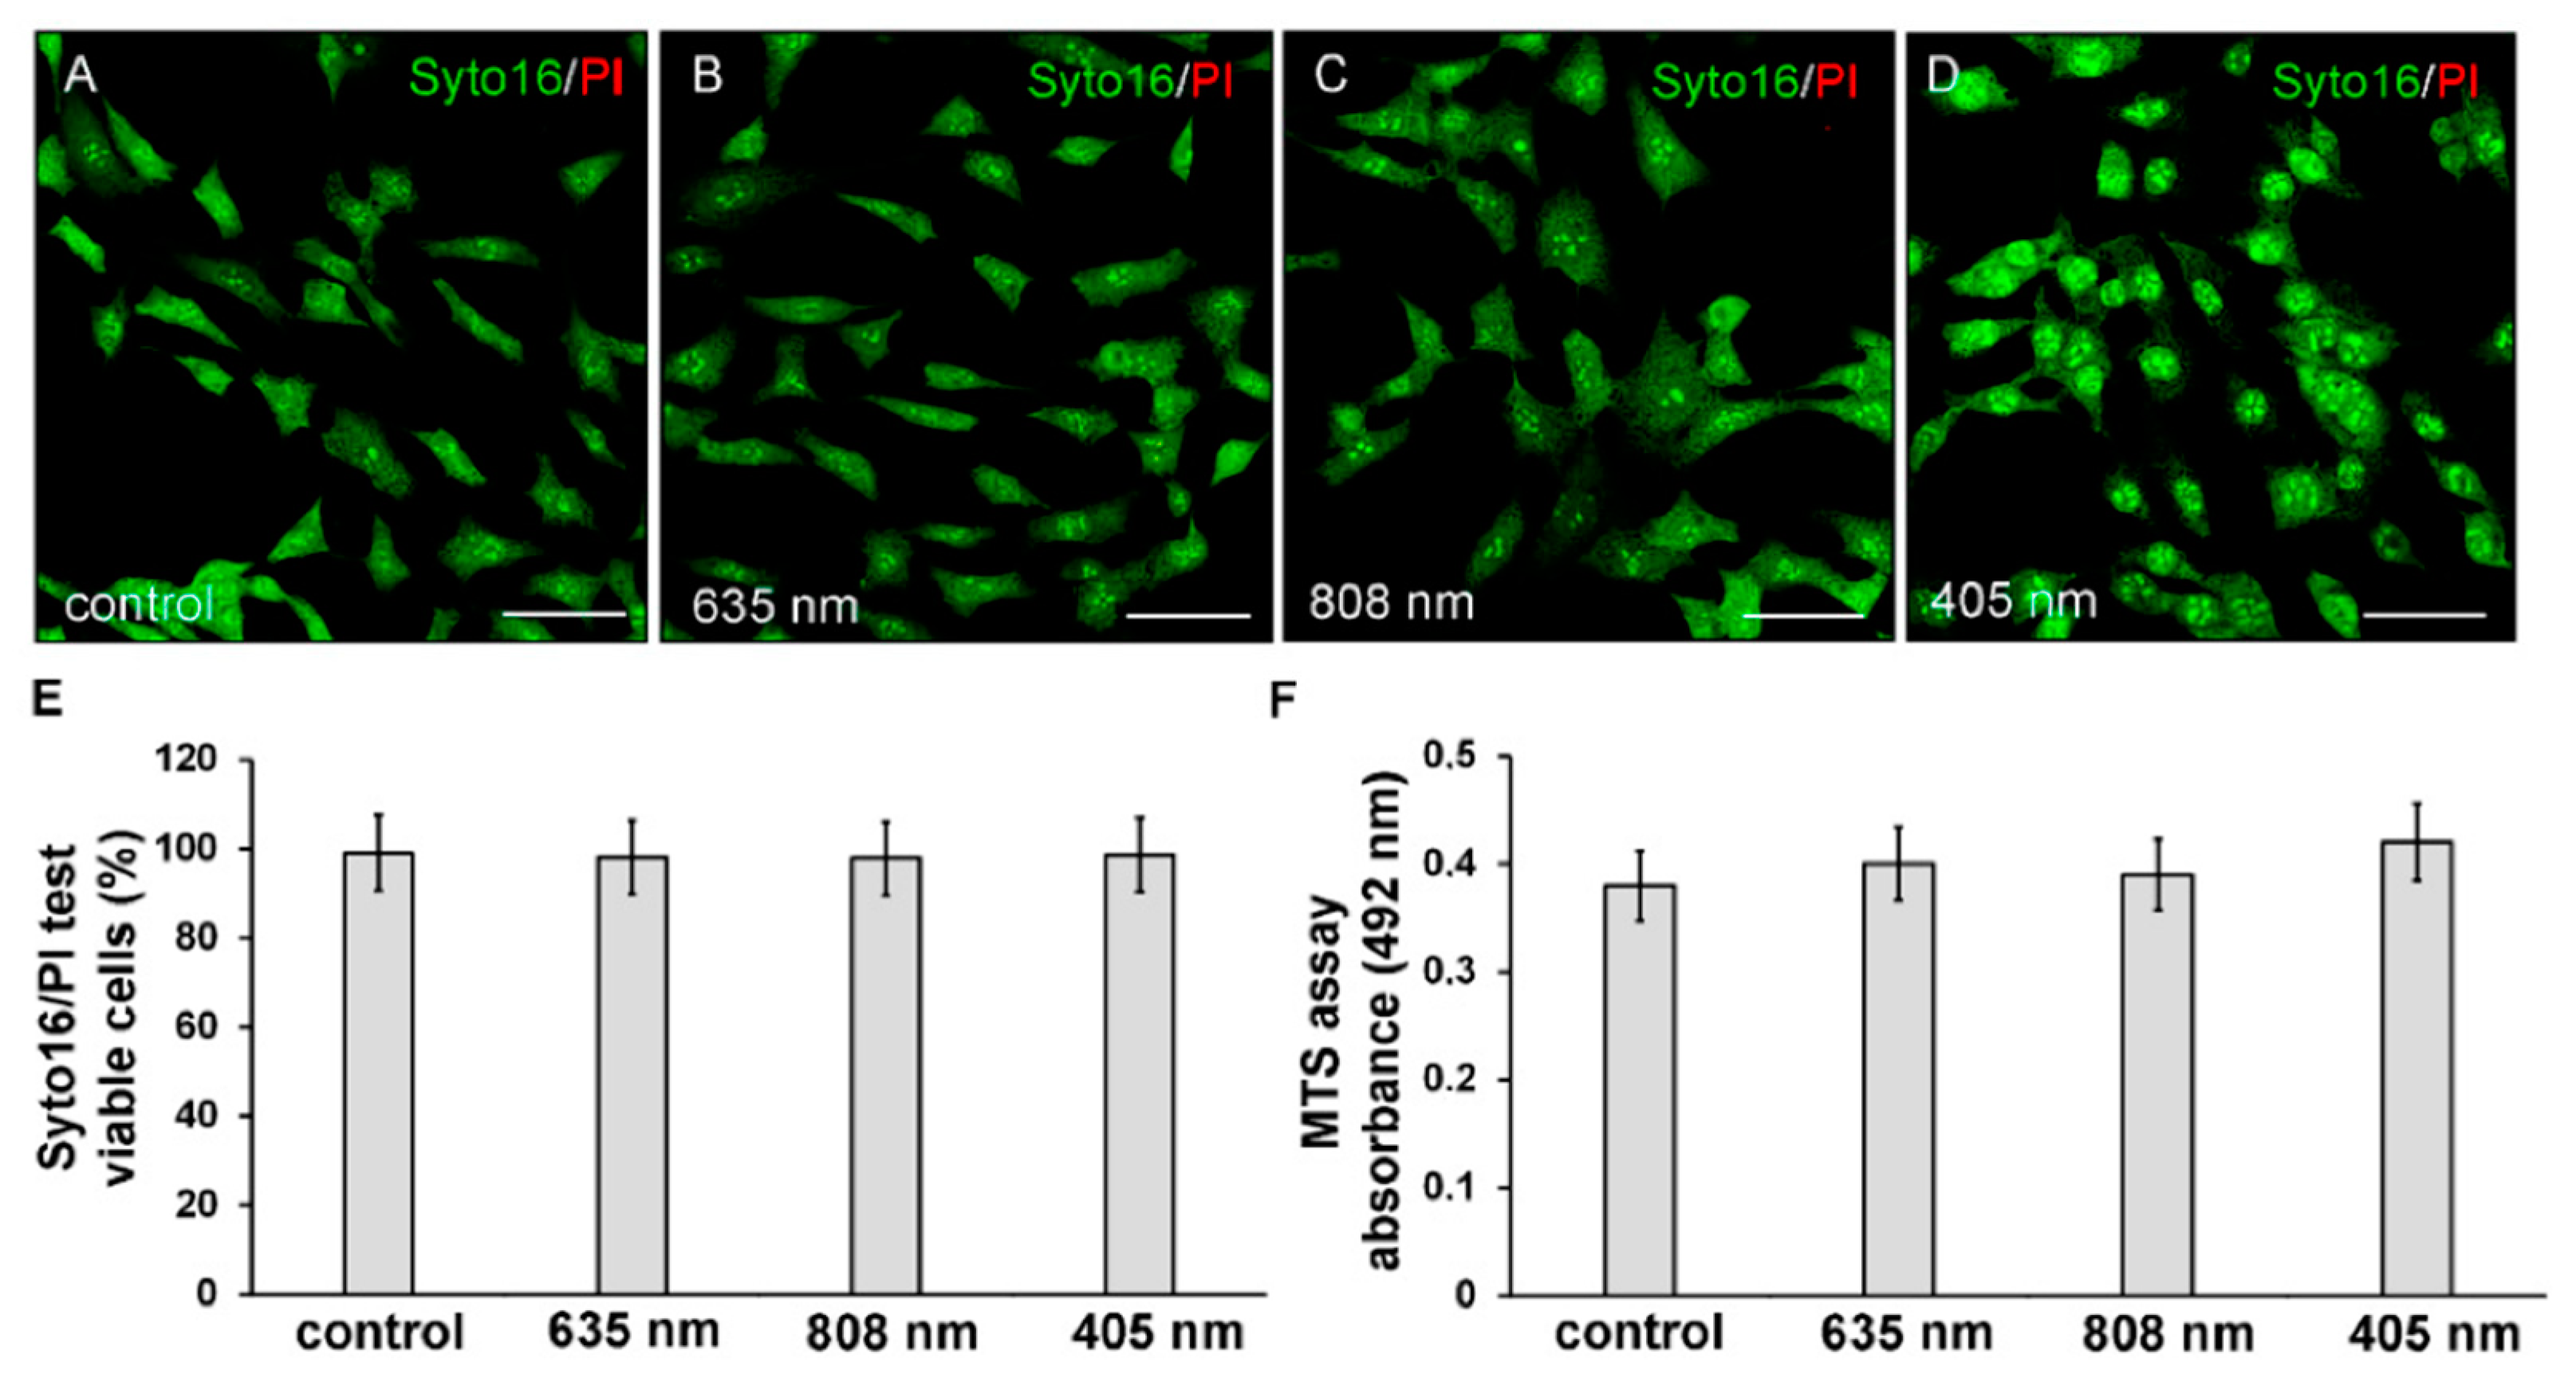
2.3. Cell Viability: Syto16/PI and MTS Assays

NIH/3T3 fibroblast cell viability was evaluated with two different assays. The cells were subjected to Syto16/Propidium Iodide (PI) DNA staining test as reported previously [34]. In particular, either not irradiated control cells and cells subjected to PBM treatments were cultured on glass coverslips for 24 h, incubated at 37 °C with a Syto16 (1:2000, Molecular Probes, Eugene, OR, USA) and PI (1:100, Molecular Probes) mix solution for 15 min and then fixed in 0.5% buffered paraformaldehyde (PFA, Sigma) for 10 min at room temperature (RT).
The marked cells were analyzed with a confocal Leica TCS SP5 microscope (Leica Microsystems, Mannheim, Germany). Observations and image acquisition were conducted as indicated below in the paragraph entitled “Confocal laser scanning microscopy”.
For each cell preparation (at least three independent experiments carried out in triplicate), the percentage of Syto16 positive viable cells was assessed in at least 10 random microscopic fields (63× objective; 200 × 200 μm2).
The cells were also processed for MTS assay as previously reported [34]. Briefly, either not irradiated control cells and cells subjected to PBM treatments were grown in a 24-well plate for 24 h and then cultured in phenol-free fresh PM plus MTS test solution for 4 h. Then, the optical density (OD, 492 nm) was recorded by using a multi-well scanning spectrophotometer (ELISA reader; Amersham, Pharmacia Biotech, Cambridge, UK).

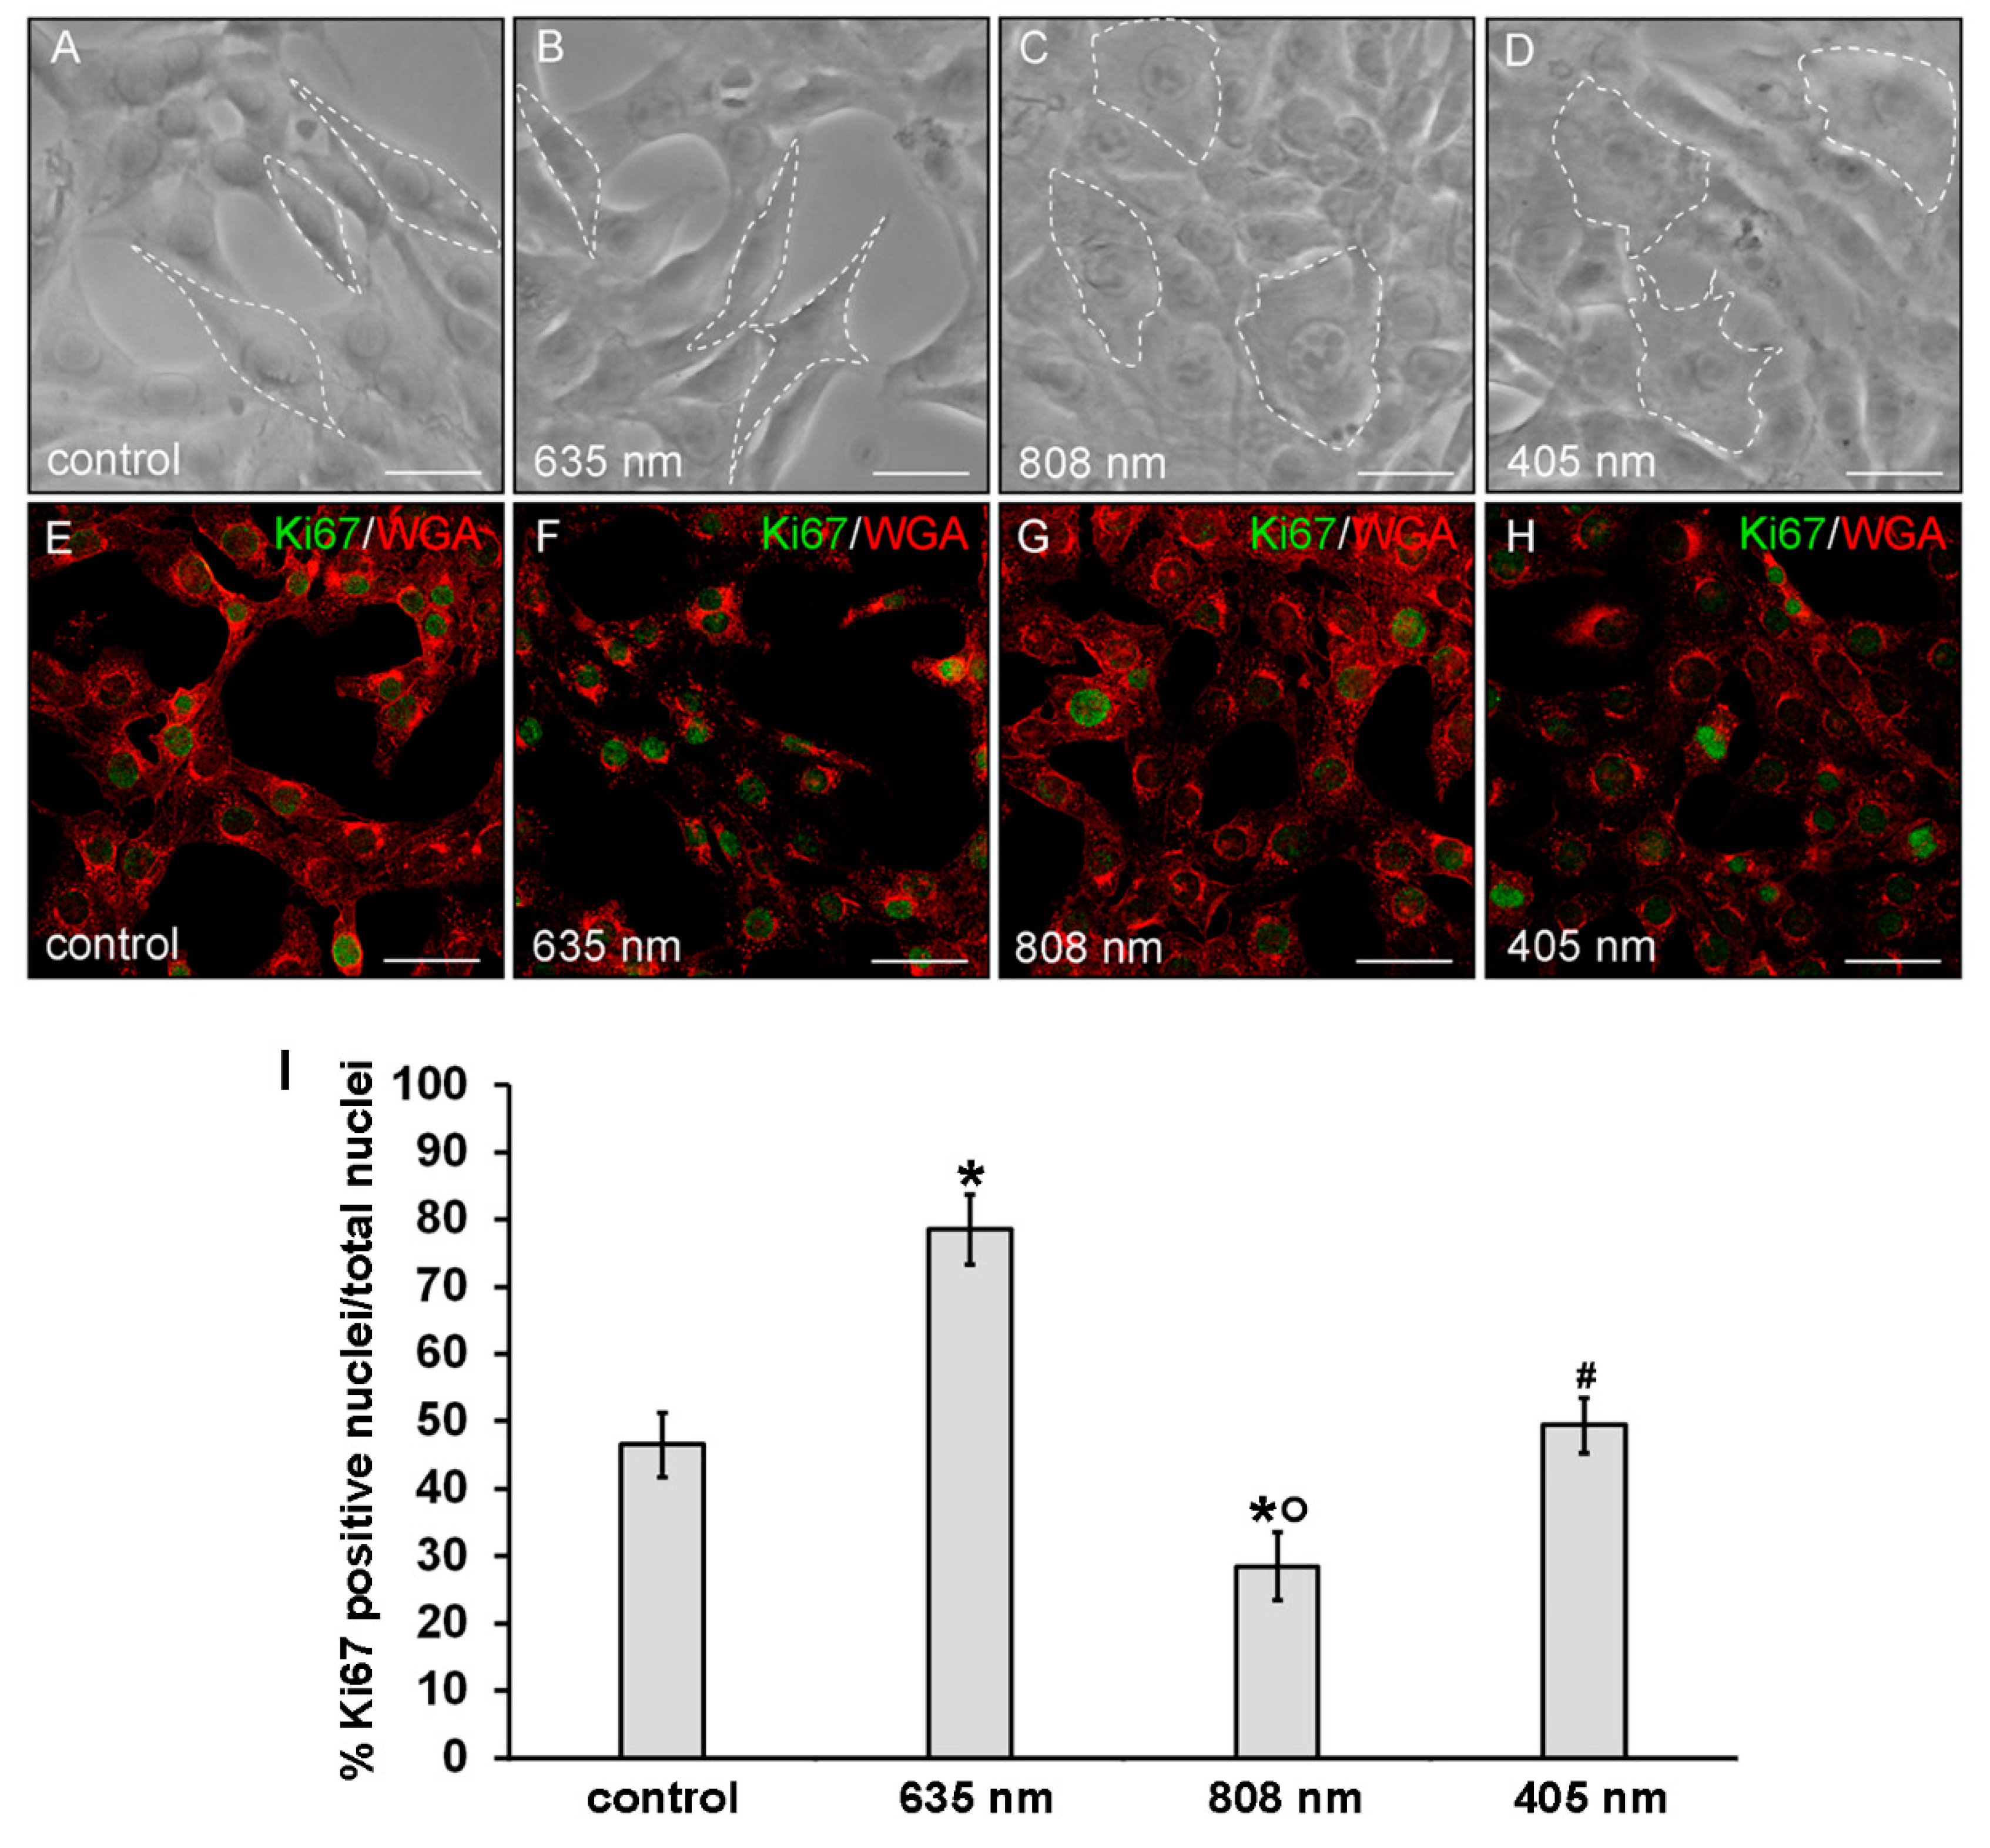
2.4. Phase Contrast Microscopy

The morphology of NIH/3T3 fibroblasts cultured on a 6-well plate, exposed or not to PBM treatments, was evaluated by an inverted light phase contrast microscope (Nikon Diaphot 300, Nikon, Tokyo, Japan).

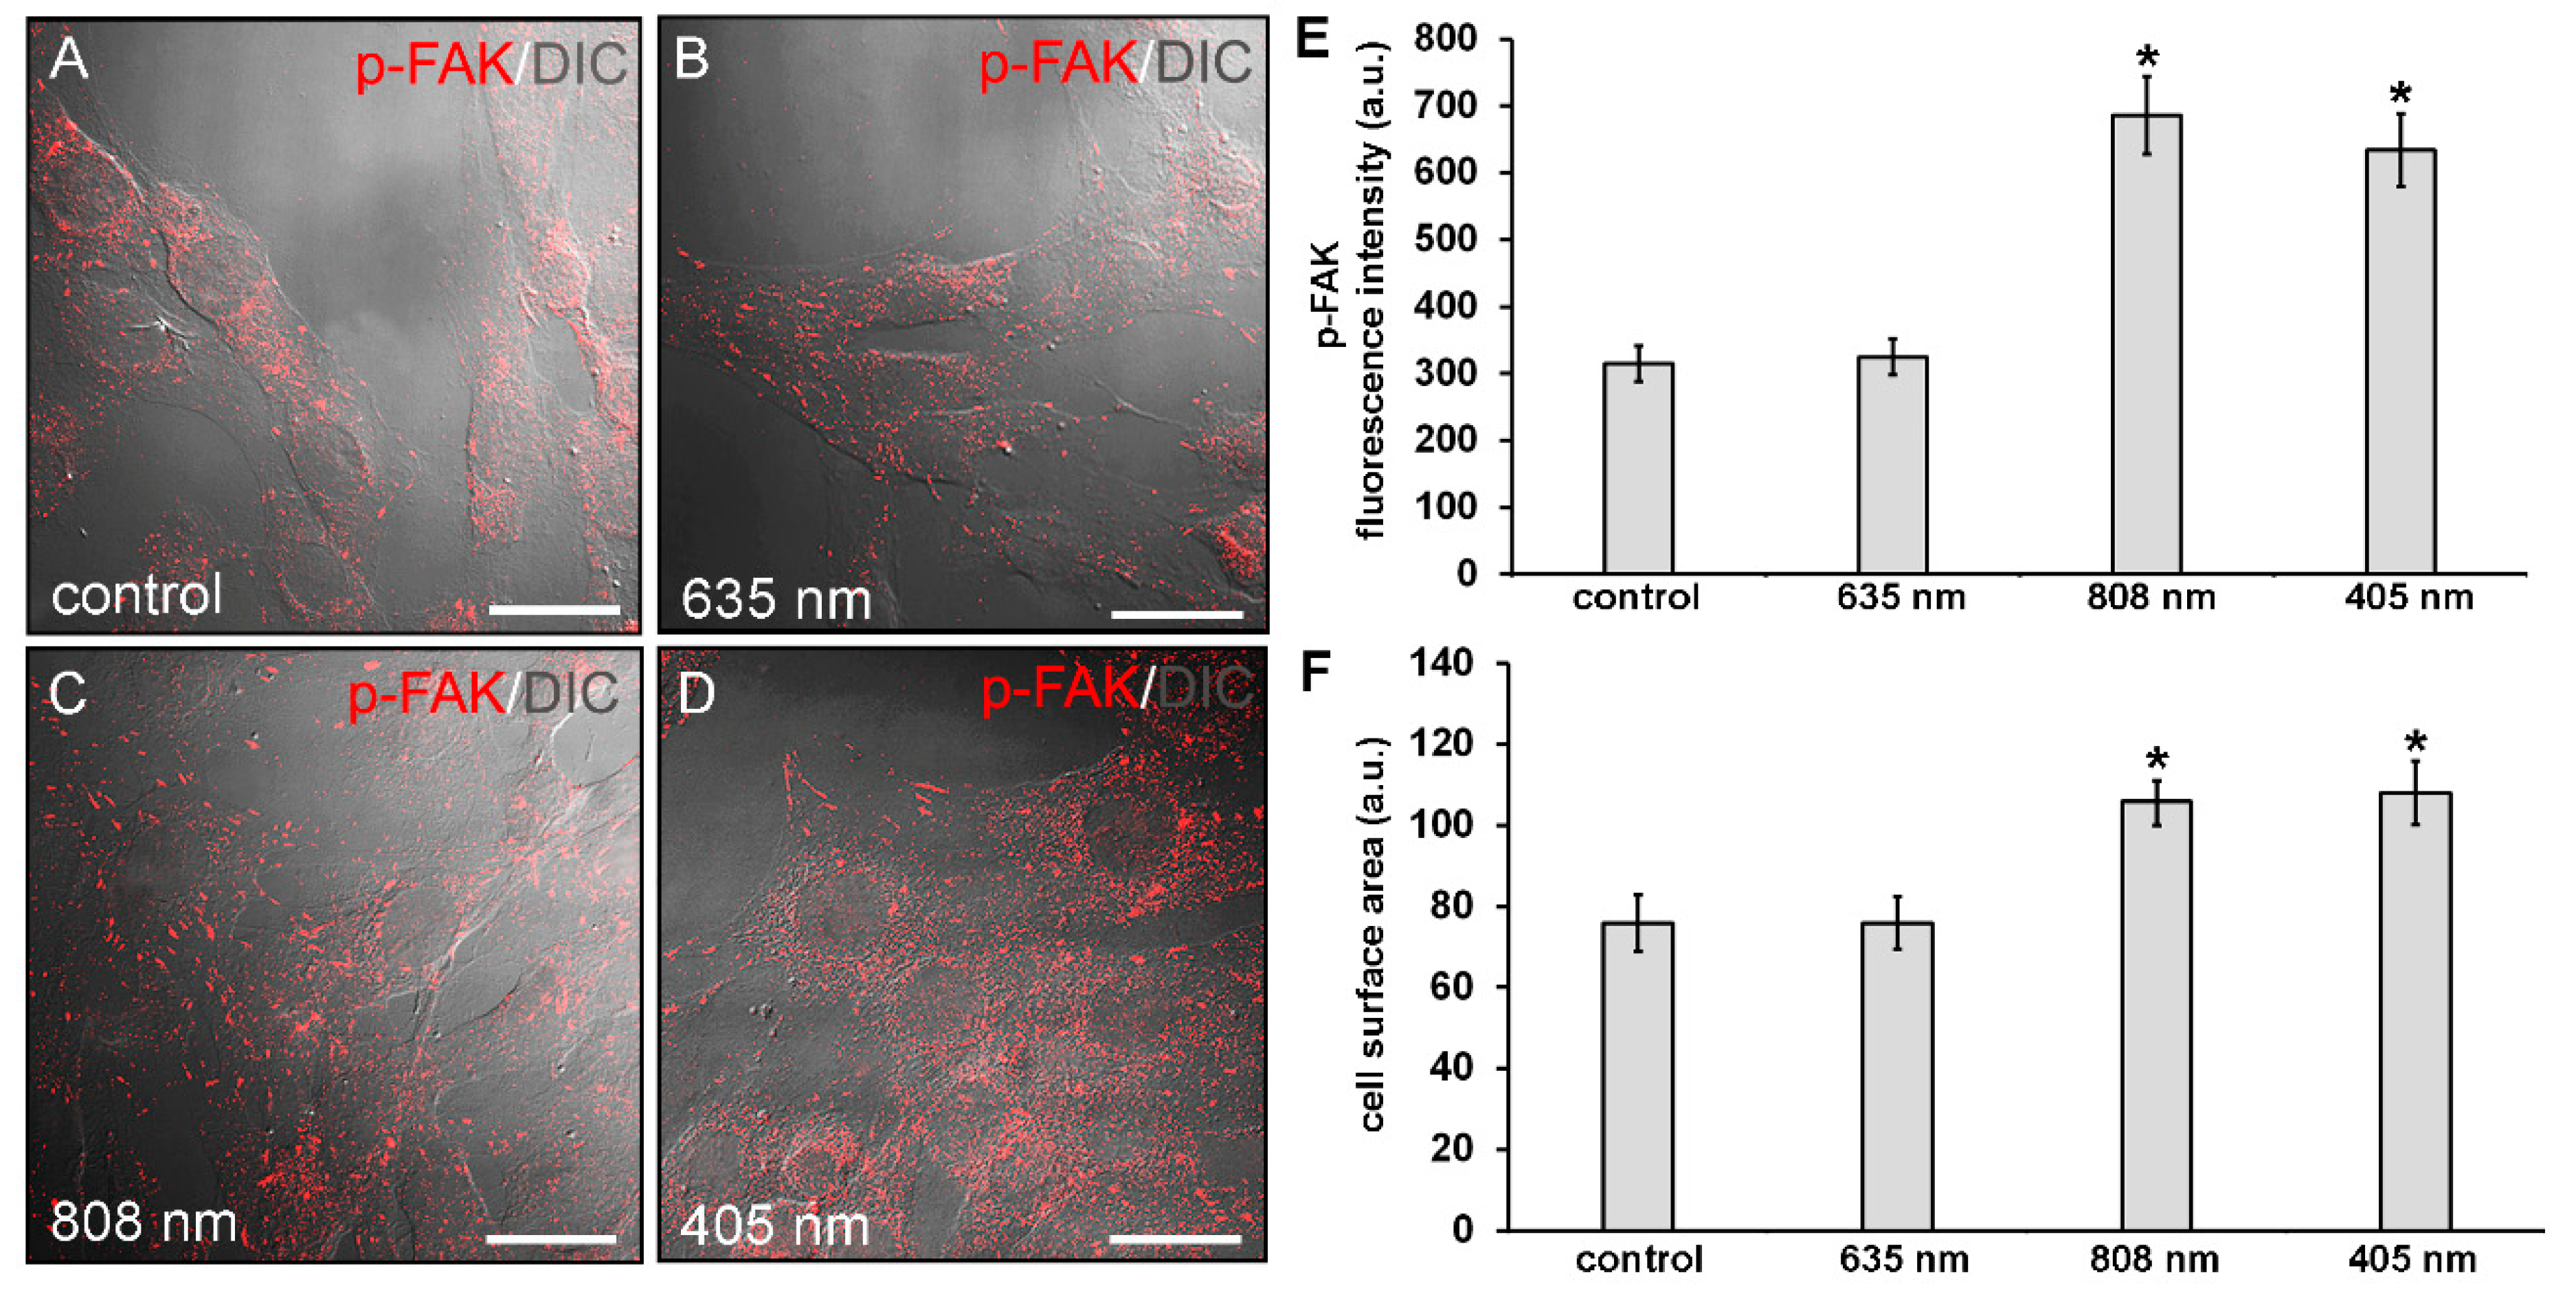
2.5. Confocal Laser Scanning Microscopy

The cells were processed for confocal immunofluorescence (IF) analysis of the expression of different proteins essentially as previously reported [34]. Fixed cells were incubated (overnight at 4 °C) with the primary antibodies listed in Table 2.
The immunoreactions were revealed by incubation (1 h at RT) with the following specific secondary (1:200; Molecular Probes): anti-mouse Alexa Fluor 488-conjugated IgG (A11001); anti-rabbit Alexa Fluor 488-conjugated IgG (A11034), anti-mouse Alexa 568-conjugated IgG (A11011) or anti-rabbit Alexa 568-conjugated IgG (A11036). The cross-reactivity of the secondary antibodies was tested by omitting primary antibodies. In some experiments, cells were labeled with Wheat Germ Agglutinin Tetramethylrhodamine conjugate (WGA; 1:250, 15 min at RT; Thermo Fisher Scientific, Waltham, MA, USA) to detect cellular plasma membrane, or with Alexa Fluor 488-labeled phalloidin (1:40, 20 min at RT; Molecular Probes) to stain F-actin filaments or with PI (1:30, 10 s at RT; Molecular Probes) to reveal nuclei.
The immunolabeled cells were observed under a confocal Leica TCS SP5 microscope (Leica Microsystems) equipped with a HeNe/Ar laser source for fluorescence measurements and with differential interference contrast (DIC) optics, by using a Leica Plan Apo 63×/1.43NA oil immersion objective. Optical section series (1024 × 1024 pixels each; pixel size 204.3 nm; 0.4 μm in thickness) were acquired at intervals of 0.6 μm and projected onto a single “extended focus” image.
Ki67 positive cell number was determined in 10 random microscopic fields (63× objective, 200 × 200 μm2) in each cell preparation and expressed as percentage of the total cell number. Counting was carried in at least three different cell preparations for each experimental condition by two different operators. Experiments were performed in triplicate.
Densitometric analyses of the fluorescent signal intensity of p-FAK, vinculin, MMP-2, MMP-9, TIMP-1, TIMP-2 and type-1 collagen were performed on digitized images using ImageJ 1.49v software (NIH, https://imagej.nih.gov/ij/) in 20 regions of interest (ROI, 100 μm2) for each confocal stacks (at least 10). Morphometric analysis of mean cell surface area was performed on digitized DIC images taken at the same magnification, using ImageJ 1.49v software. For each experimental group, the cell outlines of 30 cells (10 cells from 3 independent cultures) were drawn and the encircled surface area was analyzed.

2.6. Western Blotting

NIH/3T3 fibroblasts exposed or not to PBM treatments and cultured for 24 h in PM were collected and processed to extract and detect the total proteins content by using Bio-Rad protein assay (Bio-Rad Laboratories S.r.l., Milan, Italy). Thereafter, proteins (40 µg) were electrophoresed on NuPAGE® 4–12% Bis-Tris Gel (Invitrogen, Life Technologies, Grand Island, NY, USA) and blotted onto polyvinylidene difluoride (PVDF) as reported previously [34]. The membranes were incubated overnight at 4 °C with the primary antibodies listed in Table 2. Immunodetection of the specific bands was performed by using the Western Breeze®Chromogenic Immunodetection kit (Invitrogen, Life Technologies). ImageJ 1.49v software (NIH, https://imagej.nih.gov/ij/) was employed to perform the densitometric analysis of the bands. Specific band values were normalized to β-actin (assumed as control invariant protein).

2.7. Gelatinase Assay

The MMPs’ activity in NIH/3T3 fibroblasts in the different experimental conditions was assessed by using EnzChek® Gelatinase/Collagenase Assay Kit (Molecular Probes) as previously reported [35]. The enzymatic activity was evaluated by measuring the green fluorescence of the provided highly quenched fluorescein-labeled gelatin (DQ™ gelatin), revealed after its digestion. In particular, the cells were seeded on the wells of a 24-well plate, pre-coated with gelatin substrate and cultured, after exposure or not to PBM treatments for 24 h. After that, the fluorescent intensity (515 nm) was measured by using a multi-well scanning spectrophotometer (ELISA reader; Amersham, UK).

2.8. Statistical Analysis
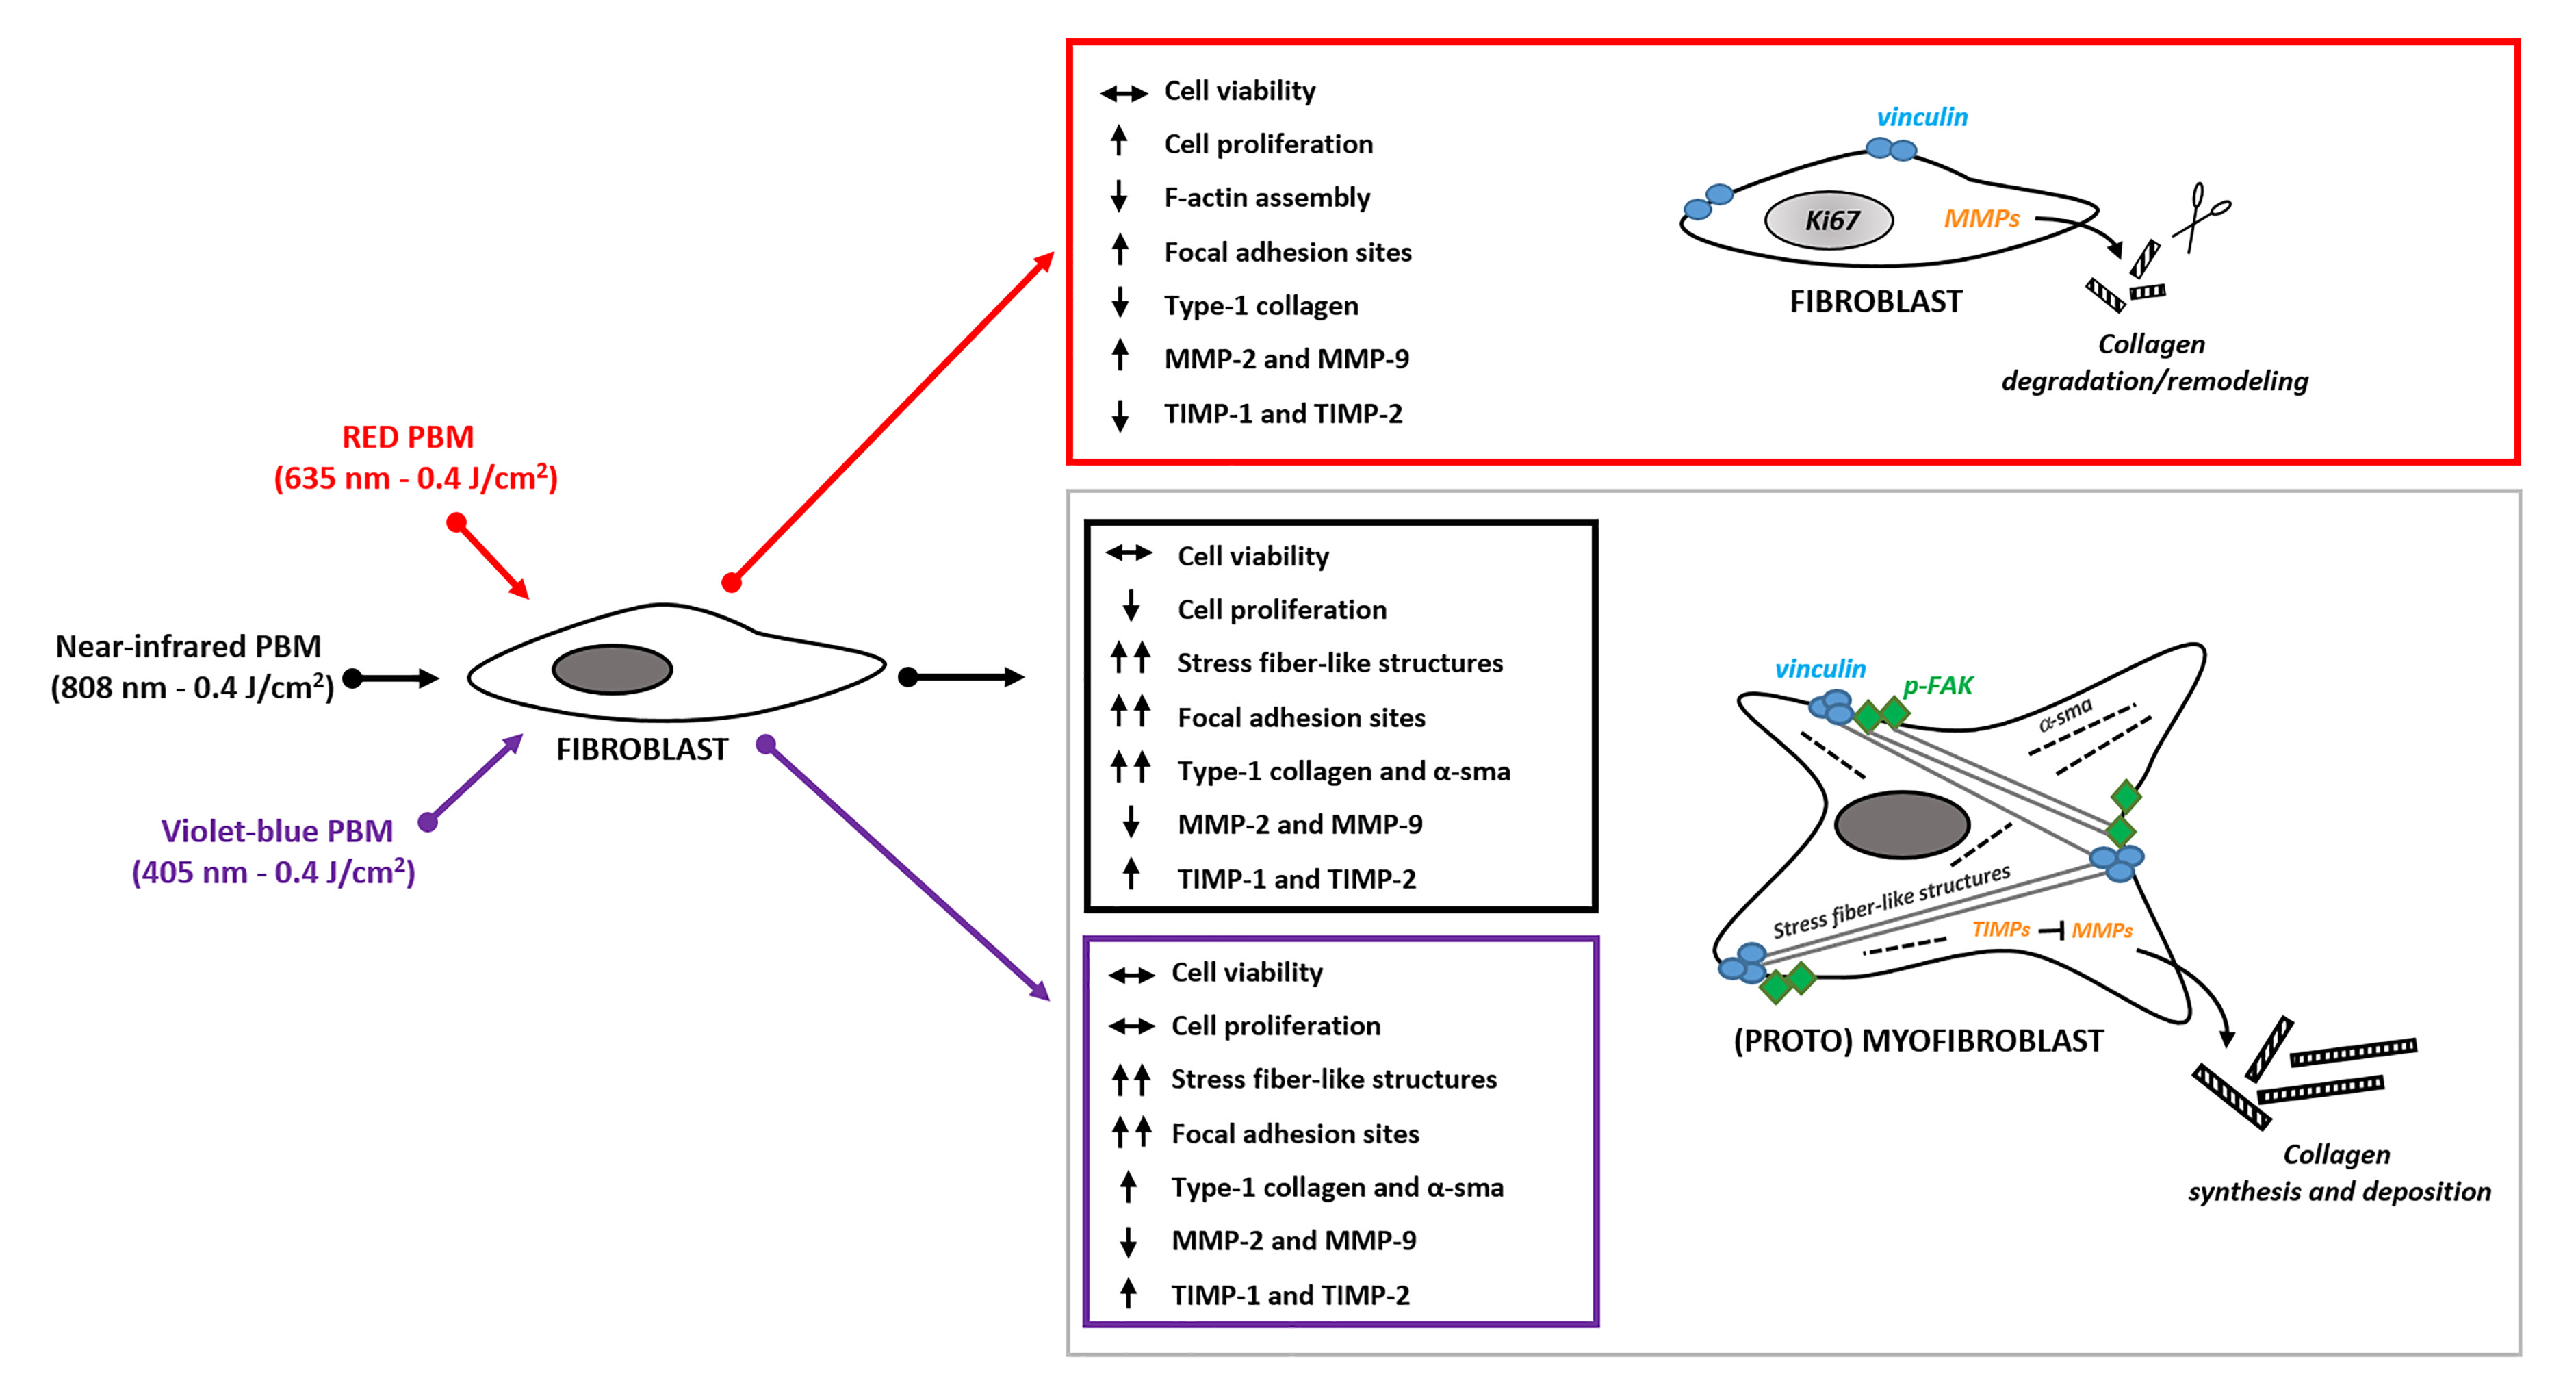
Data are reported as mean ± standard error of the mean (S.E.M.) of at least three independent experiments performed in triplicates. Student’s t test or one-way ANOVA with post-hoc Tukey HSD were used to perform the statistical analysis of differences among the experimental groups. Results with a p-value < 0.05 were considered statistically significant. GraphPad Prism 9.0 statistical software (GraphPad, San Diego, CA, USA) was used to carry out calculations.

3. Results

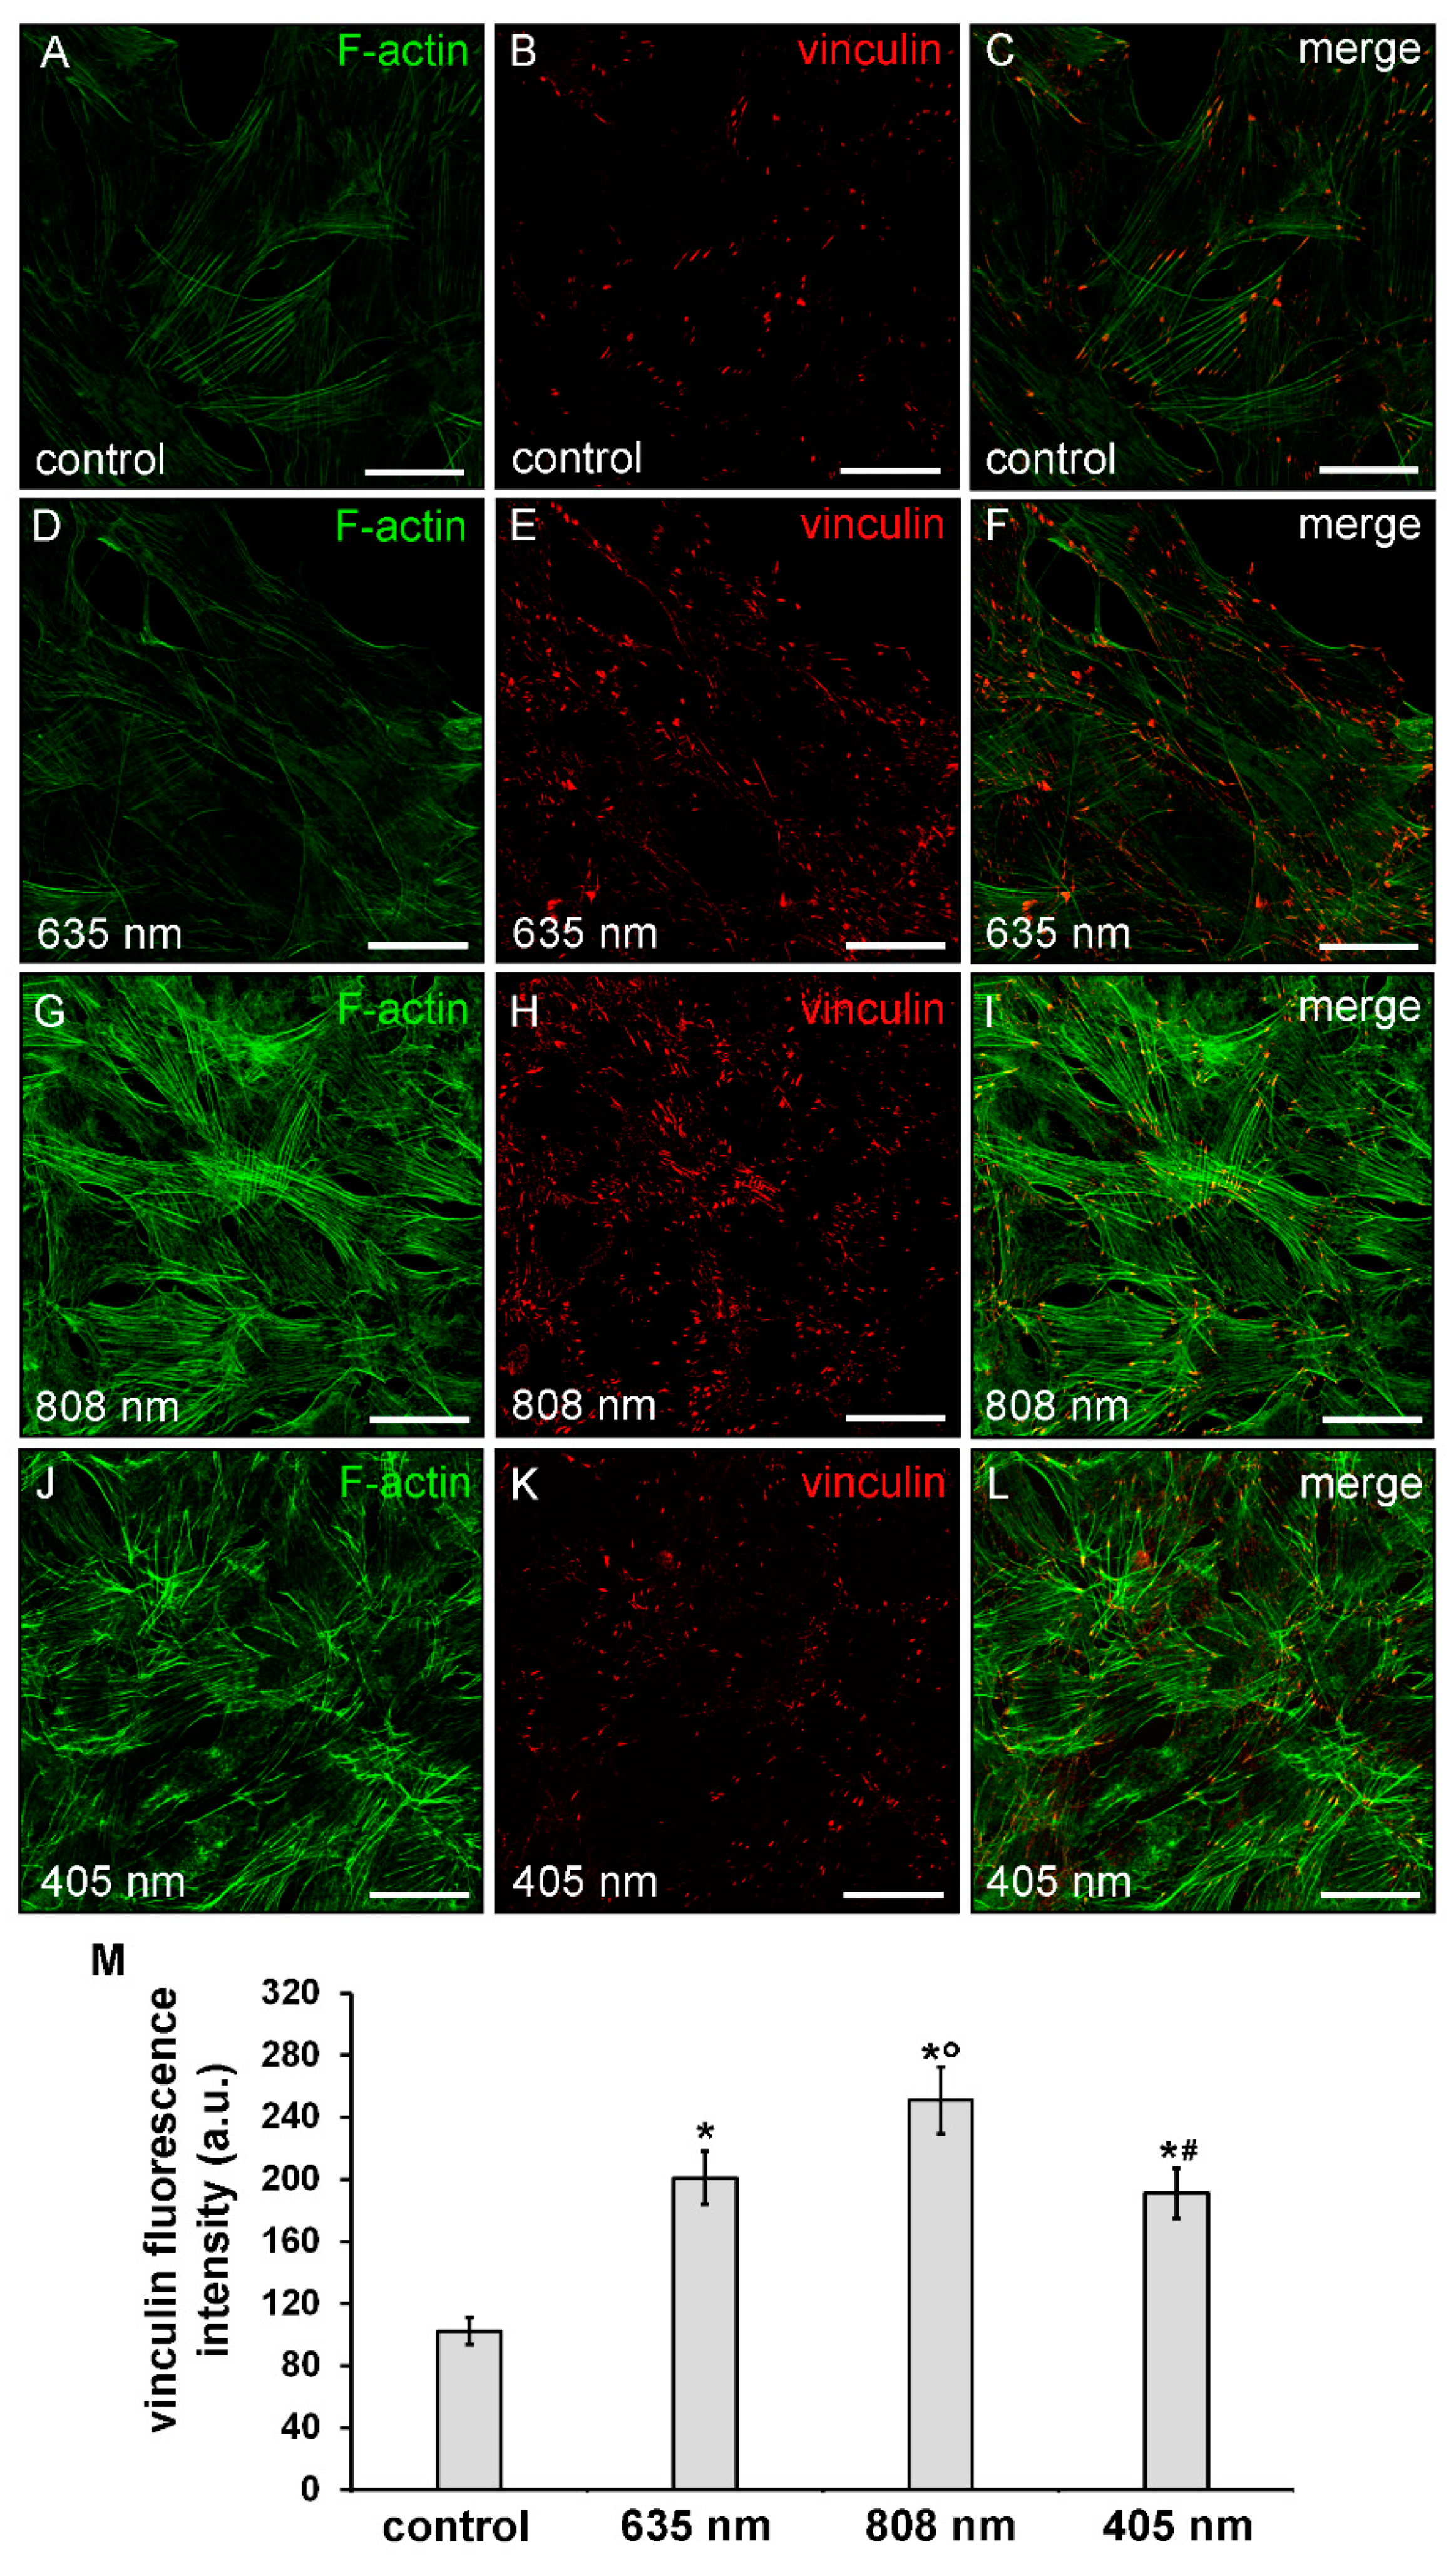
3.1. Effects of PBM Treatments on Fibroblast Cell Shape, Actin Cytoskeleton Assembly, Focal Adhesion Protein Expression/Aggregation and Proliferation

Twenty-four hours after exposure to the three different PBM treatments, NIH/3T3 fibroblasts were first assessed for cell viability by Syto16/PI and MTS assays in order to exclude any cytotoxic effect induced by irradiations. None of the PBM treatments altered cell viability. Indeed, the irradiated cells did not exhibit the nuclear staining of the dead cell marker PI (Figure 2A–E) and displayed values of absorbance of soluble formazan (resulting from tetrazolium reduction by mitochondrial enzymes of viable cells) similar to those recorded in untreated of control cells (Figure 2F).
Moreover, irradiated fibroblasts did not show any morphological sign of suffering with respect to untreated control cells as observed under a light microscope (Figure 3A–D) and by the confocal fluorescence analysis of the cells labeled with the membrane dye WGA (Figure 3E–H).
Of note, morphological differences mainly in terms of cell shape and surface area may be appreciated between the differently irradiated cells and the control ones: the NIR and violet-blue light irradiated fibroblasts exhibited a polygonal shape and a higher surface area as compared to red light irradiated and control ones, which appeared more elongated and spindle-shaped (Figure 3 and Figure 4).
Cytoskeleton organization and the expression of focal adhesion proteins, namely p-FAK and vinculin, were then evaluated by confocal immunofluorescence analysis after 24 h from the PBM treatments. NIR and violet-blue light irradiated cells exhibited an increased p-FAK expression as compared to control ones (Figure 4A,C–E). In red light treated cells, the expression levels of p-FAK were comparable to those of control (Figure 4A,B,E).
Consistent with the cell shape, the observation showed that violet-blue PBM and even more NIR PBM, caused a robust rearrangement of the actin cytoskeletal promoting the assembly of well-organized F-actin filaments, conceivably stress fiber-like structures, parallely arranged across the cytoplasm (Figure 5A,C,G,I,J,L) concomitant to an increase of the expression of vinculin, mainly aggregated in large complexes attached to either one or both ends of the filaments, as compared to controls (Figure 5B,C,H,I,K,L,M).
By contrast, cells subjected to red PBM displayed a reduction in the staining of F-actin filaments which seem to be “less assembled”, as compared to control cells. Of note, these cells showed an up-regulation of vinculin expression levels (Figure 5A–F,M).
Finally, cell proliferation analysis performed by the evaluation of the confocal immunofluorescence expression of the nuclear antigen Ki67 revealed an increase of the proliferation ability of the fibroblasts subjected to red PBM with respect to control cells (Figure 3E,F,I). By contrast, the proliferation ability of the fibroblasts subjected to NIR PBM appeared reduced (Figure 3E,G,I) while violet-blue PBM did not substantially modify the proliferation ability of the cells as compared to control (Figure 3E,H,I).

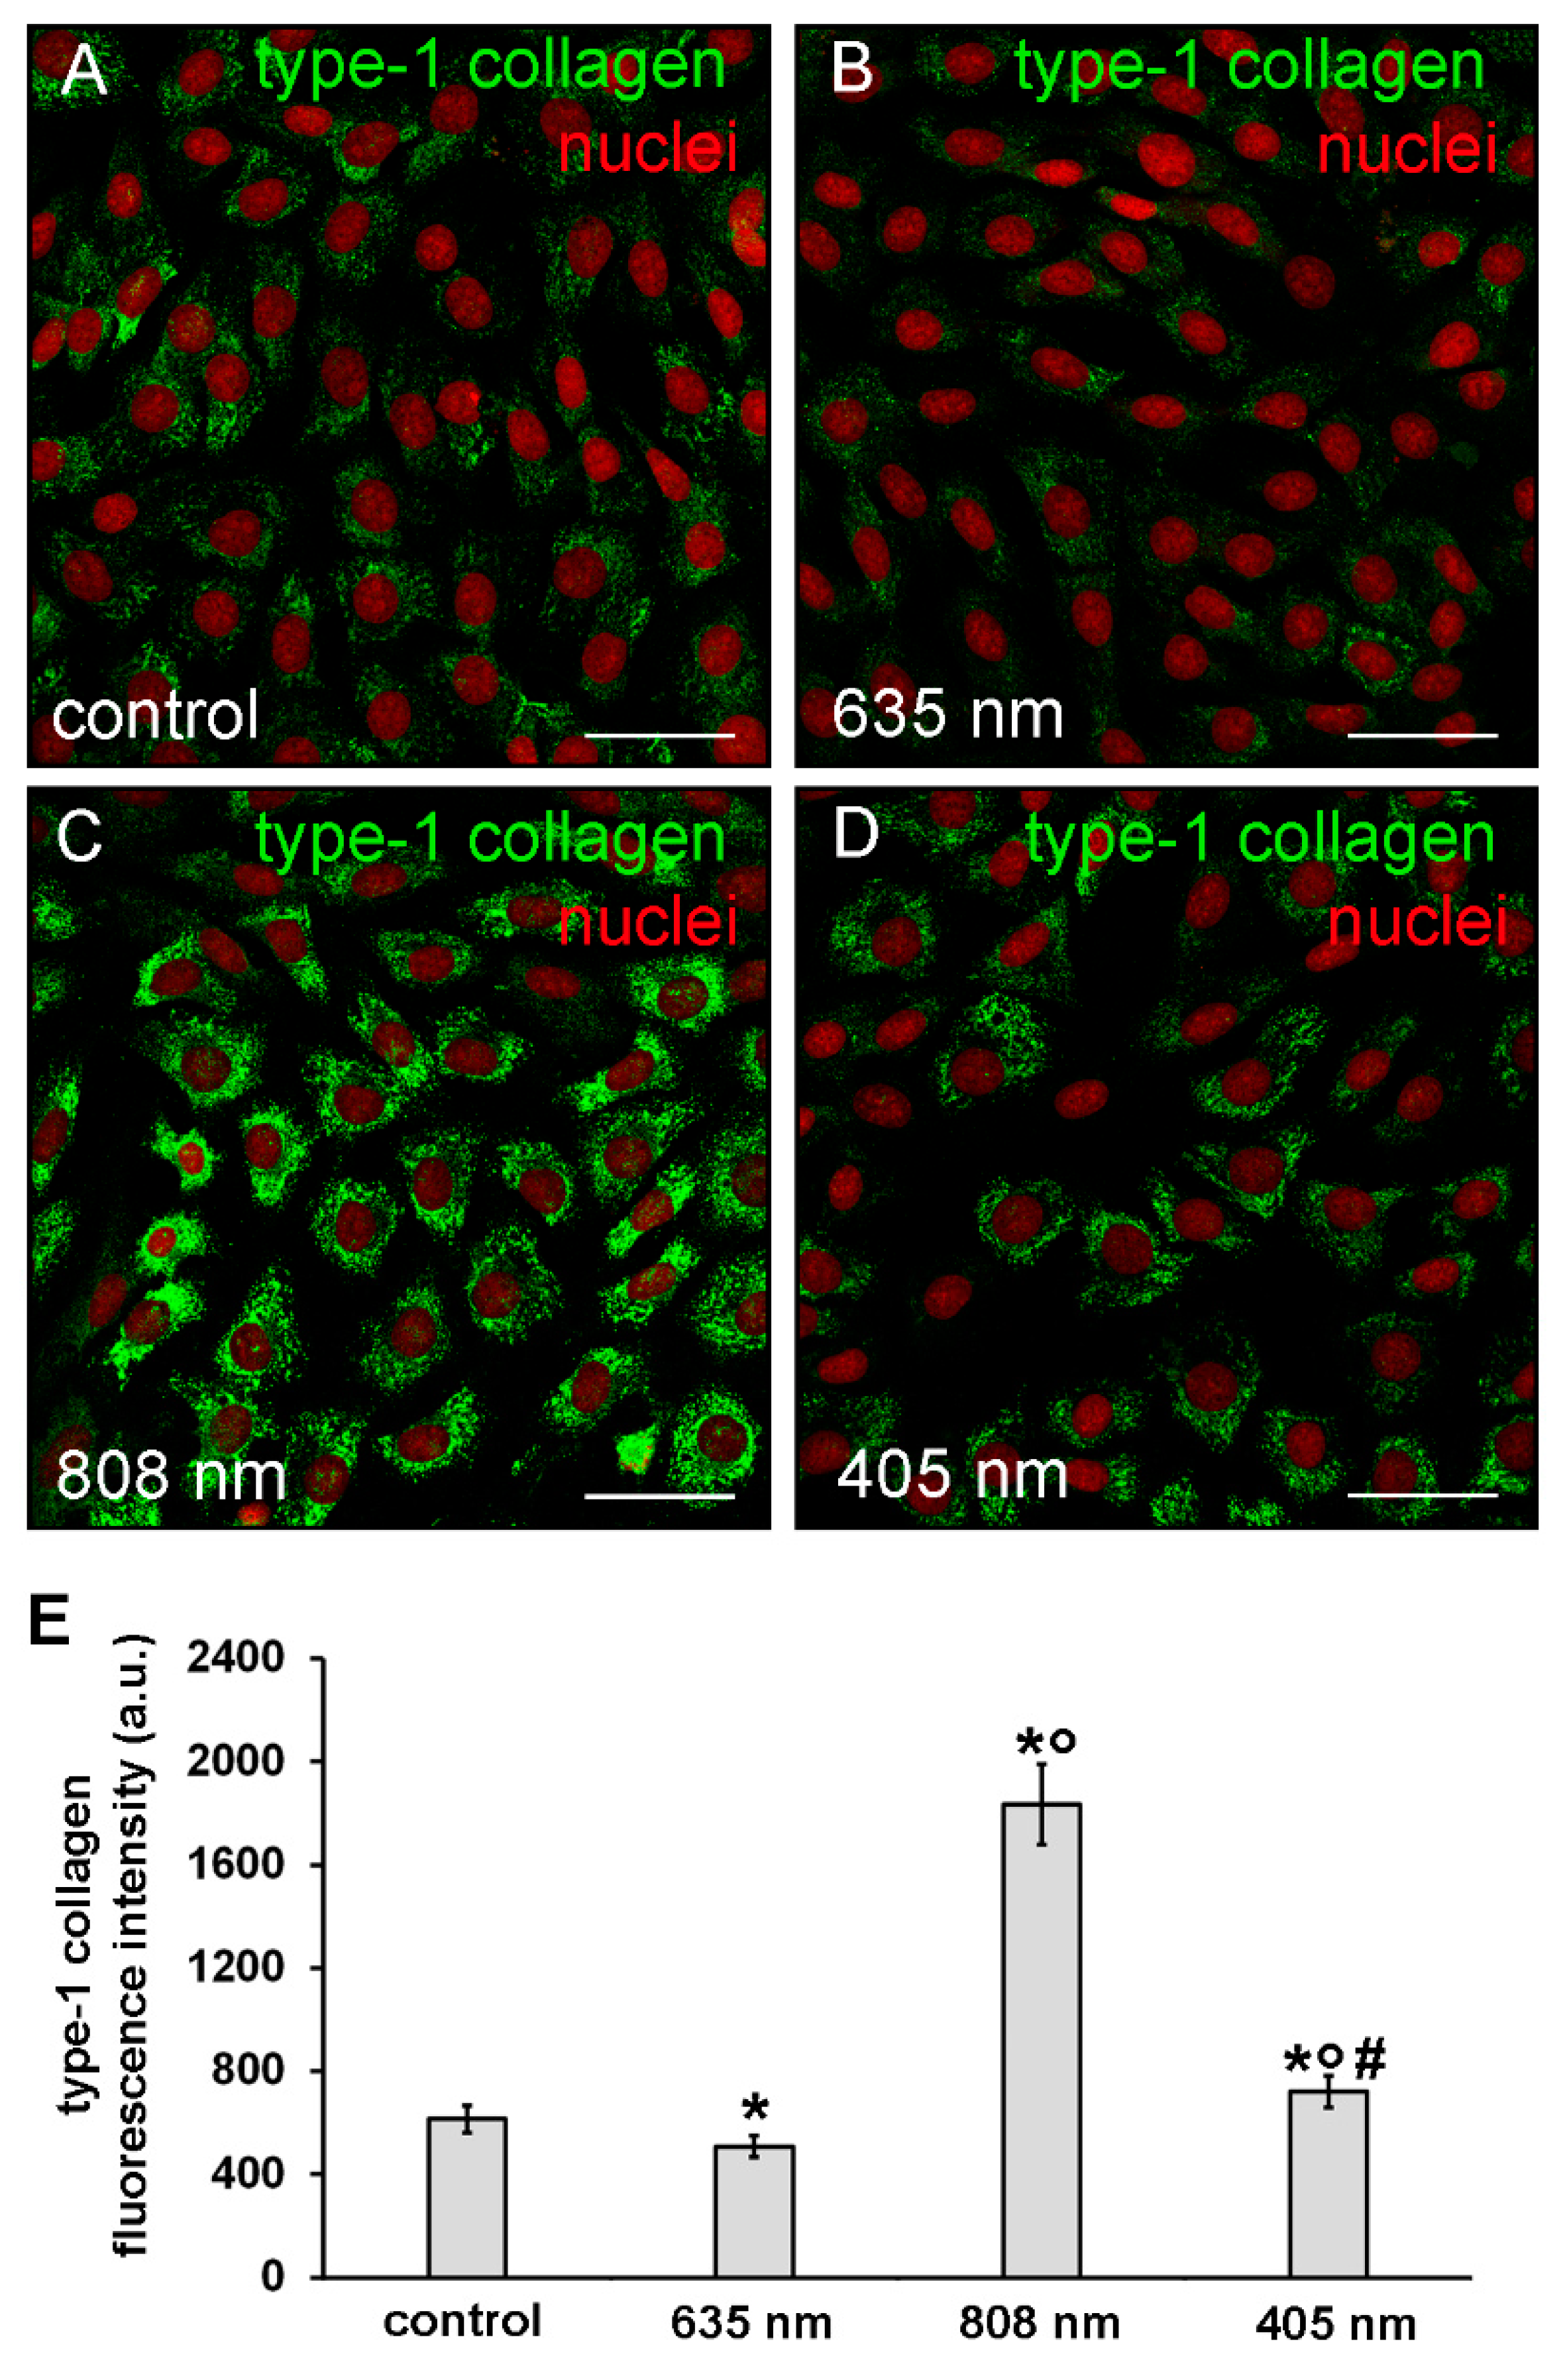
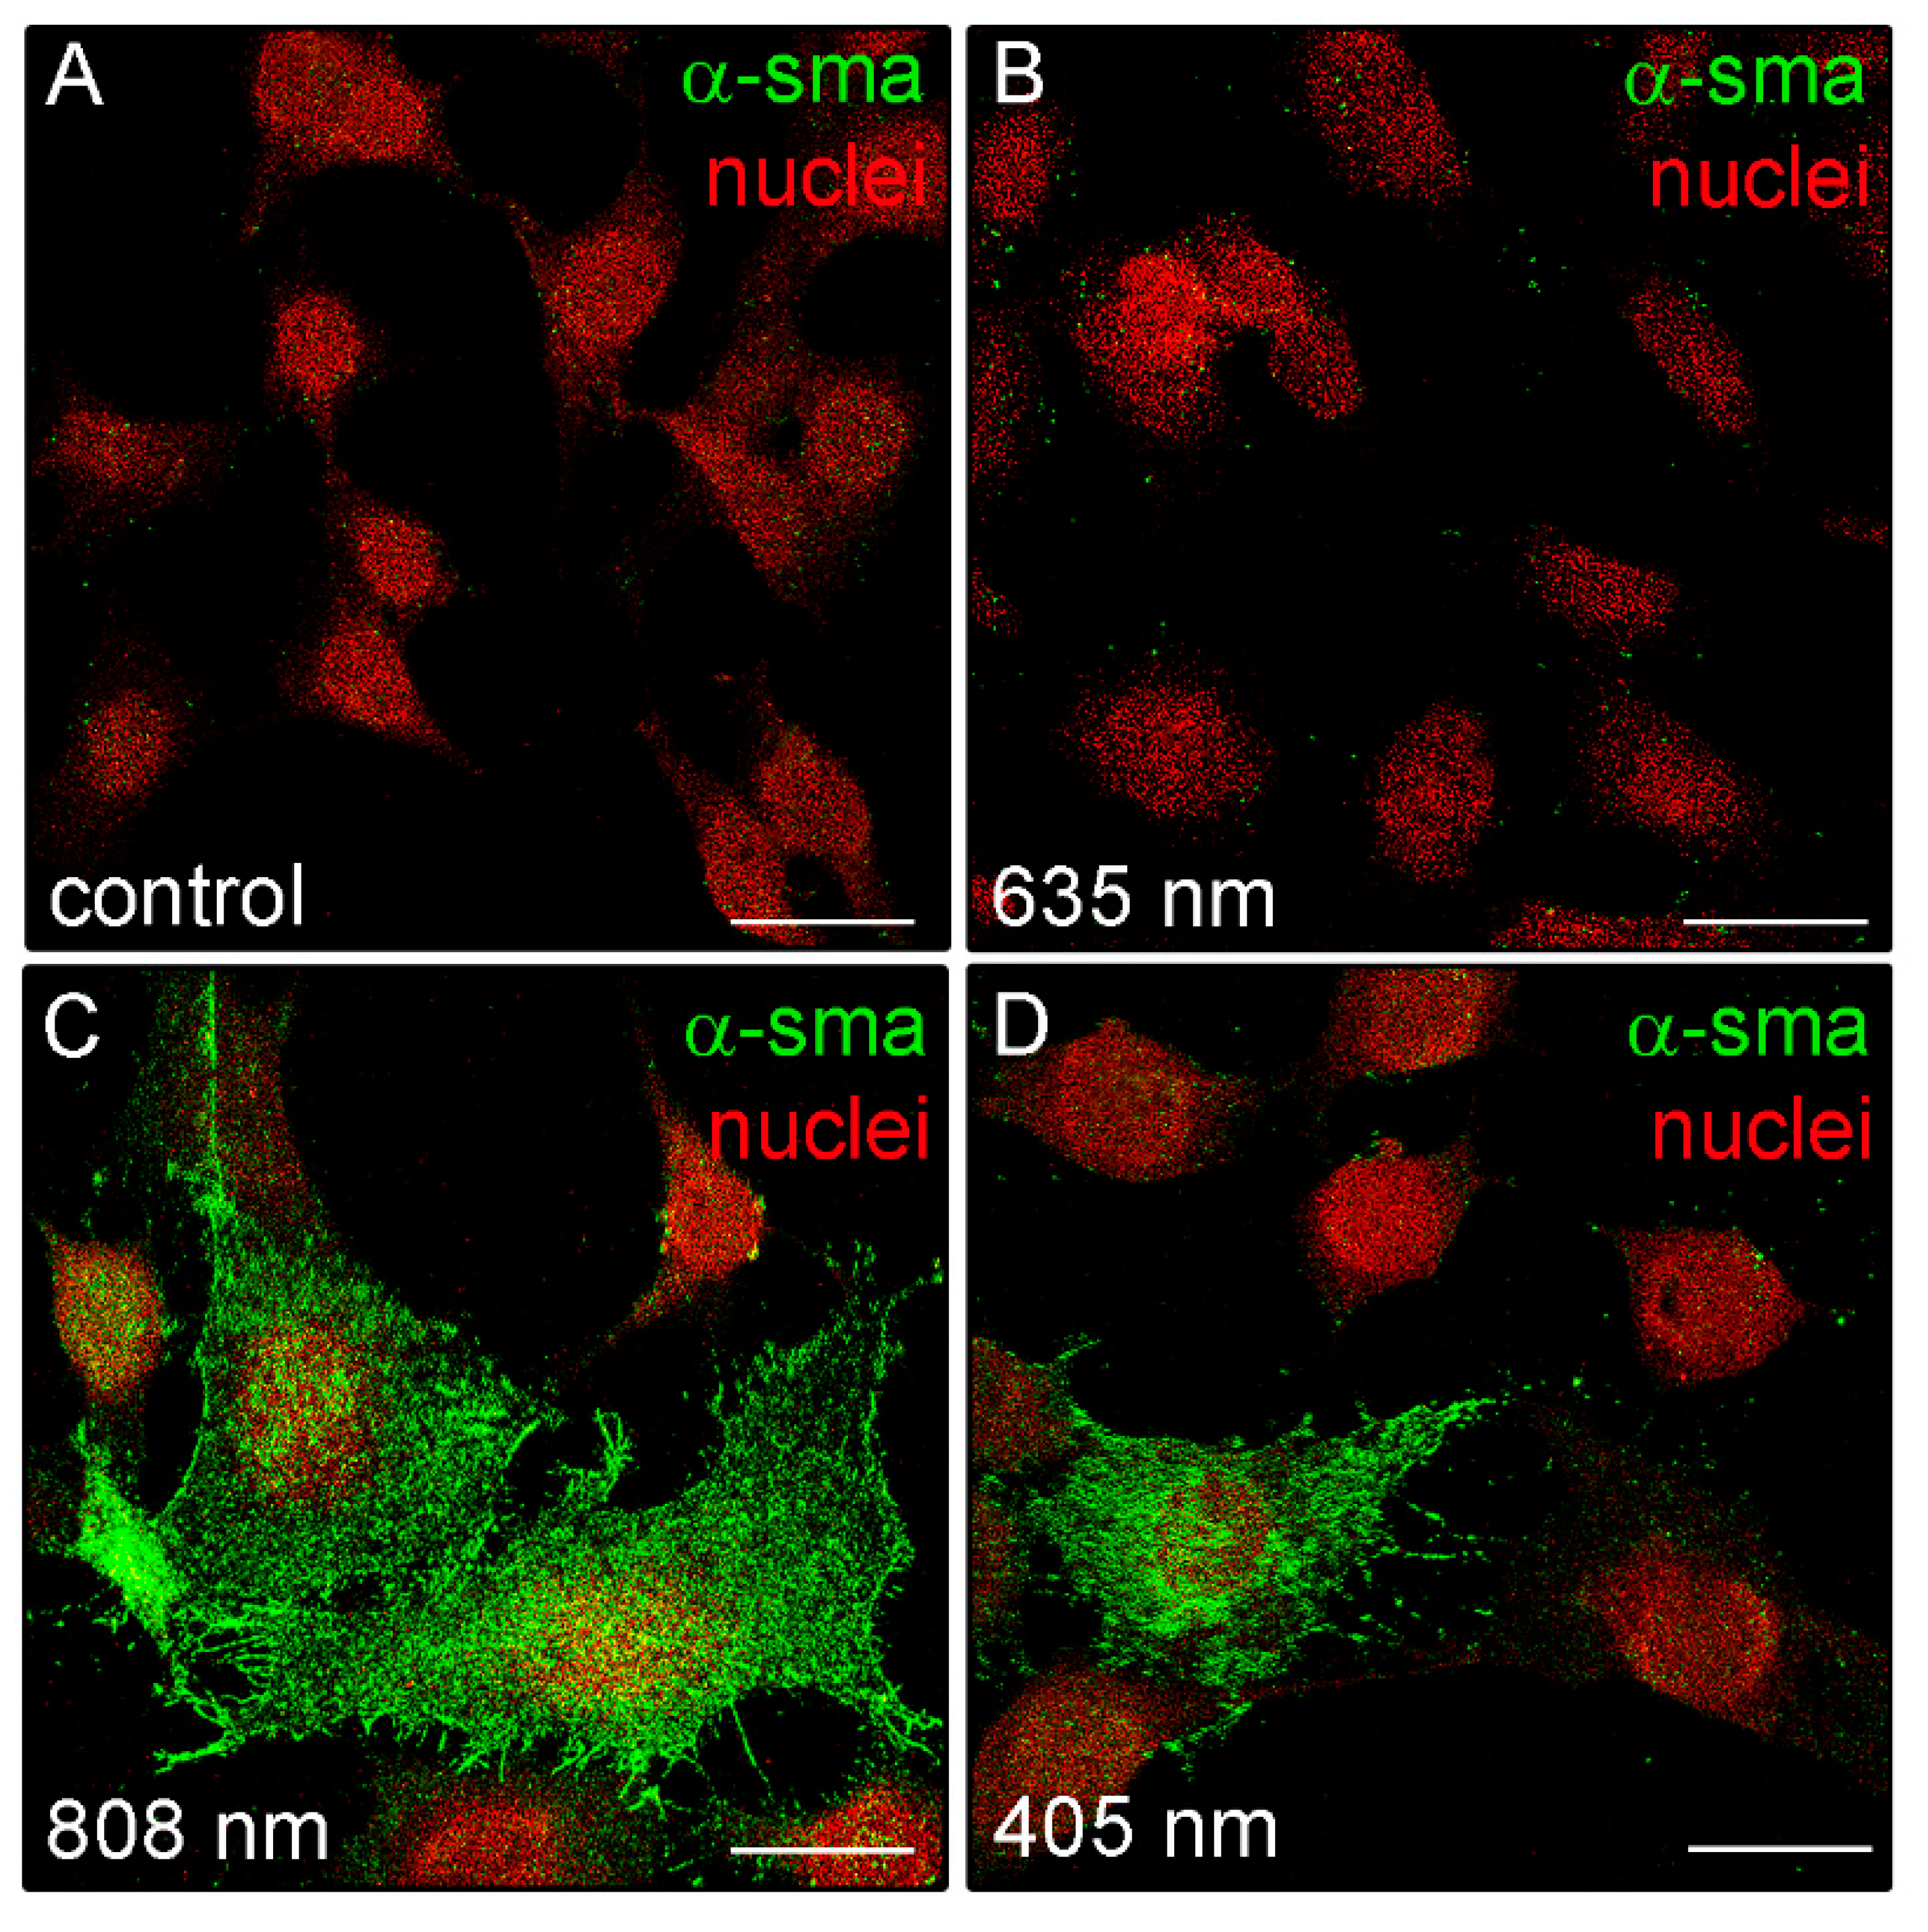
3.2. Effects of PBM Treatments on Fibroblast Type-1 Collagen and α-sma Expression

The expression of type-1 collagen was evaluated by confocal immunofluorescence analysis after 5 days from the cell PBM treatments. The observation revealed that the expression of this protein was slightly but significantly reduced in NIH/3T3 cells exposed to red PBM (Figure 6A,B,E) whereas it was increased in those exposed to violet-blue and even more so to NIR PBM with respect to controls (Figure 6A,C–E). In particular, in NIR treated cells type-1 collagen expression appeared evident in the cytoplasm with a distinctive distribution pattern, consistent with the subcellular localization of the protein in the cisternae of elaborated endoplasmic reticulum and Golgi vesicles, suggestive of a high cellular synthetic activity.
The capability of NIR PBM to affect the cell ability to synthetize type-1 collagen was also assessed on primary human dermal fibroblasts (HDF-α). It was found that this kind of PBM elicited on human fibroblasts similar effects as those observed on murine fibroblastic cell line. Indeed, confocal immunofluorescence analysis revealed that the human cells after NIR PBM exposure exhibited an increase of type-1 collagen expression at the cytoplasmic level (Figure 7A–C).
Moreover, in some irradiated cells, positive staining for type-1 collagen was observed outside the cells in a filamentous appearance (Figure 7B), suggesting the ability of the NIR PBM to promote both the cellular synthetic and secretive activities. Of note, in contrast to the control and red treated cells, fibroblasts exposed to violet-blue and to NIR PBM exhibited, 24 h after the treatment, the cytoplasmic expression of α-sma, a reliable myofibroblast marker (Figure 8), suggesting that the cells likely underwent fibroblast-(proto)myofibroblast transition.

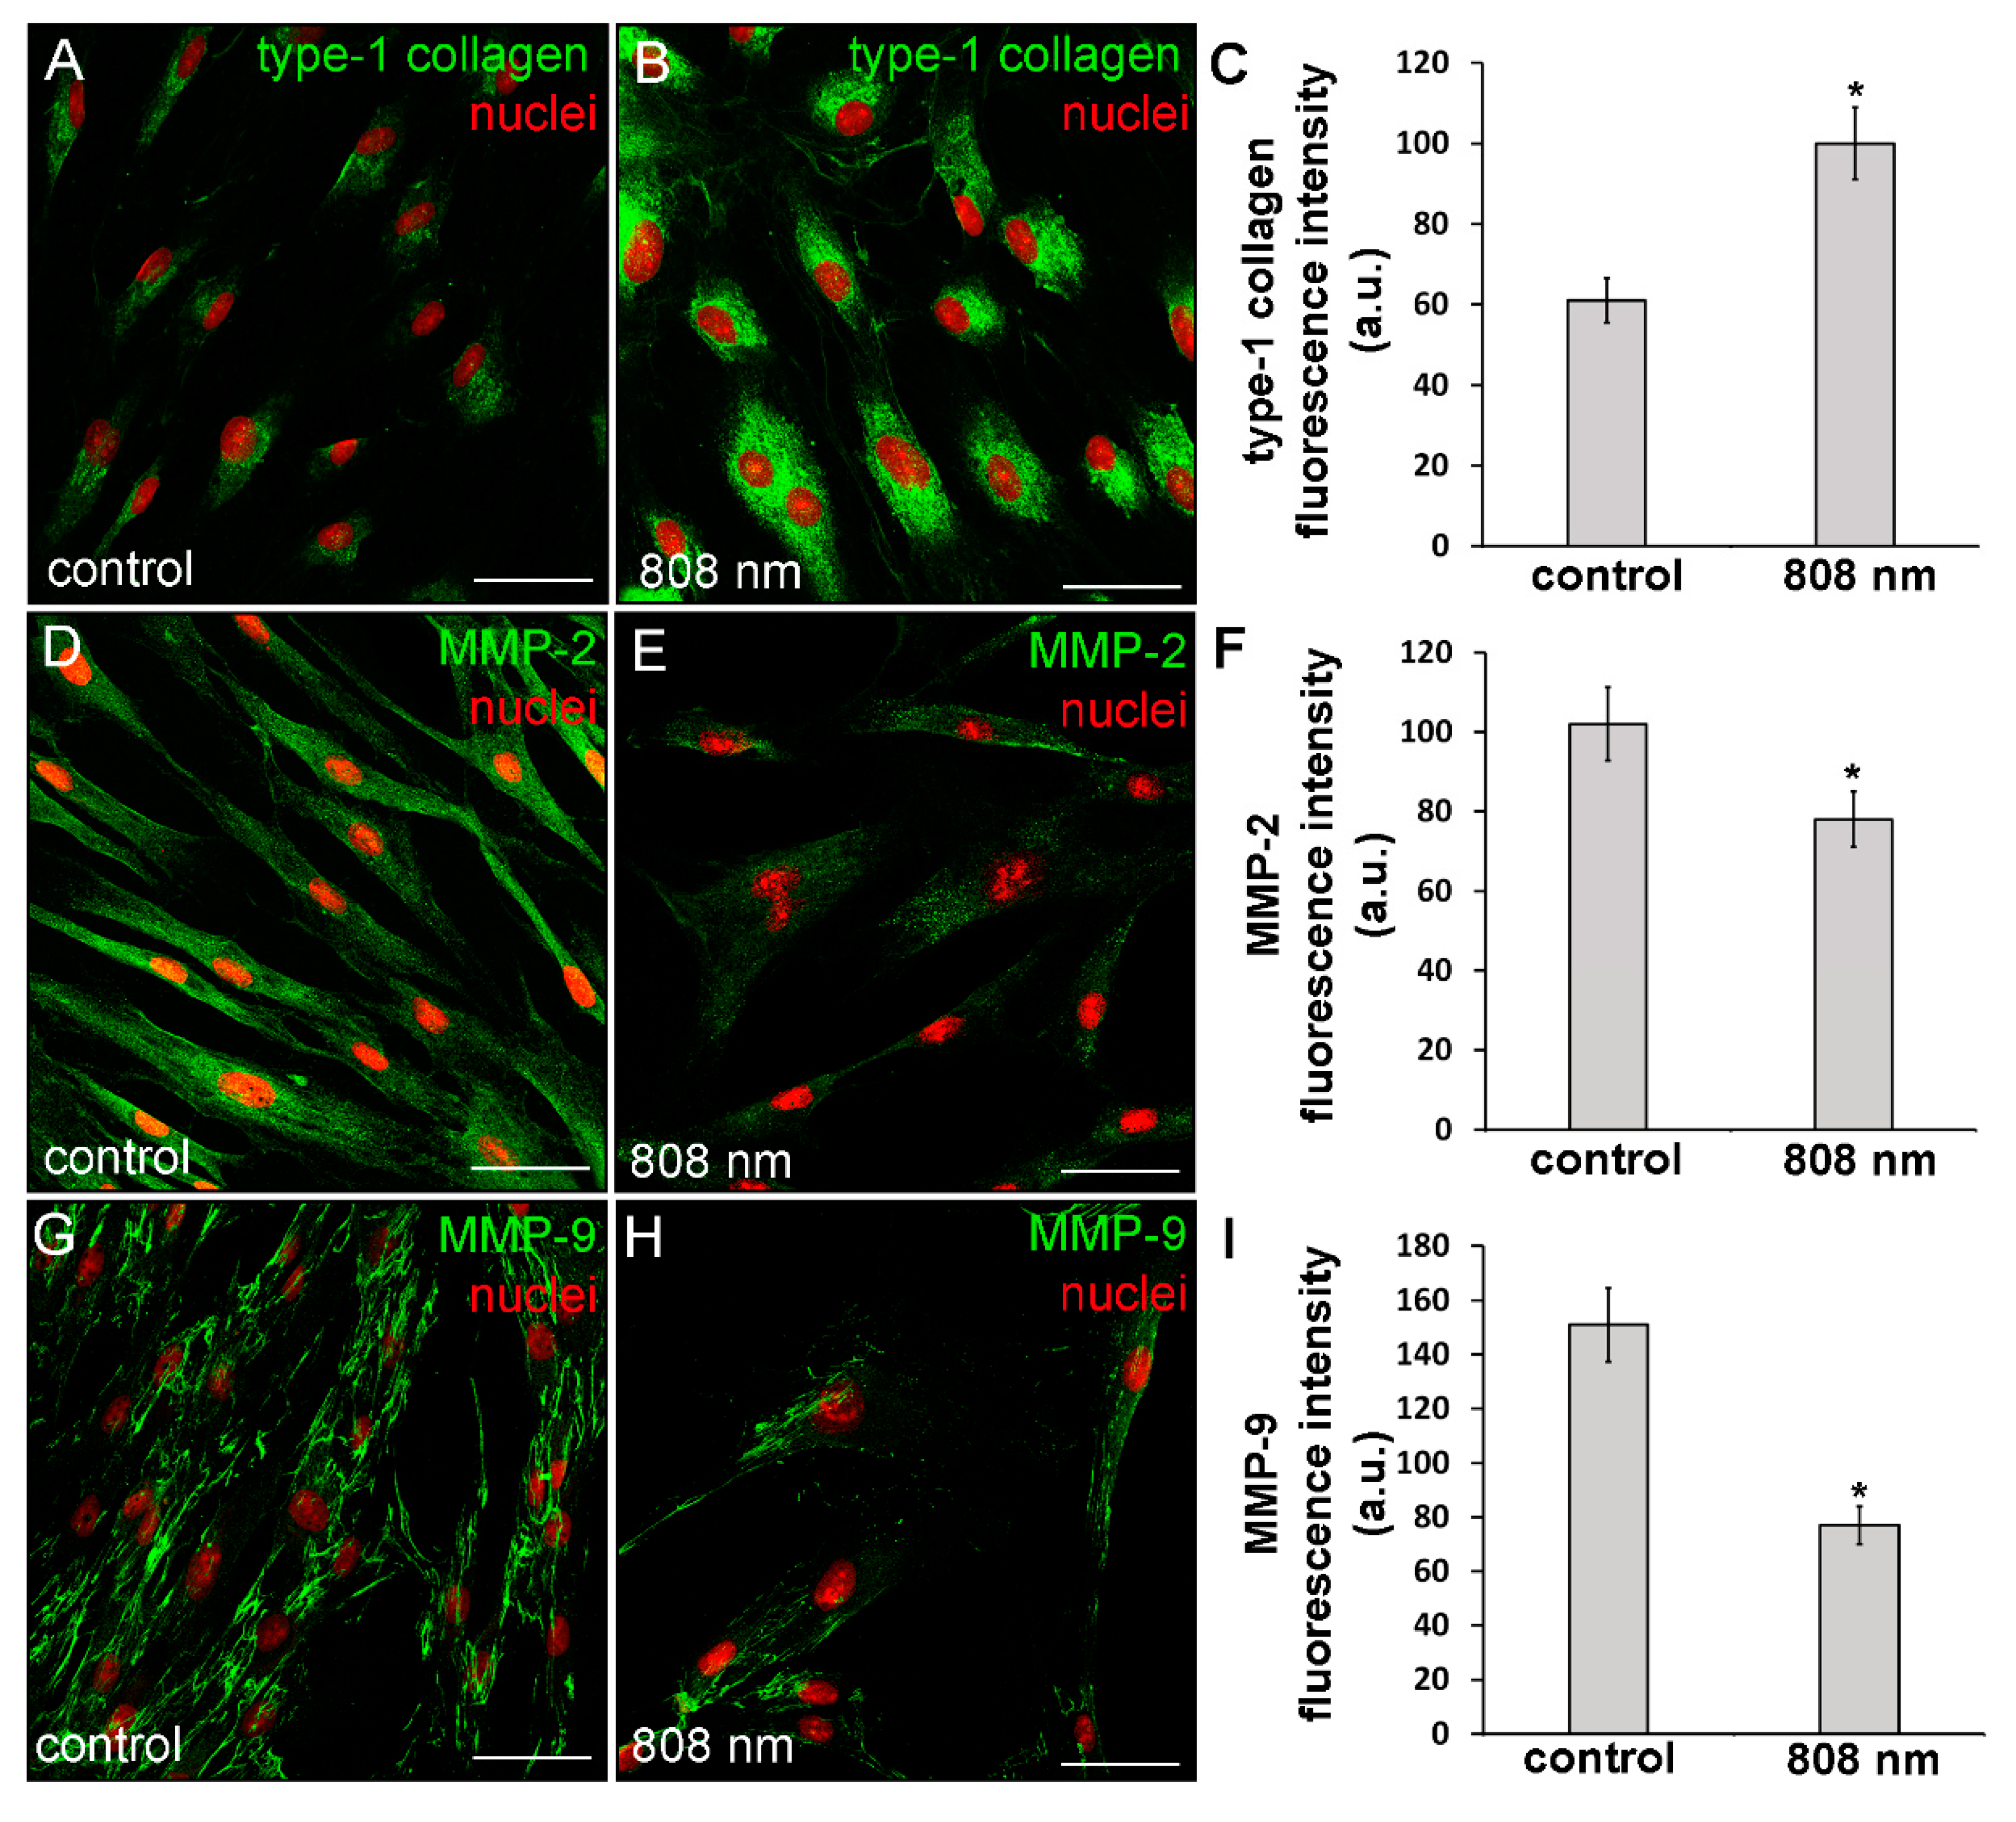
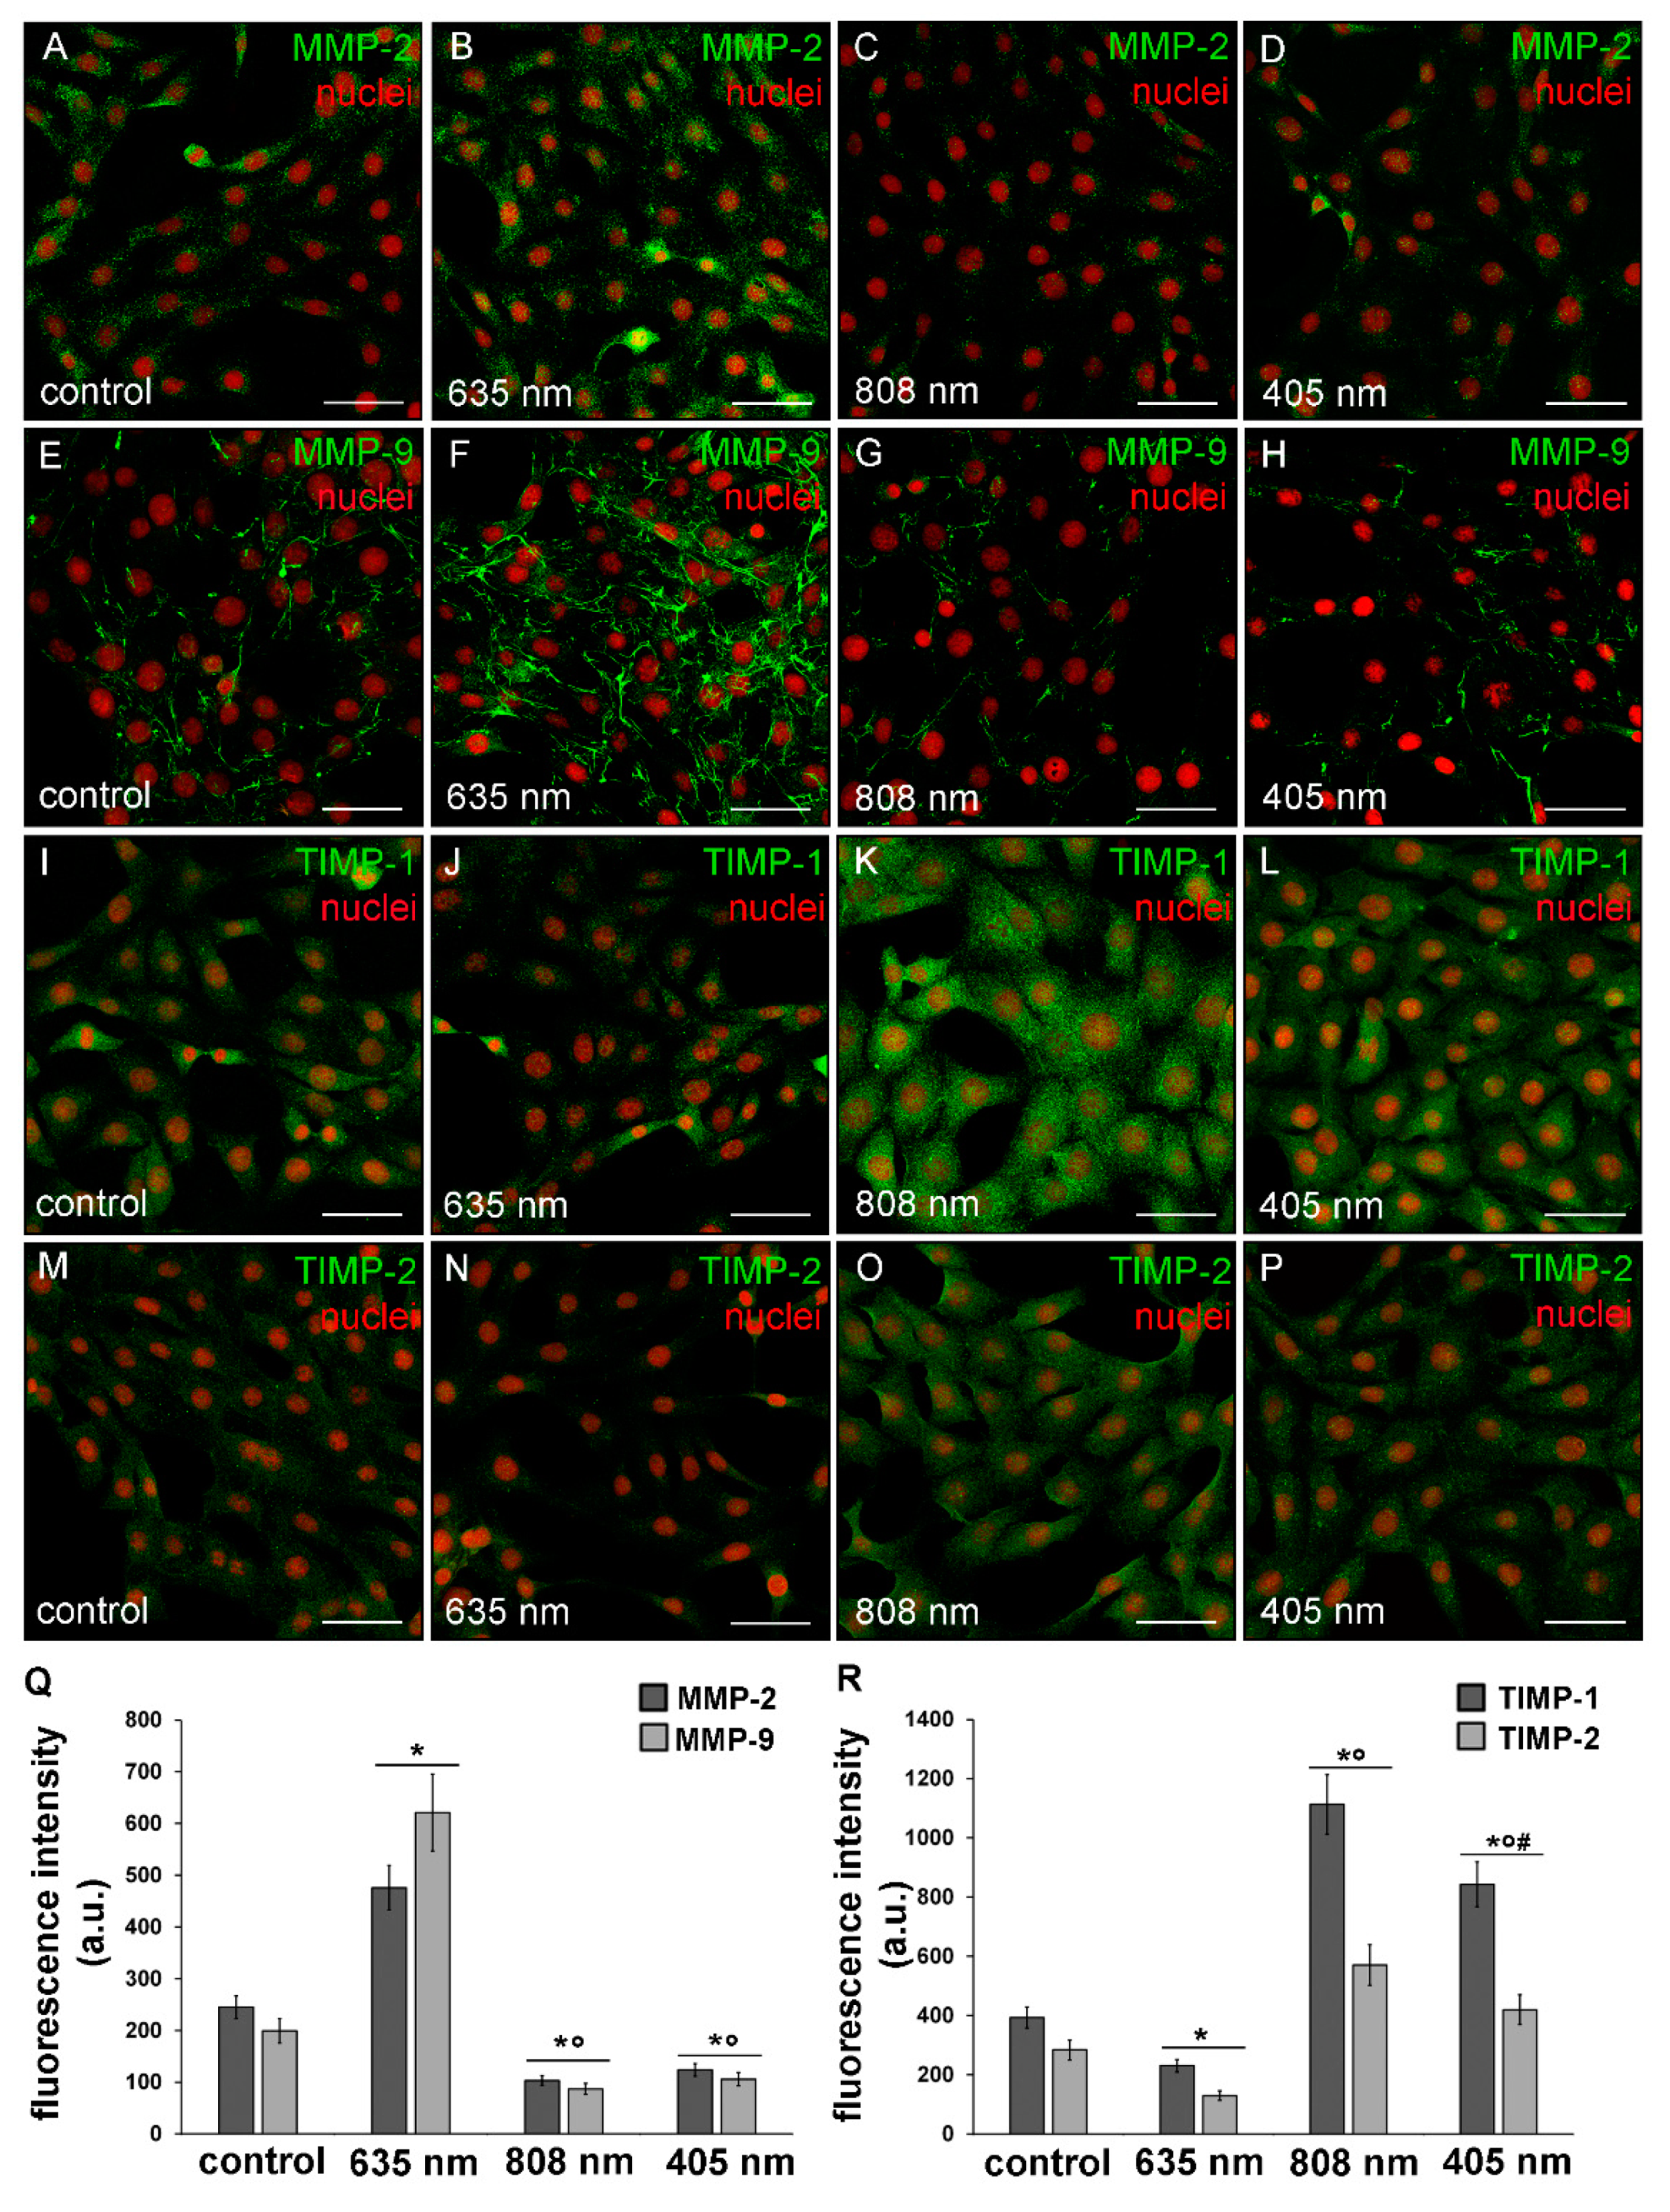
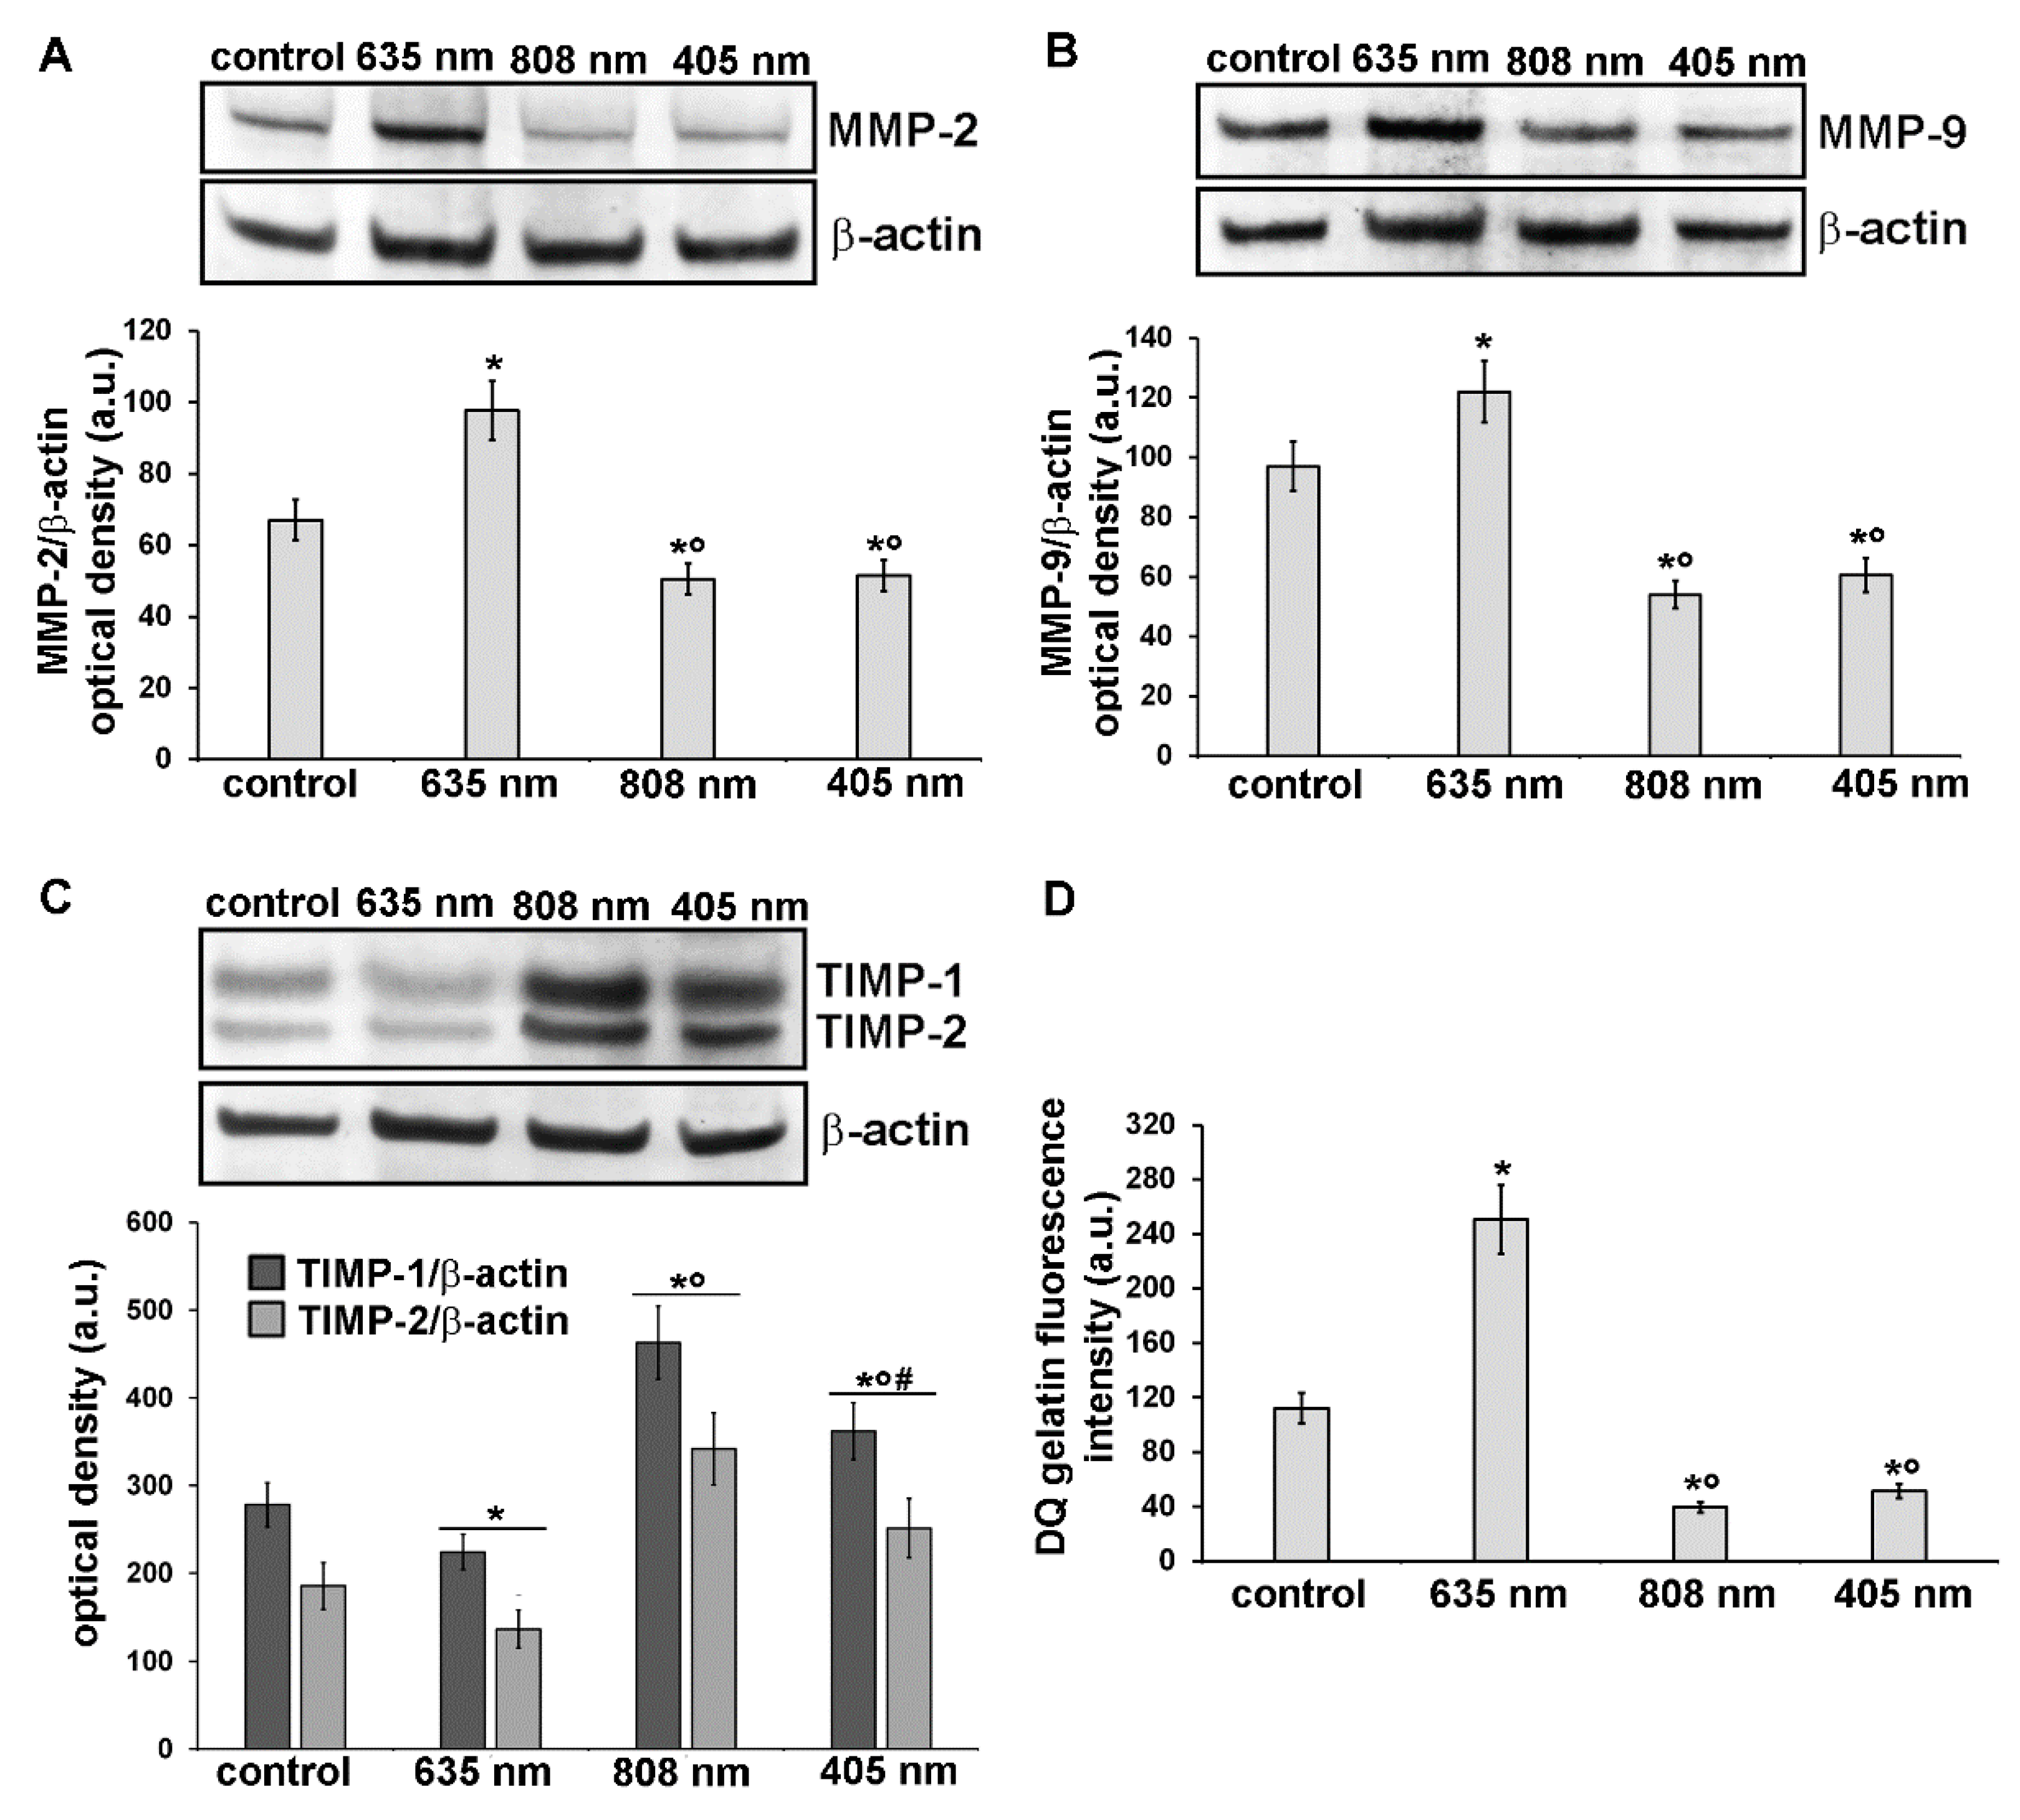
3.3. Effects of PBM Treatments on Fibroblast MMP-2, MMP-9, TIMP-1 and TIMP-2 Expression and on MMPs’ Functionality

Further experiments were aimed at the evaluation of the expression and functionality of the enzymes involved in the digestion of components of the ECM such as collagen, namely MMP-2 and MMP-9 gelatinases and of their specific inhibitors TIMP-1 and TIMP-2. Indeed, ECM/collagen homeostasis and remodeling are dependent on the balanced coordination between MMPs and TIMPs [36]. As assessed by confocal immunofluorescence and western blotting analyses, NIH/3T3 fibroblasts subjected to red PBM up-regulated either MMP-2 or MMP-9 expression (Figure 9A,B,E,F,Q and Figure 10A,B) and concomitantly down-regulated TIMP-1 and TIMP-2 expression as compared to control cells (Figure 9I,J,M,N,R and Figure 10C). By contrast, NIR and violet-blue PBM reduced MMP-2 and MMP-9 production (Figure 9C,D,G,H,Q and Figure 10A,B) while they enhanced the expression of TIMP-1 and TIMP-2 (Figure 9K,L,O,P,R and Figure 10C).
In particular, MMP-2 resulted mainly distributed in the cytoplasm with a spotted staining (Figure 9A–D) whereas MMP-9 was localized along the cytoskeletal filaments (Figure 9E–H). Both TIMP-1 and TIMP-2 appeared evenly distributed within the cytoplasm (Figure 9I–P). Likewise, murine fibroblasts, HDF-α, 24 h after NIR PBM treatment, down-regulated the expression of MMP-2 (Figure 7D–F) and MMP-9 (Figure 7G–I).
These data well correlated with the increased and reduced gelatinase activity observed in fibroblasts after exposure to red PBM and after NIR or violet-blue PBM respectively (Figure 10D). In fact, utilizing a fluorescent gelatin degradation test, it was found that the intensity of the fluorescent signal augmented in the red PBM samples indicating that these treated fibroblasts were able to synthesize functional MMPs, whereas it decreased in NIR or violet-blue PBM ones (Figure 10D).

4. Discussion

In this comparative in vitro analysis, we provide compelling experimental evidence showing the ability of fibroblastic cells to respond differently, morphologically and functionally, to three PBM treatments performed by red, NIR, and violet-blue light centered at 635 nm, 808 nm, and 405 nm, respectively, delivered at a constant energy density of 0.4 J/cm2.
In particular, the findings of the present study highlight that red PMB treatment mainly promotes fibroblast proliferation and the cellular capability to degrade/remodel ECM components such as collagen, whereas violet-blue and even more NIR PBM stimulate the synthetic and secretive activities of the cells, in terms of collagen expression and deposition and likely the cell differentiation towards proto- or myofibroblasts. Myofibroblasts possess the immunophenotypical and ultrastructural features of either collagen-synthetically active fibroblasts with a prominent rough endoplasmic reticulum or of contractile cells exhibiting de novo expression of α-sma within well assembled actin-myosin bundles namely stress fibers and peculiar electrophysiological properties typical of smooth muscle cells. However, with respect to fibroblasts, differentiated myofibroblasts are much larger with a more polygonal shape and secrete higher quantity of proteoglycans, type-1 and type-3 collagen and other components of the ECM [37,38,39,40,41].
In particular, our above-reported conclusions are supported by the following observations.
We have demonstrated that the percentage of fibroblasts displaying the nuclear expression of Ki67 marker—which is expressed by the cells undergoing G1, S, G2, and mitosis cycle phases and absent in quiescent cells during the resting G0 phase—increased after red PBM exposure. These results agree with our previous observations in fibroblasts and other mesenchymal cells [4,34] and are in line with studies from other groups performed on normal or wounded fibroblasts, aimed to evaluate the proliferative cell response to red light [25,42,43,44,45,46,47,48,49]. By contrast NIR light induced a decrease of fibroblast proliferation, whereas violet-blue light did not modify substantially the cell proliferation rate as compared to untreated cells, according to previous reports [47,50,51,52,53,54,55].
Red PBM treated cells showed a reduced assembly of F-actin, whereas violet-blue and even more so NIR PBM treated ones displayed well assembled and defined F-actin filaments, likely stress fibers, together with a more polygonal shape and an increase in cell surface area, suggestive of a proto– or myofibroblastic phenotype. These morphological features may be coherent with the proliferation data, in line with theory stating that an increase in proliferation results in a reduction of cell size and conversely, a decrease in proliferation produces larger cells [56]. Moreover the reduction of stress fiber-like structures observed in red PBM treated cells may be indicative of motile migrating cells, based on findings showing that cells with highly motility typically display few, thin and more dynamic stress fibers and that stress fiber are not essential for cell migration [57,58]. Our results concerning the impact of red PBM on cytoskeleton assembly properties of NIH/3T3 fibroblasts are in accordance with a very recent paper by de Magalhães and co-workers [59]. However, differently from our findings, these authors did not find any difference between the cell response, in terms of actin filament content, to red and NIR light. This may be explained, in addition to the different PBM parameters applied, by the difference in cell growth substrate rigidity, i.e., gel in the work by Magalhães et al. versus plastic or glass in our work [59,60,61]. Concomitantly, cells irradiated with violet-blue and NIR light exhibited augmented expression of focal adhesion proteins namely vinculin, which appeared mainly aggregated at the end of stress fiber-like structures, and p-FAK which, among other functions, is required for stress fiber formation in fibroblasts [62]. This may be an interesting finding when considering that the formation of mature adhesion complexes associated to robust actin stress fibers results in force transmission from myofibroblasts to the surrounding ECM, essential for the contraction and closure of healing wounds [63].
Of note, we found that the cells exposed to red PBM also showed an up-regulation of the expression levels of vinculin. This is not surprising when considering that, beside its structural and adhesive role in focal adhesion contacts for cell/matrix connection, vinculin may also act as signaling protein in cell mechanotransduction and in the modulation of several molecular signaling, involved in different cellular processes such as survival, growth/proliferation (e.g., ERK) and differentiation in many types of cells, including those of mesenchymal origin [64,65,66,67].
In this study we also highlighted the capability of violet-blue and NIR light to stimulate the secretive ability of the cells in terms of type-1 collagen synthesis, differently from red light.
Interestingly, the different collagen expression in the cells subjected to the different PBM, well correlated with cell morphology and cytoskeleton organization we observed. Indeed, it has been reported that fibroblasts exhibiting a reduced assembly of actin cytoskeleton and with rounded or elongated aspect, showed a decline of type-1 collagen production [68,69].
Of interest, FAK-dependent collagen synthesis by fibroblasts has been reported, which may contribute to further support our conclusions concerning the effect of violet-blue and NIR light in stimulating the secretive ability of fibroblasts [70].
We also found that the cells treated with violet-blue and even more NIR PBM showed the cytoplasmic expression of α-sma. Even if this protein does not appear organized along the stress fiber-like structures as occurring in mature myofibroblasts, our findings further suggest the potential acquisition of a proto-myofibroblastic phenotype after violet-blue and NIR PBM. However, the effects of violet-blue or NIR PBM on myofibroblast differentiation and function deserve to be investigated deeper in our cell model. By contrast, red PBM treated cells did not exhibit α-sma expression according with previous reports showing the capability of red PBM to inhibit in vitro TGF-β1/Smad3-mediated transition of fibroblasts towards myofibroblasts or to reduce in vivo myofibroblast population and collagen deposition [4,71].
Finally, we found that red PBM was able to induce an increase of MMPs/TIMPs ratio and promote MMPs’ functionality, differently from violet-blue and NIR PBM treatments that elicited an opposite effect. Besides the role of these enzymes as secreted proteins on the ECM, involved in the maintenance of a fine balance between ECM synthesis and degradation, essential for proper wound healing (e.g., necessary for favoring cell migration and provisional scar remodeling and removal), it appears worth mentioning that a positive correlation between MMPs’ expression/function and proliferation of different cells has been proposed [35,72,73]. Thus, the possibility that tested PBM treatments influence fibroblast proliferation via MMPs’ modulation may not be excluded.
In this study, we only tested an energy density of 0.4 J/cm2 for red, violet-blue and NIR light essentially to compare only the effects of different wavelengths on fibroblast responses, eliminating the potential puzzling effect of energy density. This energy density value has been demonstrated to be an optimal one, safe and able to exert biostimulatory effects on the cells in different experimental in vitro conditions [4,5,34,74]. However, we are aware of the importance to test different energy densities in our experimental system to assess and verify the occurrence of a biphasic response with a peak dose response depicted by PBM that may account, likely together with the differences in the experimental settings and fibroblastic cell types used, for the discrepancy of our results with those reported in the literature [75,76,77]. This is a fundamental requisite to define the optimal PBM parameters able to elicit the best fibroblast responses with therapeutic effects and to appropriately translate this information into clinical protocols.
A limitation of this study mainly correlates to the in vitro experimentation on cell monolayers. If on the one side, this basic model represents a very relevant tool for studying the impact of light on the cells in a simple and reproducible way, on the other side it eliminates may relevant factors including: i) the complex architecture of a tissue affecting light propagation; ii) many mechanisms possibly regulating in vivo paracrine/juxtacrine cell–cell interactions and cell functionality; iii) the microenvironmental mechanical forces such as ECM stiffness, known to affect cell behavior by instructive signals [78,79,80]. Hence, the translation of the findings obtained in vitro to in vivo situations must be, as always, considered with caution. However, this study may provide experimental groundwork to push clinicians towards the use of multiple combined photo-treatments for addressing wound healing [12,14,81]. It is tempting to speculate that red PBM treatment in combination with violet-blue or NIR PBM, if properly conducted respecting the sequence of events through which wound healing proceeds [82], could really elicit positive biological effects and provide better results than those achieved by the single treatments for the promotion and improvement of the healing process, thus holding a promising therapeutic potential. In particular red PBM may favor the proliferative stage of wound healing stimulating the essential cellular elements such as fibroblasts [32] from the wound margin to proliferate and migrate into the wound starting to form ECM (initially containing immature type-3 collagen), while modulating the first inflammatory response as reported [83,84,85]. On the other hand, PBM mediated by violet-blue or even more NIR light may promote the late matrix remodeling (maturation) stage of wound healing, likely stimulating the differentiation of fibroblasts towards myofibroblasts and the production and deposition of mature type-1 collagen by (myo)fibroblasts, thus leading to the formation of a transient contractile scar, which reduces the wound size and allows its final closure, in an attempt to rapidly restore tissue integrity. Experiments are ongoing in our lab to further investigate the proliferative, migratory, and secretive responses of fibroblastic cells to different PBM treatments in wound models to corroborate our hypothesis.
Finally, it is also worth saying that, from a clinical perspective, multi-photonic supportive treatment to wound healing appears to be a feasible therapeutic option. Being encompassed within the so-called low-energy phototherapies, it can be effectively performed by means of LED emitters, whose major advantages are the possibility to assemble different light sources at appropriate wavelengths in a single instrument, ease of use and low costs. On the other hand, photonic therapies usually require repeated applications until achievement of the therapeutic goals. To this end, the development of portable multi-LED instruments may be desirable. Such devices would allow for the delivery of efficacious photonic wound treatment protocols at the patients’ home under medical supervision.

Author Contributions

Conceptualization, F.C., A.T., M.G., and C.S.; formal analysis, F.C., A.T., and C.S.; investigation, F.C., A.T., M.G., and C.S.; resources, F.C., M.G., S.Z.-O., and C.S.; data curation, F.C., A.T., and C.S.; writing—original draft preparation, C.S.; writing—review and editing, F.C., A.T., M.G., S.Z.-O., and C.S.; visualization, F.C., A.T., M.G., and C.S.; funding acquisition, F.C., M.G., S.Z.-O., and C.S. All authors have read and agreed to the published version of the manuscript.

Funding

This research was supported by research funds from MIUR (Ministry of Education, University and Research, University of Florence, Italy) to F.C., S.Z.-O. and C.S.; by a grant from Ente Cassa di Risparmio di Firenze, Italy to S.Z.-O. (2017/17940) and by Odontostomatologic Laser Therapy Center via dell’ Olivuzzo 162, 50143, Florence, Italy).

Acknowledgments

The authors are grateful to Tiziana Fossi (Odontostomatologic Laser Therapy Center-Dioscoride Center-via dell’Olivuzzo 162, 50143 Florence, Italy) for her kind technical support during photobiomodulation treatments and to Daniele Bani (Department of Experimental and Clinical Medicine-Section of Anatomy and Histology, Research Unit of Histology & Embryology, University of Florence) for his kind help during morphometric analysis of cell surface area.

Conflicts of Interest

The authors declare no conflict of interest.

References

  1. Chung, H.; Dai, T.; Sharma, S.K.; Huang, Y.-Y.; Carroll, J.D.; Hamblin, M.R. The Nuts and Bolts of Low-level Laser (Light) Therapy. Ann. Biomed. Eng. 2012, 40, 516–533. [Google Scholar] [CrossRef] [Green Version]
  2. Anders, J.J.; Lanzafame, R.; Arany, P. Low-Level Light/Laser Therapy Versus Photobiomodulation Therapy. Photomed. Laser Surg. 2015, 33, 183–184. [Google Scholar] [CrossRef] [PubMed] [Green Version]
  3. Mosca, R.C.; Ong, A.A.; Albasha, O.; Bass, K.; Arany, P. Photobiomodulation Therapy for Wound Care. Adv. Ski. Wound Care 2019, 32, 157–167. [Google Scholar] [CrossRef] [PubMed]
  4. Sassoli, C.; Chellini, F.; Squecco, R.; Tani, A.; Idrizaj, E.; Nosi, D.; Giannelli, M.; Bsc, S.Z.; Zecchi-Orlandini, S. Low intensity 635 nm diode laser irradiation inhibits fibroblast–myofibroblast transition reducing TRPC1 channel expression/activity: New perspectives for tissue fibrosis treatment. Lasers Surg. Med. 2015, 48, 318–332. [Google Scholar] [CrossRef] [PubMed]
  5. De Freitas, L.F.; Hamblin, M.R. Proposed Mechanisms of Photobiomodulation or Low-Level Light Therapy. IEEE J. Sel. Top. Quantum Electron. 2016, 22, 348–364. [Google Scholar] [CrossRef] [Green Version]
  6. Hamblin, M.R. Mechanisms and Mitochondrial Redox Signaling in Photobiomodulation. Photochem. Photobiol. 2018, 94, 199–212. [Google Scholar] [CrossRef] [PubMed] [Green Version]
  7. Medrado, A.P.; Andrade, Z.A. Influence of low level laser therapy on wound healing and its biological action upon myofibroblasts. Lasers Surg. Med. 2003, 32, 239–244. [Google Scholar] [CrossRef] [PubMed]
  8. Medrado, A.P.; Soares, A.P.; Santos, E.T.; Reis, S.R.D.A.; Andrade, Z.A. Influence of laser photobiomodulation upon connective tissue remodeling during wound healing. J. Photochem. Photobiol. B: Biol. 2008, 92, 144–152. [Google Scholar] [CrossRef] [PubMed]
  9. Ribeiro, M.; Albuquerque, R.L.C.; Ramalho, L.M.P.; Pinheiro, A.; Bonjardim, L.R.; Da Cunha, S.S. Immunohistochemical Assessment of Myofibroblasts and Lymphoid Cells During Wound Healing in Rats Subjected to Laser Photobiomodulation at 660 nm. Photomed. Laser Surg. 2009, 27, 49–55. [Google Scholar] [CrossRef]
  10. Chaves, M.E.D.A.; De Araújo, A.R.; Piancastelli, A.C.C.; Pinotti, M. Effects of low-power light therapy on wound healing: LASER x LED. An. Bras. Dermatol. 2014, 89, 616–623. [Google Scholar] [CrossRef]
  11. Wagner, V.P.; Curra, M.; Webber, L.P.; Nör, C.; Matte, U.; Meurer, L.; Martins, M.D. Photobiomodulation regulates cytokine release and new blood vessel formation during oral wound healing in rats. Lasers Med. Sci. 2016, 31, 665–671. [Google Scholar] [CrossRef]
  12. Lima, F.J.C.; Neto, O.B.D.O.; Barbosa, F.T.; Galvão, A.M.D.N.; Ramos, F.W.S.; De Lima, C.C.F.; Sousa-Rodrigues, C.F. Is there a protocol in experimental skin wounds in rats using low-level diode laser therapy (LLDLT) combining or not red and infrared wavelengths? Systematic review. Lasers Med. Sci. 2016, 31, 779–787. [Google Scholar] [CrossRef]
  13. Hamblin, M.R. Mechanisms and applications of the anti-inflammatory effects of photobiomodulation. AIMS Biophys. 2017, 4, 337–361. [Google Scholar] [CrossRef]
  14. Mignon, C.; Uzunbajakava, N.E.; Castellano-Pellicena, I.; Botchkareva, N.V.; Tobin, D.J. Differential response of human dermal fibroblast subpopulations to visible and near-infrared light: Potential of photobiomodulation for addressing cutaneous conditions. Lasers Surg. Med. 2018, 50, 859–882. [Google Scholar] [CrossRef]
  15. Kouhkheil, R.; Fridoni, M.; Abdollhifar, M.-A.; Amini, A.; Bayat, S.; Ghoreishi, S.K.; Chien, S.; Kazemi, M.; Bayat, M. Impact of Photobiomodulation and Condition Medium on Mast Cell Counts, Degranulation, and Wound Strength in Infected Skin Wound Healing of Diabetic Rats. Photobiomodulation Photomed. Laser Surg. 2019, 37, 706–714. [Google Scholar] [CrossRef] [PubMed]
  16. Lamaro-Cardoso, A.; Bachion, M.M.; Morais, J.M.; Fantinati, M.S.; Milhomem, A.C.; Almeida, V.L.; Vinaud, M.C.; Lino, R.S. Photobiomodulation associated to cellular therapy improve wound healing of experimental full thickness burn wounds in rats. J. Photochem. Photobiol. B Biol. 2019, 194, 174–182. [Google Scholar] [CrossRef]
  17. Gavish, L.; Hoffer, O.; Rabin, N.; Halak, M.; Shkilevich, S.; Shayovitz, Y.; Weizman, G.; Haim, O.; Gavish, B.; Gertz, S.D.; et al. Microcirculatory Response to Photobiomodulation—Why Some Respond and Others Do Not: A Randomized Controlled Study. Lasers Surg. Med. 2020, 52, 863–872. [Google Scholar] [CrossRef]
  18. Allendorf, J.D.F.; Bessler, M.; Huang, J.; Kayton, M.L.; Laird, D.; Nowygrod, R.; Treat, M.R. Helium-neon laser irradiation at fluences of 1, 2, and 4 J/cm2 failed to accelerate wound healing as assessed by both wound contracture rate and tensile strength. Lasers Surg. Med. 1997, 20, 340–345. [Google Scholar] [CrossRef]
  19. Lucas, C.; Criens-Poublon, L.; Cockrell, C.; De Haan, R. Wound healing in cell studies and animal model experiments by Low Level Laser Therapy; were clinical studies justified? a systematic review. Lasers Med. Sci. 2002, 17, 110–134. [Google Scholar] [CrossRef]
  20. Franek, A.; Król, P.; Kucharzewski, M. Does low output laser stimulation enhance the healing of crural ulceration? Some critical remarks. Med. Eng. Phys. 2002, 24, 607–615. [Google Scholar] [CrossRef]
  21. Lucas, C.; Van Gemert, M.J.C.; De Haan, R.J. Efficacy of low-level laser therapy in the management of stage III decubitus ulcers: A prospective, observer-blinded multicentre randomised clinical trial. Lasers Med. Sci. 2003, 18, 72–77. [Google Scholar] [CrossRef] [PubMed]
  22. Msc, S.C.N.; Nogueira, G.E.C.; Ribeiro, M.S.; Msc, A.S.G.; Lage-Marques, J.L. He-Ne laser effects on blood microcirculation during wound healing: A method of in vivo study through laser Doppler flowmetry. Lasers Surg. Med. 2004, 35, 363–368. [Google Scholar] [CrossRef]
  23. Damante, C.A.; Sant’Ana, A.C.; Passanezi, E.; Taga, R. Histomorphometric study of the healing of human oral mucosa after gingivoplasty and low-level laser therapy. Lasers Surg. Med. 2004, 35, 377–384. [Google Scholar] [CrossRef] [PubMed]
  24. Kopera, D.; Kokol, R.; Berger, C.; Haas, J. Does the use of low-level laser influence wound healing in chronic venous leg ulcers? J. Wound Care 2005, 14, 391–394. [Google Scholar] [CrossRef]
  25. Houreld, N.N.; Abrahamse, H. Laser light influences cellular viability and proliferation in diabetic-wounded fibroblast cells in a dose- and wavelength-dependent manner. Lasers Med. Sci. 2007, 23, 11–18. [Google Scholar] [CrossRef]
  26. Machado, R.S.; Viana, S.; Sbruzzi, G. Low-level laser therapy in the treatment of pressure ulcers: Systematic review. Lasers Med. Sci. 2017, 32, 937–944. [Google Scholar] [CrossRef]
  27. Brassolatti, P.; De Andrade, A.L.M.; Bossini, P.S.; Otterço, A.N.; Parizotto, N.A. Evaluation of the low-level laser therapy application parameters for skin burn treatment in experimental model: A systematic review. Lasers Med. Sci. 2018, 33, 1159–1169. [Google Scholar] [CrossRef]
  28. Petz, F.D.F.C.; Felix, J.V.C.; Roehrs, H.; Pott, F.S.; Stocco, J.G.D.; Labat, R.; Meier, M.J. Effect of Photobiomodulation on Repairing Pressure Ulcers in Adult and Elderly Patients: A Systematic Review. Photochem. Photobiol. 2019, 96, 191–199. [Google Scholar] [CrossRef] [PubMed]
  29. Tunér, J.; Jenkins, P.A. Parameter Reproducibility in Photobiomodulation. Photomed. Laser Surg. 2016, 34, 91–92. [Google Scholar] [CrossRef] [Green Version]
  30. Mignon, C.; Botchkareva, N.V.; Uzunbajakava, N.E.; Tobin, D.J. Photobiomodulation devices for hair regrowth and wound healing: A therapy full of promise but a literature full of confusion. Exp. Dermatol. 2016, 25, 745–749. [Google Scholar] [CrossRef] [Green Version]
  31. Huang, Y.-Y.; Sharma, S.K.; Carroll, J.; Hamblin, M.R. Biphasic Dose Response in Low Level Light Therapy—An Update. Dose-Response 2011, 9, 602–618. [Google Scholar] [CrossRef] [PubMed]
  32. Bainbridge, P. Wound healing and the role of fibroblasts. J. Wound Care 2013, 22, 407–412. [Google Scholar] [CrossRef]
  33. Desmouliere, A.; Darby, I.A.; Laverdet, B.; Bonté, F. Fibroblasts and myofibroblasts in wound healing. Clin. Cosmet. Investig. Dermatol. 2014, 7, 301–311. [Google Scholar] [CrossRef] [Green Version]
  34. Tani, A.; Chellini, F.; Giannelli, M.; Nosi, D.; Zecchi-Orlandini, S.; Sassoli, C. Red (635 nm), Near-Infrared (808 nm) and Violet-Blue (405 nm) Photobiomodulation Potentiality on Human Osteoblasts and Mesenchymal Stromal Cells: A Morphological and Molecular In Vitro Study. Int. J. Mol. Sci. 2018, 19, 1946. [Google Scholar] [CrossRef] [PubMed] [Green Version]
  35. Sassoli, C.; Pierucci, F.; Tani, A.; Frati, A.; Chellini, F.; Matteini, F.; Vestri, A.; Anderloni, G.; Nosi, D.; Zecchi-Orlandini, S.; et al. Sphingosine 1-Phosphate Receptor 1 Is Required for MMP-2 Function in Bone Marrow Mesenchymal Stromal Cells: Implications for Cytoskeleton Assembly and Proliferation. Stem Cells Int. 2018, 2018, 1–18. [Google Scholar] [CrossRef] [PubMed] [Green Version]
  36. Visse, R.; Nagase, H. Matrix Metalloproteinases and Tissue Inhibitors of Metalloproteinases. Circ. Res. 2003, 92, 827–839. [Google Scholar] [CrossRef] [Green Version]
  37. Tomasek, J.J.; Gabbiani, G.; Hinz, B.; Chaponnier, C.; Brown, R.A. Myofibroblasts and mechano-regulation of connective tissue remodelling. Nat. Rev. Mol. Cell Biol. 2002, 3, 349–363. [Google Scholar] [CrossRef]
  38. Van De Water, L.; Varney, S.; Tomasek, J.J. Mechanoregulation of the Myofibroblast in Wound Contraction, Scarring, and Fibrosis: Opportunities for New Therapeutic Intervention. Adv. Wound Care 2013, 2, 122–141. [Google Scholar] [CrossRef] [Green Version]
  39. Pakshir, P.; Hinz, B. The big five in fibrosis: Macrophages, myofibroblasts, matrix, mechanics, and miscommunication. Matrix Biol. 2018, 81–93. [Google Scholar] [CrossRef]
  40. Hinz, B.; McCulloch, C.A.; Coelho, N.M. Mechanical regulation of myofibroblast phenoconversion and collagen contraction. Exp. Cell Res. 2019, 379, 119–128. [Google Scholar] [CrossRef]
  41. Squecco, R.; Chellini, F.; Idrizaj, E.; Tani, A.; Garella, R.; Pancani, S.; Pavan, P.; Bambi, F.; Zecchi-Orlandini, S.; Sassoli, C. Platelet-Rich Plasma Modulates Gap Junction Functionality and Connexin 43 and 26 Expression During TGF-β1–Induced Fibroblast to Myofibroblast Transition: Clues for Counteracting Fibrosis. Cells 2020, 9, 1199. [Google Scholar] [CrossRef]
  42. Hawkins, D.H.; Abrahamse, H. The role of laser fluence in cell viability, proliferation, and membrane integrity of wounded human skin fibroblasts following helium-neon laser irradiation. Lasers Surg. Med. 2006, 38, 74–83. [Google Scholar] [CrossRef]
  43. Hawkins, D.; Abrahamse, H. Effect of Multiple Exposures of Low-Level Laser Therapy on the Cellular Responses of Wounded Human Skin Fibroblasts. Photomed. Laser Surg. 2006, 24, 705–714. [Google Scholar] [CrossRef]
  44. Sekhejane, P.R.; Houreld, N.N.; Abrahamse, H. Irradiation at 636 nm Positively Affects Diabetic Wounded and Hypoxic Cellsin Vitro. Photomed. Laser Surg. 2011, 29, 521–530. [Google Scholar] [CrossRef] [PubMed] [Green Version]
  45. Seo, Y.-K.; Park, J.-K.; Song, C.; Kwon, S.-Y. Comparison of light-emitting diode wavelength on activity and migration of rabbit ACL cells. Lasers Med. Sci. 2013, 29, 245–255. [Google Scholar] [CrossRef]
  46. Esmaeelinejad, M.; Bayat, M.; Darbandi, H.; Bayat, M.; Mosaffa, N. The effects of low-level laser irradiation on cellular viability and proliferation of human skin fibroblasts cultured in high glucose mediums. Lasers Med. Sci. 2013, 29, 121–129. [Google Scholar] [CrossRef]
  47. Solmaz, H.; Ulgen, Y.; Gulsoy, M. Photobiomodulation of wound healing via visible and infrared laser irradiation. Lasers Med. Sci. 2017, 32, 903–910. [Google Scholar] [CrossRef]
  48. Lou, Z.; Gong, T.; Kang, J.; Xue, C.; Ulmschneider, C.; Jiang, J.J. The Effects of Photobiomodulation on Vocal Fold Wound Healing: In Vivo and In Vitro Studies. Photobiomodulation Photomed. Laser Surg. 2019, 37, 532–538. [Google Scholar] [CrossRef]
  49. Layegh, E.R.; Fathabadi, F.F.; Lotfinia, M.; Zare, F.; Tofigh, A.M.; Abrishami, S.; Piryaei, A. Photobiomodulation therapy improves the growth factor and cytokine secretory profile in human type 2 diabetic fibroblasts. J. Photochem. Photobiol. B Biol. 2020, 210, 111962. [Google Scholar] [CrossRef]
  50. Moore, P.; Ridgway, T.D.; Higbee, R.G.; Howard, E.W.; Lucroy, M.D. Effect of wavelength on low-intensity laser irradiation-stimulated cell proliferation in vitro. Lasers Surg. Med. 2005, 36, 8–12. [Google Scholar] [CrossRef]
  51. Opländer, C.; Hidding, S.; Werners, F.B.; Born, M.; Pallua, N.; Suschek, C.V. Effects of blue light irradiation on human dermal fibroblasts. J. Photochem. Photobiol. B Biol. 2011, 103, 118–125. [Google Scholar] [CrossRef]
  52. McDonald, R.; MacGregor, S.J.; Anderson, J.G.; MacLean, M.; Grant, M.H. Effect of 405-nm high-intensity narrow-spectrum light on fibroblast-populated collagen lattices: An in vitro model of wound healing. J. Biomed. Opt. 2011, 16, 048003. [Google Scholar] [CrossRef]
  53. Mamalis, A.; Garcha, M.; Jagdeo, J. Light emitting diode-generated blue light modulates fibrosis characteristics: Fibroblast proliferation, migration speed, and reactive oxygen species generation. Lasers Surg. Med. 2015, 47, 210–215. [Google Scholar] [CrossRef] [Green Version]
  54. Feng, J.; Li, X.; Zhu, S.; Xie, Y.; Du, J.; Ge, H.; Bai, Y.; Liu, Y.; Guo, L. Photobiomodulation with 808-nm diode laser enhances gingival wound healing by promoting migration of human gingival mesenchymal stem cells via ROS/JNK/NF-κB/MMP-1 pathway. Lasers Med. Sci. 2020, 35, 1831–1839. [Google Scholar] [CrossRef]
  55. Li, W.; Hu, X.; Lu, X.; Liu, J.; Chen, Z.; Zhou, X.; Liu, M.; Liu, S. RNA-Seq analysis revealed the molecular mechanisms of photobiomodulation effect on human fibroblasts. Photodermatol. Photoimmunol. Photomed. 2020, 36, 299–307. [Google Scholar] [CrossRef]
  56. Wright, J.; Schneider, B.L. Cell Growth: When Less Means More. Curr. Biol. 2014, 24, R283–R285. [Google Scholar] [CrossRef] [PubMed] [Green Version]
  57. Pellegrin, S.; Mellor, H. Actin stress fibres. J. Cell Sci. 2007, 120, 3491–3499. [Google Scholar] [CrossRef] [Green Version]
  58. Tojkander, S.; Gateva, G.; Lappalainen, P. Actin stress fibers-assembly, dynamics and biological roles. J. Cell Sci. 2012, 125, 1855–1864. [Google Scholar] [CrossRef] [Green Version]
  59. De Magalhães, A.C.; Guimarães-Filho, Z.; Yoshimura, E.M.; Lilge, L. Photobiomodulation therapy can change actin filaments of 3T3 mouse fibroblast. Lasers Med. Sci. 2019, 35, 585–597. [Google Scholar] [CrossRef] [PubMed]
  60. Yeung, T.; Georges, P.; Flanagan, L.A.; Marg, B.; Ortiz, M.; Funaki, M.; Zahir, N.; Ming, W.; Weaver, V.; Janmey, P.A. Effects of substrate stiffness on cell morphology, cytoskeletal structure, and adhesion. Cell Motil. Cytoskelet. 2005, 60, 24–34. [Google Scholar] [CrossRef] [PubMed]
  61. Doss, B.L.; Pan, M.; Gupta, M.; Grenci, G.; Mège, R.-M.; Lim, C.T.; Sheetz, M.P.; Voituriez, R.; Ladoux, B. Cell response to substrate rigidity is regulated by active and passive cytoskeletal stress. Proc. Natl. Acad. Sci. USA 2020, 117, 12817–12825. [Google Scholar] [CrossRef] [PubMed]
  62. Katoh, K. Activation of Rho-kinase and focal adhesion kinase regulates the organization of stress fibers and focal adhesions in the central part of fibroblasts. PeerJ 2017, 5, e4063. [Google Scholar] [CrossRef]
  63. Sandbo, N.; Smolyaninova, L.V.; Orlov, S.N.; Dulin, N.O. Control of myofibroblast differentiation and function by cytoskeletal signaling. Biochemistry (Moscow) 2016, 81, 1698–1708. [Google Scholar] [CrossRef] [PubMed]
  64. Tanaka, M.; Abe, T.; Hara, Y. Roles of focal adhesions and fibronectin-mediated cohesion in proliferation of confluent fibroblasts. J. Cell. Physiol. 2009, 219, 194–201. [Google Scholar] [CrossRef]
  65. Koshimizu, T.; Kawai, M.; Kondou, H.; Tachikawa, K.; Sakai, N.; Ozono, K.; Michigami, T. Vinculin Functions as Regulator of Chondrogenesis. J. Biol. Chem. 2012, 287, 15760–15775. [Google Scholar] [CrossRef] [PubMed] [Green Version]
  66. Holle, A.W.; Tang, X.; VijayRaghavan, D.; Vincent, L.G.; Fuhrmann, A.; Choi, Y.S.; Del Álamo, J.C.; Engler, A.J. In situ mechanotransduction via vinculin regulates stem cell differentiation. STEM CELLS 2013, 31, 2467–2477. [Google Scholar] [CrossRef] [Green Version]
  67. Goldmann, W.H. Role of vinculin in cellular mechanotransduction. Cell Biol. Int. 2016, 40, 241–256. [Google Scholar] [CrossRef]
  68. Yamaba, H.; Haba, M.; Kunita, M.; Sakaida, T.; Tanaka, H.; Yashiro, Y.; Nakata, S. Morphological change of skin fibroblasts induced by UV Irradiation is involved in photoaging. Exp. Dermatol. 2016, 25, 45–51. [Google Scholar] [CrossRef] [Green Version]
  69. Qin, Z.; Fisher, G.J.; Voorhees, J.J.; Quan, T. Actin cytoskeleton assembly regulates collagen production via TGF-β type II receptor in human skin fibroblasts. J. Cell. Mol. Med. 2018, 22, 4085–4096. [Google Scholar] [CrossRef] [Green Version]
  70. Rajshankar, D.; Wang, Y.; McCulloch, C.A. Osteogenesis requires FAK-dependent collagen synthesis by fibroblasts and osteoblasts. FASEB J. 2016, 31, 937–953. [Google Scholar] [CrossRef] [Green Version]
  71. De Castro, I.C.V.; Rocha, C.A.G.; Henriques, Á.C.G.; De Sousa, A.P.C.; Lisboa, M.V.; Sotero, D.D.R.; Pinheiro, A.L.; Cury, P.R.; Dos Santos, J.N. Do laser and led phototherapies influence mast cells and myofibroblasts to produce collagen? Lasers Med. Sci. 2014, 29, 1405–1410. [Google Scholar] [CrossRef]
  72. Newby, A.C. Matrix metalloproteinases regulate migration, proliferation, and death of vascular smooth muscle cells by degrading matrix and non-matrix substrates. Cardiovasc. Res. 2006, 69, 614–624. [Google Scholar] [CrossRef]
  73. Almalki, S.G.; Agrawal, D.K. Effects of matrix metalloproteinases on the fate of mesenchymal stem cells. Stem Cell Res. Ther. 2016, 7, 1–12. [Google Scholar] [CrossRef] [Green Version]
  74. Hou, J.-F.; Zhang, H.; Yuan, X.; Li, J.; Wei, Y.-J.; Hu, S.-S. In vitro effects of low-level laser irradiation for bone marrow mesenchymal stem cells: Proliferation, growth factors secretion and myogenic differentiation. Lasers Surg. Med. 2008, 40, 726–733. [Google Scholar] [CrossRef] [PubMed]
  75. Kreisler, M.; Christoffers, A.B.; Willershausen, B.; D’Hoedt, B. Effect of low-level GaAlAs laser irradiation on the proliferation rate of human periodontal ligament fibroblasts: An in vitro study. J. Clin. Periodontol. 2003, 30, 353–358. [Google Scholar] [CrossRef]
  76. Jampa-Ngern, S.; Viravaidya-Pasuwat, K.; Suvanasuthi, S.; Khantachawana, A. Effect of laser diode light irradiation on growth capability of human hair follicle dermal papilla cells. In Proceedings of the 2017 39th Annual International Conference of the IEEE Engineering in Medicine and Biology Society (EMBC), Seogwipo, Korea, 11–15 July 2017; pp. 3592–3595. [Google Scholar] [CrossRef]
  77. Chang, L.; Fan, S.M.; Liao, Y.; Wang, W.; Chen, Y.; Lin, S.-J. Proteomic Analysis Reveals Anti-Fibrotic Effects of Blue Light Photobiomodulation on Fibroblasts. Lasers Surg. Med. 2020, 52, 358–372. [Google Scholar] [CrossRef] [PubMed]
  78. Vedrenne, N.; Coulomb, B.; Danigo, A.; Bonté, F.; Desmoulière, A. The complex dialogue between (myo)fibroblasts and the extracellular matrix during skin repair processes and ageing. Pathol. Biol. 2012, 60, 20–27. [Google Scholar] [CrossRef]
  79. El-Mohri, H.; Wu, Y.; Mohanty, S.; Ghosh, G. Impact of matrix stiffness on fibroblast function. Mater. Sci. Eng. C 2017, 74, 146–151. [Google Scholar] [CrossRef] [PubMed]
  80. Sassoli, C.; Pierucci, F.; Zecchi-Orlandini, S.; Meacci, E. Sphingosine 1-Phosphate (S1P)/ S1P Receptor Signaling and Mechanotransduction: Implications for Intrinsic Tissue Repair/Regeneration. Int. J. Mol. Sci. 2019, 20, 5545. [Google Scholar] [CrossRef] [PubMed] [Green Version]
  81. Fekrazad, R.; Sarrafzadeh, A.; Kalhori, K.A.; Khan, I.; Arany, P.R.; Giubellino, A. Improved Wound Remodeling Correlates with Modulated TGF-beta Expression in Skin Diabetic Wounds Following Combined Red and Infrared Photobiomodulation Treatments. Photochem. Photobiol. 2018, 94, 775–779. [Google Scholar] [CrossRef]
  82. Xiao, H.; Li, C.; Zhou, X.; Wang, X.; Wu, Z.; Zhang, L.; Liu, C.; Wang, Z.; An, H.; Wang, Y.; et al. A new method of microskin autografting with a Vaseline-based moisture dressing on granulation tissue. Burns 2014, 40, 337–346. [Google Scholar] [CrossRef] [PubMed]
  83. Kilik, R.; Lakyová, L.; Sabo, J.; Kruzliak, P.; Lacjaková, K.; Vasilenko, T.; Vidová, M.; Longauer, F.; Radoňak, J. Effect of Equal Daily Doses Achieved by Different Power Densities of Low-Level Laser Therapy at 635 nm on Open Skin Wound Healing in Normal and Diabetic Rats. BioMed Res. Int. 2014, 2014, 1–9. [Google Scholar] [CrossRef]
  84. Nussbaum, E.L.; Heras, F.L.; Pritzker, K.P.; Mazzulli, T.; Lilge, L. Effects of low intensity laser irradiation during healing of infected skin wounds in the rat. Photon. Lasers Med. 2014, 3, 23–36. [Google Scholar] [CrossRef]
  85. Lim, W.; Choi, H.; Kim, J.; Kim, S.; Jeon, S.; Zheng, H.; Kim, D.; Ko, Y.; Kim, D.; Sohn, H.; et al. Anti-inflammatory effect of 635 nm irradiations onin vitrodirect/indirect irradiation model. J. Oral Pathol. Med. 2014, 44, 94–102. [Google Scholar] [CrossRef]
Figure 1. Handpiece types.
Applsci 10 07878 g001
Figure 2. Evaluation of cell viability of NIH/3T3 fibroblasts performed 24 h after cell exposure to red (635 nm), NIR (808 nm) and violet-blue (405 nm) PBM. Cells not subjected to PBM treatments served as control. (AE) Syto16/PI test. (AD) Representative confocal fluorescence micrographs of cells stained for Syto16 (green) and PI (red). Scale bar: 50 µm. (E,F) Histograms displaying (E) the morphometric analysis of the percentage of Syto16 positive viable cells and (F) the absorbance of colored formazan formed by viable cells. p > 0.05.
Applsci 10 07878 g002
Figure 3. Evaluation of the morphology and of proliferation capability of NIH/3T3 fibroblasts performed 24 h after cell exposure to red (635 nm), NIR (808 nm) and violet-blue (405 nm) PBM. Cells not subjected to PBM treatments served as control. (AD) Representative phase contrast images of cells observed under an inverted phase contrast microscope. Scale bar: 20 µm. White dotted lines were depicted to better visualize the cell shape. (EH) Representative confocal fluorescence micrographs of fixed cells immunostained with antibodies against the nuclear proliferation marker Ki67 (green) and stained with Tetramethylrhodamine-conjugated WGA membrane dye (red). Scale bar: 50 µm. (I) Histogram showing the percentage of cells with Ki67 positive nuclei. Significance of difference: * p < 0.01 vs. control; p < 0.01 vs. 635 nm; # p < 0.01 vs. 808 nm; p = 0.06, 405 nm vs. control.
Applsci 10 07878 g003
Figure 4. Confocal immunofluorescence analysis of p-FAK expression in NIH/3T3 fibroblasts performed 24 h after cell exposure to red (635 nm), NIR (808 nm) and violet-blue (405 nm) PBM. Cells not subjected to PBM treatments served as control. (AD) Representative superimposed differential interference contrast (DIC) and confocal fluorescence micrographs simultaneously acquired of the cells immunostained for p-FAK (red) detection, showing the cellular localization of the protein. DIC images allow appreciating the different morphology of the cells subjected to PBM treatments. Scale bar: 30 µm. (E) Histogram of the densitometric analysis of p-FAK fluorescence intensity performed on digitized images. Significance of difference: * p < 0.01 vs control (808 nm, p = 0.0017; 405 nm, p = 0.0033); p = 0.89, 635 nm vs. control; p = 0.997, 405 nm vs. 808 nm. (F) Histogram showing the measure of cell surface area calculated on digitized DIC images by using ImageJ as indicated in Materials and Methods. Significance of difference: * p < 0.01 vs. control (808 nm, p = 0.0098; 405 nm, 0.0051); p = 0.99, 635 nm vs. control; p = 0.89, 405 nm vs. 808 nm.
Applsci 10 07878 g004
Figure 5. Confocal immunofluorescence analysis of F-actin cytoskeleton and focal adhesion plaque assembly of NIH/3T3 fibroblasts performed 24 h after cell exposure to red (635 nm), NIR (808 nm) and violet-blue (405 nm) PBM. Cells not subjected to PBM treatments served as control. (AL) Representative confocal fluorescence micrographs of fixed cells immunostained to detect vinculin (red) and incubated with Alexa 488-labeled phalloidin to label F-actin (green). Scale bar: 50 µm. (M) Histogram showing the densitometric analysis of vinculin fluorescence intensity carried out on digitized images. Significance of difference: * p = 0.001 vs. control; p = 0.001 vs. 635 nm; # p = 0.001 vs. 808 nm; p = 0.51, 405 nm vs. 635 nm.
Applsci 10 07878 g005
Figure 6. Confocal immunofluorescence analysis of type-1 collagen expression in NIH/3T3 fibroblasts performed 5 days after cell exposure to red (635 nm), NIR (808 nm) and violet-blue (405 nm) PBM. Cells not subjected to PBM treatments served as control. (AD) Representative confocal fluorescence micrographs of fixed cells immunostained to detect type-1 collagen (green). Nuclei are labeled in red with PI. Scale bar: 50 µm. (E) Histogram showing the densitometric analysis of type-1 collagen fluorescence intensity performed on digitized images. Significance of difference: * p < 0.01 vs. control; p < 0.01 vs. 635 nm; # p < 0.01 vs. 808 nm.
Applsci 10 07878 g006
Figure 7. Confocal immunofluorescence analysis of the expression of type-1 collagen, MMP-2 and MMP-9 in HDF-α fibroblasts 24 h (MMPs) or 5 days (type-1 collagen) after exposure to NIR (808 nm) PBM. Cells not subjected to PBM treatments served as control. (A,B,D,E,G,H) Representative confocal fluorescence micrographs of fixed cells immunostained for detection of (A,B) type-1 collagen, (D,E) MMP-2 and (G,H) MMP-9 (green). Nuclei are labeled in red with PI. Scale bar: 50 µm. (C,F,I) Histograms showing the densitometric analysis of (C) type-1 collagen, (F) MMP-2 and (I) MMP-9 fluorescence intensity performed on digitized images. Significance of difference: * p < 0.01 vs. control.
Applsci 10 07878 g007
Figure 8. Confocal immunofluorescence analysis of α-sma expression in NIH/3T3 fibroblasts performed 24 h after cell exposure to red (635 nm), NIR (808 nm) and violet-blue (405 nm) PBM. (AD) Representative confocal fluorescence micrographs of fixed cells immunostained to detect α-sma (green). Nuclei are marked in red with PI. Scale bar: 25 µm.
Applsci 10 07878 g008
Figure 9. Confocal immunofluorescence analysis of the expression of MMP-2 and MMP-9 and of their inhibitors, TIMP-1 and TIMP-2, in NIH/3T3 fibroblasts 24 h after cell exposure to red (635 nm), NIR (808 nm) and violet-blue (405 nm) PBM. Cells not subjected to PBM treatments served as control. (A–P) Representative confocal fluorescence micrographs of fixed cells immunostained for detection of (A–D) MMP-2, (E–H) MMP-9, (I–L) TIMP-1 and (M–P) TIMP-2 (green). Nuclei are labeled in red with PI. Scale bar: 50 µm. (Q,R) Histograms showing the densitometric analysis of (Q) MMP-2 and MMP-9 and of (R) TIMP-1 and TIMP-2 fluorescence intensity performed on digitized images. Significance of difference in Q: * p < 0.01 vs. relative control; p < 0.01 vs. 635 nm; p = 0.067 MMP-2, 405 nm vs. 808 nm; p = 0.06, MMP-9 405 nm vs. 808 nm. Significance of difference in R: * p < 0.01 vs. relative control; p < 0.01 vs. relative 635 nm, # p < 0.01 vs. relative 808 nm.
Applsci 10 07878 g009
Figure 10. Analysis of the expression and activity of MMP-2 and MMP-9 and of the expression of their inhibitors, TIMP-1 and TIMP-2, in NIH/3T3 fibroblasts 24 h after cell exposure to red (635 nm), NIR (808 nm) and violet-blue (405 nm) PBM. Cells not subjected to PBM treatments served as control. (A-C) Representative blots of western blotting analysis of (A) MMP-2 (72 KDa), (B) MMP-9 (82 KDa), (C) TIMP-1 (26 KDa) and TIMP-2 (21 KDa). The densitometric analysis of the bands normalized to β-actin (42 KDa) are reported in the histograms. (D) Gelatinase assay. NIH/3T3 fibroblasts were seeded on a fluorescein-labeled gelatin substrate (DQTM gelatin). DQTM gelatin fluorescence signal intensity (515 nm), resulting from the digestion of the gelatin by MMPs’ activity, was quantified by a spectrophotometer. Significance of difference in A: * p < 0.01 vs. control; p < 0.01 vs. 635 nm; p = 0.6, 405 nm vs. 808 nm. Significance of difference in B: * p < 0.01 vs. control; p < 0.01 vs. 635 nm; p = 0.59, 405 nm vs. 808 nm. Significance of difference in C: * p < 0.01 vs. relative control; p < 0.01 vs. relative 635 nm; # p < 0.01 vs. relative 808 nm. Significance of difference in D: * p < 0.01 vs. control; p < 0.01 vs. 635 nm; p = 0.26, 405 nm vs. 808 nm.
Applsci 10 07878 g010
Table 1. Light device specifications.
Red Diode LaserNear Infrared (NIR)
GaAlAs Diode Laser
Violet-Blue LED
Wavelength (λ)635 ± 5 nm808 ± 10 nm405 ± 5 nm
Handpiece typeFocalized zoom handpiecePolymide-coated silica Fiber NA = 0.22Light pipe glass
Applicator Diameter6 mm0.6 mm10 mm
Distance from the target30 mm66 mm11 mm
Table 2. Specifications of primary antibodies used for immunofluorescence (IF) and western blotting (WB) analyses.
Antibody NameCompanyCodeDilution
Anti-Ki67
(rabbit polyclonal)
Abcam, Cambridge, UKab15580 1:100 (IF)
Anti-phospho-Focal adhesion Kinase (p-Tyr861)
(rabbit polyclonal)
SigmaF91761:50 (IF)
Anti-vinculin
(mouse monoclonal, hVIN-1)
SigmaV91311:100 (IF)
Anti-collagen 1
(rabbit polyclonal)
Abcamab34710 1:500 (IF)
Anti-α-smooth muscle actin (sma)
(mouse monoclonal, 1A4)
Abcamab7817 1:100 (IF)
Anti-MMP-2
(rabbit polyclonal)
Abcamab37150 1:200 (IF)
1:2000 (WB)
Anti-MMP-9
(rabbit polyclonal)
Abcamab388981:100 (IF)
1:1000 (WB)
Anti-TIMP-1
(rabbit polyclonal)
Bioss, Inc., Woburn, MAbs-0415R1:50 (IF)
1:500 (WB)
anti-TIMP-2
(mouse monoclonal, 3A4)
Abcamab18281:20 (IF)
1:200 (WB)
Anti β-actin
(mouse monoclonal, AC-74)
SigmaA22281:10000 (WB)
Publisher’s Note: MDPI stays neutral with regard to jurisdictional claims in published maps and institutional affiliations.

