Abstract
Image registration is crucial in multimodal longitudinal skeletal muscle Magnetic Resonance Imaging (MRI) studies to extract reliable parameters that can be used as indicators for physio/pathological characterization of muscle tissue and for assessing the effectiveness of treatments. This paper aims at proposing a reliable registration protocol and evaluating its accuracy in a longitudinal study. The hips of 6 subjects were scanned, in a multimodal protocol, at 2 different time points by a 3 Tesla scanner; the proposed multi-step registration pipeline is based on rigid and elastic transformations implemented in SimpleITK using a multi-resolution technique. The effects of different image pre-processing (muscle masks, isotropic voxels) and different parameters’ values (learning rates and mesh sizes) were quantitatively assessed using standard accuracy indexes. Rigid registration alone does not provide satisfactory accuracy for inter-sessions alignment and a further elastic step is needed. The use of isotropic voxels, combined with the muscle masking, provides the best result in terms of accuracy. Learning rates can be increased to speed up the process without affecting the final results. The protocol described in this paper, complemented by open-source software, can be a useful guide for researchers that approach for the first time the issues related to the muscle MR image registration.
1. Introduction
Skeletal muscle is one of the largest tissues of the body, accounting for approximately 45–50% of body mass, and besides its main biomechanical role in locomotion, it is also involved in physiological and pathological metabolic processes, such as oxygen (O2) consumption, energy metabolism, and substrate turnover and storage, and it is the major protein reserve of the human body [1,2]. Medical imaging techniques, such as Computed Tomography (CT) [3], Ultrasound (US) [4], Dual-Energy X-ray Absorptiometry (DXA) [5], and Magnetic Resonance Imaging (MRI) [6], allow to non-invasively evaluate skeletal muscle morphological and functional properties related to a broad spectrum of conditions.
MRI, in particular, has been gaining increasing importance in the diagnosis and follow-up of skeletal muscle disorders [7] due to its reproducibility, variety of contrasts, and the absence of ionizing radiation exposure [1]. In particular, MRI has been used in different applications to evaluate muscle changes due to strenuous physical exercise [8], aging [9], neuromuscular disorders and dystrophies [10,11], and atrophy [12], and can be also used to assess the outcome of motor rehabilitation after an adverse event [13].
T1- and T2-weighted conventional MRI sequences usually offer an insight into anatomy and gross muscular structure, provide a reliable measure of volume [14], and can be qualitatively linked to inflammation and fat infiltration [15], but they are mostly based on the training of the observer and their scales are semi-quantitative. More advanced acquisitions, such as Dixon, quantitative T2 measurements, diffusion MRI (dMRI), and diffusion tensor imaging (DTI), provide quantitative variables and more refined characterization of physiological or degenerative processes occurring in the muscular tissue [16]. In particular, Dixon sequences can quantify fat infiltration in muscles, whereas quantitative T2 values have been related to fat infiltration, edema, inflammation, and changes in fibers structure. DTI-derived parameters are sensitive to muscular modifications occurring after ischemia, exercise, denervation, trauma, and inflammation [17], whereas DTI-based fiber tracking can help in investigating many fundamental muscle architectural properties, including pennation angle, fiber tract length, and curvature [18]. Furthermore, perfusion and pseudo-diffusion parameters calculated by the Intravoxel Incoherent Motion approach are correlated with muscle perfusion during exercise [19].
Nowadays, both clinical evaluations and research studies often employ a multimodal acquisition approach and multiple time points. Longitudinal studies are crucial to assess even subtle changes occurring to muscle tissue in the time and require a robust protocol for image alignment and registration. Most of the specific literature regarding image registration is focused on other areas/organs such as the brain [20,21] and the cardiac parenchyma [22,23] and includes workflows and metrics [24]. However, detailed protocols and pipelines, including even more technical aspects, suited for skeletal muscle images are still missing.
Indeed, registration of skeletal muscle multimodal MR images remains a challenging task since muscle tissue cannot be considered a rigid body and its shape and volume can vary depending on both patient positioning and intrinsic anatomical variations occurring in the subject between two subsequent acquisition points. As a consequence, a subtle difference in position between MRI acquisitions (e.g., the angular position of the leg, the relative position of the coil on the thigh, the stress of the coil on the thigh) can lead to high intraindividual variability, thereby making registration difficult and often requiring the calculation of a deformation field. The same issue can become even more relevant in inter-subjects’ analysis given the high variability in muscle shape and limb fat among subjects.
Manual landmarks-based registration was previously employed in muscle images [25], but since the process requires the identification of numerous points of reference in the muscle volume, this approach is too time-consuming for studies involving longitudinal acquisitions or multimodal scans. Therefore, in clinical studies, either inter-subjects or longitudinal intra-subjects, the alignment is performed using automatic intensity-based registration, typically consisting of two steps: a first transformation—rigid or affine—and a second nonlinear transformation to account for eventual relative position mismatch or natural movements of muscles and joints [26,27,28,29]. However, to the best of our knowledge, the accuracy of muscle MRI registration and the effect of the registration parameters choice on the final result have not been fully investigated, limiting the muscle registration procedure in most cases to a qualitative subjective process. To overcome this limitation, the aim of the present study is the definition of a reliable registration pipeline for longitudinal multimodal MRI studies of skeletal muscle tissue and its validation through well-established accuracy indexes.
2. Materials and Methods
2.1. Subjects
Six subjects (4 males and 2 females; age: 15.3 ± 1.4 years) were included in this study. The subjects, affected by traumatic brain injury, were enrolled in an unrelated study focused on the effect of motor rehabilitation on functional recovery and were scanned at two different time points, pre- (t0) and post-rehabilitation (t1), approximately 30 days after the first session. All subjects gave their informed consent for inclusion before they participated in the study. The study was conducted in accordance with the Declaration of Helsinki, and the protocol was approved by the Ethics Committee of the IRCCS E. Medea, Bosisio Parini (036/16CE).
2.2. MRI Acquisitions
MR images were acquired at the IRCCS E. Medea (Bosisio Parini) using a 3T Philips Achieva dStream scanner (Philips Medical Systems NV, Best, The Netherlands) using a 16-channel body coil coupled with the 12-channel receiver coil embedded in the bed.
The acquisition protocol consisted of:
- A fast field echo (FFE) T1-weighted sequence, acquired with resolution 1 × 1 × 6 mm3, 30 slices, echo time (TE) = 2 ms, repetition time (TR) = 620 ms, SENSE factor 2, number of averages (NA) = 2, acquisition time 2 min 35 s;
- A Dixon FFE sequence for fat fraction (FF) quantification, acquired with resolution 1.6 × 1.6 × 6 mm3, 40 slices, 12 echoes, flip angle 3°, echo time (TE) = 1.2 ms, inter-echo time 2.7 ms, repetition time (TR) = 16.17 ms, SENSE factor 2, acquisition time 1 min 37 s;
- A multi-echo spin-echo T2 sequence (MESE) with 15 echoes for T2 quantification, acquired with resolution 2 × 2 × 6 mm3, 40 slices, TE = 9.3 ms, inter-echo time 12.5 ms, TR = 14 s, SENSE factor 2, NA = 1, acquisition time 15 min 30 s;
- A multi-shell dMRI echo-planar imaging (EPI) sequence including 14 volumes at b = 0 s/mm2, 6 directions each at b = 2, 5, 10, 20, 50, 100, and 200 s/mm2, 10 directions at b = 400 s/mm2, 15 directions at b = 700 s/mm2, 25 directions at b = 900 s/mm2, and 30 directions at b = 1100 s/mm2 Data were acquired with resolution 2.5 × 2.5 × 5 mm3, 20 slices, TE = 58 ms, TR = 4.5 s, SENSE factor 2, NA = 1, acquisition time 11 min 33 s. Fat suppression was performed using Spectral Presaturation with Inversion Recovery (SPIR) and Spoiled Gradient Recalled (SPGR) approaches.
The field of view was centered on the hip of the weakest thigh and its positioning standardized taking into account the femoral head. Muscles of the gluteal, lateral rotator, adductor, and iliopsoas group were included in the exam.
The total scan time amounted to about 30 min.
2.3. Registration and Image Processing Workflow
In this section, all the steps constituting the proposed image post-processing and alignment protocol for multimodal MR muscle images are described. A concise graphical representation is displayed in Figure 1.
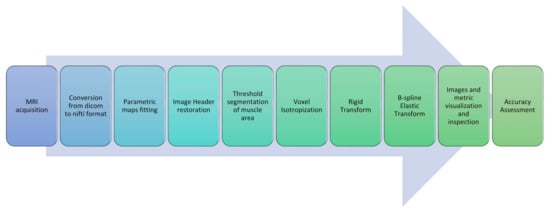
Figure 1.
Image processing and registration pipeline.
- As a very first step, all Dicom images obtained from the MRI scanner were converted to Nifti files with dcm2nii [30].
- A further step was devoted to the generation of quantitative parametric maps at t0 and t1. Fat Fraction and T2 relaxation maps were obtained with an in-house script from the Dixon and the MESE T2 sequences, respectively; T2 maps were calculated voxel-wise fitting a standard mono-exponential decay through a least-square minimization approach [31], whereas Fat Fraction maps were estimated using the regularized field map formulation and graph cut solution [32]. Finally, DTI maps, obtained from the EPI multi-shell sequence, were generated using the ExploreDTI software (v4.8.6, University Medical Center Utrecht, Utrecht, The Netherlands) [33]. All the quantitative maps generation process was carried out in the MATLAB environment.
- The headers of the estimated quantitative maps were systematically matched with the corresponding source image headers that were used as a reference. This step ensures the recovery of the correct geometrical orientation for the following registration steps.
- To suppress the contribution of the subcutaneous fat, muscle volumes were selected using the semi-automatic segmentation tool of ITK-Snap (v3.8.0) [34] before registration and used as masks to calculate the similarity metric, as shown in Figure 2.
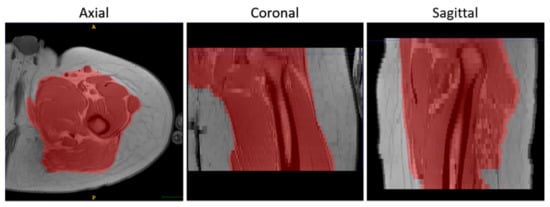 Figure 2. An example of the results of the masking step on T1-w MR images in 3 orthogonal views.
 - Finally, the voxels of the images were made isotropic to account for the sampling unevenness to improve the registration performance along the slice direction (final voxel resolution was 1×1×1 mm3).
The registration pipeline consisted of an intensity-based rigid and elastic deformation. The rigid deformation was chosen for the intra-session registration (i.e., all the maps were coregistered to the corresponding T1-w image), whereas the combination of the rigid and the elastic deformations was chosen for the longitudinal registration (t1 vs t0).
Considering their contrast, Signal to Noise Ratio (SNR), and resolution, morphological T1-w images were selected as references for both intra-session (rigid) and longitudinal registration (rigid + elastic).
The elastic registration was a classical Free-Form Deformation (FFD) based on cubic B-Splines. Mattes Mutual Information [35] was chosen as a similarity metric and a gradient descent-based optimizer in a multi-resolution strategy was used for both rigid and elastic steps of the registration pipeline. The complete parameter set-up is reported in Table 1.

Table 1.
Parameters chosen for the rigid and elastic image registration.
The effect of different learning rates—a parameter that determines the step size of the optimizer at each iteration while moving toward a minimum of the loss function—were evaluated and kept stable for each iteration and multi-resolution step. As to the elastic step, different mesh sizes were also evaluated. The mesh size is defined as the number of polynomial patches comprising the finite domain of support, and its relationship with the number of control points in any given dimension is
- The initial rigid roto-translations was performed in three conditions:
- Native resolution without selecting a mask (NM)
- Native resolution with mask (M)
- Isotropic voxels with mask (IM)
For each condition, we run the registration with five different learning rates: 1 (the default value in simple ITK), 3, 5, 10, and 15.
- In a second step, a nonrigid transformation was used, based on b-splines, with a polynomial warping of the third order. We evaluated two learning rates—2 and 4—and four—3×3×3, 5×5×5, 8×8×8, and 8×8×4—and three—3×3×3, 5×5×5, and 8×8×8—different mesh size for the native and isotropic resolution, respectively.
To improve the rigid registration performance, Dixon Water Fraction images and the first echo of T2 MESE acquisitions were used for the rigid registration to the T1w. This choice was made taking into account the similarity in the tissue contrast and the best SNR, respectively.
Differently, DWI images were firstly stacked using the median value over all acquired volumes to enhance the signal-to-noise ratio [36] and get one representative volume. Subsequently, T1w images were rigidly registered on the representative volume since it was characterized by a smaller field of view. The inverse of the rigid transformation was calculated and applied afterward to the DWI images.
The roto-translation matrix and the estimated deformation field were finally applied to all the quantitative parametric maps.
2.4. Registration Software Implementation
All processing and registration steps described in paragraph 2.3 were incorporated in a Python-based (http://www.python.org) software (v3.7.0, Python Software Foundation, Beaverton, OR 97008, USA) and graphical user interface (GUI). A screenshot of the main window is shown in Figure 3.
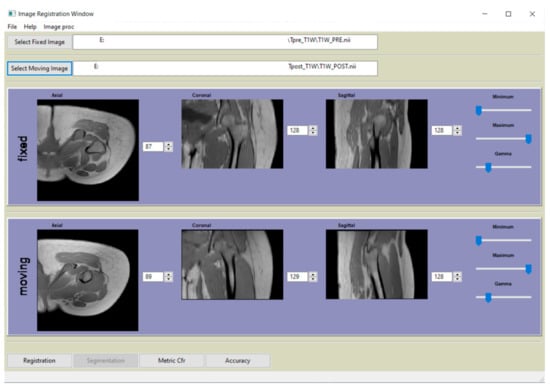
Figure 3.
Main window of the graphical user interface (GUI) of the software, developed in Python, that complement the paper.
The registration process and all registration-related functions were implemented using SimpleITK package [37], a simplified interface to the C++-based ITK library, whose design allows an easy wrapping for most interpreted languages, such as Python and R.
Miscellaneous functions for image processing and manipulation were implemented with SciPy, NumPy, Scikit-image, Matplotlib, Nibabel, and Nilearn. Support functions include accuracies indexes calculation as described in paragraph 2.5, header restoration, and evaluation of the running median using the “binapprox” method [38], running mean, and standard deviation [39]. The software allows to apply the estimated transformation to other images, and the GUI embeds a simple visualization tool to check the registration results.
The software developed in this study is freely available and can be downloaded at the following link: 10.6084/m9.figshare.13019579.
2.5. Registration Accuracy Assessment
Final images and metric evolutions were visually inspected by a bioengineer with a consolidated experience in muscular MRI images to assess the overall quality of the registration and to detect any large, noticeable issues with the transformation.
To give a quantitative assessment of the transformation accuracies, the surfaces of 4 representative hip muscles—gracilis, sartorius, gluteus maximus, and tensor fasciae latae—were manually delineated, slice by slice, on the T1w images (Figure 4) at both t0 and t1 separately with ITK-Snap [34]. Region of Interests (ROIs) volumes are listed in Table 1. Contours on t1 were then automatically deformed on the corresponding t0 volumes using the resulting transformation of each registration. Nearest-neighbor interpolation was applied to keep the integer values of the original labels.
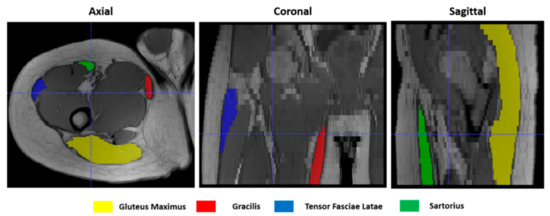
Figure 4.
Muscle ROIs delineation on T1-w MR images in 3 orthogonal views.
Finally, an additional region was derived adding the volumes of all 4 muscles (Sum Region—SR).
The following indexes were then calculated:
- Dice similarity index (DSI) [40], quantifying the agreement between contours according to the degree of overlap of their volumes. It ranges between 0 and 1, where 1 indicates a perfect overlap:
- Mean surface distance (MSD), calculated in SimpleITK as the average symmetric distance between two contours A and B:
- Hausdorff distance (HD) [41], defined in SimpleITK as the maximum of the symmetric surface distance between two contours A and B [42]:
The accuracy metrics were evaluated considering the muscle ROIs, delineated at t0 and t1, having the original image resolution. Therefore, t1 ROIs were previously registered to t0 using the appropriate transformation matrix.
2.6. Statistical Methods
A Wilcoxon signed-rank test was employed for testing the differences in muscle volumes between t0 and t1. To compare the performances of the various registration schemes, we performed a Kruskal–Wallis test after each step. We then calculated the pairwise comparisons between group levels with the Benjamini and Hochberg correction for multiple testing. The agreement between a set of measures was evaluated with the Intraclass Correlation Coefficient (ICC) in the Two-way mixed effects, absolute agreement, and single measurement form [43]. All statistical analyses were performed with R version 3.6.2 (https://www.r-project.org/).
3. Results
The volumes of all considered muscles, as included in our ROIs and listed in Table 2, were not significantly different between t0 and t1 (p > 0.05) among subjects.
Table 2.
Subjects’ muscle ROIs volumes as manually delineated on T1-w images.
3.1. Accuracy Assessment for Rigid Registration
As shown in Figure 5, the overall registration performance metrics, calculated after applying the rigid transformations at different learning rates and considering the 4 ROIs together, were acceptable for both the NM and the IM condition, aside from IM with learning rate 1. DSI, in particular, was generally higher than 0.75, and MSD smaller than 2 mm, regardless of the learning rate. Regarding the HD, the values exhibited a wider variability among subjects, but again IM and NM schemes were the best choice. In general, IM presented the lowest variability in all the accuracy indexes.
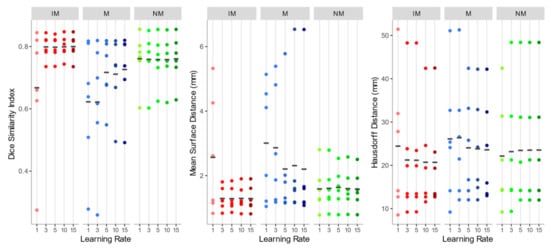
Figure 5.
Dice similarity index (DSI), mean surface distance (MSD), and Hausdorff distance (HD) values of the isotropic voxels with mask (IM), native resolution with mask (M), native resolution without selecting a mask (NM) rigid registration schemes. The accuracy indexes were evaluated considering the 4 muscle ROIs together.
As to the M condition, on the other hand, several cases showed a DSI < 0.6 and a MSD higher than 4 mm, and a much larger variation between observations was highlighted. Furthermore, in at least two cases, the registration failed to align the two images (DSI < 0.2). Considering its poor performance, M condition was not further considered for the non-rigid quantitative assessment.
Considering the accuracy metrics of the four muscles separately, as shown in Figure 6, the same trend of the aggregated regions, with a larger value of DSI and smaller values of MSD for NM and IM groups was found. Registration performances, taking into account all schemes of the rigid transformation, were notably better for muscles with larger volumes (e.g., gluteus maximus and tensor fasciae latae).
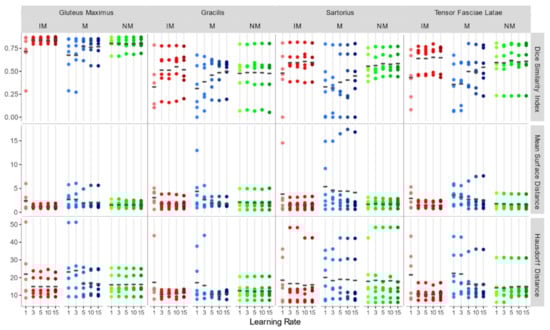
Figure 6.
DSI, MSD (mm), and HD (mm) for each individual considered muscle (Gluteus Maximus, Gracilis, Sartorius, Tensor Fasciae Latae) for rigid registration schemes.
Since no statistically significant differences were found between the schemes of any group with Kruskal–Wallis H tests (DSI: chi-squared = 15.10, df = 14, p-value = 0.37; MSD: chi-squared = 11.67, df = 14, p-value = 0.63; HD: chi-squared = 2.99, df = 14, p-value = 0.99), NM with learning rate 15 (DSI: 0.760 ± 0.078; MSD: 1.582 ± 0.586 mm; HD: 23.529 ± 14.046 mm) and IM with learning rate 15 (DSI: 0.800 ± 0.039; MSD: 1.289 ± 0.39 mm; HD: 20.696 ± 11.447 mm) were both chosen as the first steps of the registration pipeline, favoring a larger learning rate to speed up the alignment process.
3.2. Accuracy Assessment for Rigid + Non-Rigid Registration
As shown comparing Figure 5 and Figure 7, the use of elastic registration following the rigid step improves the performance in each condition. Furthermore, registration performance metrics considering both the rigid and the non-rigid steps, evaluated with different learning rates and mesh sizes, were systematically better in the IM group. Kruskal–Wallis H tests showed that there were statistically significant differences in both DSI (chi-squared = 49.55, p <0.05, df = 13) and MSD (chi-squared = 49,32, p < 0.05, df = 13) but not in HD (chi-squared = 8.50, p = 0.81, df = 13). The analysis of ICC coefficients highlights a weak agreement (<0.5) between IM and NM conditions. P-values of pairwise comparisons and ICCs are shown in Figure 8.
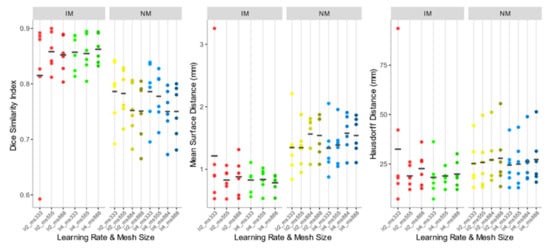
Figure 7.
DSI, MSD, and HD values of the IM, NM elastic registration schemes. The accuracy indexes were evaluated considering the 4 muscle ROIs together.
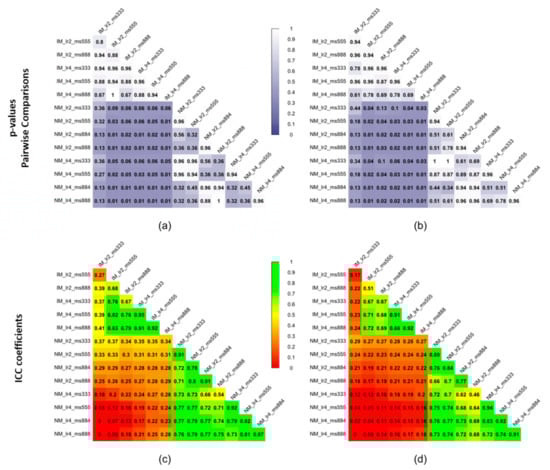
Figure 8.
Statistical significance expressed as p-values of pairwise comparisons using the Wilcoxon rank sum test for (a) DSI and (b) MSD and intraclass correlation coefficients (ICCs) for (c) DSI and (d) MSD of the non-rigid registration step considering the 4 muscle ROIs together.
Accuracy indexes of the NM group are generally better for the 3×3×3 mesh, regardless of the learning rate, and tend to worsen as the mesh grows denser.
In the IM group, on the other hand, the performance of the deformable registration is better with a thicker mesh and a larger learning rate. The best values of DSI and MSD are found for the IM with learning rate 4 and mesh size 8,8,8 (IM_lr4_ms888) (DSI: 0.862 ± 0.026; MSD: 0.784 ± 0.136 mm), while HD does not show substantial differences among the registration schemes.
Accuracy indexes for each individual muscle (Figure 9) show the same trend.
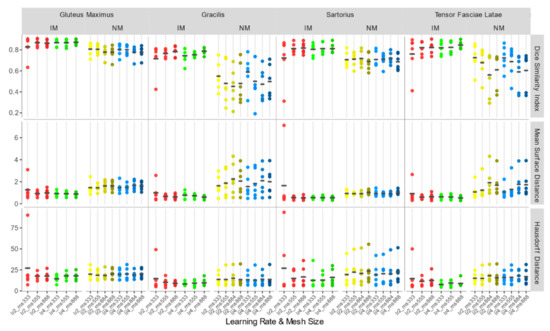
Figure 9.
DSI, MSD (mm), and HD (mm) for each individual considered muscle (Gluteus Maximus, Gracilis, Sartorius, Tensor Fasciae Latae) for non-rigid registration schemes.
The images of a sample subject after all registration steps are shown in Figure 10. Multimodal acquisitions are shown registered on their intra-session T1-w scan.
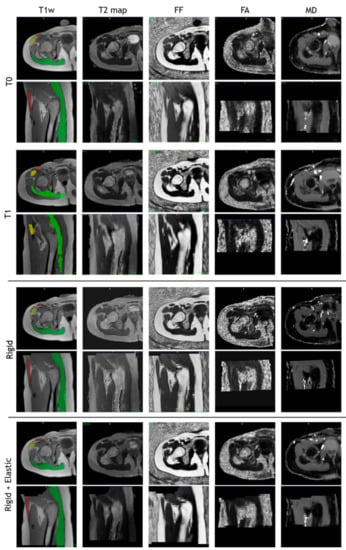
Figure 10.
T1-w, T2 map, fat fraction, fractional anisotropy, and mean diffusivity map after intra-session rigid registration and rigid and non-rigid registration steps of a sample subject.
4. Discussion
In the present study, a reliable pipeline for multimodal muscle MRI registration was presented. A quantitative assessment of the effects of various parameters of a multi-step registration approach was evaluated and open-source registration software, based on Python and SimpleITK, was developed to apply the proposed processing and registration protocol.
The main findings of the paper can be summarized as follows:
- Rigid transformation is not sufficient to achieve a good registration performance in muscle MRI, and a second deformable step is needed.
- In the first rigid step, the use of a masking strategy alone is not sufficient to obtain good results. Furthermore, the performances are poorly depending on the learning rates of the gradient descent optimizer and a larger learning rate is preferable to speed up the process.
- Regarding the deformable transformation step, working with an isotropic voxel in combination with a masking strategy leads to better accuracy, and larger learning rates are preferable.
Based on the three accuracy indexes, measuring both overlap and distance between contours, we found that rigid transformation, alone, can produce results acceptable enough to avoid registration failures since the overall DSI was > 0.7 and the MSD < 5 mm. A DSI < 0.7 and an MSD > 5 mm were previously reported as the thresholds for considering registration failures [29,44]. To achieve a good level of performance (DSI > 0.8 and MSD < 1 mm), though, we found that a non-rigid transformation step is needed. This is particularly evident in the case of individual muscles with smaller volumes, which had lower DSI and higher MSD associated with a larger variability among subjects. The HD metric did not show significant differences and seems to be scarcely discriminating among different conditions. The elastic alignment is necessary to recover deformation that can occur in different sessions, whereas the rigid registration is adequate to recover the intra-session deformation as qualitatively shown in this paper.
Previous studies, clinical investigations [27,28], and atlas validations for muscle MRI registration and segmentation [29,45,46] highlighted the need to employ a deformable transformation after a rigid or affine one since skeletal muscles are prone to shape and volume variations, even in short periods, due to position, athletic training [47], atrophy induced by microgravity, bed rest, casts, leg braces or intrinsic pathologies [48], and temperature [49]. However, the lack of technical details and quantitative accuracy assessment is a weakness of the previous papers.
In our pipeline, we proposed to work with images having isotropic voxels. In fact, resolution of upper and lower limb MRI acquisition is generally highly anisotropic along the axial direction, this increases the partial volume effect [50,51] and, therefore, it affects the registration results. Our results showed that voxels isotropization has a slight but not statistically significant effect on rigid registration performances. On the other hand, we found that non-rigid registration carried out on images with isotropic voxels performed systematically better compared to images with native resolution. Interestingly, we also found that in the sub-optimal NM group the anisotropic mesh has the worst performances for both learning rates. Therefore, the resulting under-sampling along one direction most likely affects the non-rigid registration output, probably because the optimizer is more likely to reach a local minimum with an uneven sampling, and the loss of information along the more anisotropic direction compromises the intensity matching.
The masking approach used to focus the registration specifically on the muscle tissue without considering the confounding contribution of the surrounding tissues (such as subcutaneous fat) is effective if used in combination with the isotropic voxel condition. Previous papers have shown that suppressing the elements of no interest increases the accuracy and robustness of image registration in other anatomical regions such as the brain [52] and the lung [53].
Performance metrics calculated on the selected registration scheme are consistent with those reported in previous literature. Bouhrara et al. [49], in their ex-vivo experiment, investigating the effect of heating on bovine muscle, reported an MSD, calculated between couples of landmark points on six consecutive slices, ranging between 0.34 and 1.1 mm but with a higher image resolution. More recently, Le Troter et al. [29] reported, using clinical MRI, average DSI values ranging from 0.72 to 0.94. It is worth noticing that the muscle groups considered in the previous papers are different from those analyzed in this work.
While significant differences were found in the considered registration schemes, the paper is based on a limited number of subjects and not entirely representative of a usually studied population; this can mainly affect the variability of the results. Therefore, a wider group of patients, including also healthy subjects, can strengthen the significance of our results, and validation on different muscle groups could provide information on the robustness of the method even in other experimental settings.
The study is accompanied by an open-source software that is virtually extendable to the image registration of other body parts since the protocol could be easily adapted accordingly and the implementation of more features (e.g., non-gradient descent-based optimizers, finer evaluation metrics, or a regularization term) may be added to account for eventual peculiar characteristics of the specific anatomical district.
In conclusion, the present study is a first attempt to propose and assess a reliable pipeline for the automated intra-session and longitudinal muscle MR images registration, in a multimodal study. Using a robust image registration protocol is crucial to estimate accurate deformation fields to be applied to multimodal images or different contours for extracting reliable parameters from quantitative MRI-derived maps reducing the bias due to the manual ROIs delineation, especially in longitudinal studies. The protocol can be a useful guide for researchers that approach for the first time the issues related to the muscle image registration.
Author Contributions
Conceptualization, L.F., A.M., E.S., and G.R.; methodology, L.F., A.M., E.S., and D.P.; software, L.F.; investigation, D.P., E.B., S.S., and F.A.; data curation, D.P., E.B., and F.A.; writing—original draft preparation, L.F. and A.M.; writing—review and editing, L.F., A.M., E.S., D.P., E.B., S.S., and G.R.; supervision, A.M. and G.R.; funding acquisition, F.A. and G.R. All authors have read and agreed to the published version of the manuscript.
Funding
The work was partially funded by the Italian Ministry of Health (Ricerca Corrente “Valutazione funzionale e RM degli effetti sul muscolo di programmi di training riabilitativo robot-assistito e tradizionale in soggetti con esiti di lesioni cerebrali acquisite: studio pilota”) and by Fondazione Cariplo and Regione Lombardia, Grant/Award Number: Progetto Empatia@Lecco, ref 2016-1428.
Conflicts of Interest
The authors declare no conflict of interest.
References
- Erlandson, M.C.; Lorbergs, A.L.; Mathur, S.; Cheung, A.M. Muscle analysis using pQCT, DXA and MRI. Eur. J. Radiol. 2016, 85, 1505–1511. [Google Scholar] [CrossRef] [PubMed]
- Rivas, D.A.; Fielding, R.A. Skeletal Muscle. In Encyclopedia of Human Nutrition; Elsevier Inc.: Amsterdam, The Netherlands, 2012; Volume 4, pp. 193–199. ISBN 9780123848857. [Google Scholar]
- Engelke, K.; Museyko, O.; Wang, L.; Laredo, J.D. Quantitative analysis of skeletal muscle by computed tomography imaging—State of the art. J. Orthop. Transl. 2018, 15, 91–103. [Google Scholar] [CrossRef] [PubMed]
- Pillen, S.; van Alfen, N. Skeletal muscle ultrasound. Neurol. Res. 2011, 33, 1016–1024. [Google Scholar] [CrossRef] [PubMed]
- Chen, Z.; Wang, Z.M.; Lohman, T.; Heymsfield, S.B.; Outwater, E.; Nicholas, J.S.; Bassford, T.; LaCroix, A.; Sherrill, D.; Punyanitya, M.; et al. Dual-energy X-ray absorptiometry is a valid tool for assessing skeletal muscle mass in older women. J. Nutr. 2007, 137, 2775–2780. [Google Scholar] [CrossRef] [PubMed]
- Dahlqvist, J.R.; Widholm, P.; Leinhard, O.D.; Vissing, J. MRI in Neuromuscular Diseases: An Emerging Diagnostic Tool and Biomarker for Prognosis and Efficacy. Ann. Neurol. 2020, 88, 669–681. [Google Scholar] [CrossRef] [PubMed]
- Smitaman, E.; Flores, D.V.; Mejía Gómez, C.; Pathria, M.N. MR imaging of atraumatic muscle disorders. Radiographics 2018, 38, 500–522. [Google Scholar] [CrossRef]
- Froeling, M.; Oudeman, J.; Strijkers, G.J.; Maas, M.; Drost, M.R.; Nicolay, K.; Nederveen, A.J. Muscle changes detected with diffusion-tensor imaging after long-distance running. Radiology 2015, 274, 548–562. [Google Scholar] [CrossRef] [PubMed]
- Farrow, M.; Biglands, J.; Tanner, S.F.; Clegg, A.; Brown, L.; Hensor, E.M.A.; O’Connor, P.; Emery, P.; Tan, A.L. The effect of ageing on skeletal muscle as assessed by quantitative MR imaging: An association with frailty and muscle strength. Aging Clin. Exp. Res. 2020, 1–11. [Google Scholar] [CrossRef]
- Díaz-Manera, J.; Llauger, J.; Gallardo, E.; Illa, I. Muscle MRI in muscular dystrophies. Acta Myol. Myopathies Cardiomyopathies Off. J. Mediterr. Soc. Myol. 2015, 34, 95–108. [Google Scholar]
- Carlier, P.G.; Reyngoudt, H. The expanding role of MRI in neuromuscular disorders. Nat. Rev. Neurol. 2020, 16, 301–302. [Google Scholar] [CrossRef]
- Weber, M.A.; Wolf, M.; Wattjes, M.P. Imaging Patterns of Muscle Atrophy. Semin. Musculoskelet. Radiol. 2018, 22, 299–306. [Google Scholar] [CrossRef]
- Psatha, M.; Wu, Z.; Gammie, F.M.; Ratkevicius, A.; Wackerhage, H.; Lee, J.H.; Redpath, T.W.; Gilbert, F.J.; Ashcroft, G.P.; Meakin, J.R.; et al. A longitudinal study of muscle rehabilitation in the lower leg after cast removal using magnetic resonance imaging and strength assessment. Int. Biomech. 2015, 2, 101–112. [Google Scholar] [CrossRef]
- Pons, C.; Borotikar, B.; Garetier, M.; Burdin, V.; Ben Salem, D.; Lempereur, M.; Brochard, S. Quantifying skeletal muscle volume and shape in humans using MRI: A systematic review of validity and reliability. PLoS ONE 2018, 13, e207847. [Google Scholar] [CrossRef]
- Mercuri, E.; Talim, B.; Moghadaszadeh, B.; Petit, N.; Brockington, M.; Counsell, S.; Guicheney, P.; Muntoni, F.; Merlini, L. Clinical and imaging findings in six cases of congenital muscular dystrophy with rigid spine syndrome linked to chromosome 1p (RSMD1). Neuromuscul. Disord. 2002, 12, 631–638. [Google Scholar] [CrossRef]
- Kalia, V.; Leung, D.G.; Sneag, D.B.; Del Grande, F.; Carrino, J.A. Advanced MRI Techniques for Muscle Imaging. Semin. Musculoskelet. Radiol. 2017, 21, 459–469. [Google Scholar] [CrossRef]
- Oudeman, J.; Nederveen, A.J.; Strijkers, G.J.; Maas, M.; Luijten, P.R.; Froeling, M. Techniques and applications of skeletal muscle diffusion tensor imaging: A review. J. Magn. Reson. Imaging 2016, 43, 773–788. [Google Scholar] [CrossRef]
- Damon, B.M.; Buck, A.K.W.; Ding, Z. Diffusion-tensor MRI-based skeletal muscle fiber tracking. Imaging Med. 2011, 3, 675–687. [Google Scholar] [CrossRef]
- Mastropietro, A.; Porcelli, S.; Cadioli, M.; Rasica, L.; Scalco, E.; Gerevini, S.; Marzorati, M.; Rizzo, G. Triggered intravoxel incoherent motion MRI for the assessment of calf muscle perfusion during isometric intermittent exercise. NMR Biomed. 2018, 31, e3922. [Google Scholar] [CrossRef]
- Jenkinson, M.; Bannister, P.; Brady, M.; Smith, S. Improved optimization for the robust and accurate linear registration and motion correction of brain images. Neuroimage 2002, 17, 825–841. [Google Scholar] [CrossRef]
- Klein, A.; Andersson, J.; Ardekani, B.A.; Ashburner, J.; Chiang, M.-C.; Christensen, G.E.; Collins, D.L.; Gee, J.; Hellier, P.; Song, J.H.; et al. Evaluation of 14 nonlinear deformation algorithms applied to human brain MRI registration. Neuroimage 2009, 46, 786–802. [Google Scholar] [CrossRef]
- Tavakoli, V.; Amini, A.A. A survey of shaped-based registration and segmentation techniques for cardiac images. Comput. Vis. Image Underst. 2013, 117, 966–989. [Google Scholar] [CrossRef]
- Tsadok, Y.; Friedman, Z.; Haluska, B.A.; Hoffmann, R.; Adam, D. Myocardial strain assessment by cine cardiac magnetic resonance imaging using non-rigid registration. Magn. Reson. Imaging 2016, 34, 381–390. [Google Scholar] [CrossRef] [PubMed]
- Montin, E.; Belfatto, A.; Bologna, M.; Meroni, S.; Cavatorta, C.; Pecori, E.; Diletto, B.; Massimino, M.; Oprandi, M.C.; Poggi, G.; et al. A multi-metric registration strategy for the alignment of longitudinal brain images in pediatric oncology. Med. Biol. Eng. Comput. 2020, 58, 843–855. [Google Scholar] [CrossRef] [PubMed]
- Barnhill, E.; Kennedy, P.; Hammer, S.; Van Beek, E.J.R.; Brown, C.; Roberts, N. Statistical mapping of the effect of knee extension on thigh muscle viscoelastic properties using magnetic resonance elastography. Physiol. Meas. 2013, 34, 1675–1698. [Google Scholar] [CrossRef] [PubMed]
- Fouré, A.; Le Troter, A.; Guye, M.; Mattei, J.P.; Bendahan, D.; Gondin, J. Localization and quantification of intramuscular damage using statistical parametric mapping and skeletal muscle parcellation. Sci. Rep. 2015, 5, 18580. [Google Scholar] [CrossRef]
- Fatehi, F.; Salort-Campana, E.; Le Troter, A.; Lareau-Trudel, E.; Bydder, M.; Fouré, A.; Guye, M.; Bendahan, D.; Attarian, S. Long-term follow-up of MRI changes in thigh muscles of patients with Facioscapulohumeral dystrophy: A quantitative study. PLoS ONE 2017, 12, e0183825. [Google Scholar] [CrossRef]
- Arrigoni, F.; De Luca, A.; Velardo, D.; Magri, F.; Gandossini, S.; Russo, A.; Froeling, M.; Bertoldo, A.; Leemans, A.; Bresolin, N.; et al. Multiparametric quantitative MRI assessment of thigh muscles in limb-girdle muscular dystrophy 2A and 2B. Muscle Nerve 2018, 58, 550–558. [Google Scholar] [CrossRef]
- Le Troter, A.; Fouré, A.; Guye, M.; Confort-Gouny, S.; Mattei, J.P.; Gondin, J.; Salort-Campana, E.; Bendahan, D. Volume measurements of individual muscles in human quadriceps femoris using atlas-based segmentation approaches. Magn. Reson. Mater. Phys. Biol. Med. 2016, 29, 245–257. [Google Scholar] [CrossRef]
- Li, X.; Morgan, P.S.; Ashburner, J.; Smith, J.; Rorden, C. The first step for neuroimaging data analysis: DICOM to NIfTI conversion. J. Neurosci. Methods 2016, 264, 47–56. [Google Scholar] [CrossRef]
- Carneiro, A.A.O.; Vilela, G.R.; De Araujo, D.B.; Baffa, O. MRI Relaxometry: Methods and Applications. Braz. J. Phys. 2006, 36, 9–15. [Google Scholar] [CrossRef]
- Hernando, D.; Kellman, P.; Haldar, J.P.; Liang, Z.P. Robust water/fat separation in the presence of large field inhomogeneities using a graph cut algorithm. Magn. Reson. Med. 2010, 63, 79–90. [Google Scholar] [CrossRef]
- Leemans, A.; Jeurissen, B.; Sijbers, J.; Jones, D. ExploreDTI: A graphical toolbox for processing, analyzing, and visualizing diffusion MR data. Proc. 17th Sci. Meet. Int. Soc. Magn. Reson. Med. 2009, 17, 3537. [Google Scholar]
- Yushkevich, P.A.; Piven, J.; Hazlett, H.C.; Smith, R.G.; Ho, S.; Gee, J.C.; Gerig, G. User-guided 3D active contour segmentation of anatomical structures: Significantly improved efficiency and reliability. Neuroimage 2006, 31, 1116–1128. [Google Scholar] [CrossRef]
- Mattes, D.; Haynor, D.R.; Vesselle, H.; Lewellyn, T.K.; Eubank, W. Nonrigid multimodality image registration. In Medical Imaging 2001: Image Processing; International Society for Optics and Photonics: San Diego, CA, USA, 2009; Volume 4322, pp. 1609–1620. [Google Scholar]
- White, R.L.; Helfand, D.J.; Becker, R.H.; Glikman, E.; de Vries, W. Signals from the Noise Image Stacking for Quasars in the FIRST Survey. Astrophys. J. 2006, 208, 99. [Google Scholar] [CrossRef]
- Lowekamp, B.C.; Chen, D.T.; Ibáñez, L.; Blezek, D. The design of simpleITK. Front. Neuroinform. 2013, 7, 45. [Google Scholar] [CrossRef]
- Tibshirani, R.J. Fast computation of the median by successive binning. arXiv 2008, arXiv:0806.3301. [Google Scholar]
- Welford, B.P. Note on a Method for Calculating Corrected Sums of Squares and Products. Technometrics 1962, 4, 419–420. [Google Scholar] [CrossRef]
- Dice, L.R. Measures of the Amount of Ecologic Association between Species; Ecological Society of America Stable: Washington, DC, USA, 1945; pp. 297–302. Available online: http://www.jstor.org/stable/1932409 (accessed on 2 November 2020).
- Huttenlocher, D.P.; Rucklidge, W.J.; Klanderman, G.A. Comparing images using the Hausdorff distance under translation. In Proceedings of the 1992 IEEE Computer Society Conference on Computer Vision and Pattern Recognition, Champaign, IL, USA, 15–18 June 1992. [Google Scholar] [CrossRef]
- Rote, G. Computing the minimum Hausdorff distance between two point sets on a line under translation. Inf. Process. Lett. 1991, 38, 123–127. [Google Scholar] [CrossRef]
- Koo, T.K.; Li, M.Y. A Guideline of Selecting and Reporting Intraclass Correlation Coefficients for Reliability Research. J. Chiropr. Med. 2016, 15, 155–163. [Google Scholar] [CrossRef]
- Ou, Y.; Akbari, H.; Bilello, M.; Da, X.; Davatzikos, C. Comparative evaluation of registration algorithms in different brain databases with varying difficulty: Results and insights. IEEE Trans. Med. Imaging 2014, 33, 2039–2065. [Google Scholar] [CrossRef] [PubMed]
- Scheys, L.; Loeckx, D.; Spaepen, A.; Suetens, P.; Jonkers, I. Atlas-based non-rigid image registration to automatically define line-of-action muscle models: A validation study. J. Biomech. 2009, 42, 565–572. [Google Scholar] [CrossRef]
- Karlsson, A.; Rosander, J.; Romu, T.; Tallberg, J.; Grönqvist, A.; Borga, M.; Dahlqvist Leinhard, O. Automatic and quantitative assessment of regional muscle volume by multi-atlas segmentation using whole-body water-fat MRI. J. Magn. Reson. Imaging 2015, 41, 1558–1569. [Google Scholar] [CrossRef]
- Benito, P.J.; Cupeiro, R.; Ramos-Campo, D.J.; Alcaraz, P.E.; Rubio-Arias, J. A systematic review with meta-analysis of the effect of resistance training on whole-body muscle growth in healthy adult males. Int. J. Environ. Res. Public Health 2020, 17, 1285. [Google Scholar] [CrossRef] [PubMed]
- Gao, Y.; Arfat, Y.; Wang, H.; Goswami, N. Muscle atrophy induced by mechanical unloading: Mechanisms and potential countermeasures. Front. Physiol. 2018, 9, 235. [Google Scholar] [CrossRef]
- Bouhrara, M.; Lehallier, B.; Clerjon, S.; Damez, J.L.; Bonny, J.M. Mapping of muscle deformation during heating: In situ dynamic MRI and nonlinear registration. Magn. Reson. Imaging 2012, 30, 422–430. [Google Scholar] [CrossRef] [PubMed]
- Vos, S.B.; Jones, D.K.; Viergever, M.A.; Leemans, A. Partial volume effect as a hidden covariate in DTI analyses. Neuroimage 2011, 55, 1566–1576. [Google Scholar] [CrossRef]
- Oouchi, H.; Yamada, K.; Sakai, K.; Kizu, O.; Kubota, T.; Ito, H.; Nishimura, T. Diffusion anisotropy measurement of brain white matter is affected by voxel size: Underestimation occurs in areas with crossing fibers. Am. J. Neuroradiol. 2007, 28, 1102–1106. [Google Scholar] [CrossRef]
- Hajnal, J.V.; Saeed, N.; Oatridge, A.; Williams, E.J.; Young, I.R.; Bydder, G.M. Detection of subtle brain changes using sub voxel registration and subtraction of serial mr images. J. Comput. Assist. Tomogr. 1995, 19, 677–691. [Google Scholar] [CrossRef]
- Blaffert, T.; Wiemker, R. Comparison of different follow-up lung registration methods with and without segmentation. In Proceedings of the Medical Imaging 2004: Image Processing, San Diego, CA, USA, 16–19 February 2004; Fitzpatrick, J.M., Sonka, M., Eds.; SPIE: St. Bellingham, WA, USA, 2004; p. 1701. [Google Scholar]
Publisher’s Note: MDPI stays neutral with regard to jurisdictional claims in published maps and institutional affiliations. |
© 2020 by the authors. Licensee MDPI, Basel, Switzerland. This article is an open access article distributed under the terms and conditions of the Creative Commons Attribution (CC BY) license (http://creativecommons.org/licenses/by/4.0/).