Biomass Dynamics in a Fragment of Brazilian Tropical Forest (Caatinga) over Consecutive Dry Years

 , ,
, ,
Abstract
1. Introduction
2. Materials and Methods
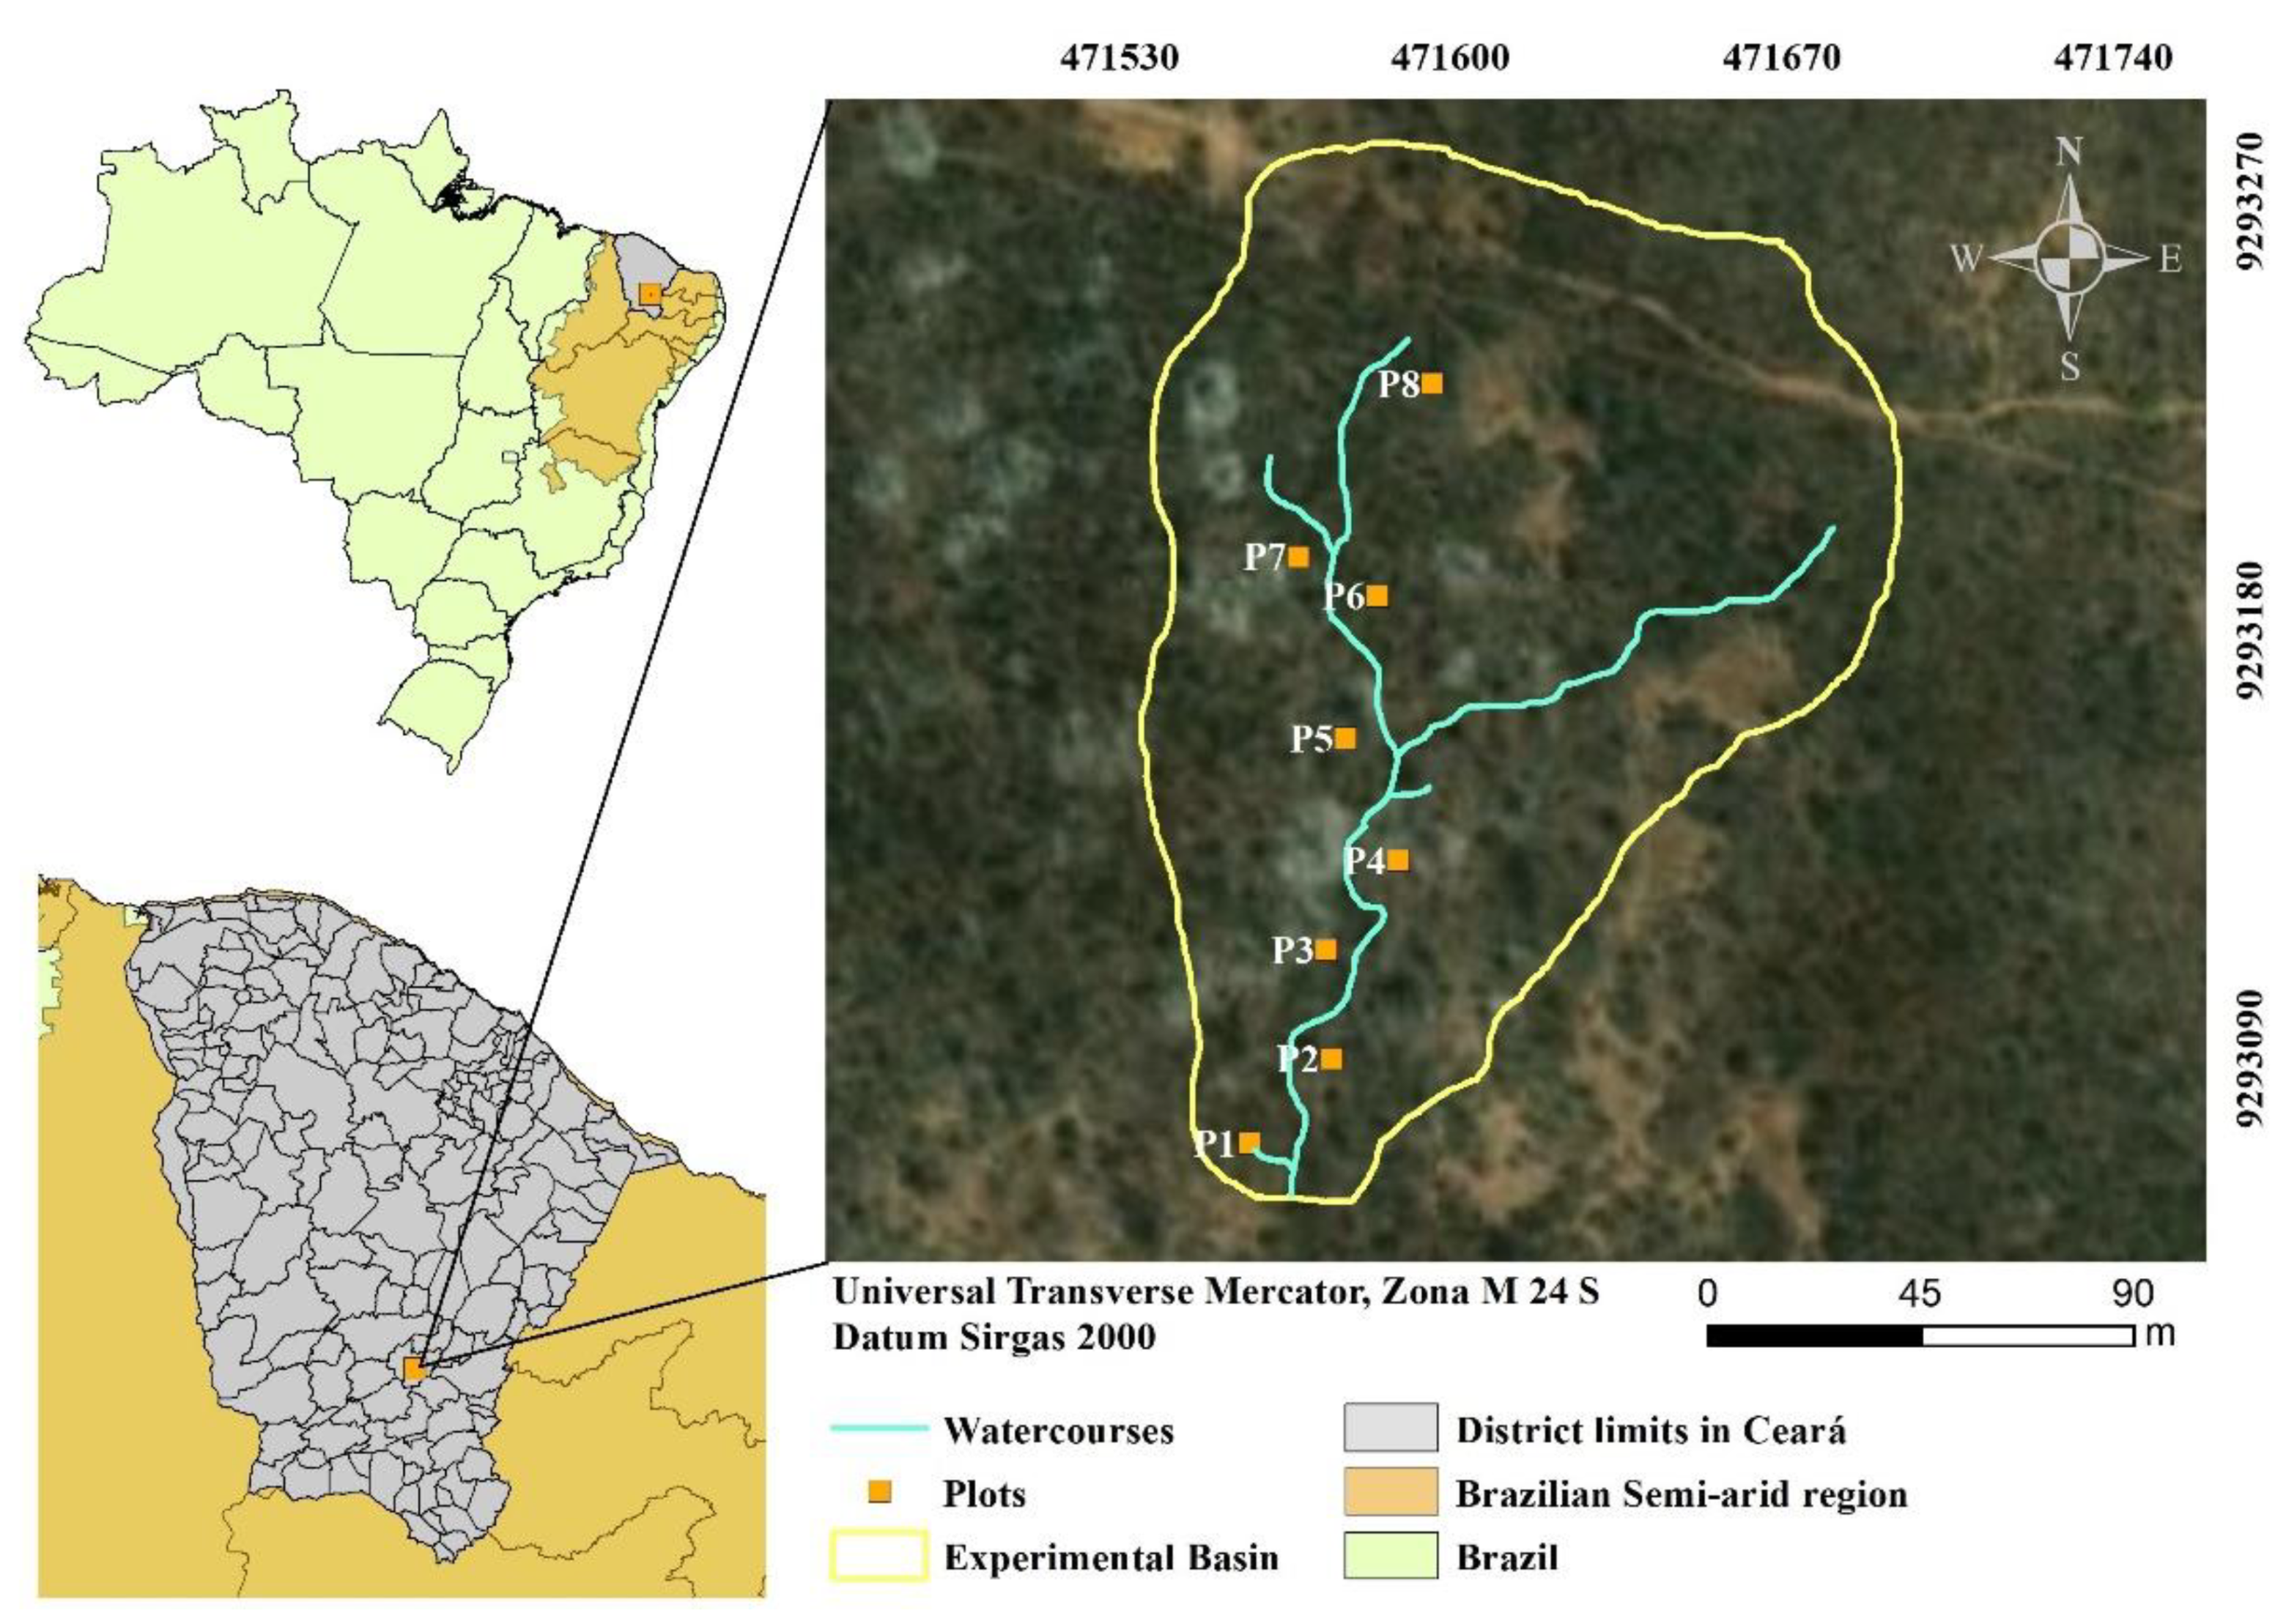
2.1. Study Area
2.2. Shrub Layer
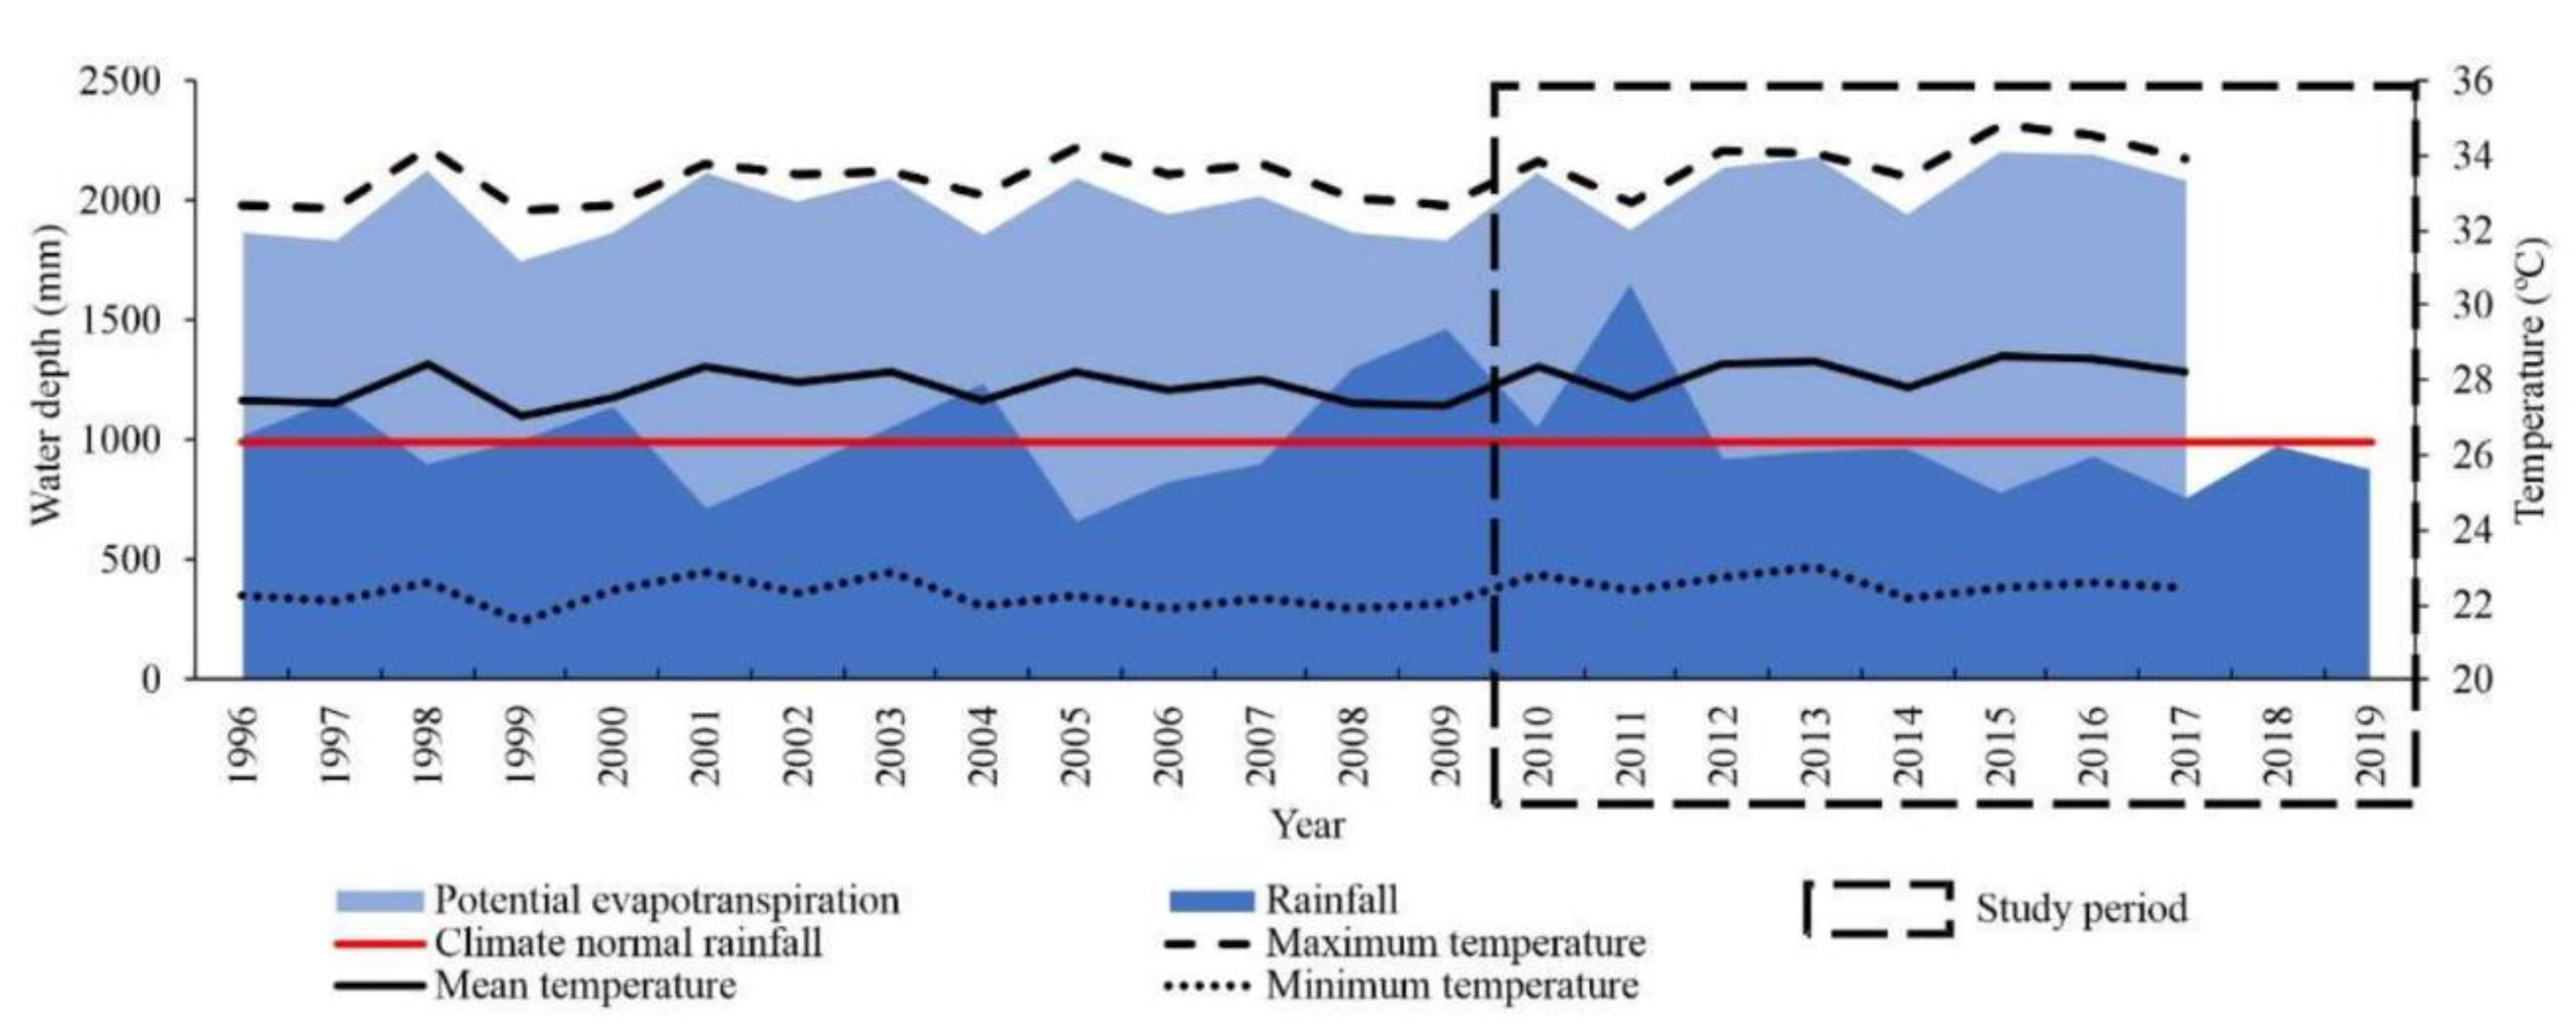
2.3. Climate Variables
2.4. Statistical Analysis
3. Results and Discussion
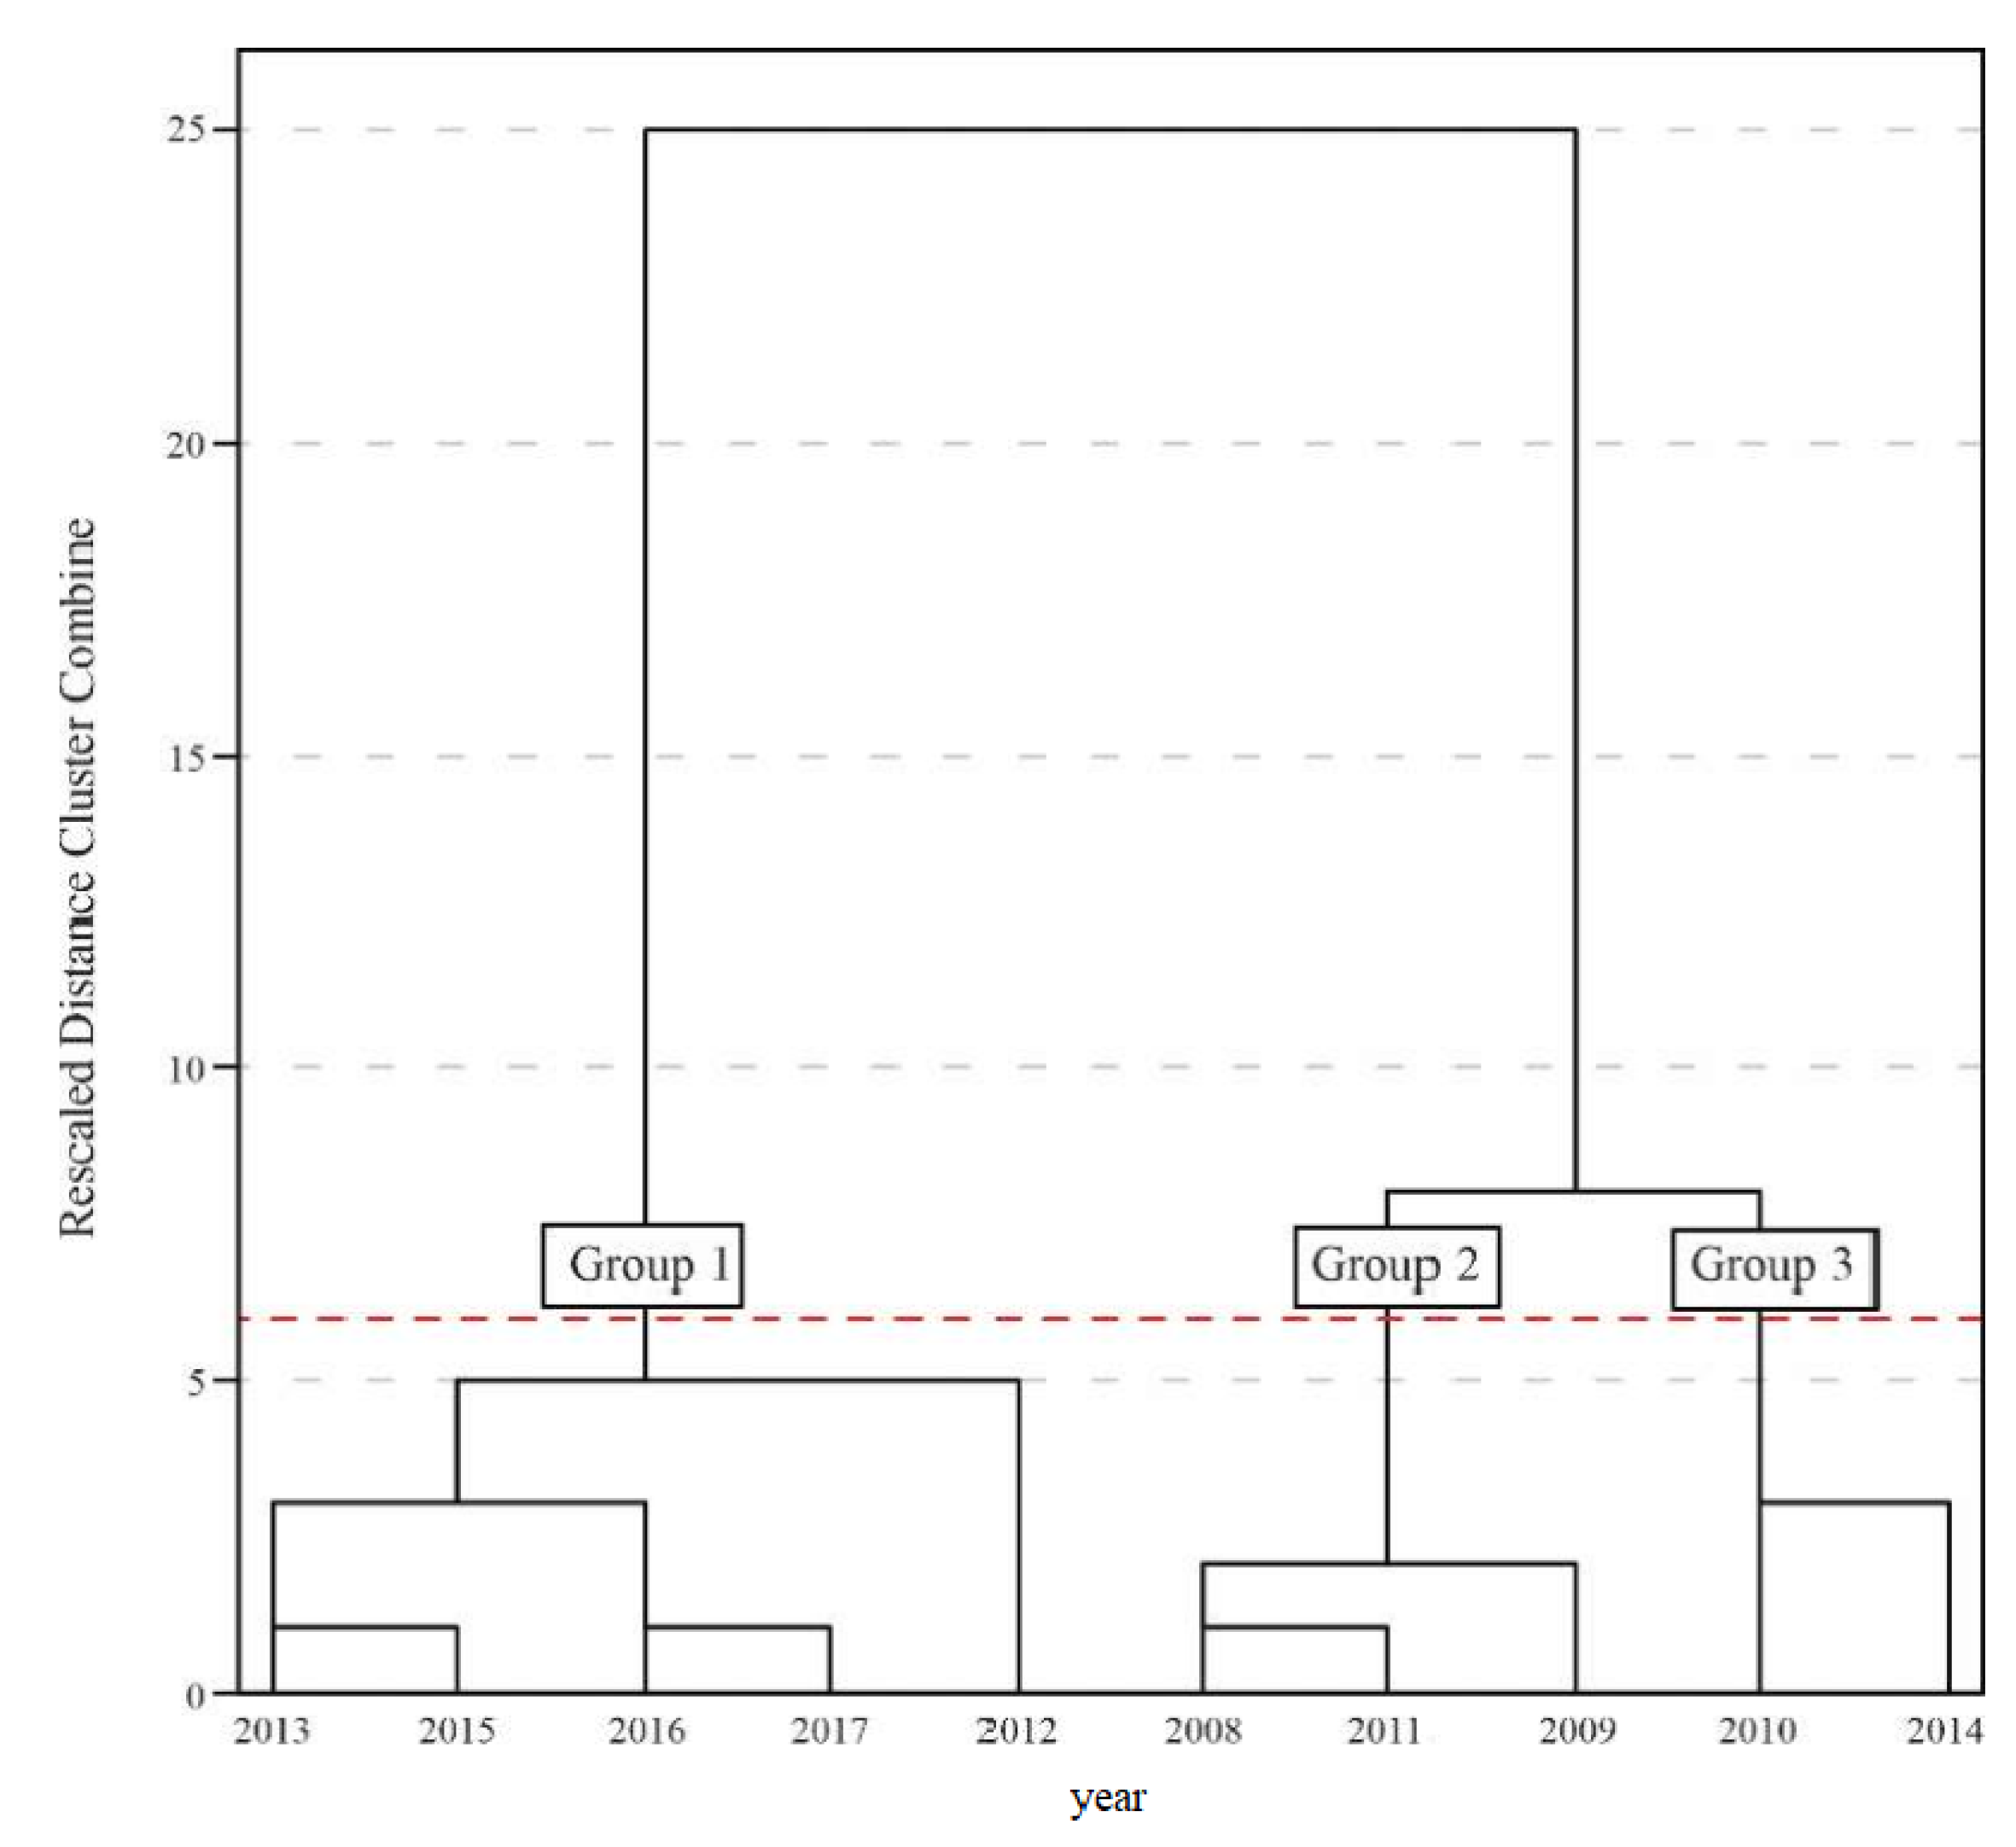
3.1. Similarity between the Years under Study
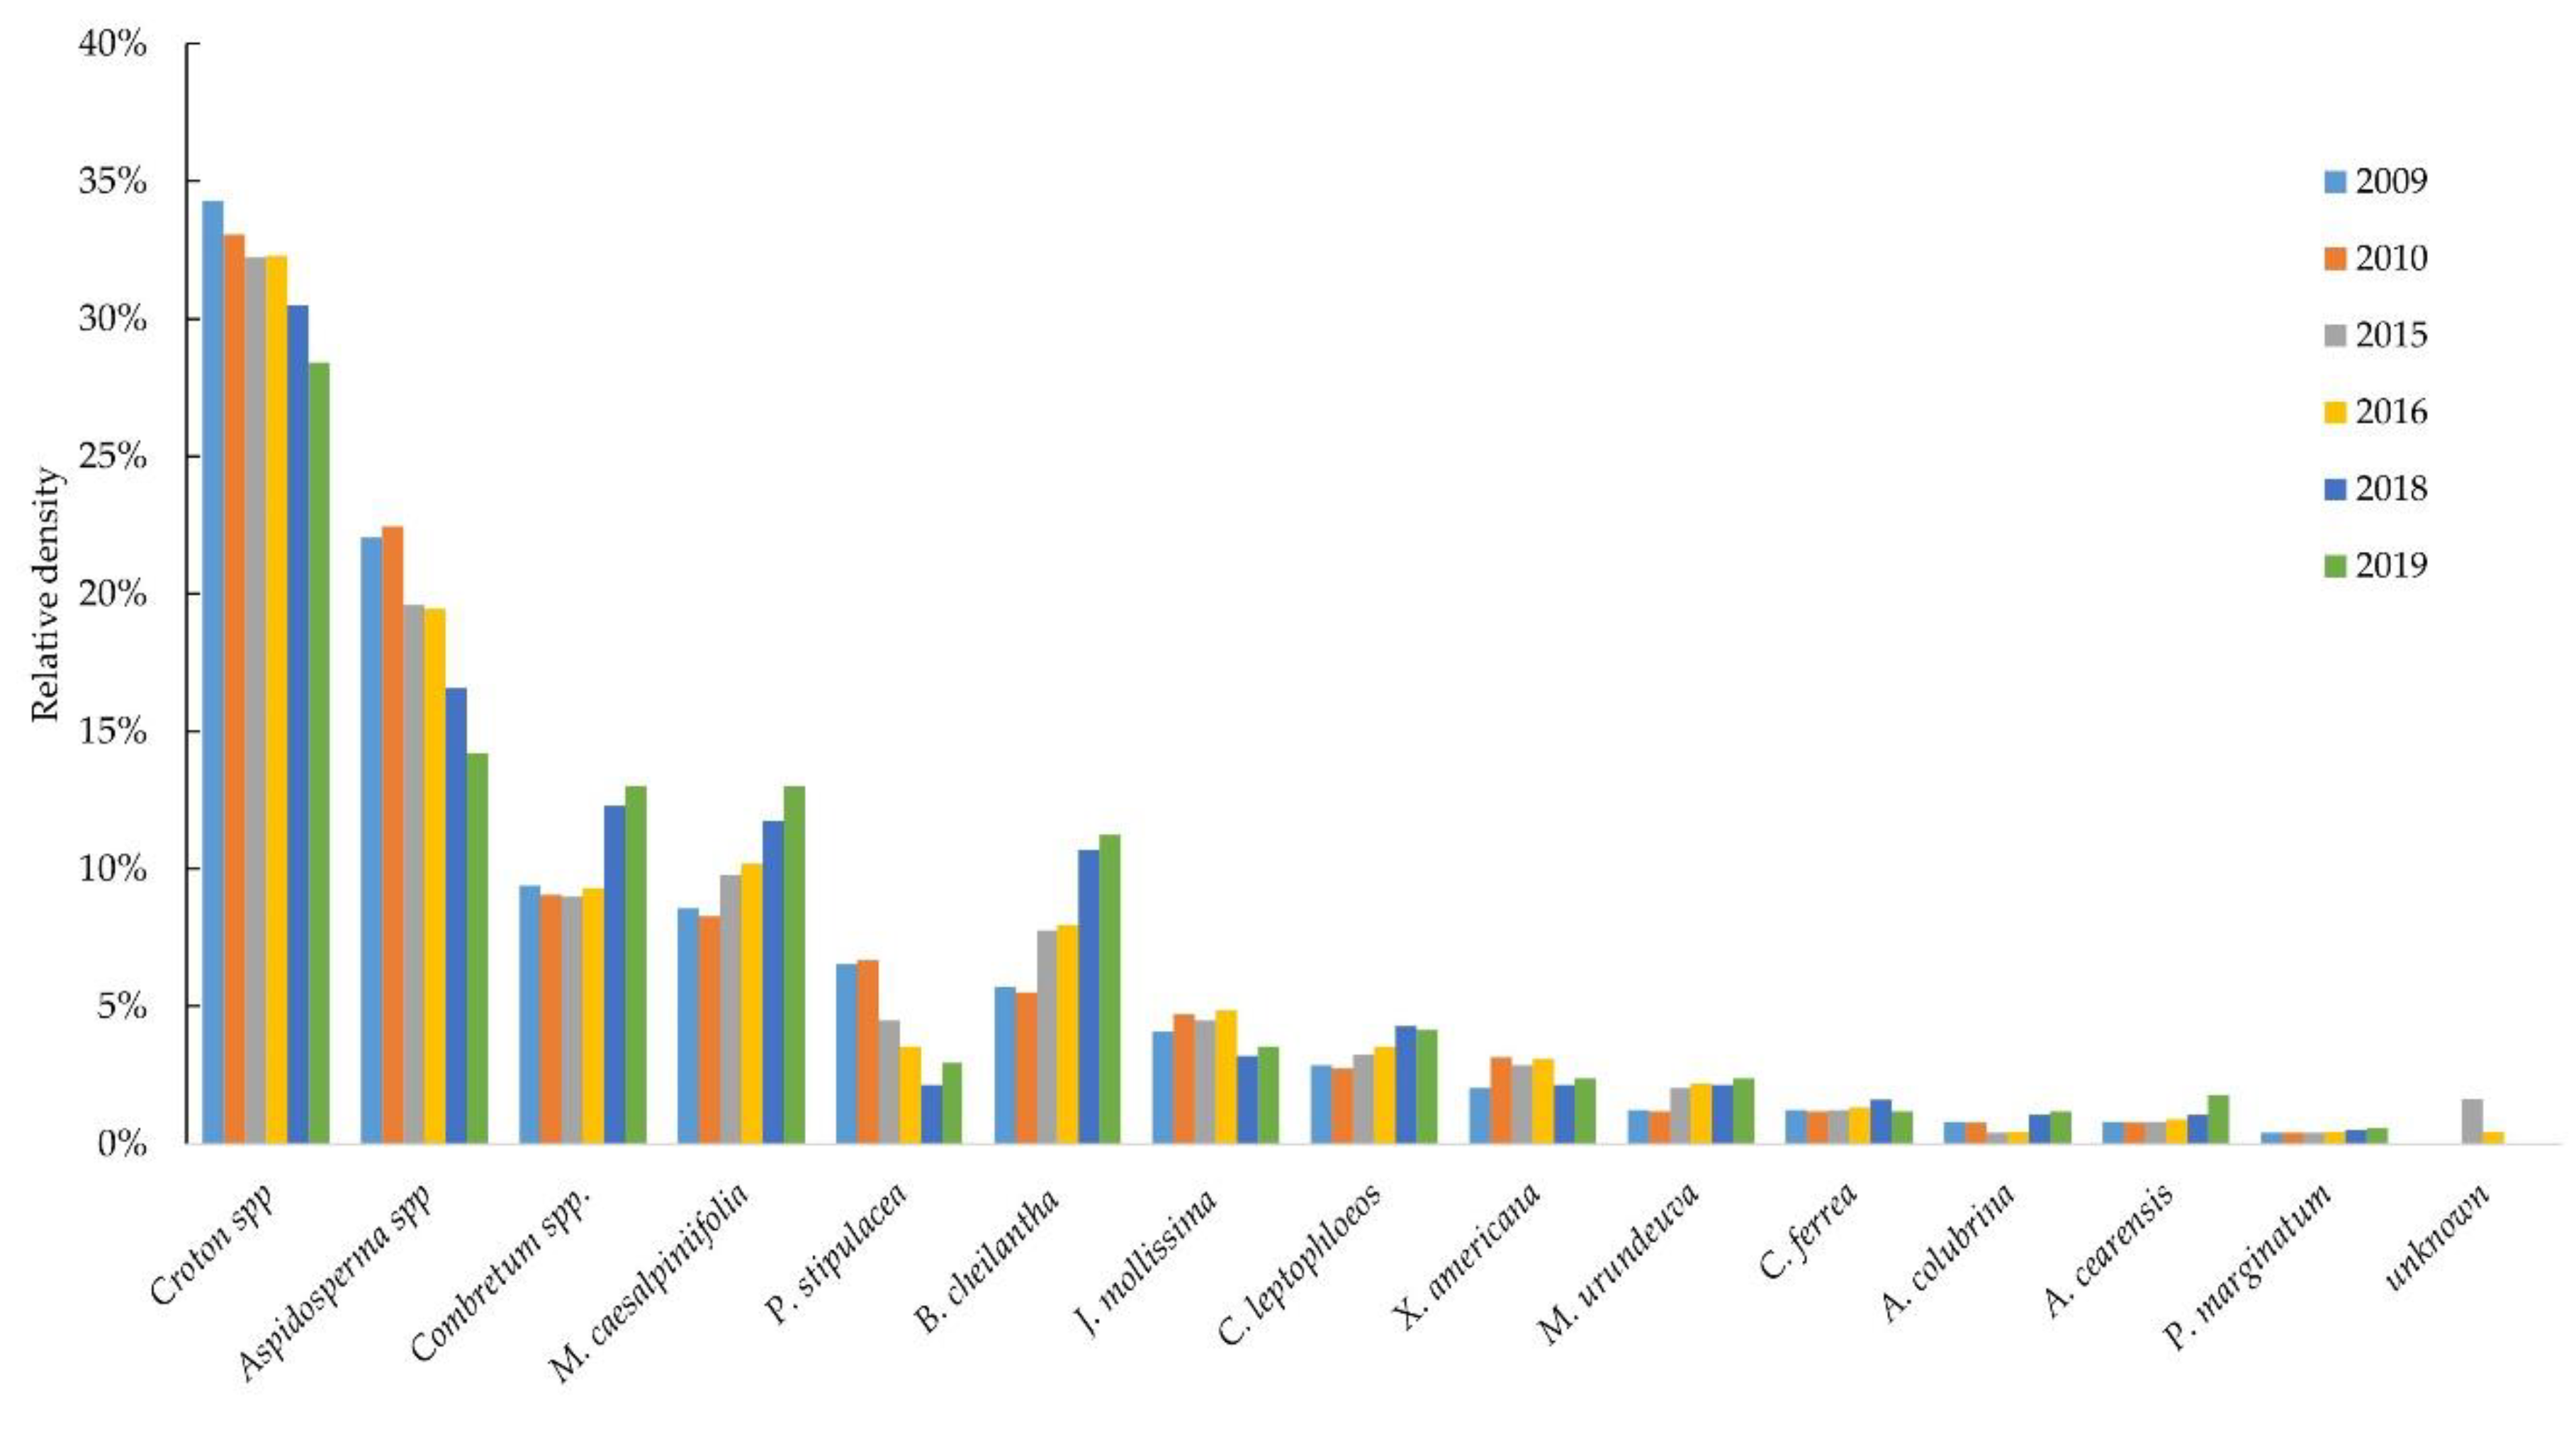
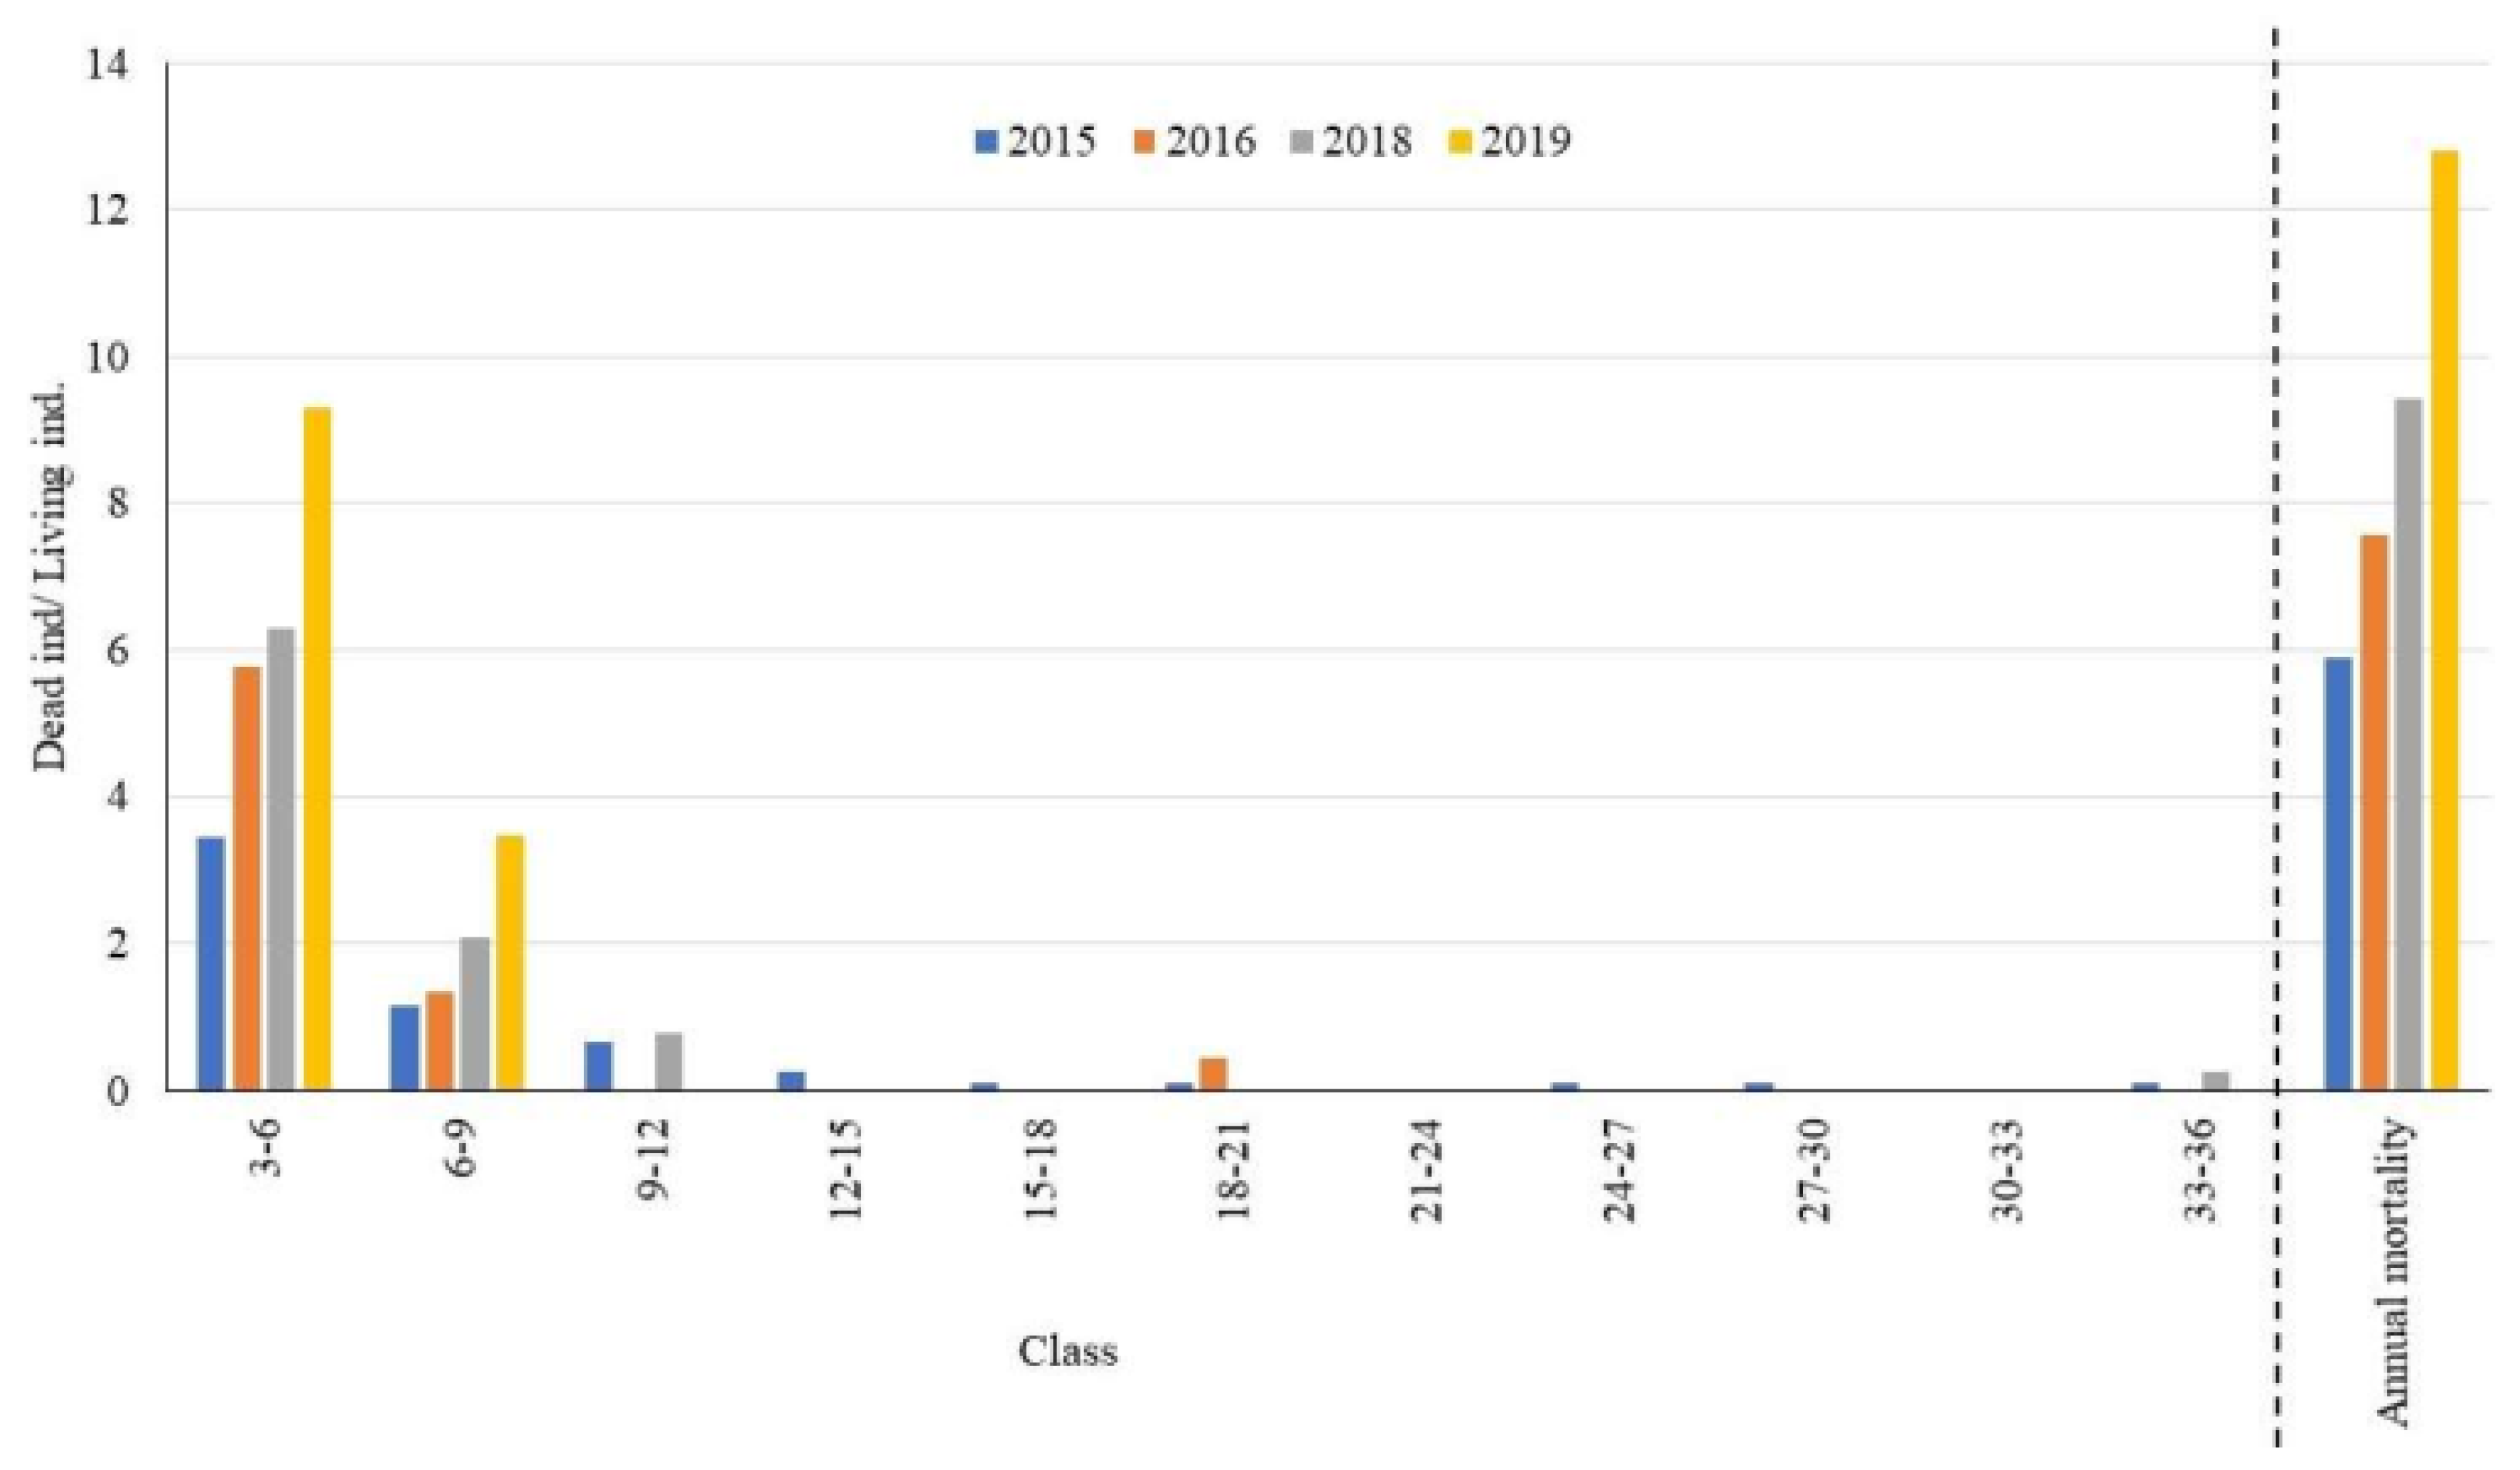
3.2. Shrub Layer
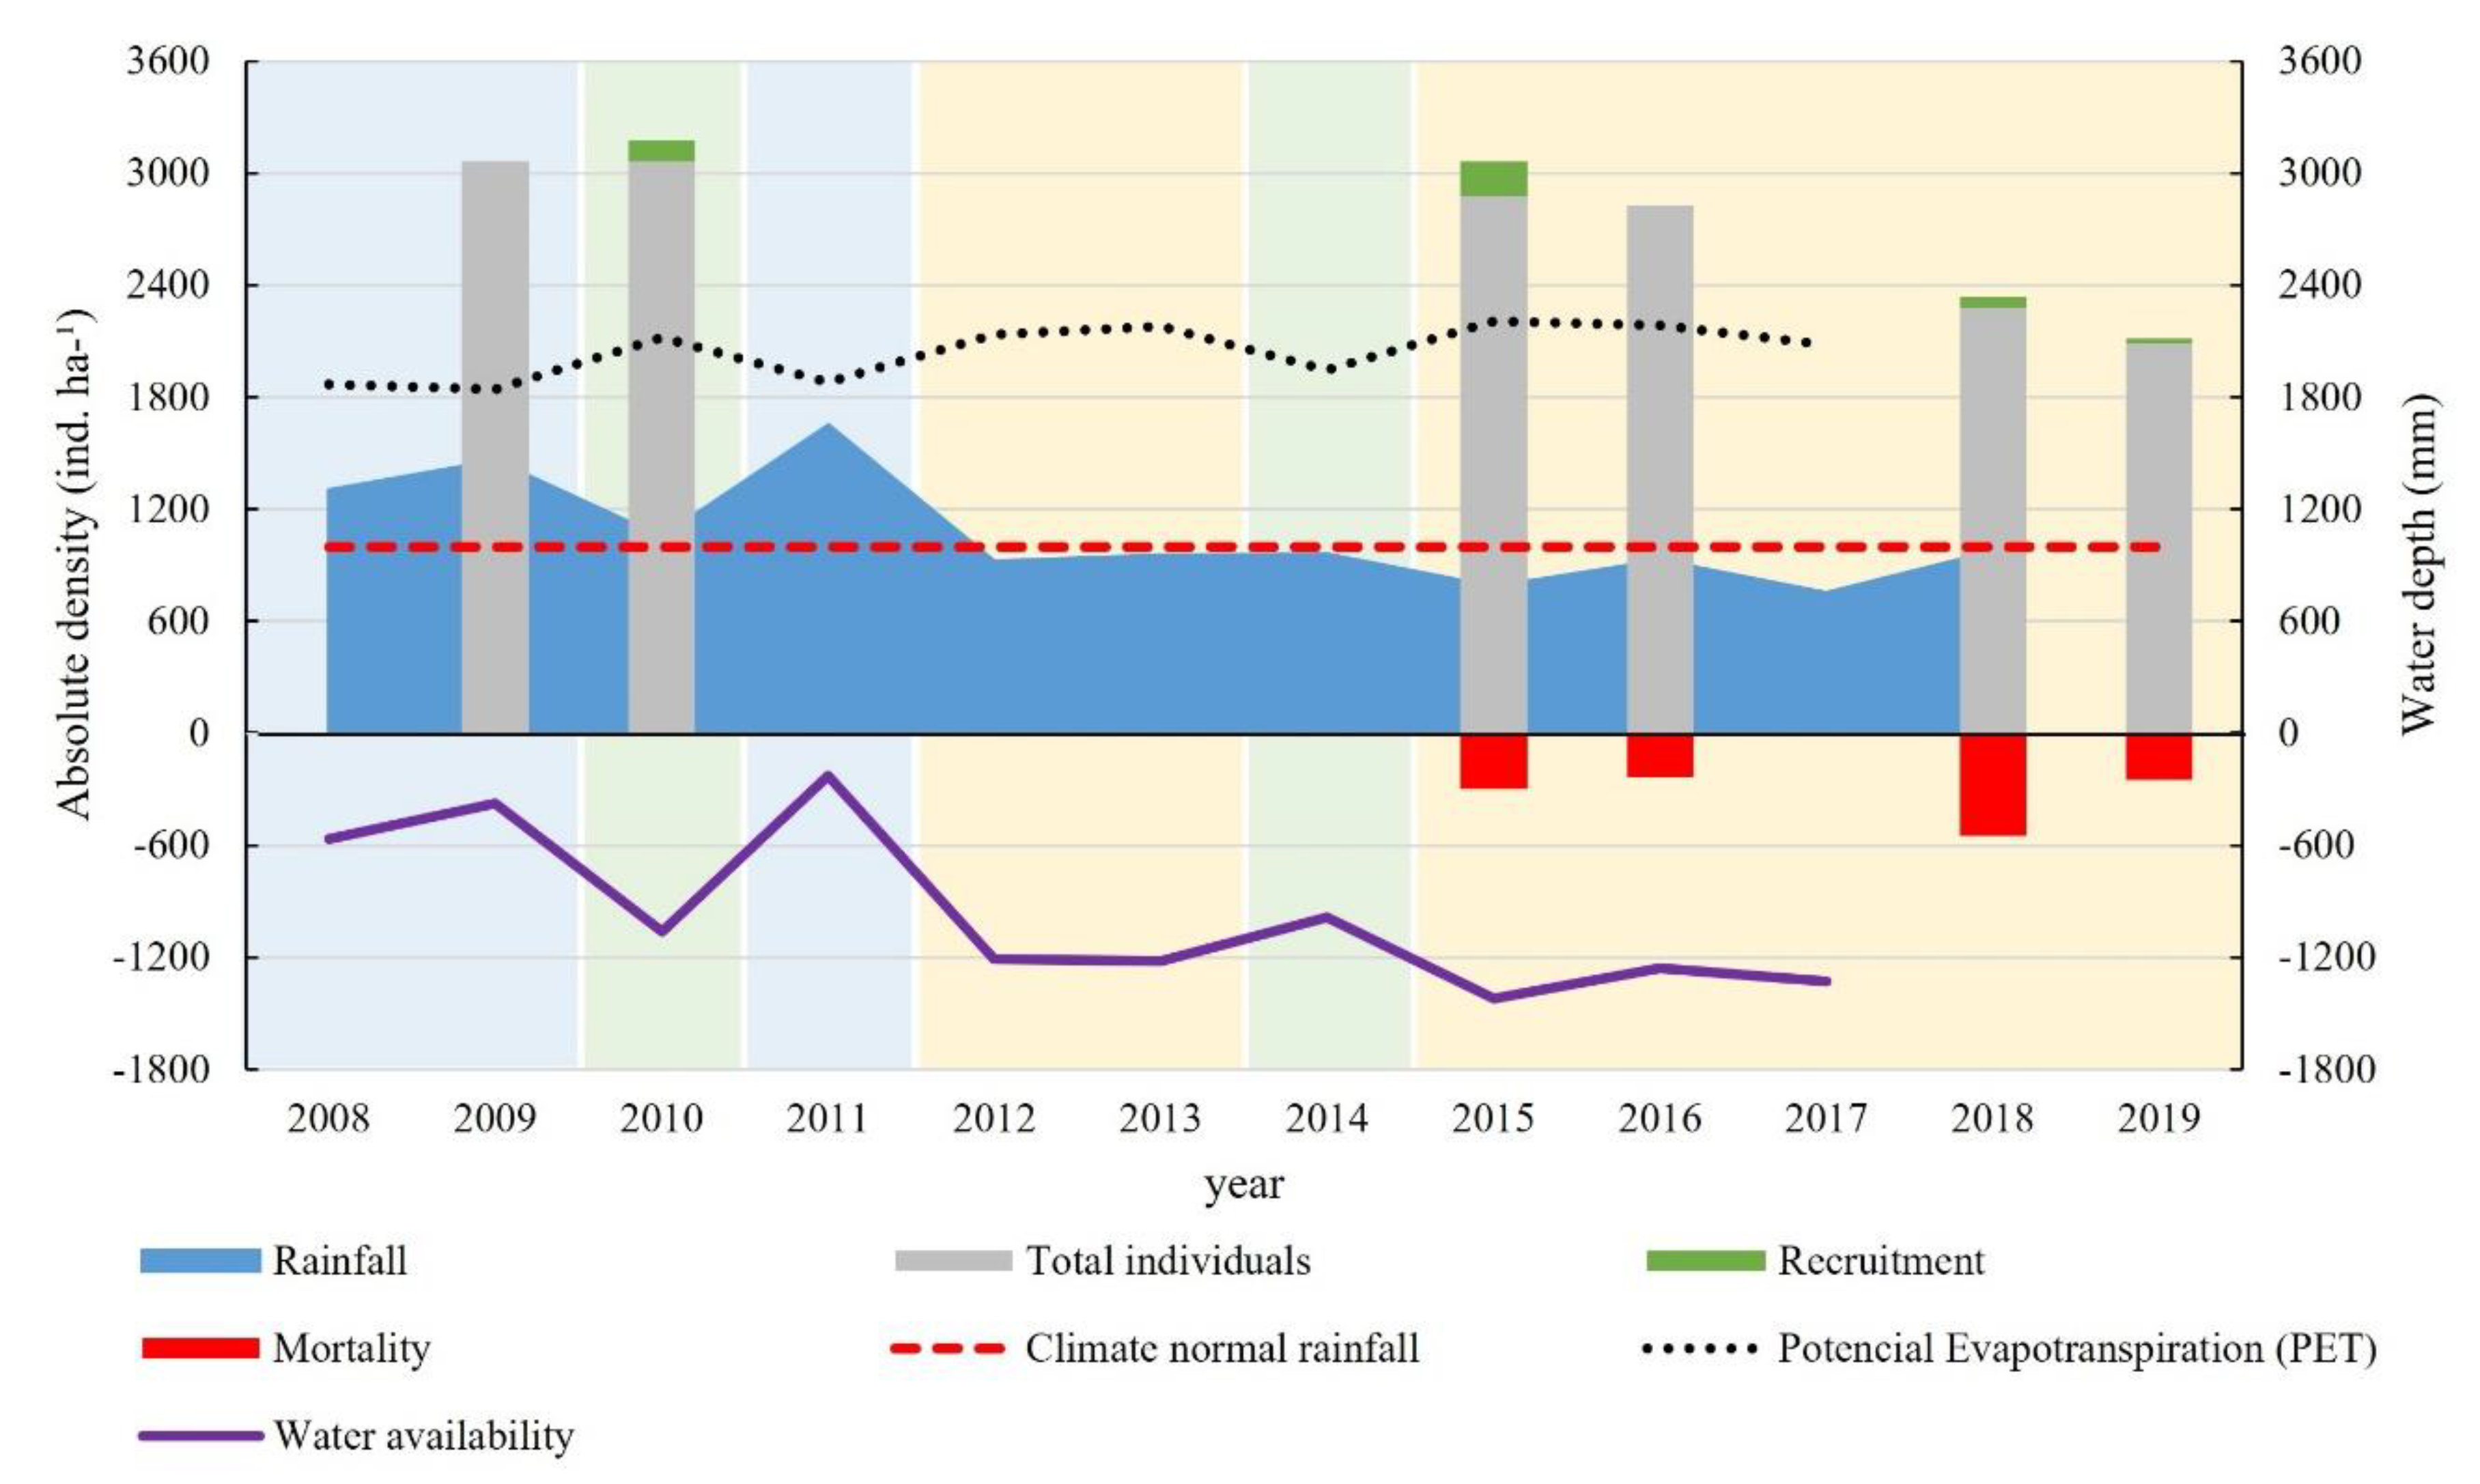
3.3. Biomass
4. Conclusions
Author Contributions
Funding
Conflicts of Interest
References
- Sorensen, L.A. A Spatial Analysis Approach to the Global Delineation of Dryland Areas of Relevance to the CBD Programme of Work on Dry and Subhumid Lands. Available online: https://www.unep-wcmc.org/system/dataset_file_fields/files/000/000/323/original/dryland_report_final_HR.pdf?1439378321 (accessed on 1 March 2019).
- Pennington, R.T.; Lavin, M.; Oliveira-Filho, A. Woody Plant Diversity, Evolution, and Ecology in the Tropics: Perspectives from Seasonally Dry Tropical Forests. Annu. Rev. Ecol. Evol. Syst. 2009, 40, 437–457. [Google Scholar] [CrossRef]
- Huang, J.; Yu, H.; Guan, X.; Wang, G.; Guo, R. Accelerated dryland expansion under climate change. Nat. Clim. Chang. 2015, 6, 166–171. [Google Scholar] [CrossRef]
- Bastin, J.F.; Berrahmouni, N.; Grainger, A.; Maniatis, D.; Mollicone, D.; Moore, R.; Patriarca, C.; Picard, N.; Sparrow, B.; Abraham, E.M.; et al. The extent of forest in dryland biomes. For. Ecol. Sci. 2017, 356, 635–638. [Google Scholar] [CrossRef] [PubMed]
- Guerreiro, M.J.S.; de Andrade, E.M.; Abreu, I.; Lajinha, T. Long-term variation of precipitation indices in Ceará State, Northeast Brazil. Int. J. Climatol. 2013, 33, 2929–2939. [Google Scholar] [CrossRef]
- Ministério do Meio Ambiente. Caatinga. Available online: http://www.mma.gov.br/biomas/caatinga (accessed on 1 March 2019).
- Araújo Filho, J. Manejo Pastoril Sustentável da Caatinga, 22nd ed.; Projeto Dom Helder Camara: Recife, Brazil, 2013; pp. 45–47. ISBN 978-85-64154-04-9. [Google Scholar]
- Aryal, D.R.; de Jong, B.H.J.; Ochoa-Gaona, S.; Esparza-Olguin, L.; Mendoza-Vega, J. Carbon stocks and changes in tropical secondary forests of southern Mexico. Agric. Ecosyst. Environ. 2014, 195, 220–230. [Google Scholar] [CrossRef]
- Cabral, G.A.L.; Sampaio, E.V.S.B.; Almeida-Cortez, J. Estrutura Espacial e Biomassa da Parte Aérea em Diferentes Estádios Sucessionais de Caatinga, em Santa Terezinha, Paraíba. Rev. Bras. Geogr. Física 2013, 6, 566–574. [Google Scholar] [CrossRef]
- Mcdowell, N.G.; Allen, C.D. Darcys law predicts widespread forest mortality under climate warming. Nat. Clim. Chang. 2015, 5, 669–672. [Google Scholar] [CrossRef]
- Silva, A.C.C.; Oliveira, D.G. Population Structure and Spatial Distribution of Bauhinia cheilantha (Bong.) Steud. in Two Fragments at Different Regeneration Stages in the Caatinga, in Sergipe, Brazil. Rev. Árvore 2015, 39, 431–437. [Google Scholar] [CrossRef]
- Pereira, L.R., Jr.; de Andrade, E.M.; Palácio, H.A.Q.; Raymer, P.C.L.; Ribeiro Filho, J.C.; Pereira, F.J.S. Carbon stocks in a tropical dry forest in Brazil. Rev. Ciência Agronômica 2016, 47, 32–40. [Google Scholar] [CrossRef]
- Feitosa, R.C. Estoque de Carbono em Floresta Tropical Sazonalmente Seca no Nordeste do Brasil: Uma Comparação Entre Dois usos do Solo. Ph.D. Thesis, Universidade Federal do Ceará, Fortaleza, Brazil, 2017. Available online: http://www.repositorio.ufc.br/handle/riufc/28686 (accessed on 21 May 2019).
- Greenwood, S.; Ruiz-Benito, P.; Martínez-Vilalta, J.; Lloret, F.; Kitzberger, T.; Allen, C.D.; Fensham, R.; Laughlin, D.C.; Kattge, J.; Bönisch, G.; et al. Tree mortality across biomes is promoted by drought intensity, lower wood density and higher specific leaf area. Ecol. Lett. 2017, 20, 539–553. [Google Scholar] [CrossRef]
- Moro, M.F.; Lughadha, E.N.; de Araújo, F.S.; Martins, F.R. A Phytogeographical Metaanalysis of the Semiarid Caatinga Domain in Brazil. Bot. Rev. 2016, 82, 91–148. [Google Scholar] [CrossRef]
- Spannl, S.; Volland, F.; Pucha, D.; Peters, T.; Cueva, E.; Bräuning, A. Climate variability, tree increment patterns and ENSO-related carbon sequestration reduction of the tropical dry forest species Loxopterygium huasango of Southern Ecuador. Trees 2016, 30, 1245–1258. [Google Scholar] [CrossRef]
- Anderegg, W.R.L.; Kane, J.M.; Anderegg, L.D.L. Consequences of widespread tree mortality triggered by drought and temperature stress. Nat. Clim. Chang. 2012, 3, 30–36. [Google Scholar] [CrossRef]
- Sperry, J.S.; Wang, Y.; Wolfe, B.T.; Mackay, D.S.; Anderegg, W.R.L.; McDowell, N.G.; Pockman, W.T. Pragmatic hydraulic theory predicts stomatal responses to climatic water deficits. New Phytol. 2016, 212, 577–589. [Google Scholar] [CrossRef]
- Brodribb, T.J.; Bienaimé, D.; Marmottant, P. Revealing catastrophic failure of leaf networks under stress. Proc. Natl. Acad. Sci. USA 2016, 113, 4865–4869. [Google Scholar] [CrossRef]
- Aquino, D.N.; de Andrade, E.M.; Castanho, A.D.A.; Pereira, L.R., Jr.; Palácio, H.A.Q. Belowground Carbon and Nitrogen on a Thinned and UnThinned Seasonally Dry Tropical Forest. Am. J. Plant Sci. 2017, 8, 2083–2100. [Google Scholar] [CrossRef][Green Version]
- Rodal, M.J.N.; Martins, F.R.; Sampaio, E.V.S.B. Levantamento quantitativo das plantas lenhosas em trechos de vegetação de Caatinga em Pernambuco. Rev. Caatinga 2008, 21, 192–205. [Google Scholar]
- Rodal, M.J.N.; Sampaio, E.V.S.B.; Figueiredo, M.A. Manual Sobre Métodos de Estudos Florístico e Fitossiciológico: Ecossistema Caatinga; SB: Brasília, Brazil, 2013; p. 24. ISBN 978-85-60428-03-8. [Google Scholar]
- Sampaio, E.V.; Silva, G.C. Biomass equations for Brazilian semiarid caatinga plants. Acta Bot. Bras. 2005, 19, 935–943. [Google Scholar] [CrossRef]
- Instituto Nacional de Meteorologia/Banco de Dados Meteorológicos para Ensino e Pesquisa (INMET/BDMEP). Available online: http://www.inmet.gov.br/portal/index.php?r=bdmep/bdmep (accessed on 1 March 2019).
- Fernandes, F.B.P. Disponibilidade Hídrica para a Cultura do Feijão-de-Corda em Função do Manejo de Solo no Semiárido Cearense. Ph.D. Thsis, Universidade Federal do Ceará, Fortaleza, Brazil, 2014. Available online: http://www.repositorio.ufc.br/handle/riufc/10570 (accessed on 21 April 2019).
- Aragão, L.E.O.C.; Malhi, Y.; Roman-Cuesta, R.M.; Saatchi, S.; Anderson, L.O.; Shimabukuro, Y.E. Spatial patterns and fire response of recent Amazonian droughts. Geophys. Res. Lett. 2007, 34, L070701:1–L070701:5. [Google Scholar] [CrossRef]
- Esquivel-Muelbert, A.; Baker, T.R.; Dexter, K.G.; Lewis, S.L.; Brienen, R.J.W.; Feldpausch, T.R.; Lloyd, J.; Monteagudo-Mendoza, A.; Arroyo, L.; Álvarez-Dávila, E. Compositional response of Amazon forests to climate change. Glob. Chang. Biol. 2018, 25, 39–56. [Google Scholar] [CrossRef]
- Corrar, L.J.; Paulo, E.; Dias Filho, J.M. Análise Multivariada para os Cursos de Administração, Ciências Contábeis e Economia, 1st ed.; Atlas: São Paulo, Brazil, 2007; p. 568. ISBN 978-8522447077. [Google Scholar]
- de Andrade, L.A.; Pereira, I.M.; Leite, U.T.; Barbosa, M.R.V. Análise da cobertura de duas fitofisionomias de caatinga, com diferentes históricos de uso, no município de São João do Cariri, Estado da Paraíba. Rev. Cerne 2005, 11, 253–262. [Google Scholar]
- Santos, M.G.; Oliveira, M.T.; Figueiredo, K.V.; Falcão, H.M.; Arruda, E.C.P.; Almeida-Cortez, J.; Sampaio, E.V.S.B.; Ometto, J.P.H.B.; Menezes, R.S.C.; Oliveira, A.F.M.; et al. Caatinga, the Brazilian dry tropical forest: Can it tolerate climate changes? Theor. Exp. Plant Physiol. 2014, 26, 83–99. [Google Scholar] [CrossRef]
- Adams, H.D.; Zeppel, M.J.B.; Anderegg, W.R.L.; Hartmann, H.; Landhäusser, S.M.; Tissue, D.T.; Huxman, T.E.; Hudson, P.J.; Franz, T.E.; Allen, C.D.; et al. A multi-species synthesis of physiological mechanisms in drought-induced tree mortality. Nat. Ecol. Evol. 2017, 1, 1285–1291. [Google Scholar] [CrossRef] [PubMed]
- Klein, C.; Klein, V.A. Estratégias para potencializar a retenção e disponibilidade de água no solo. Rev. Eletrônica Gestão Educ. Tecnol. Ambient. 2015, 19, 21–29. [Google Scholar] [CrossRef]
- Brito, S.S.B.; Cunha, A.P.M.A.; Cunningham, C.C.; Alvalá, R.C.; Marengo, J.A.; Carvalho, M.A. Frequency, duration and severity of drought in the Semiarid Northeast Brazil region. Int. J. Climatol. 2017, 38, 517–529. [Google Scholar] [CrossRef]
- Van der Sande, M.T.; Zuidema, P.A.; Sterck, F. Explaining biomass growth of tropical canopy trees: The importance of sapwood. Oecologia 2015, 117, 1145–1155. [Google Scholar] [CrossRef] [PubMed]
- Mitchard, E.T.A. The tropical forest carbon cycle and climate change. Nature 2018, 559, 527–534. [Google Scholar] [CrossRef] [PubMed]
- Marengo, J.A.; Torres, R.R.; Alves, L.M. Drought in Northeast Brazil—Past, present, and future. Theor. Appl. Climatol. 2017, 129, 1189–1200. [Google Scholar] [CrossRef]


| Group | Year | MCWD (mm yr−1) | T (°C) | R (mm yr−1) | C1 | C2 | C3 | |
|---|---|---|---|---|---|---|---|---|
| 1 | 2012 | −1478.8 | 28.4 | 925.0 | 2 | 0 | 1 | |
| 2013 | −1376.0 | 28.5 | 957.7 | 5 | 1 | 1 | ||
| 2015 | −1458.2 | 28.6 | 785.0 | 5 | 2 | 0 | ||
| 2016 | −1481.3 | 28.6 | 929.0 | 3 | 1 | 3 | ||
| 2017 | −1440.4 | 28.2 | 753.5 | 5 | 3 | 0 | ||
| −1446.9 | 28.5 | 870.0 | 4 | 1 | 1 | |||
| ±43.0 | ±0.2 | ±93.5 | ±1 | ±1 | ±1 | |||
| 2 | 2008 | −1239.1 | 27.4 | 1303.5 | 7 | 2 | 0 | |
| 2009 | −970.9 | 27.3 | 1462.0 | 4 | 1 | 0 | ||
| 2011 | −1018.1 | 27.6 | 1651.5 | 6 | 2 | 0 | ||
| −1076.1 | 27.4 | 1472.3 | 6 | 2 | 0 | |||
| ±143.2 | ±0.2 | ±174.2 | ±2 | ±1 | ±0 | |||
| 3 | 2010 | −1179.5 | 28.4 | 1054.0 | 9 | 1 | 1 | |
| 2014 | −1203.3 | 27.8 | 960.0 | 7 | 2 | 2 | ||
| −1191.4 | 28.1 | 1007.0 | 8 | 2 | 2 | |||
| ±16.9 | ±0.4 | ±66.5 | ±1 | ±1 | ±1 |
| Family | Species | Wood Density (g cm−3) | Habit | Density | |
|---|---|---|---|---|---|
| Absolute (ind. ha−1) | Relative (%) | ||||
| Euphorbiaceae | Croton spp. | 0.760 | Shrub | 885 | 32.1 |
| Apocynaceae | Aspidosperma spp. | 0.710 | Tree | 538 | 19.5 |
| Combretaceae | Combretum spp. | 0.696 | Shrub | 279 | 10.1 |
| Fabaceae | Mimosa caesalpiniifolia Benth. | 0.839 | Tree | 277 | 10.0 |
| Fabaceae | Bauhinia cheilantha (Bong.) Steud. | 0.865 | Shrub | 217 | 7.8 |
| Mimosaceae | Piptadenia stipulacea (Benth.) Ducke | 0.653 | Shrub | 127 | 4.6 |
| Euphorbiaceae | Jatropha mollissima (Pohl) Baill. | 0.270 | Shrub | 117 | 4.2 |
| Burseraceae | Commiphora leptophloeos (Mart.) J.B.Gillett | 0.309 | Shrub/Tree | 94 | 3.4 |
| Olacaceae | Ximenia americana L. | 0.700 | Shrub | 73 | 2.6 |
| Anacardiaceae | Myracrodruon urundeuva Allemao | 0.845 | Tree | 50 | 1.8 |
| Fabaceae | Caesalpinia ferrea Mart. ex Tul. | 0.820 | Tree | 35 | 1.3 |
| Fabaceae | Anadenanthera colubrina (Vell.) Brenan | 0.811 | Tree | 21 | 0.8 |
| Fabaceae | Amburana cearensis (Allemão) A.C.Sm. | 0.449 | Tree | 27 | 1.0 |
| Malvaceae | Pseudobombax marginatum (A.St.Hil.) A. Robyns | - | Tree | 13 | 0.5 |
| Unknown | Unknown | - | - | 10 | 0.4 |
| Total | 2.763 | 100 | |||
Publisher’s Note: MDPI stays neutral with regard to jurisdictional claims in published maps and institutional affiliations. |
© 2020 by the authors. Licensee MDPI, Basel, Switzerland. This article is an open access article distributed under the terms and conditions of the Creative Commons Attribution (CC BY) license (http://creativecommons.org/licenses/by/4.0/).
Share and Cite
Campos, D.A.; Andrade, E.M.; Castanho, A.D.A.; Feitosa, R.C.; Palácio, H.Q.A. Biomass Dynamics in a Fragment of Brazilian Tropical Forest (Caatinga) over Consecutive Dry Years. Appl. Sci. 2020, 10, 7813. https://doi.org/10.3390/app10217813
Campos DA, Andrade EM, Castanho ADA, Feitosa RC, Palácio HQA. Biomass Dynamics in a Fragment of Brazilian Tropical Forest (Caatinga) over Consecutive Dry Years. Applied Sciences. 2020; 10(21):7813. https://doi.org/10.3390/app10217813
Chicago/Turabian StyleCampos, Diego A., Eunice M. Andrade, Andréa D. A. Castanho, Ramon C. Feitosa, and Helba Q. A. Palácio. 2020. "Biomass Dynamics in a Fragment of Brazilian Tropical Forest (Caatinga) over Consecutive Dry Years" Applied Sciences 10, no. 21: 7813. https://doi.org/10.3390/app10217813
APA StyleCampos, D. A., Andrade, E. M., Castanho, A. D. A., Feitosa, R. C., & Palácio, H. Q. A. (2020). Biomass Dynamics in a Fragment of Brazilian Tropical Forest (Caatinga) over Consecutive Dry Years. Applied Sciences, 10(21), 7813. https://doi.org/10.3390/app10217813