Article

A Deep Learning Based Dislocation Detection Method for Cylindrical Crystal Growth Process

1
School of Mechanical Engineering, Zhejiang University, Hangzhou 310027, China
2
Zhejiang Jingsheng Mechanical & Electrical Engineer Co., Ltd., Shaoxing 312300, China
*
Author to whom correspondence should be addressed.
Appl. Sci. 2020, 10(21), 7799; https://doi.org/10.3390/app10217799
Submission received: 6 August 2020 / Revised: 20 October 2020 / Accepted: 31 October 2020 / Published: 3 November 2020
(This article belongs to the Section Mechanical Engineering)

Abstract

:
For the single crystal furnace used in the photovoltaic industry, growth problems occur frequently due to dislocations during the shouldering and cylindrical growth steps of the Czochralski (CZ) crystal growth. Detecting the dislocation phenomenon in the cylindrical growth step is very important for entire automation of the CZ crystal furnace, since this process usually lasts for more than 48h. The irregular nature of different patterns of dislocation would impose a big challenge for a traditional machine vision-based detection method. As almost no publications have been dedicated to detecting this phenomenon, to address this issue, after analyzing the characteristics of the silicon ingot image of this process, this paper proposes a kind of deep learning-based dislocation detection method along with tracking strategy to simulate manual inspection. The model has a good detection effect whether there is occlusion or not, the experimental results show that the detection accuracy is 97.33%, and the inference speed is about 14.7 frames per second (FPS). It can achieve the purpose of reducing energy consumption and improving process automation by monitoring this process.

1. Introduction

CZ crystal growth is one of the most important techniques for manufacturing single crystalline silicon, which is the mainstay of the microelectronic and photovoltaic industries [1]. The schematic illustration of the single crystal furnace structure is shown in Figure 1, which mainly consists of five parts: furnace, crystal and crucible pulling and rotating mechanism, atmosphere and pressure control system, electrical system, and thermal field. The quartz crucible is used to store a polycrystalline silicon ingot and is heated by the surrounding high-purity graphite heater. The crucible can be regulated precisely in the vertical direction by the crucible shaft mechanism beneath it. By heating the crucible to a prescribed temperature, the raw material is melted and forms a pool of silicon melt in the crucible. Then a monocrystalline seed is dipped into the silicon melt [2]. As the seed is slowly pulled upwards while being rotated at a prescribed pulling and rotation speed, a cylindrical crystal ingot is grown. A conical heat shield with a circular opening at its bottom is fixed inside the furnace. The gap distance between the melt surface and the bottom of the heat shield is referred to as the melt level. The cylindrical growth step is trying to maintain the diameter of the silicon ingot at a prescribed value during crystal growth.
The cylindrical growth step is the most important step in the CZ crystal growth process, since usually it will last for more than 48h. Under normal growth conditions of single crystal silicon, the crystal ingot has a certain regularity. In the <100> crystallographic orientation growth process, there will be four habit lines on the surface of the ingot distributed at an angle of 90 degrees to each other, each one is continuous as shown in Figure 2, there will also be four corresponding nodes at the solid−liquid interface. These habit lines are grown in dislocation-free mono-Si due to undercooling in the <111> planes [3]. For the single crystal furnace used in the photovoltaic industry, growth problems occur frequently due to dislocations during the shouldering and cylindrical growth steps, which will seriously affect the quality of crystal silicon and the performance of the furnace and reduce the photoelectric conversion efficiency of solar cells. For example, when the thermal stress in the crystal exceeds the critical stress of silicon, dislocation of the crystal occurs. Besides, impure silicon material will also affect the dislocation-free growth of the crystal. Once the dislocations are generated in the <111> planes, it is easily noticed during the ingot pulling as it corresponds with the disappearance of the habit lines (DHL) on the edge of the ingot [3] as shown in Figure 2, then the normal crystal order can no longer be restored. This phenomenon can be used to determine whether crystalline silicon is growing without dislocation, that is, whether the growth state of the ingot changes from monocrystalline to polycrystalline.
When the DHL phenomenon occurs without human intervention, it will cause the liquid surface to be pulled off, causing a large amount of dislocation to occur at the interface. Meanwhile, the dislocations will propagate to the above, already-grown silicon ingot, which will affect crystal quality and significantly reduce the production yield of the CZ pulling [4,5]. At present, there is no technology for online prejudgment of the DHL phenomenon in the cylindrical growth step in production, it is manually inspected through the remote centralized control system by watching the growth process of all the furnaces, which is labor-intensive and time-consuming. Therefore, besides diameter measurement in the cylindrical growth process, it is necessary to introduce a vision system to detect DHL in time, and alert the operator to promptly complete the following process operations such as remelting, fetching, and growth of end cone, to prevent waste of energy and reduce the cost of equipment operation.
Due to high temperature and the closed environment in the CZ furnace, a vision system is installed at the observation window with a tilted angle and consists of two cameras and a set of optical filters to capture the image of the silicon crystal ingot. The filters are located under the camera due to high reflection in the furnace. In our system, monochrome industrial cameras of resolution 2592 × 1944 pixels and a camera lens of focal length 50 mm are used. A sample of images captured by phone and the imaging system are shown in Figure 3. Since the temperature of melt reaches about 1450 °C, it can be seen that the furnace is filled with orange and bright white lights. The crescent part on the melt surface is the reflected image of the bottom rim of the heat shield, which is projected as an incomplete ellipse. The habit line is the target that needs to be detected. Due to the limited small observation window and the heat shield, there exists occlusion in the scene as can be seen in Figure 3c,d. The ingot is rotating along its axis at a prescribed speed, when the habit line is in the occlusion area, it is hard to tell whether it is normal or disappears. Due to occlusion and to be compatible with furnaces without occlusion, the detection area as shown in Figure 3d is quite limited. A deep learning model avoids the cumbersome image processing steps of the traditional method by autonomously extracting high-dimensional information in the image. In recent years, target detection algorithms based on convolutional neural networks (CNNs) have achieved great success in many fields [6]. One of the application scenarios is defect detection in industrial environments, and it has advanced recognition performance. Thus, in this paper, a deep learning-based method is proposed to detect dislocation in the cylindrical step of the CZ crystal growth process.
The remainder of this paper is organized as follows. In Section 2, firstly, the patterns of habit lines are discussed in detail, then, a detection model is designed based on the different patterns between normal and disappeared habit lines, and a tracking strategy is proposed to gain more comprehensive results. In Section 3, experimental results are shown to demonstrate the effectiveness and superiority of our approach. The main reasons for misdetection are discussed in Section 4. Finally, Section 5 concludes our paper.

2. Proposed Method

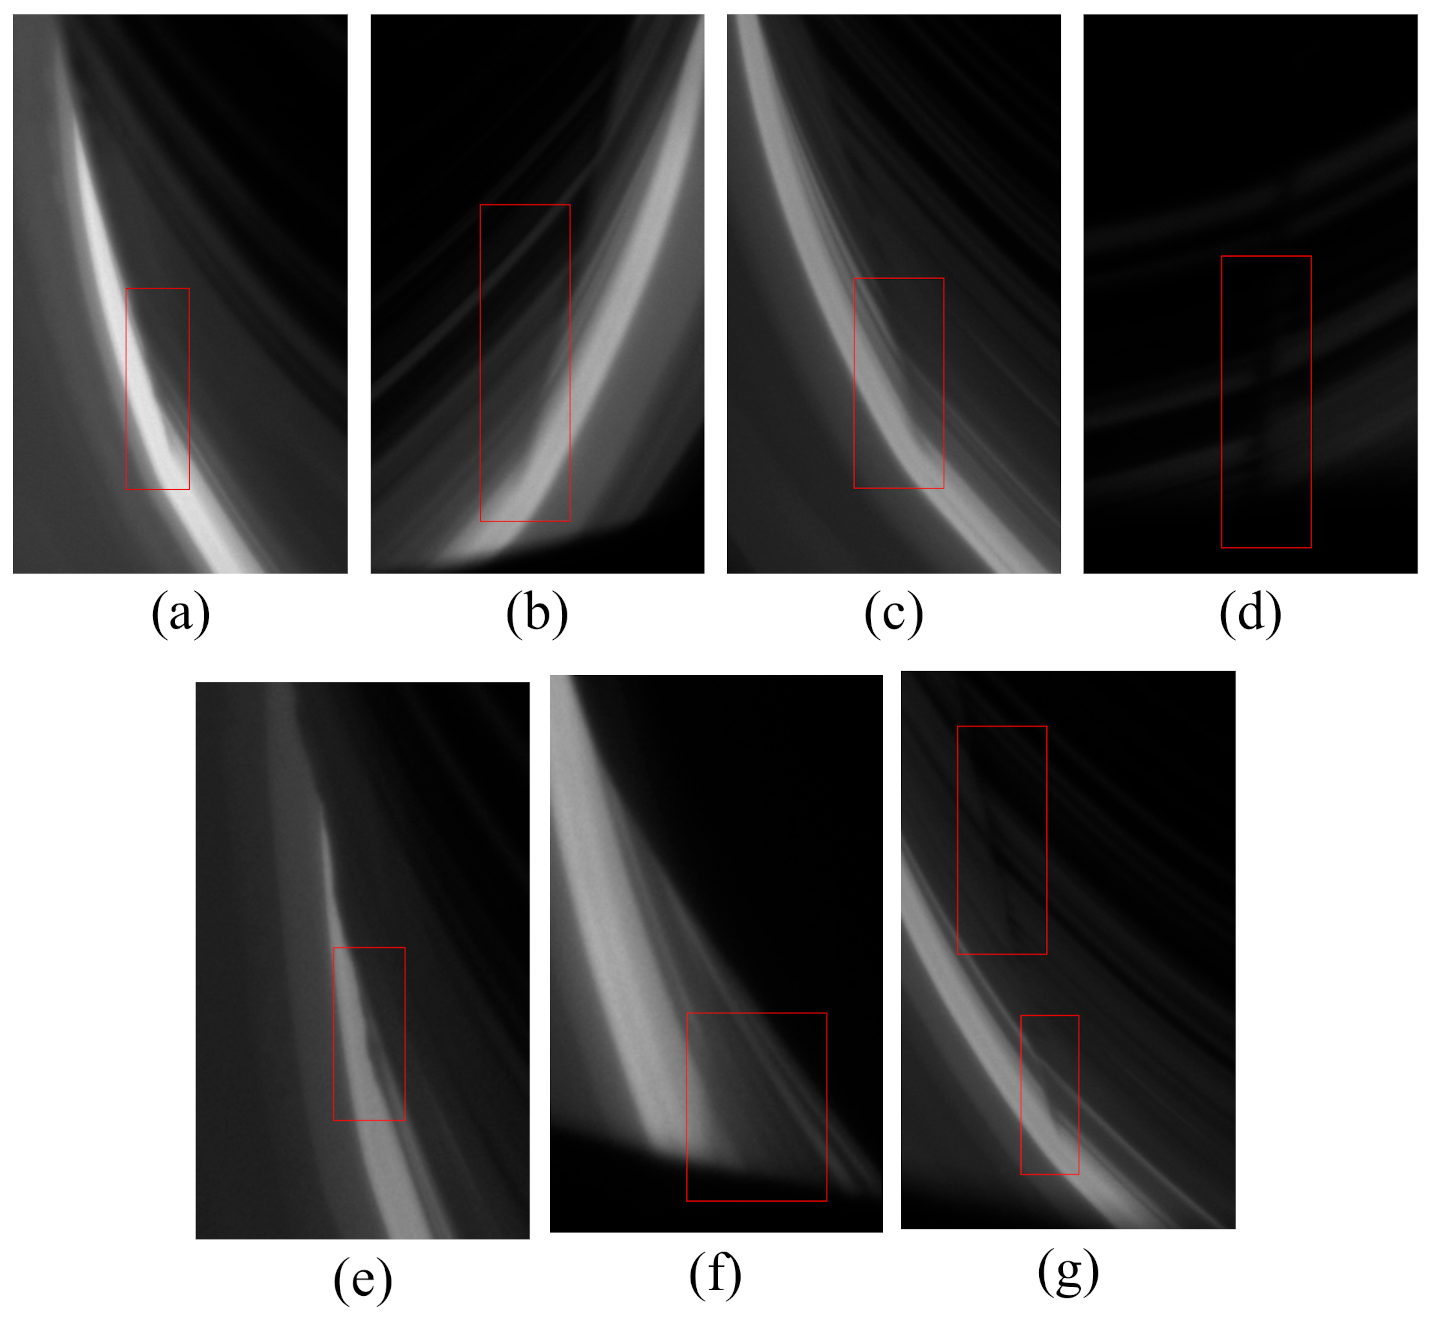
2.1. Patterns of Habit Lines

Due to occlusion, exposure, etc., the patterns of habit lines in different furnaces will be different. To achieve detection purpose, the image features of both normal habit lines and disappeared ones need to be analyzed firstly. By analyzing a large amount of images, the image characteristics of habit lines in the cylindrical growth process can be summarized as follows:
For normal habit lines, there are seven different patterns in total as shown in Figure 4:
  • The habit line has an obvious ray extending beyond the arc at the solid−liquid surface;
  • The habit line has a clear polyline pattern at the solid−liquid surface;
  • The habit line does not have a clear polyline pattern, it has shadow on both sides instead;
  • The end of the habit line is blocked, and there is no DHL phenomenon;
  • The habit line shows a polyline pattern or shadow effect on the edge of the silicon ingot;
  • There is shadow effect at the intersection of the habit line, the solid−liquid surface and the obstacle;
  • Due to exposure and other effects, the habit line seems to disappear at first in the image, then shows a normal pattern.
For disappeared habit lines, there are two patterns as shown in Figure 5:
  • The habit line disappears before growing to the arc at the solid−liquid surface which presents normal arc style;
  • The habit line disappears before growing to the occlusion area.

2.2. Detection Method

The aim of this research is to develop a model that can distinguish whether the habit line is normal or disappears. The irregular nature of these patterns would impose a big challenge for a traditional machine vision-based detection method. The task for target detection can be roughly divided into three phases: candidate region generation, feature extraction, and target classification [7]. In the past, most detection models use the sliding window technique to generate candidate frames. R-CNN [8] firstly uses a selective search algorithm [9] to generate candidate regions and then extracts features of each region, which are classified by SVM. Fast R-CNN [10] proposes a multitarget network that combines target classification and position regression into one network, but the initial frame creation is time-consuming. Faster R-CNN [11] uses a region proposal network (RPN) to generate candidate boxes and then extracts the feature matrix for target classification and bounding box regression. The feature extraction network of the RPN has two types: the Zeiler and Fergus (ZF) [12] network and the VGG [13] network. Compared with a detection model based on sliding window technology, Faster R-CNN has a more expressive feature map and faster detection speed. Therefore, Faster R-CNN was chosen as our model, which is a classic two-stage object detection model. Instead of training a model from scratch, we applied a fine-tuning transfer learning to a Faster R-CNN network pretrained on ImageNet. The model trained feature extraction, candidate region generation, classification and bounding box regression together, and it could achieve end-to-end detection and real-time performance.
Compared with general target detection tasks, the DHL detection task has two unique characteristics: (1) the aspect ratio of disappeared habit line is less than 1:2; (2) due to high temperature and strong radiation in the furnace, there exists phenomenon such as the habit line is actually normal but it seems to disappear in the middle part (special case) as shown in Figure 4g. In other words, for the same habit line, there exists disappeared and normal effect in the same image, which will cause misdetection.
In order to solve these two problems, on the basis of conventional Faster R-CNN, this paper uses ResNet-50 residual neural network [14] as the backbone to extract image features, the architecture is shown in Figure 6. The idea of residual learning is added to the traditional convolutional neural network, which effectively solves the problems of gradient disappearance and gradient explosion, so that the network can better adapt to a larger depth. Taking an image of 600 × 800 resolution in multiscale training as an example, the image feature is extracted through the convolution operation of the residual block. A convolution operation is performed by sliding a filter along the input, in each place, the element-wise multiplication of the matrices is performed, and the result is summed and then fed into the feature map. The 1 × 1 convolution of the dotted line block is to adjust the dimension of the channel at the first bottleneck so that it can be operated with the output of bottleneck. The anchor scale of RPN is changed to solve the target aspect ratio problem.
The detection framework is shown in Figure 7. Faster R-CNN uses RPN to replace the selective search method of Fast RCNN [10,11], RPN and region of interest (RoI) pooling share the previous CNN. At the end of the model, a judgement layer is added, considering the category and position of the bounding boxes. The whole process is as follows:
  • Firstly, preprocessing is performed on the collected image data sets of the cylindrical growth step. In order to accurately label the images, the contrast of the original image is enhanced to avoid misjudgment or omission due to the image being too dark. Before sending an image into the model, it is resized with the annotation frame to avoid oversized images causing insufficient resources, and the uint8 type image is normalized to the float type of [−1.0, 1.0].
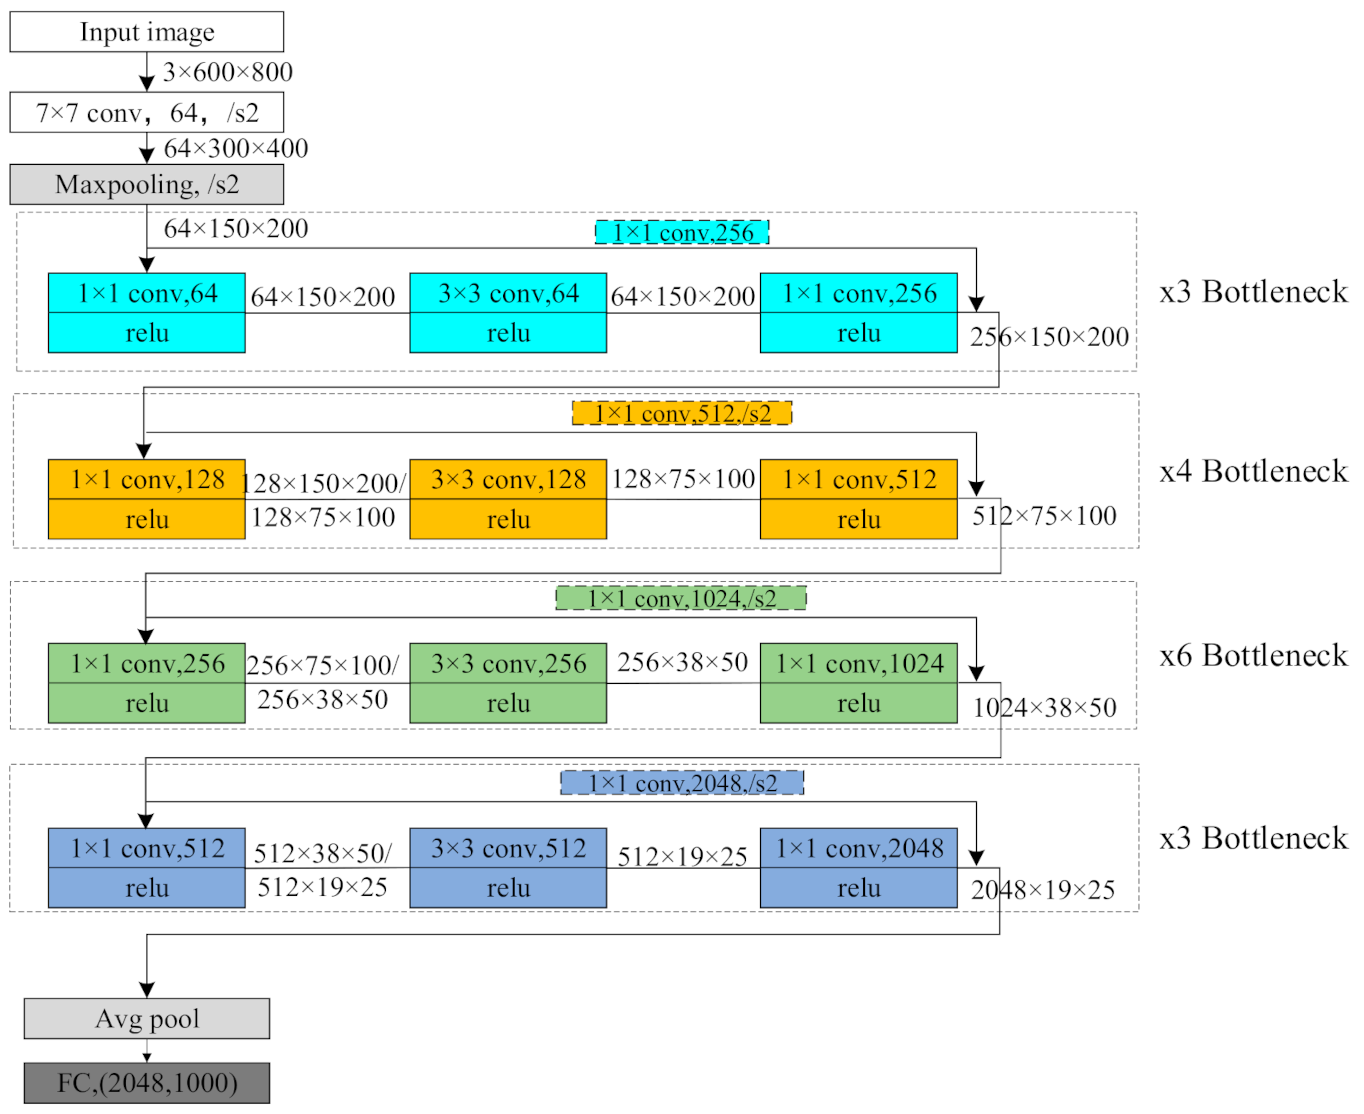
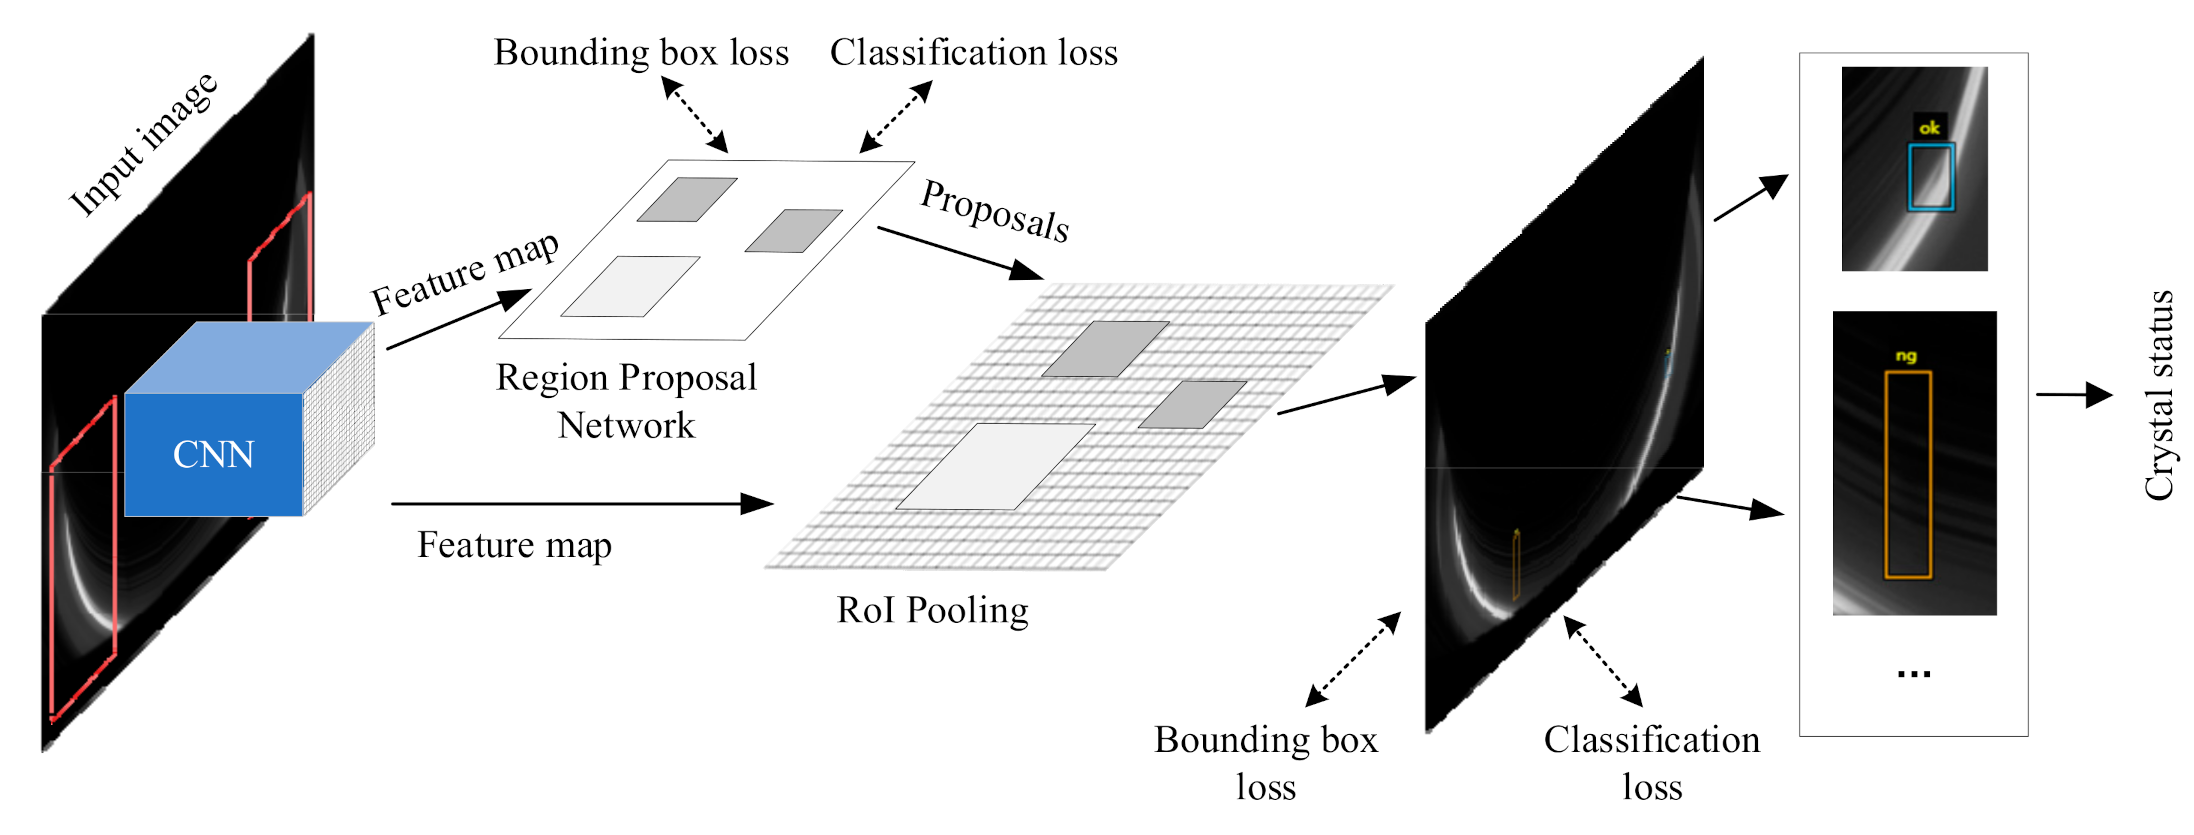
  • ResNet-50 is used to extract the feature map of the input image, and then the feature map is passed to the subsequent RPN network;
  • The RPN network is used to generate candidate boxes of feature maps, perform classification and bounding box regression:
    a.
    Classification: use softmax to determine whether anchors belong to the foreground (disappeared habit line or normal one) or background.
    b.
    Bounding box regression: modify anchors with bounding box regression on the feature map to generate preliminary proposals.
  • RoI pooling: proposals are mapped to feature maps, and the mapped areas are pooled into proposal feature maps of uniform size, and then they are fed to the fully connected (FC) layer to determine the target category.
  • Final classification: the final category of proposal feature maps is judged, and the position of the bounding box is again corrected by bounding box regression.
  • According to the position and category of the image target frame, if there exists a disappeared habit line and a normal one together, which corresponds to the special case, bounding boxes close to each other will be merged, and the target will be judged as normal.
The model adopts approximate joint training, the loss function is composed of two parts: (1) loss of RPN which includes classification loss distinguishing whether the anchor is the target and regression loss generated from the proposals; (2) loss of last-stage Fast R-CNN including classification loss determining final category and regression loss of the proposals’ accurate bounding boxes. The loss function of RPN network can be described as follows:
L p i , t i = 1 N c l s i L c l s p i , p i * + λ 1 N r e g i p i * L r e g t i , t i *
where i is the index of an anchor in a mini-batch, and p i is the predicted probability of anchor i being an object. The ground truth p i * = 1 (if the anchor is positive) when intersection over union (IOU) of the anchor [i] and the marked ground truth box is greater than the threshold (0.7 in the model), p i * = 0 (if the anchor is negative) when it is less than the threshold (0.3 in the model). This means that the regression loss function is only activated when the candidate box is foreground. t i = t x , t y , t w , t h is a vector representing the 4 parameterized coordinates of the predicted bounding box, and t i * is that of the ground-truth box associated with a positive anchor. N c l s represents the number of anchors in a mini-batch, N r e g represents the number of anchor locations. λ is the weight used to balance classification and regression loss, the classification loss L c l s is log loss over two classes (object vs. not object), the regression loss L r e g t i , t i * = s m o o t h L 1 t i - t i * , where the loss function s m o o t h L 1 can be described as follows:
s m o o t h L 1 x = 0.5 x 2 ,   x < 1 x 0.5 ,   o t h e r w i s e
In the subsequent Fast R-CNN stage, classification of final category and regression of accurate position of the prediction frame are performed, the loss function is defined as:
L p , u , t u , v = L c l s p , u + λ [ u 1 ] L l o c t u , v
Compared with the loss function of RPN network, L c l s p , u is the multiclassification loss that divides the final category of the target box, and the regression part L l o c t u , v still uses the s m o o t h L 1 loss function. u represents the category of the detection frame, that is, only the regression loss of the target box is calculated.

3. Experimental Results

3.1. Data Preparation

In order to test the accuracy of the proposed algorithm, image collection was firstly carried out on the production site which covers multiple different crystal furnaces and different phases of the cylindrical growth step since it lasts too long. The amount of data is crucial for CNN training. Insufficient data would affect the generalization ability of the network. As a result, the accuracy of the classification would decrease when the network receives new data. A total number of 3480 images of the cylindrical growth step with a resolution of 2592 × 1944 were collected as the experimental data set. After preprocessing, each image was labelled with no target (1630 images), disappeared habit line (780 images), or normal label (1070 images), no target means that it is hard to say whether there exists a habit line in the image or not. Since labeling is a laborious task, we manually labeled part of the images, and trained the model, then used the trained model to annotate the rest of the images, and readjusted the annotations. Referring to the COCO dataset annotation format, annotated json files were generated. Annotations were presented in the form of coordinates and sizes of the ground truth bounding boxes. The image datasets were randomly divided into training set, validation set and test set according to the ratio of 7:1.5:1.5. The training set and test set were mutually exclusive, test samples were not involved in the training process. In order to avoid overfitting, a broad range of image augmentations were applied to the training set, including rescaling, rotation, height and width shift, horizontal flip. Model training was performed on the training set to update the weights, the hyperparameters were adjusted on the validation set, and the test set was used to evaluate the detection performance of the model.

3.2. Evaluation Metrics

For the evaluation of any object detection approach, some statistical and machine metrics can be used: receiver−operator characteristic (ROC) curve, precision and recall, F-score [15]. Generally, first the results of an object detector are compared to the given list of the ground-truth bounding boxes. When can a detector be considered as correct: most studies related to object detection have used the overlap criterion, which was introduced by Everingham et al. [16] for the Pascal VOC challenge. As noted above, the detections are assigned to ground truth objects, and by calculating the bounding box overlap, they are judged to be true or false positives. In order to be considered as a correct detection according to [16], the overlap ratio between the predicted and ground truth boxes must exceed 0.5 (50%). The Pascal VOC overlap criterion is defined as the IoU and computed as follows:
IoU = b p b g t b p b g t
where the IoU is the overlap ratio; b p and b g t are predicted and ground truth bounding boxes, respectively; b p b g t means the overlap or intersection of the predicted and ground truth bounding boxes; b p b g t means the area of union of these two bounding boxes. Having matched detections to ground truth we can determine the number of correctly classified objects, which are called true positives (TPs), incorrect detections or false positives (FPs), false negatives (FNs) and true negatives (TNs). Using the total number of TPs, FPs, FNs and TNs, a wide range of evaluation metrics can be computed. Precision and recall are the commonly used metrics to evaluate most detection algorithms.
Precision = T P T P + F N
Recall = T P T P + F N
Precision is the fraction of correctly identified positive detections and predicted positive detections, whereas recall is the fraction of correctly identified positive detections and true positive detections. Sometimes they might be used on their own, or they might be used as a basis for derived metrics such as F-score and precision-recall curves. To realize automatic control of the furnace in the future, what really matters is that whether the detector can correctly classify the current state of the ingot, thus, we evaluated our approach using the accuracy metric:
Accuracy = T P + T N T P + T N + F P + F N

3.3. Model Training

The structure of the Faster R-CNN model was adjusted according to the unique features of the ingot image, the model was developed with PyTorch. To achieve higher accuracy, instead of training a model from scratch, we adopted a transfer learning technique and used a pretrained Faster-RCNN model on ImageNet as our chosen model to customize and initialize weights. The model was trained on an Intel core i7-7700 CPU, NVIDIA RTX 2070 super GPU, 16GB memory PC. The stochastic gradient descent (SGD) optimization algorithm was adopted with a starting rate of 0.0025, a momentum of 0.9, and a weight decay of 0.0001. The learning rate decay mode was warm up multistep learning rate [17] with a factor of 0.001, iterators of 1000, and linear method. The network was trained over 120 epochs using a batch size of 6 images and a step of 580 images per epoch. The loss curve is shown in Figure 8, as the number of iteration increased, the loss maintained a steadily decreasing trend, and showed a steady convergence state at a later period of training.
To test the robustness of our model, an inference test was conducted on the test set. Inference results of a sample example of different types of habit lines are shown in Figure 9. The first row is the original images, second row shows the result images after preprocessing, third row is the annotations, and fourth row is the inference results. There is occlusion in columns (a)–(f), there is no occlusion in columns (g)–(j). According to the actual task requirements, to early warn of the DHL phenomenon in the production process. For a single image, the detection accuracy of comprehensive judgement result was 97.33%, the model had good detection effect whether there was occlusion or not. In the hardware experimental environment, the inference speed was about 14.7 FPS, which could meet the needs of the actual production process.

3.4. Tracking Strategy

Sometimes it is difficult to judge the ingot state through one image or just looking into the furnace once, it can only be determined by looking at the observation window for a while during production. Therefore, we proposed a tracking strategy to judge the ingot state by the comprehensive results of multiple images continuously captured. The image was captured according to the rotation speed, for example, the ingot rotates at a speed of 8 r/min, we needed to continuously capture images while the ingot was making a turn, the acquisition frame rate was 7 FPS, therefore, 52 images needed to be captured. The state of the habit line was initialized to 0, when the first normal habit line was detected, it was updated to 1, if it was a disappeared one, and the state was updated to −1. The corresponding coordinates were also be recorded, around 1/4 cycle, at the same position in the current image, to detect whether there was a second normal habit line or a disappeared one. Finally, the ingot state was determined according to the habit line state and position of a cycle of ingot images. To be clear, inference results of a tracking process are illustrated in Figure 10. Starting from the first image of the 52 images and find the first image where there was a normal habit line in it, such as line No. 1 in Figure 10a. If there was normal habit line in the current image and the two images before and after, and this condition still held for the next three 1/4 cycles (Figure 10b–d), then the habit line was classified as normal. On the other hand, if there were no habit lines in the current image and the two images before and after, then the habit line was classified as disappeared. Compared with determining the current ingot state based on just one image, tracking strategy could provide a more comprehensive and practical result.

4. Discussion

Some misdetection sample images are shown in Figure 11, the main reasons for misdetection can be concluded as follows:
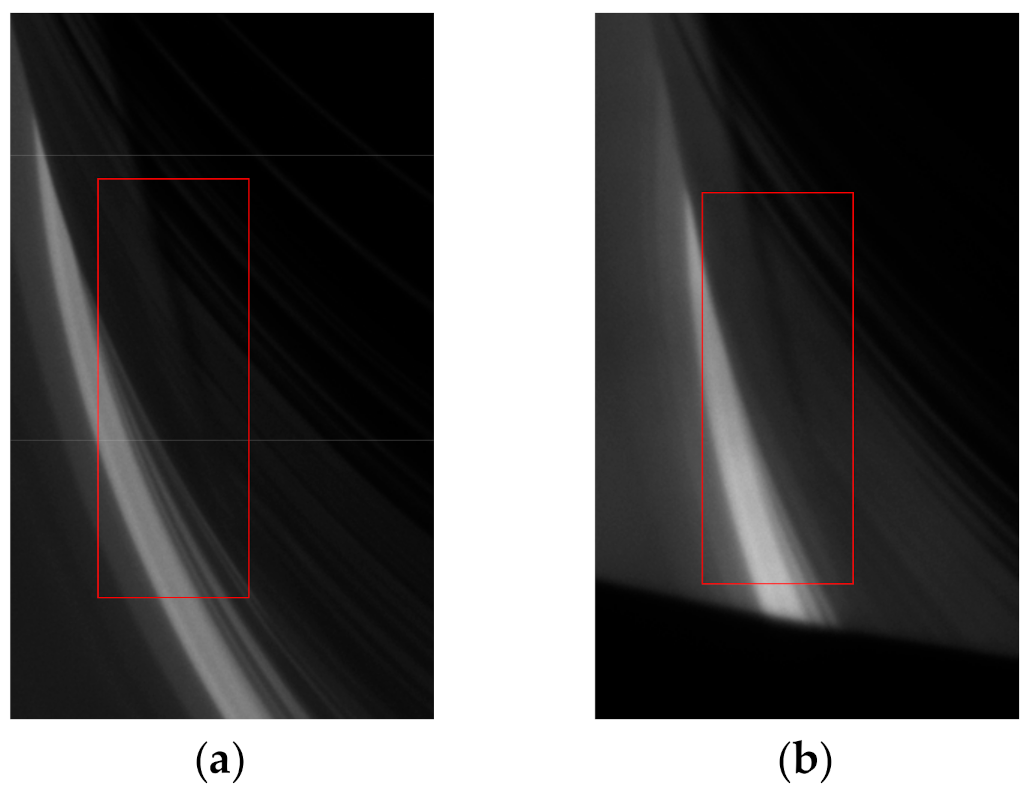
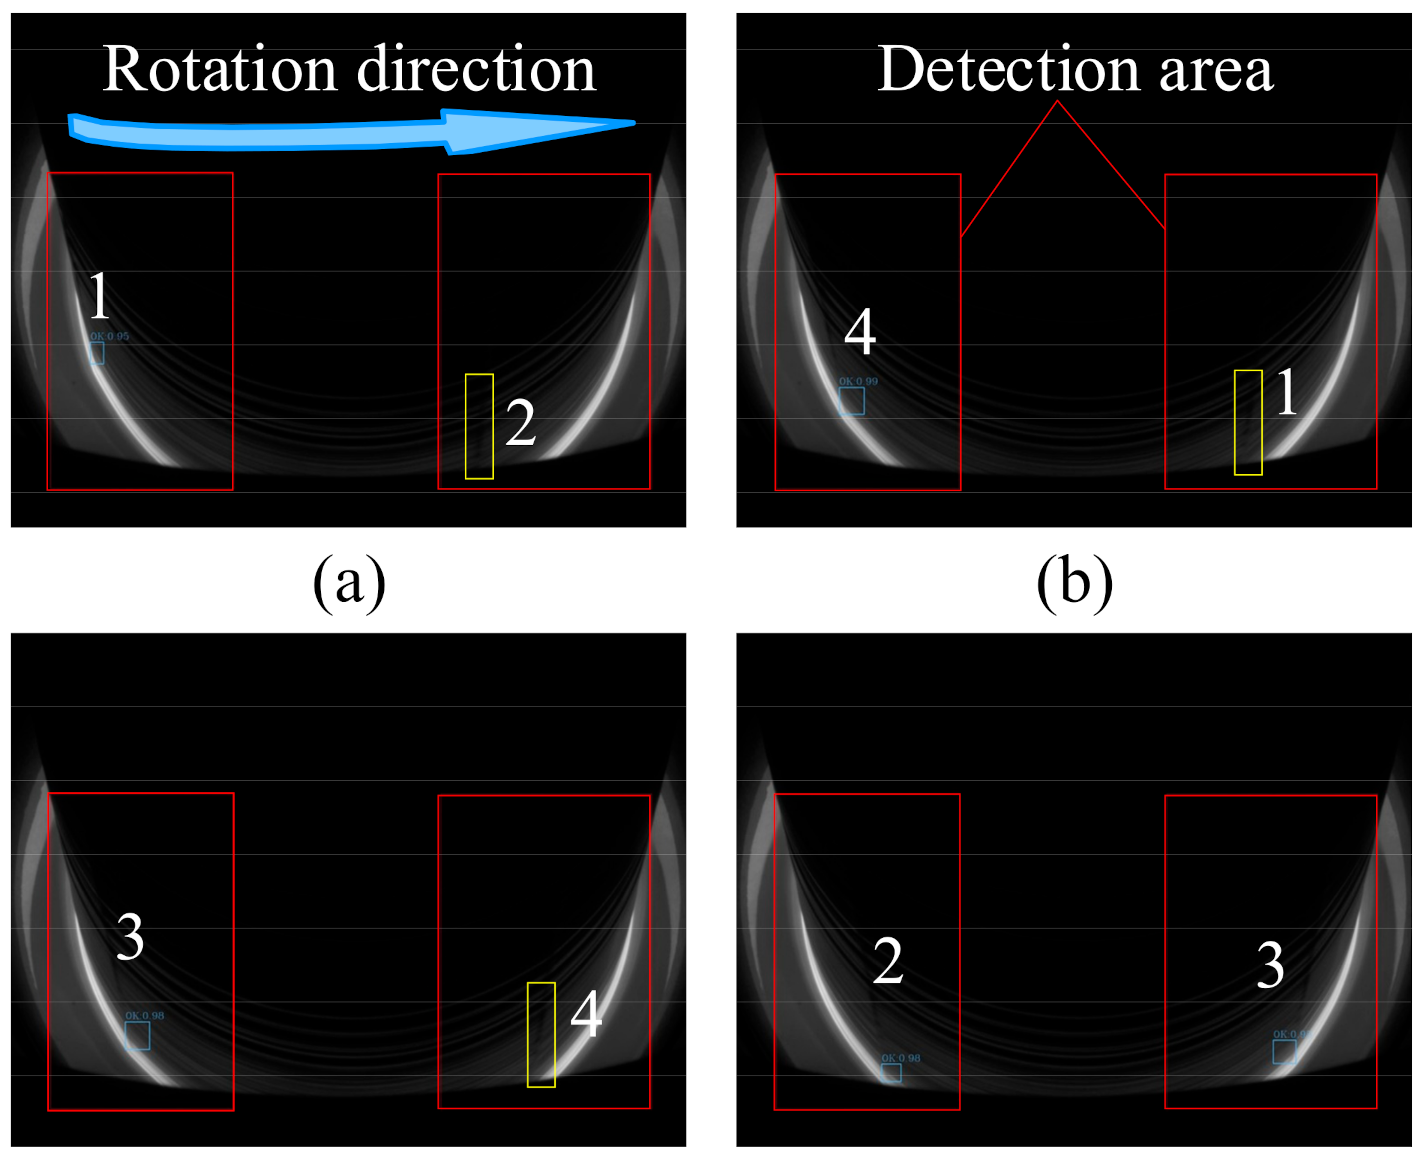
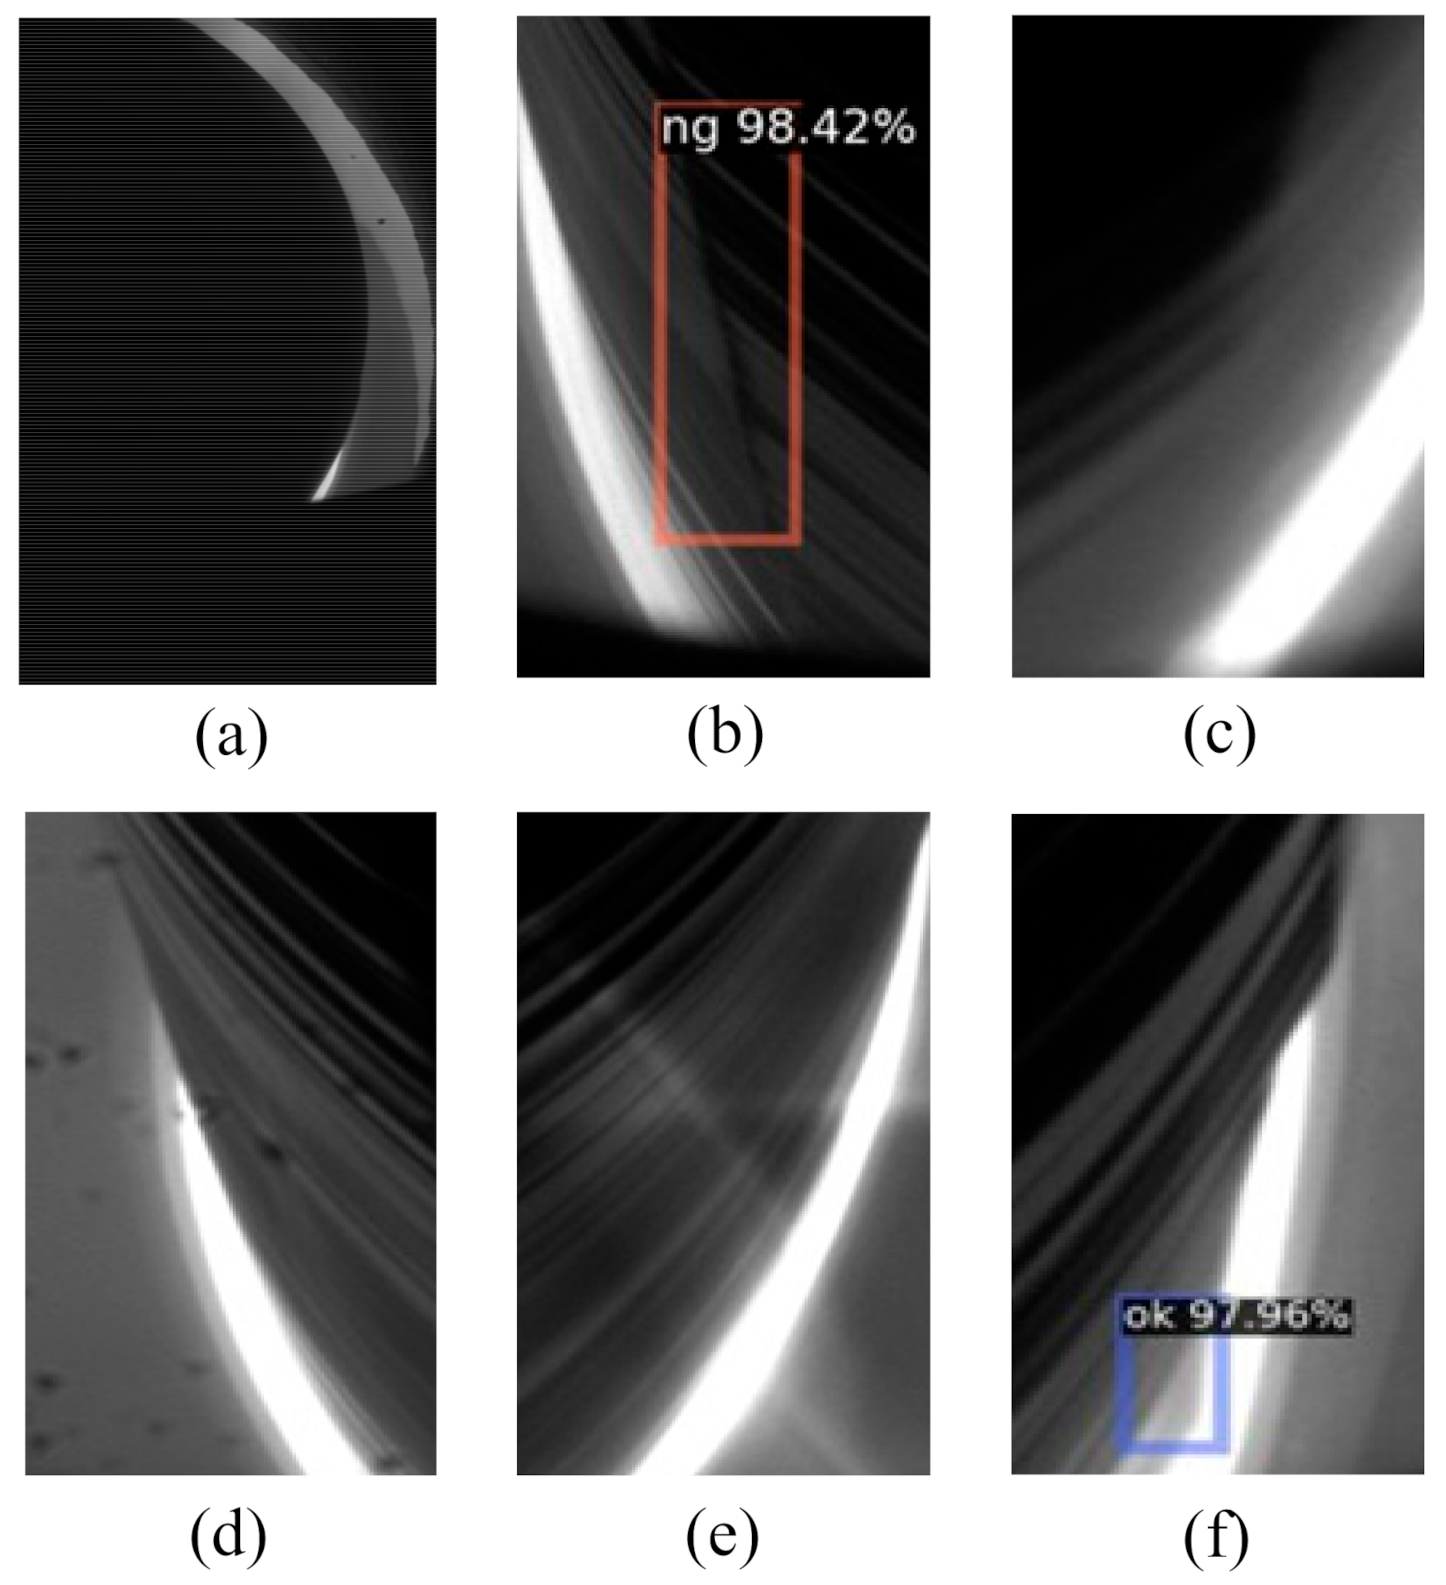
  • Before the ingot grows to 300mm length in the cylindrical growth process as shown in Figure 11a, it is basically not possible to perform visual inspection due to occlusion and view angle. Occlusion will cause the characteristics of the blocked and unblocked areas to be not obvious, thus the detection results of blocked areas cannot be determined;
  • Unbalanced dataset, the habit line turns from dark black to light gray and white, the amount of such image data is small, the model is prone to error detection. As shown in Figure 11b, a normal habit line is predicted to be NG;
  • Due to high temperature in the furnace and strong radiation, the image is blurred as illustrated in Figure 11c, the image effect of normal habit line appears to disappear, some camera parameters need to be adjusted;
  • Dirty lens will cause dark spots in the image which will interfere with the detection as shown in Figure 11d;
  • The light problem in the furnace will cause glare interference in the image as illustrated in Figure 11e;
  • Diameter change, unstable diameter control will also cause interference. As shown in Figure 11f, the diameter of the ingot is smaller than the desired value, the amount of such image data is small, the disappeared habit line was predicted to be OK;
  • When labelling, even the experienced operators cannot determine whether some habit lines disappear or not, there are mislabels in the data set.

5. Conclusions

In order to increase throughput and reduce costs, it is necessary to detect DHL phenomenon in the cylindrical growth step. For this problem, this paper proposes a kind of deep learning-based detection method. Experimental results show that the proposed detection method is feasible. The detection accuracy is 97.33% and the inference speed is about 14.7 FPS, which means that it can detect almost all the disappeared habit lines in time. To gain a more comprehensive and practical result, a tracking strategy is proposed inspired by human inspection. It is of great significance to improve the degree of automation of the single crystal furnace, reduce the labor intensity of manual inspection and prevent production accidents, it has practical industrial value. For future works, the model will be iteratively updated based on the on-site operation results, and the method will also be extended to account for more complex scenarios such as the shouldering step.

Author Contributions

Conceptualization, J.Z. and J.C.; methodology, J.Z. and H.L.; software, H.L.; validation, H.L. and J.Z.; formal analysis, H.L. and J.Z.; investigation, J.C.; resources, J.C. and W.L.; data curation, J.Z. and J.C.; writing—original draft preparation, J.Z.; writing—review and editing, J.Z., H.L., W.Z., B.J. and W.L.; project administration, J.C. All authors have read and agreed to the published version of the manuscript.

Funding

This research received no external funding.

Conflicts of Interest

The authors declare no conflict of interest.

References

  1. Aleksic, J.; Zielke, P.; Szymczyk, J.A. Temperature and Flow Visualization in a Simulation of the Czochralski Process Using Temperature-Sensitive Liquid Crystals. Ann. N. Y. Acad. Sci. 2002, 972, 158–163. [Google Scholar] [CrossRef] [PubMed]
  2. Lan, C.W. Recent progress of crystal growth modeling and growth control. Chem. Eng. Sci. 2004, 59, 1437–1457. [Google Scholar] [CrossRef]
  3. Voronkov, V.V.; Dai, B.; Kulkarni, M.S. Fundamentals and Engineering of the Czochralski Growth of Semiconductor Silicon Crystals. Compr. Semicond. Ence Technol. 2011, 3, 81–169. [Google Scholar]
  4. Lanterne, A.; Gaspar, G.; Hu, Y.; Øvrelid, E.; Di Sabatino, M. Characterization of the loss of the dislocation-free growth during Czochralski silicon pulling. J. Cryst. Growth 2017, 458, 120–128. [Google Scholar] [CrossRef]
  5. Zulehner, W. Czochralski growth of silicon. J. Cryst. Growth 1983, 65, 189–213. [Google Scholar] [CrossRef]
  6. Krizhevsky, A.; Sutskever, I.; Hinton, G.E. ImageNet classification with deep convolutional neural networks. In Proceedings of the 25th International Conference on Neural Information Processing Systems, Lake Tahoe, Nevada; 2012; pp. 1097–1105. Available online: https://papers.nips.cc/paper/4824-imagenet-classification-with-deep-convolutional-neural-networks.pdf (accessed on 20 May 2019).
  7. Tang, T.; Zhou, S.; Deng, Z.; Zou, H.; Lei, L. Vehicle Detection in Aerial Images Based on Region Convolutional Neural Networks and Hard Negative Example Mining. Sensors 2017, 17, 336. [Google Scholar] [CrossRef] [PubMed] [Green Version]
  8. Girshick, R.; Donahue, J.; Darrell, T.; Malik, J. Region-Based Convolutional Networks for Accurate Object Detection and Segmentation. IEEE Trans. Pattern Anal. Mach. Intell. 2015, 38, 1. [Google Scholar] [CrossRef] [PubMed]
  9. Uijlings, J.; Sande, K.; Gevers, T.; Smeulders, A. Selective Search for Object Recognition. Int. J. Comput. Vis. 2013, 104, 154–171. [Google Scholar] [CrossRef] [Green Version]
  10. Girshick, R. Fast R-CNN. In Proceedings of the 2015 IEEE International Conference on Computer Vision (ICCV), Santiago, Chile, 7–13 December 2015; pp. 1440–1448. [Google Scholar]
  11. Ren, S.; He, K.; Girshick, R.; Sun, J. Faster R-CNN: Towards Real-Time Object Detection with Region Proposal Networks. IEEE Trans. Pattern Anal. Mach. Intell. 2017, 39, 1137–1149. [Google Scholar] [CrossRef] [PubMed] [Green Version]
  12. Zeiler, M.; Fergus, R. Visualizing and Understanding Convolutional Neural Networks; Springer: Cham, Switzerland, 2013; p. 8689. [Google Scholar] [CrossRef] [Green Version]
  13. Simonyan, K.; Zisserman, A. Very Deep Convolutional Networks for Large-Scale Image Recognition. arXiv 2014, arXiv:1409.1556 2014. [Google Scholar]
  14. He, K.; Zhang, X.; Ren, S.; Sun, J. Deep Residual Learning for Image Recognition. In Proceedings of the 2016 IEEE Conference on Computer Vision and Pattern Recognition (CVPR), Las Vegas, NV, USA, 27–30 June 2016; pp. 770–778. [Google Scholar]
  15. Flach, P.A. The Geometry of ROC Space: Understanding Machine Learning Metrics through ROC Isometrics. In Proceedings of the Machine Learning, Twentieth International Conference, Washington, DC, USA; 2003; pp. 194–201. Available online: https://aaaipress.org/Papers/ICML/2003/ICML03-028.pdf (accessed on 2 June 2019).
  16. Everingham, M.; Van Gool, L.; Williams, C.K.I.; Winn, J.; Zisserman, A. The Pascal Visual Object Classes (VOC) Challenge. Int. J. Comput. Vis. 2010, 88, 303–338. [Google Scholar] [CrossRef] [Green Version]
  17. Goyal, P.; Dollár, P.; Girshick, R.; Noordhuis, P.; Wesolowski, L.; Kyrola, A.; Tulloch, A.; Jia, Y.; He, K. Accurate, Large Minibatch SGD: Training ImageNet in 1 Hour. arXiv 2017, arXiv:1706.02677. [Google Scholar]
Figure 1. Structure of CZ single crystal furnace.
Applsci 10 07799 g001
Figure 2. A finished silicon crystal ingot with a disappeared habit line.
Applsci 10 07799 g002
Figure 3. Color and grayscale images of the furnace body in the cylindrical growth step (a,b) without occlusion; (c,d) with occlusion.
Applsci 10 07799 g003
Figure 4. (ag) Different patterns of normal habit lines.
Applsci 10 07799 g004
Figure 5. (a, b) Different patterns of disappeared habit lines.
Applsci 10 07799 g005
Figure 6. Architecture of the ResNet-50 residual neural network.
Applsci 10 07799 g006
Figure 7. The detection framework.
Applsci 10 07799 g007
Figure 8. The loss curves.
Applsci 10 07799 g008
Figure 9. Model inference results. (af) results of images with occlusion; (gj) results of images without occlusion.
Applsci 10 07799 g009
Figure 10. Inference results of the tracking process. (a) the first 1/4 cycle, (bd) the next three 1/4 cycles, the habit lines marked with yellow box are not detected due to occlusion.
Applsci 10 07799 g010
Figure 11. (af) Sample images that are prone to misdetection.
Applsci 10 07799 g011
Publisher’s Note: MDPI stays neutral with regard to jurisdictional claims in published maps and institutional affiliations.

