1. Introduction
New emission regulations applied to the ground transport in major countries are focused on the reduction of both greenhouse gases and pollutant emissions [
1]. In the particular case of Europe, an agreement was reached to further reduce the exhaust
targets beyond 2020. Thus, the New European Driving Cycle (NEDC)-based
limit in 2020 (95 g/km for passenger cars) will be reduced by a 15% in 2025 and 37.5% in 2030 [
2]. The new regulation also defines zero- and low-emission vehicles (ZLEV) as those with
emission below 50 g/km [
3]. This ZLEV category includes battery full electric vehicles (BEV) and plug-in hybrid electric vehicles (PHEV). This strategy opens the door to original engine manufacturers to meet
fleet requirements offering PHEV powered by internal combustion engines (ICEs), without the need to resort to BEV extensively [
4].
In this context of hybridization, several advanced technologies for ICEs are available to reach near-zero
emissions while allowing for the sustenance of the automotive industry and market [
5]. ICE improvements promote benefits in
[
6] and pollutant emissions [
7], being the exhaust aftertreatment systems (ATS) key to meet the limits on pollutant emissions in a context of highly dynamic operating conditions [
8]. However, the early activation of the catalytic converters is becoming a critical challenge. On the one hand, the optimization of the engine thermal efficiency has resulted in the reduction of the exhaust gas temperature [
9]. On the other hand, the electric propulsion periods make the engine to face long switch-off phases during which the ATS is cooled down [
10]. Specific warm-up strategies must be applied to reach early catalyst light-off, what comes at the expense of fuel consumption and subsequently (
) penalty. These strategies comprise active techniques, such as fuel post-injection [
11] and electric heating [
12], or passive techniques, as those related to thermal insulation of the combustion chamber [
13] and the exhaust line [
14] or management of the exhaust valve timing [
15,
16].
The availability on demand of electric power is leading the focus to the use of pre-turbine ATS [
4]. This layout of the exhaust line has been studied in the past and is presently revisited as a passive way to increase the conversion efficiency of the catalytic converters. The most evident advantage of the pre-turbine ATS location is the increase of the catalyst temperature. However, besides the earlier thermal catalyst activation, the potential to reduce the fuel consumption exists when the pre-turbine ATS substitutes some of the post-turbine elements. If any ATS device is moved from downstream to upstream of the turbine, its pressure drop is reduced due to the higher gas density (only from certain boosting pressure so that the turbine inlet pressure offsets the higher temperature) and the fact that it is not multiplied by the turbine expansion ratio to set the engine backpressure (exhaust manifold pressure) [
17]. This is particularly relevant for wall-flow monoliths, whose baseline pressure drop is high and increases as the soot is collected (while lower soot accumulation would occur in pre-turbine placement due to higher passive oxidation). As a drawback, a loss of enthalpy is found at the turbine inlet, mainly during accelerations, caused by the thermal inertia and heat losses of the ATS prior to the turbine [
18]. Consequently, the turbocharger lag is increased damaging the drivability. A balanced solution consists of the pre-turbine ATS downsizing looking for an equilibrium between fuel consumption benefit while decreasing the thermal inertia (both decreased as the ATS size is smaller) [
19].
As a result, the downsized ATS is able to keep high conversion efficiency of gaseous pollutants [
20] and filtration efficiency in wall-flow particulate filters [
21], but the turbocharger lag cannot be fully recovery to the traditional post-turbine ATS performance without additional measures. In addition, the difficulty of the ATS to deal with current emission limits does not enable the placement of all the ATS upstream of the turbine. With these boundaries, hybrid pre- and post-turbine layouts are currently taking the attention [
22]. Lindemann et al. [
23] combined pre-turbine diesel oxidation catalyst (DOC), selective catalytic reduction (SCR) and SCR filter (SCRF) with an underfloor SCR in a diesel engine with 48V mild hybridization. This layout provided a reduction in
ranging from 6 to 19% with respect to the baseline post-turbo ATS layout. Heavy-duty applications have also found synergies between mild hybridization and pre-turbine ATS as a complement to the baseline ATS, as discussed by Amar and Li [
24] concerning the benefits of the high pressure in pre-turbine SCR systems because of the increased reactants partial pressure [
25].
As an alternative to full-size pre-turbine ATS and hybridization to deal with turbocharger lag, this work explores the impact of installing a small-sized pre-turbine diesel oxidation catalyst (pre-DOC) on the engine fuel consumption as well as engine-out and tailpipe CO and HC emissions. The pre-DOC consists of a metallic substrate with triangular cells added to the baseline post-turbine ATS, which is composed of a DOC and a combination of selective catalytic reduction and particulate filter in a single monolith (SCRF). The proposed ATS configuration is evaluated in cold and warm engine operation under driving conditions represented by the Worldwide harmonized Light vehicles Test Cycle (WLTC). Despite its small size, which was selected to reduce the thermal inertia and, hence, the turbocharger lag, high CO and HC conversion efficiency was found in the pre-DOC. However, such a small size altered the flow path, deteriorating the engine performance in terms of fuel consumption and engine-out emissions. These effects and their root causes are analyzed in detail along with the change in the response of the close-coupled DOC.
2. Setup and Methods
For this study, a 4-cylinder 1.6 L diesel engine, whose main characteristics are summarized in
Table 1, was employed. The fuel injection system included a high-pressure pump capable of delivering up to 200 MPa, a common-rail and Denso G4.5s solenoid fuel injectors with 8-holes,
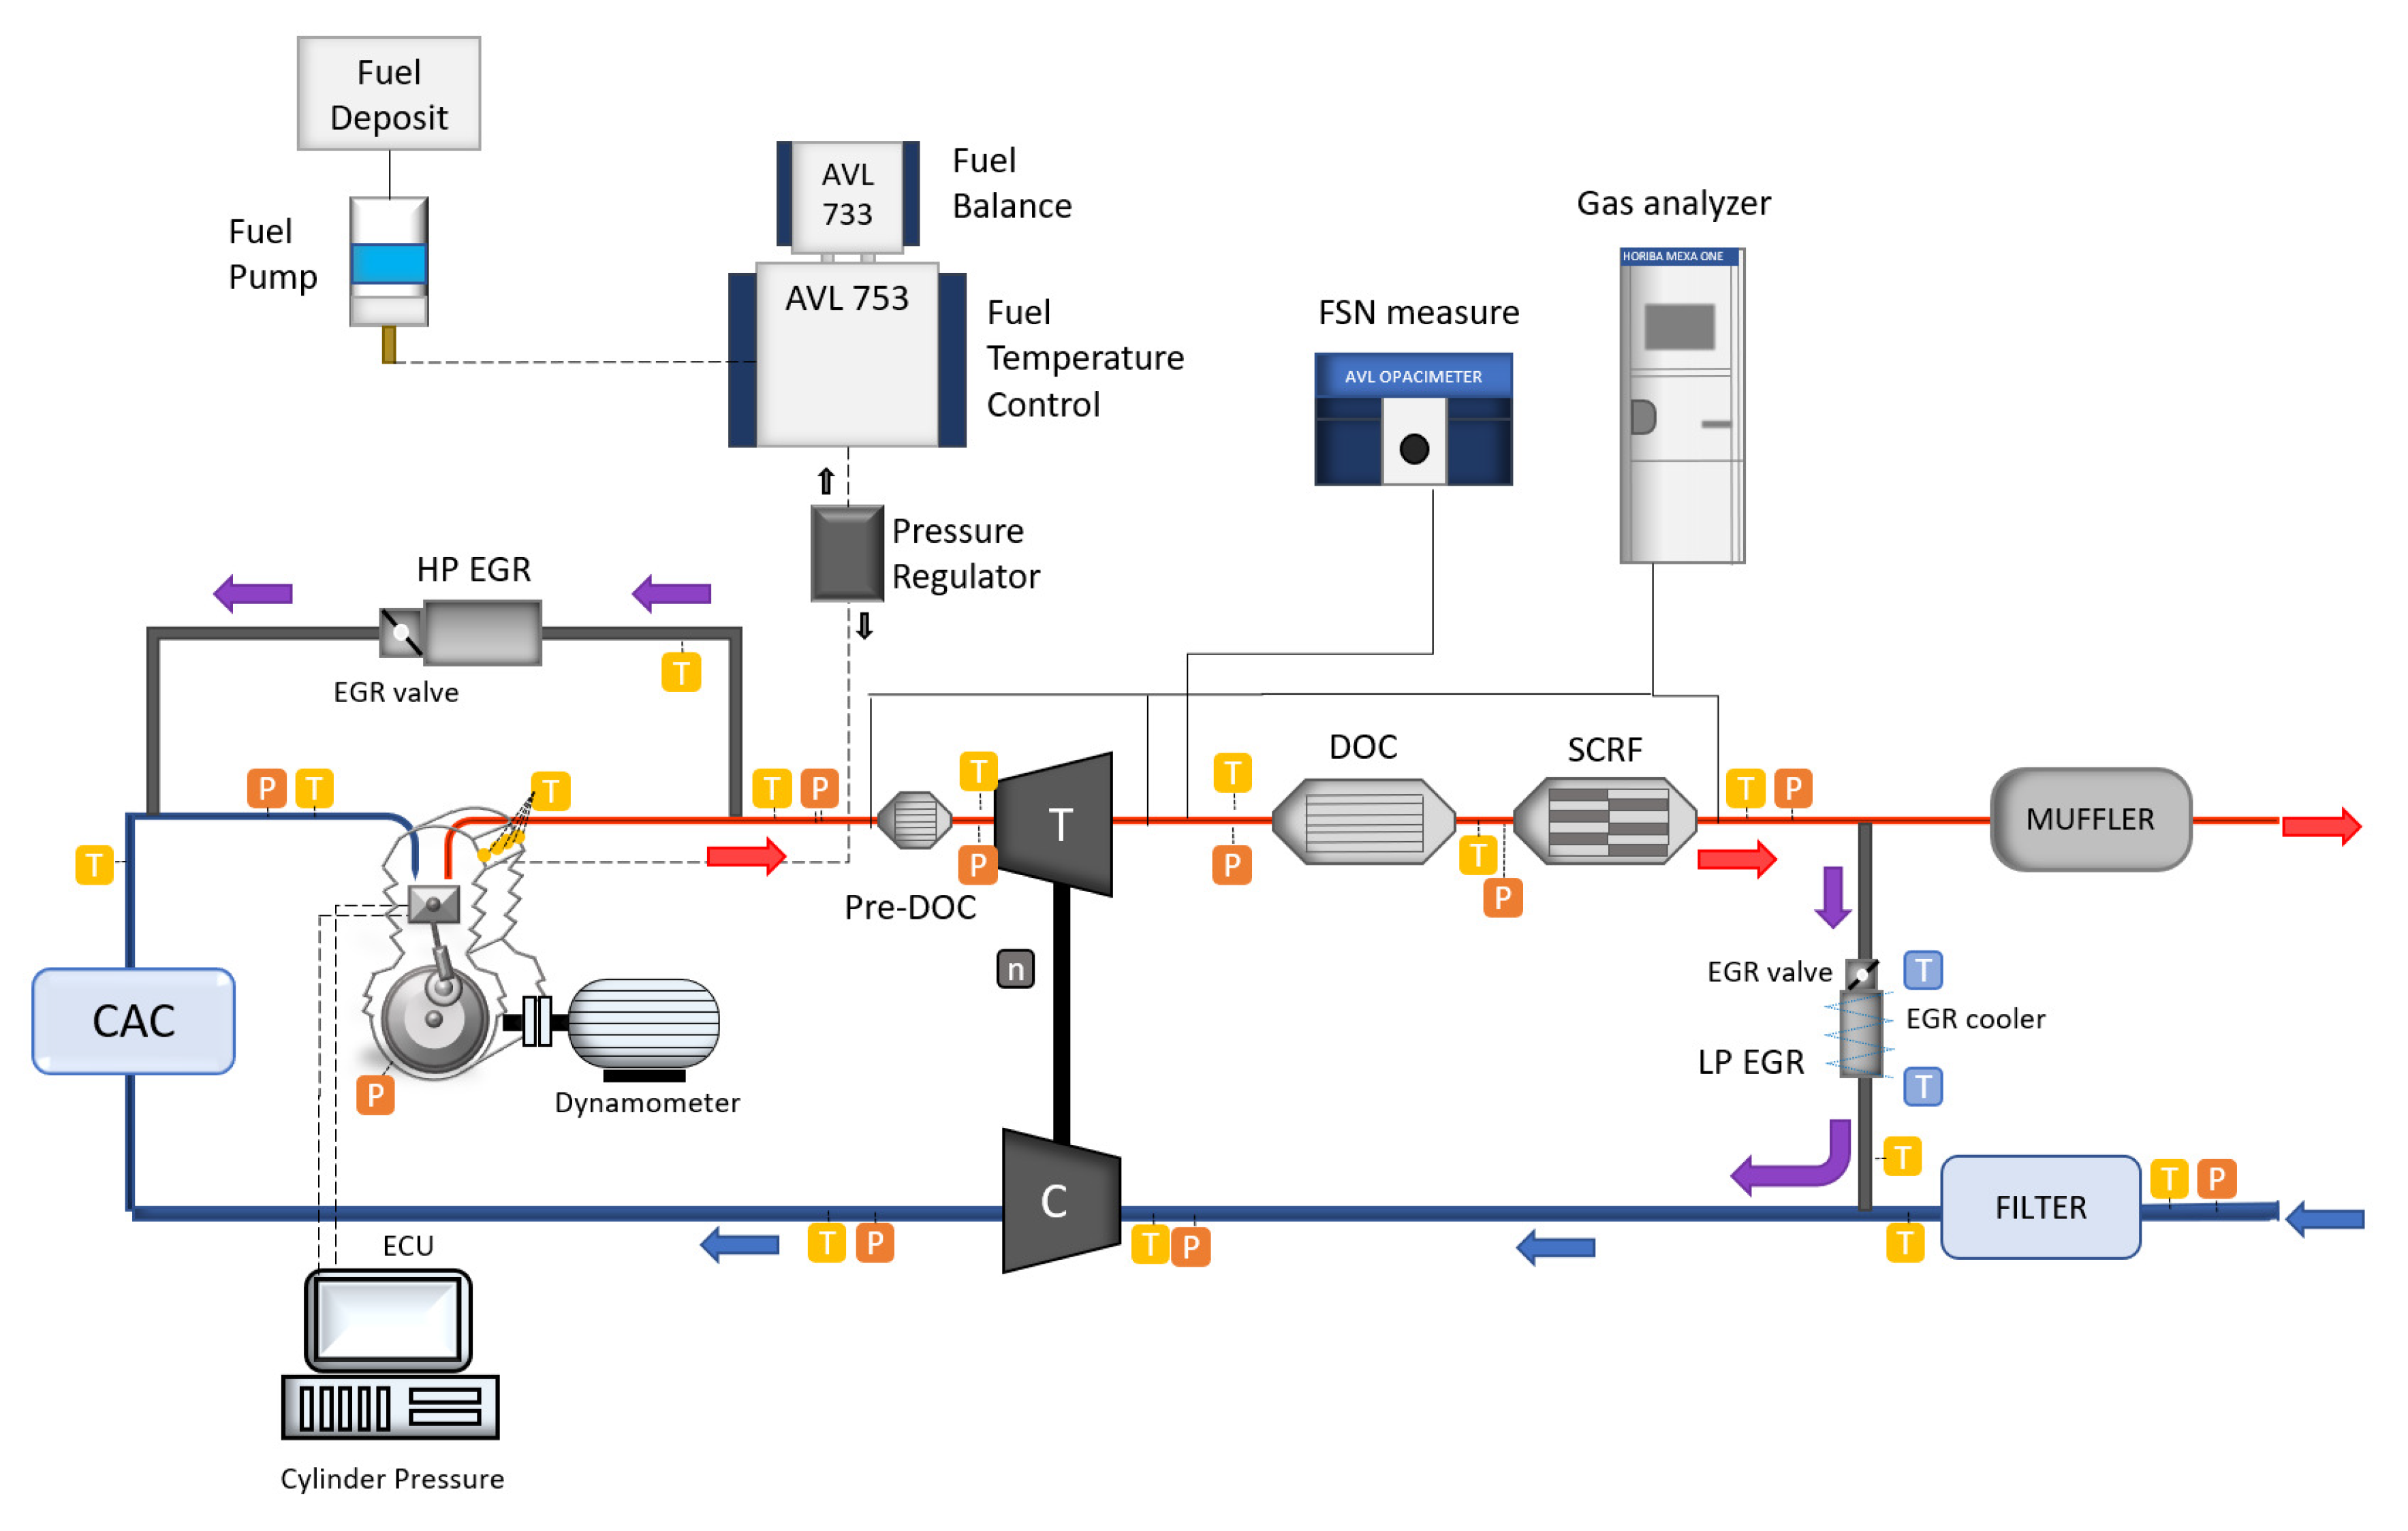
included angle and a flow number of 340 cc/s. As sketched in
Figure 1, the engine was equipped with a variable swirl actuator and two cooled exhaust gas recirculation (EGR) systems, i.e., high and low pressure. The high-pressure exhaust gas recirculation (HP-EGR) line extracted the gases from the exhaust manifold through the cylinder head. This HP-EGR route was composed of a valve, a cooler with a bypass route to avoid potential fouling issues at low load conditions, and a mixer introducing these exhaust gases on one side of the intake manifold. Instead, the low-pressure EGR (LP-EGR) line took the gases at the outlet of the close-coupled aftertreatment system and integrated them upstream of the compressor. The amount of recirculated gases in the low-pressure system was controlled by a three way valve, which throttled the intake flow before the compressor when the pressure difference in the LP-EGR line was low.
Table 2 lists the main instrumentation used in this work. The engine was coupled to an asynchronous dynamometer controlled by the HORIBA SPARC automation system accessed through the STARS user interface. The dynamometer can be used for engine dynamic tests being able to reproduce driving cycles as the WLTC tested in this work. An AVL 733S fuel balance measured the fuel consumption. ETAS INCA v7.1 was used to register the main actuations performed by the electronic control unit (ECU).
The emissions were monitored by an AVL 439 opacimeter placed at the turbine outlet and up to three samples of HORIBA MEXA-7100 DEGR to analyze the composition of the exhaust gases in different points of the exhaust line depending on the ATS layout.
Figure 1 shows the case of installed pre-turbine pre-DOC. The same systems measured the
mole fraction at the compressor outlet, for the determination of the low-pressure EGR rate, as well as at the intake manifold, to obtain the combination of both EGR systems when used simultaneously. The air path was monitored with an ABB hot-wire anemometer placed upstream of the engine airbox. Pressure and temperature probes were installed at the most significant sections of the intake and exhaust lines. Finally, a Picoturn sensor was placed in the compressor housing to measure the instantaneous rotational speed of the turbocharger.
The experimental campaign was driven to the analysis of the impact of adding a small-sized DOC at the exhaust manifold outlet upstream of the variable geometry turbine (VGT) in order to improve the removal of HC and CO emissions. The nominal ATS was composed of a closed-coupled DOC, coated with Pt and a zeolite layer for HC adsorption, followed by a SCRF. In this work, the urea injection was canceled to focus the analysis on the engine-out NOx emission and CO and HC oxidation in the pre-DOC and DOC. The geometry of these catalysts is detailed in
Table 3. The pre-DOC substrate was metallic with Pt coating but without HC adsorption capability (no zeolite layer). Metallic substrates are interesting for its use in pre-turbine location because of their thin walls, which provide high geometric surface area and low pressure drop in comparison to ceramic counterparts. In addition, these substrates have good mechanical durability and resistance to thermal shock at the same time ease the adaptation as electric catalysts to compensate the thermal inertia effects (not considered in this work). The pre-DOC was obtained from a full-size post-turbo metallic substrate cutting it with the diameter of the exhaust manifold outlet (turbine inlet) to reduce the added canning volumes. The original length (85 mm) was kept providing a volume of
. These dimensions balanced the effects on thermal inertia (small volume to minimize the turbocharger lag) and conversion efficiency (maximum residence time under the diameter constraint). The turbocharger was relocated due to the pre-DOC presence being necessary to adapt the oil supply. However, the small pre-DOC size avoided any interference of the turbocharger and close-coupled ATS with the engine block nor other components. Therefore, the original exhaust line was only modified by the installation of the pre-DOC.
The performance of the ATS was analyzed with the baseline ATS and with pre-turbine pre-DOC by means of driving cycles defined by the WLTC. For each configuration, both cold (starting with engine coolant at room temperature) and warm (starting with coolant at 90 C) were performed consecutively. Before each WLTC, the DPF was regenerated to avoid the effects of different initial DPF soot loading on the engine backpressure. Finally, the procedure was done twice to ensure the repeatability of the results.
3. Discussion of the Results
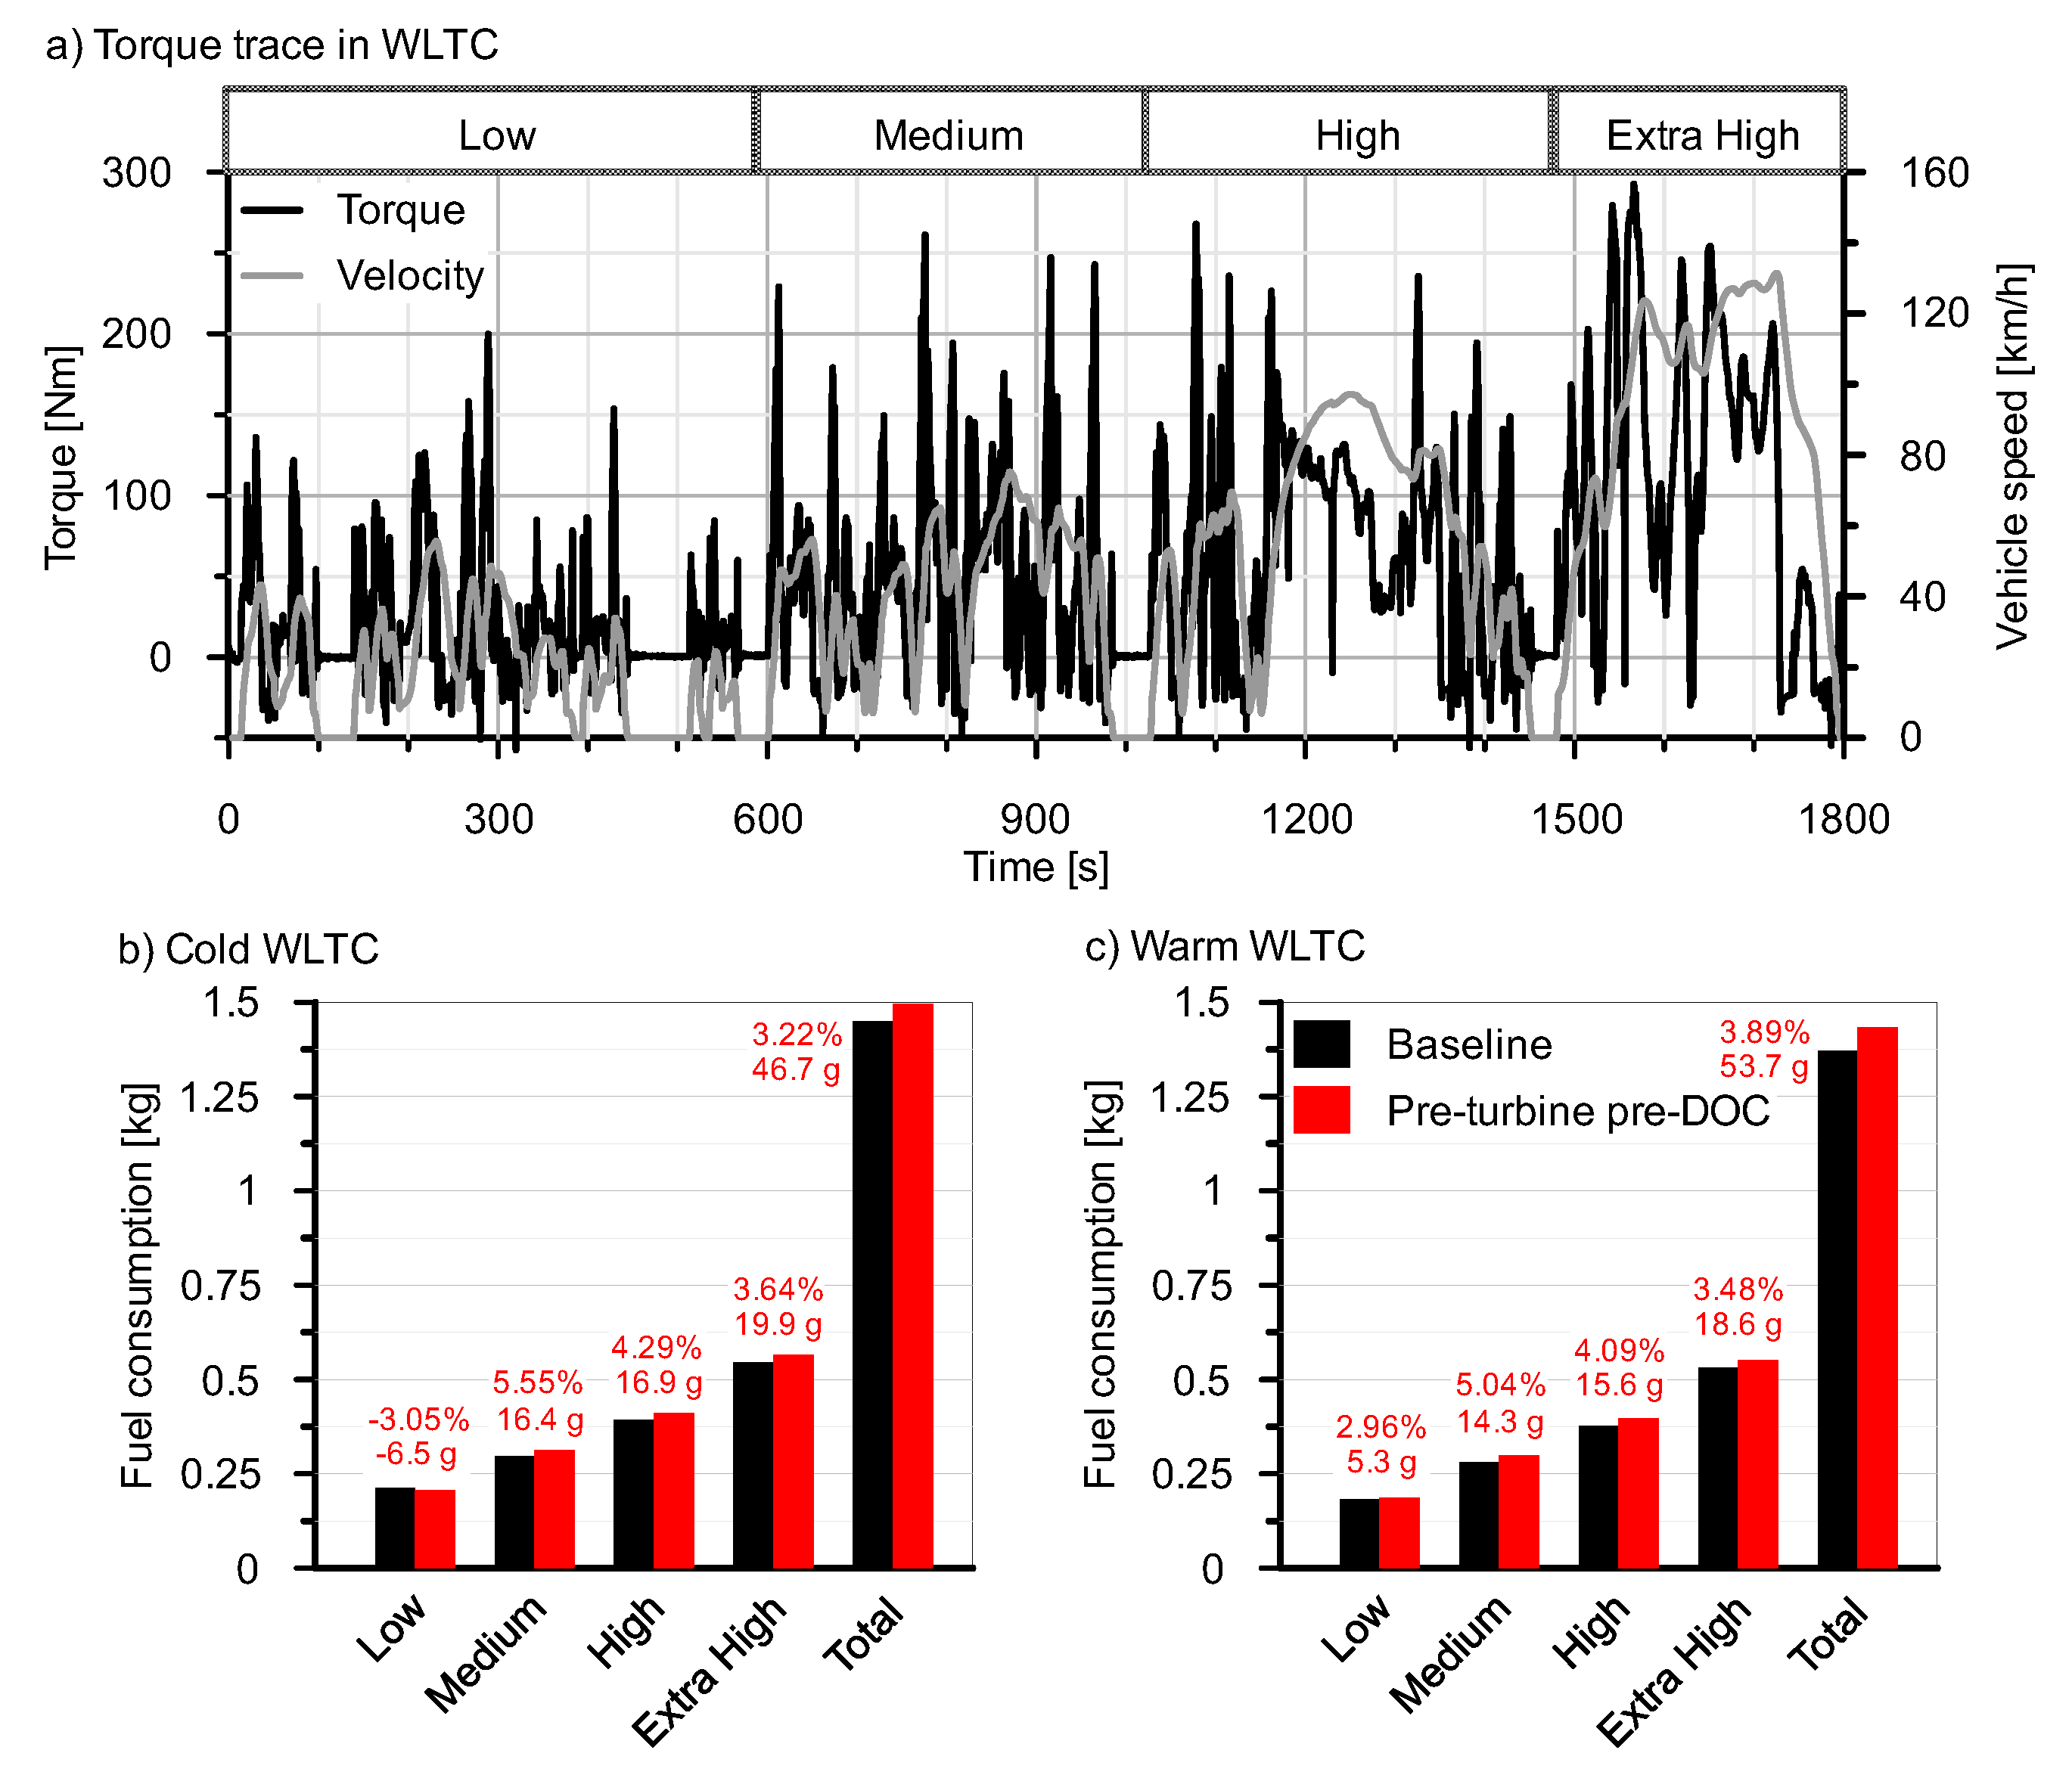
Figure 2a shows the vehicle speed during the WLTC superimposed over the engine torque provided by the engine to reach it. The driving cycle is composed of four speed phases, from low to extra-high speed, which will be taken as reference to conduct the analysis of the results along with the total cumulative result of mass-based magnitudes. With this approach,
Figure 2b,c represent the cumulative fuel consumption in every speed phase and the total amount for each ATS configuration in cold and warm WLTCs respectively. The fuel consumption was lower in the warm cycles but the difference between baseline ATS and pre-turbine pre-DOC configurations was similar in all cases. An increase of fuel consumption was brought by the installation of the pre-turbine pre-DOC. The cumulative fuel consumption at the end of the cycle increased in
(46.7 g) and
(53.7 g) in cold and warm WLTCs respectively. On this regard, the variation in fuel consumption brought by the pre-turbine pre-DOC configuration in every WTLC phase is detailed in
Figure 2b,c. In cold conditions, the pre-turbine pre-DOC configuration improved the fuel consumption during the low-speed phase (
(−6.5 g)). However, a progressive deterioration of the fuel consumption was found from the medium speed phase on. In warm cycles, the trend was similar in these medium- to extra-high-speed phases but the low-speed phase also resulted in a fuel consumption penalty for the pre-turbine pre-DOC configuration (
(5.3 g)).
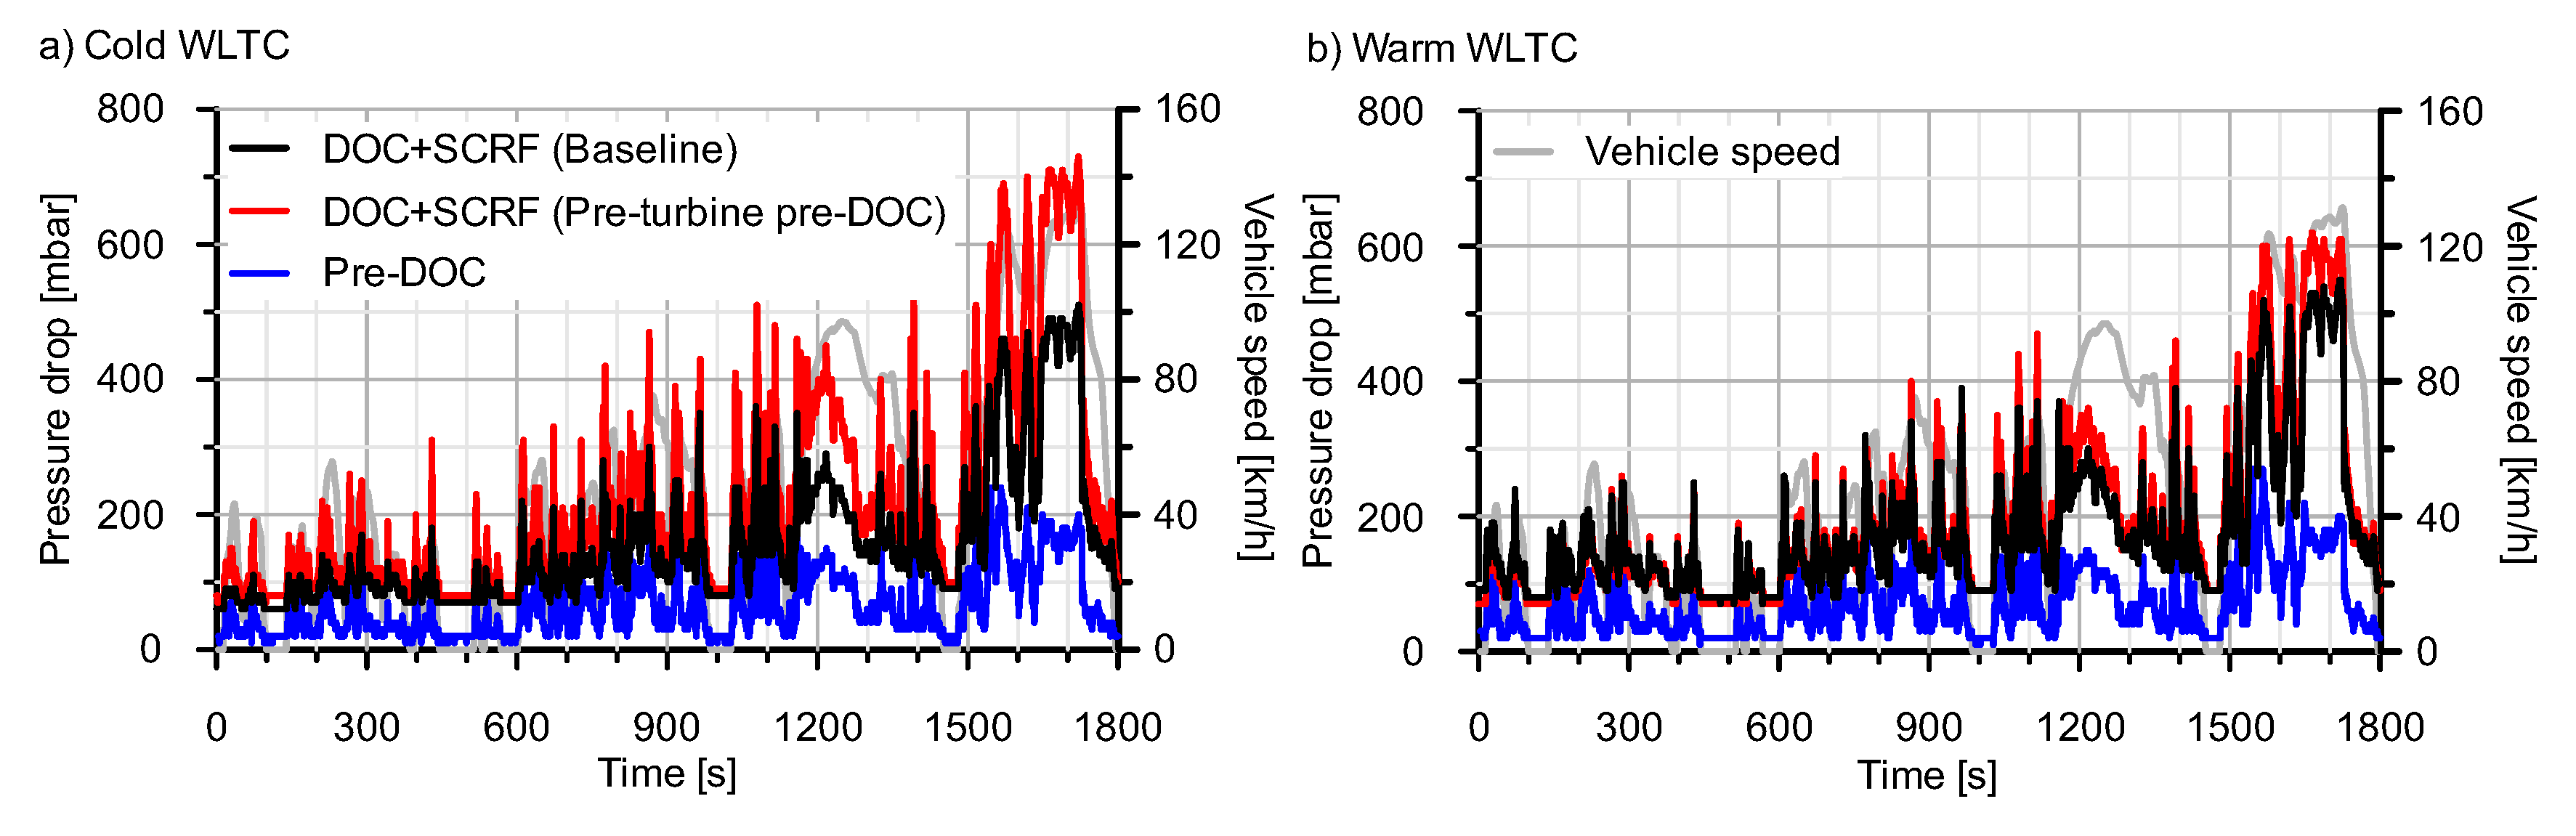
The fuel consumption penalty has its origin in two linked pressure drop phenomena. In this study, the addition of a new element (pre-turbine pre-DOC) necessarily involves an increase of the exhaust line pressure drop, so that some fuel consumption damage was expected.
Figure 3 shows the pressure drop of the ATS elements in baseline and pre-turbine pre-DOC configurations for each WLTC. The pre-turbine location contributes to decrease the pressure drop of a given element because of the higher gas density provided that the pressure at the turbine inlet is high enough to offset the higher temperature with respect to post-turbine location [
26]. This condition is only fulfilled from a certain level of boost pressure. However, the pre-DOC shows high pressure drop in comparison to the DOC+SCRF during all WLTC phases. The pre-DOC pressure drop ranged 25–30% of the DOC-SCRF one in pre-turbine pre-DOC configuration. It is interesting to note that the ATS pressure drop, and in particular the pre-DOC one, was higher in the low-speed phase of the warm WTLC than in the cold one. This result contributes to explain the higher fuel penalty damage for the former during such WLTC phase. This was due to the lower gas temperature and SCRF soot loading in the cold WLTC (cold WLTC was run from clean wall-flow filter while warm WLTC did it from the soot loading corresponding to cold WLTC). The magnitude of the pre-DOC pressure drop was caused by the reduced effective cross-section of the monolith. Although it had the same diameter than the turbine inlet, the open frontal area (OFA) distorted the flow path due to the decrease of the effective section by 18% (OFA = 0.82).
The addition of this pressure drop to the exhaust path penalizes the engine backpressure by itself, but also induces a negative effect on the boost control, as described next. On the one hand, the pre-turbine location directly affects the amplitude of the instantaneous pressure pulses at the turbine inlet. As seen in previous works, this location produces a change from pulsating to constant pressure turbocharging that can have a positive impact on the turbine efficiency [
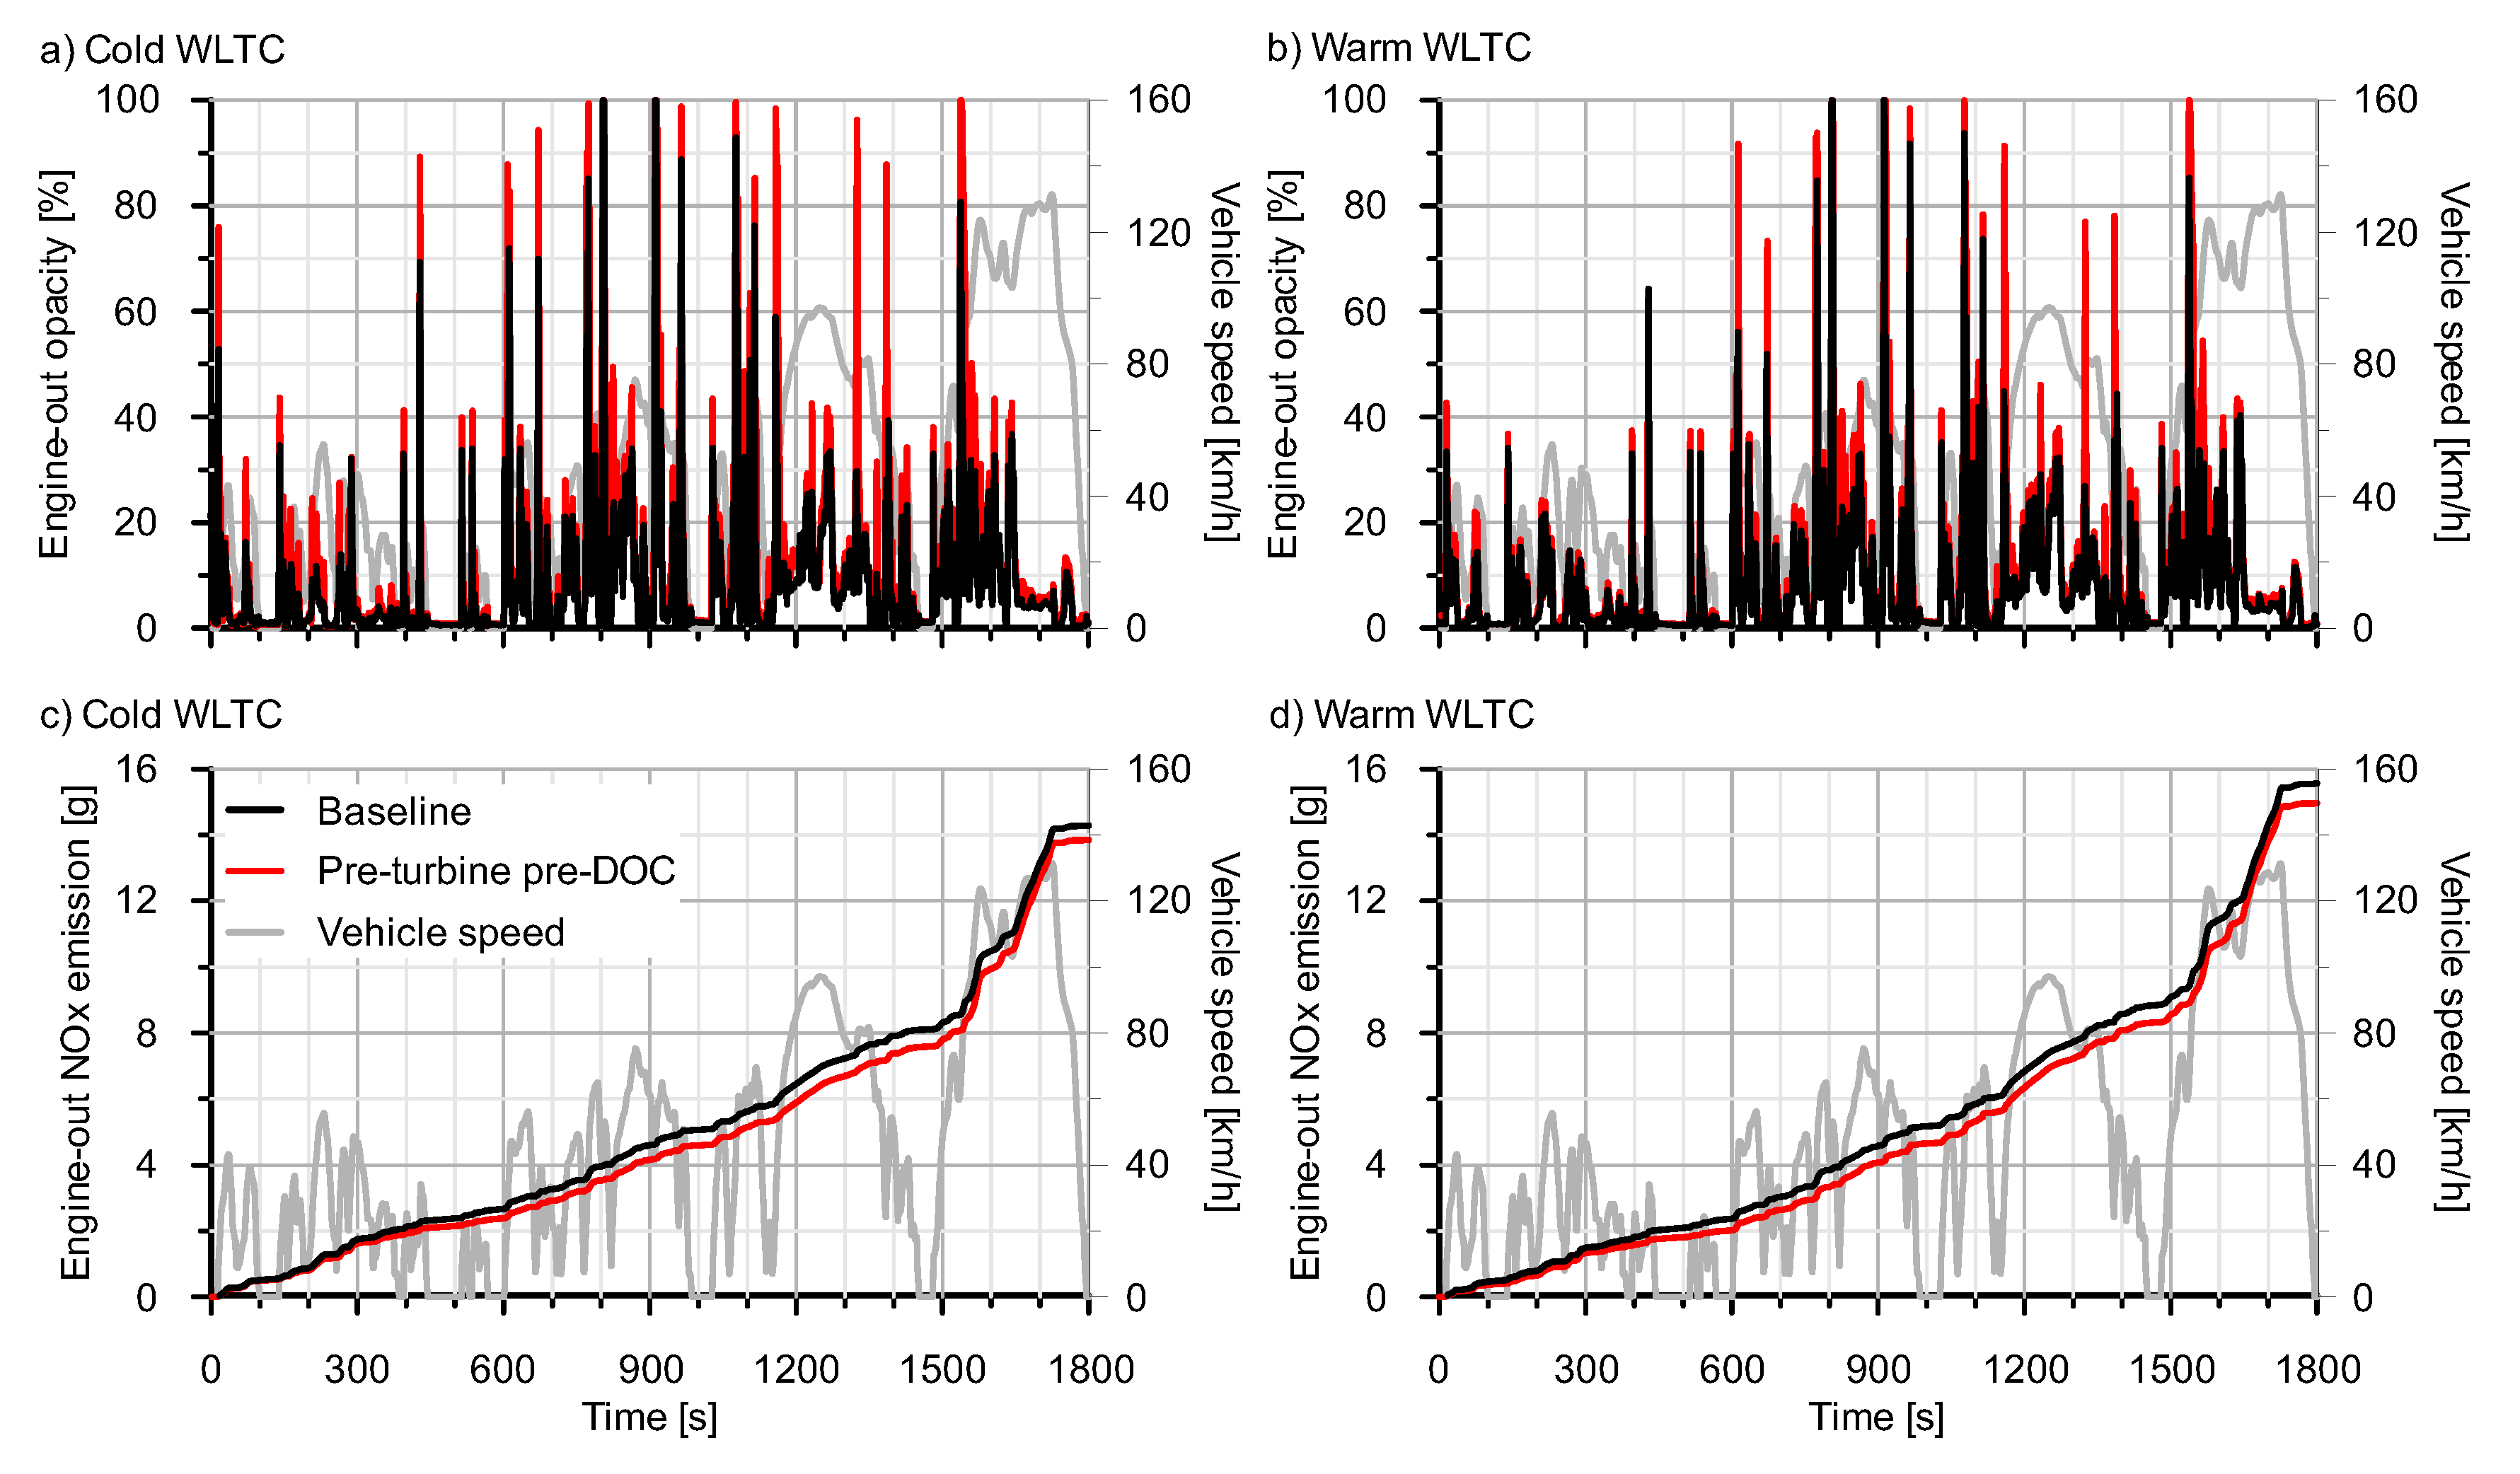
27]. At the same time, the rarefaction wave affects the gas exchange process increasing the internal EGR. On the other hand, these changes in the gas exchange induce an increase in the soot emission, as shown in
Figure 4a,b by the instantaneous engine-out opacity and found in previous studies regarding pre-turbine ATS [
18]. Consequently, higher SCRF soot loading was obtained, what explains the difference in DOC+SCRF pressure drop between pre-turbine pre-DOC configuration and the baseline ATS observed in
Figure 3. Due to the change in the flow pattern at the VGT inlet and, mainly, the increase of the tailpipe backpressure, the engine control varied the VGT position (closing it) to reach the target boost pressure (the HP- and LP-EGR control strategy was unaltered, so no differences in EGR rate were produced).
Figure 5 shows in plots (a) and (b) how the VGT was closer (higher VGT position value) until reaching its maximum closure (90%) in pre-turbine pre-DOC than in the baseline configuration for both cold and warm WLTCs. The closer VGT position and the trends in pressure drop resulted in a relevant increase of the exhaust manifold pressure with pre-DOC, which was more evident in sudden accelerations and as the engine load increased (
Figure 5c,d). As for fuel consumption, the penalty of pre-turbine pre-DOC configuration on exhaust manifold pressure was higher in the low-speed phase for warm conditions than cold ones. In fact, this pressure is even lower (more open VGT) along some periods of the low-speed phase with pre-turbine pre-DOC configuration in the cold WLTC. This is because of the benefits of constant pressure turbocharging (higher turbine efficiency) govern on the pressure drop damage for this initial stage in the cold WLTC.
Figure 4a,b show that the higher opacity in pre-turbine pre-DOC configuration with respect to the baseline ATS case is present throughout the cold and warm cycles. The penalty is similar between them during medium-, high- and extra-high-speed phases. In contrast, the pre-turbine pre-DOC case increased more the opacity in cold operation than in warm driving during the low-speed phase.
Figure 4c,d depict the cumulative engine-out NOx emission. According to the increase of the internal EGR because of the exhaust manifold pressure increase, the engine-out NOx emissions decreased by the installation of the pre-turbine pre-DOC. At the end of the cycle, the NOx emission reduction reached 0.43 g (3%) in the cold WLCT and 0.60 g (3.9%) in the warm case.
The most harmful effect of pre-turbine ATS on the engine performance is the marked turbocharger lag during sudden accelerations caused by the monolith thermal inertia [
18]. As this effect is critical in nominal-sized ATS movement upstream of the turbine, it is progressively avoided as the monolith size is decreased. Despite the potential for ATS downsizing of the pre-turbine location [
28], the complete removal of the turbocharger lag requires very small monoliths complemented with post-turbo counterparts for full pollutant abatement or an electric-assisted turbocharger [
29]. In this work, the tested pre-DOC produced a very slight turbocharger lag, as observed in intake manifold pressure and turbocharger speed represented in
Figure 6 for the more demanding high- and extra-high-speed phases. Accordingly, the effect on the turbine inlet temperature, which is represented in top charts of
Figure 7 for cold and warm WLTCs as a function of the ATS configuration, was also negligible. As observed, the pre-DOC inlet temperature is higher than the one in the exhaust manifold in baseline ATS configuration because of the higher exhaust backpressure effects. However, the temperature dropped across the pre-DOC because of the heat losses and thermal inertia, which were not offset by the heat released due to the HC and CO oxidation. Nevertheless, the change in DOC inlet temperature is positive and much more relevant, as illustrated in
Figure 7c,d. The turbocharger operation with quasi-steady flow led to lower temperature drop in the expansion, favoring a faster warm-up of the close-coupled DOC.
With these fluid-dynamic boundaries,
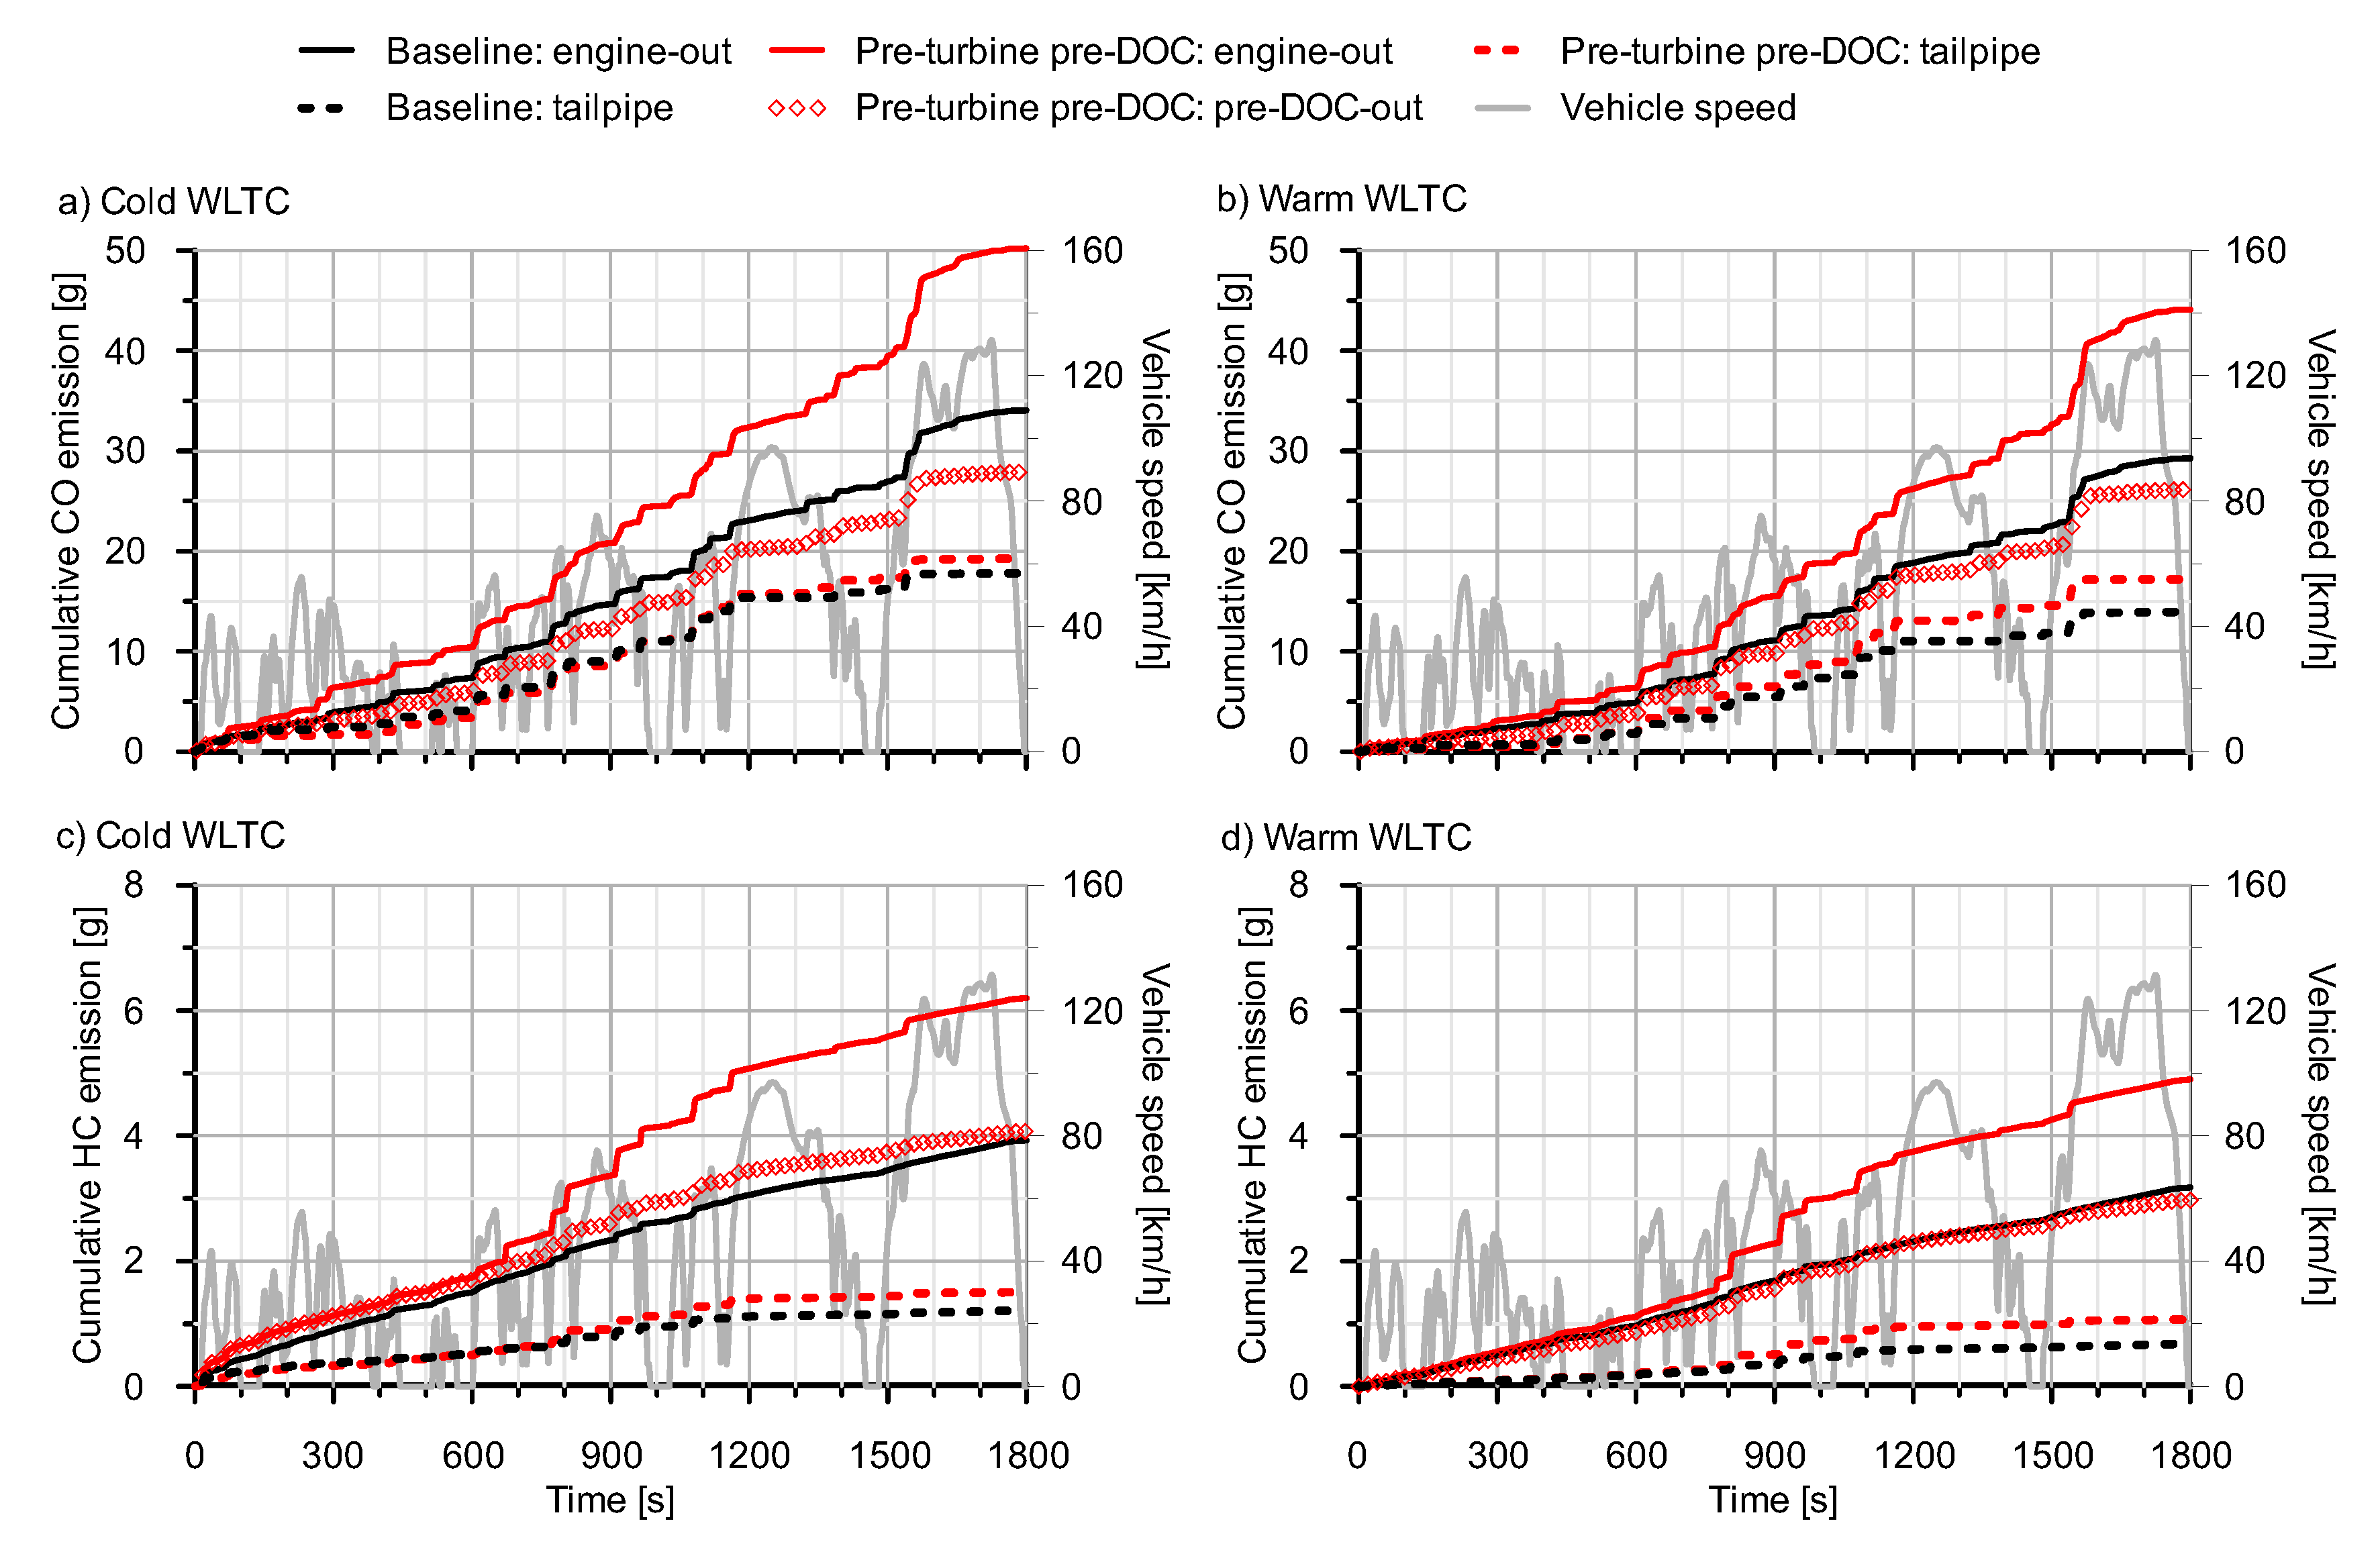
Figure 8 shows the cumulative engine-out and tailpipe emissions of CO and HC in cold and warm WLTCs with baseline ATS and pre-turbine pre-DOC configurations. Complementary,
Table 4 summarizes the cumulative engine-out CO and HC emissions at the end of each WLTC as a function of the ATS configuration. The higher exhaust manifold pressure deteriorated the combustion process with pre-turbine pre-DOC configuration due to the increase of the internal EGR. Consequently, a slight decrease in air mass flow was found, with an increase in fuel consumption to reach the vehicle speed target. Therefore, an increase of the equivalence ratio took place in pre-turbine pre-DOC configuration. This engine response made the CO and HC emission increase around 50% both in cold and warm WLTCs with respect to the baseline ATS case. As observed in
Figure 8, this response avoided decreasing the tailpipe emissions with respect to the baseline configuration, despite the earlier activation of the pre-DOC, which highly contributed to the emission abatement. These results are next discussed in detail to bring out the involved phenomena.
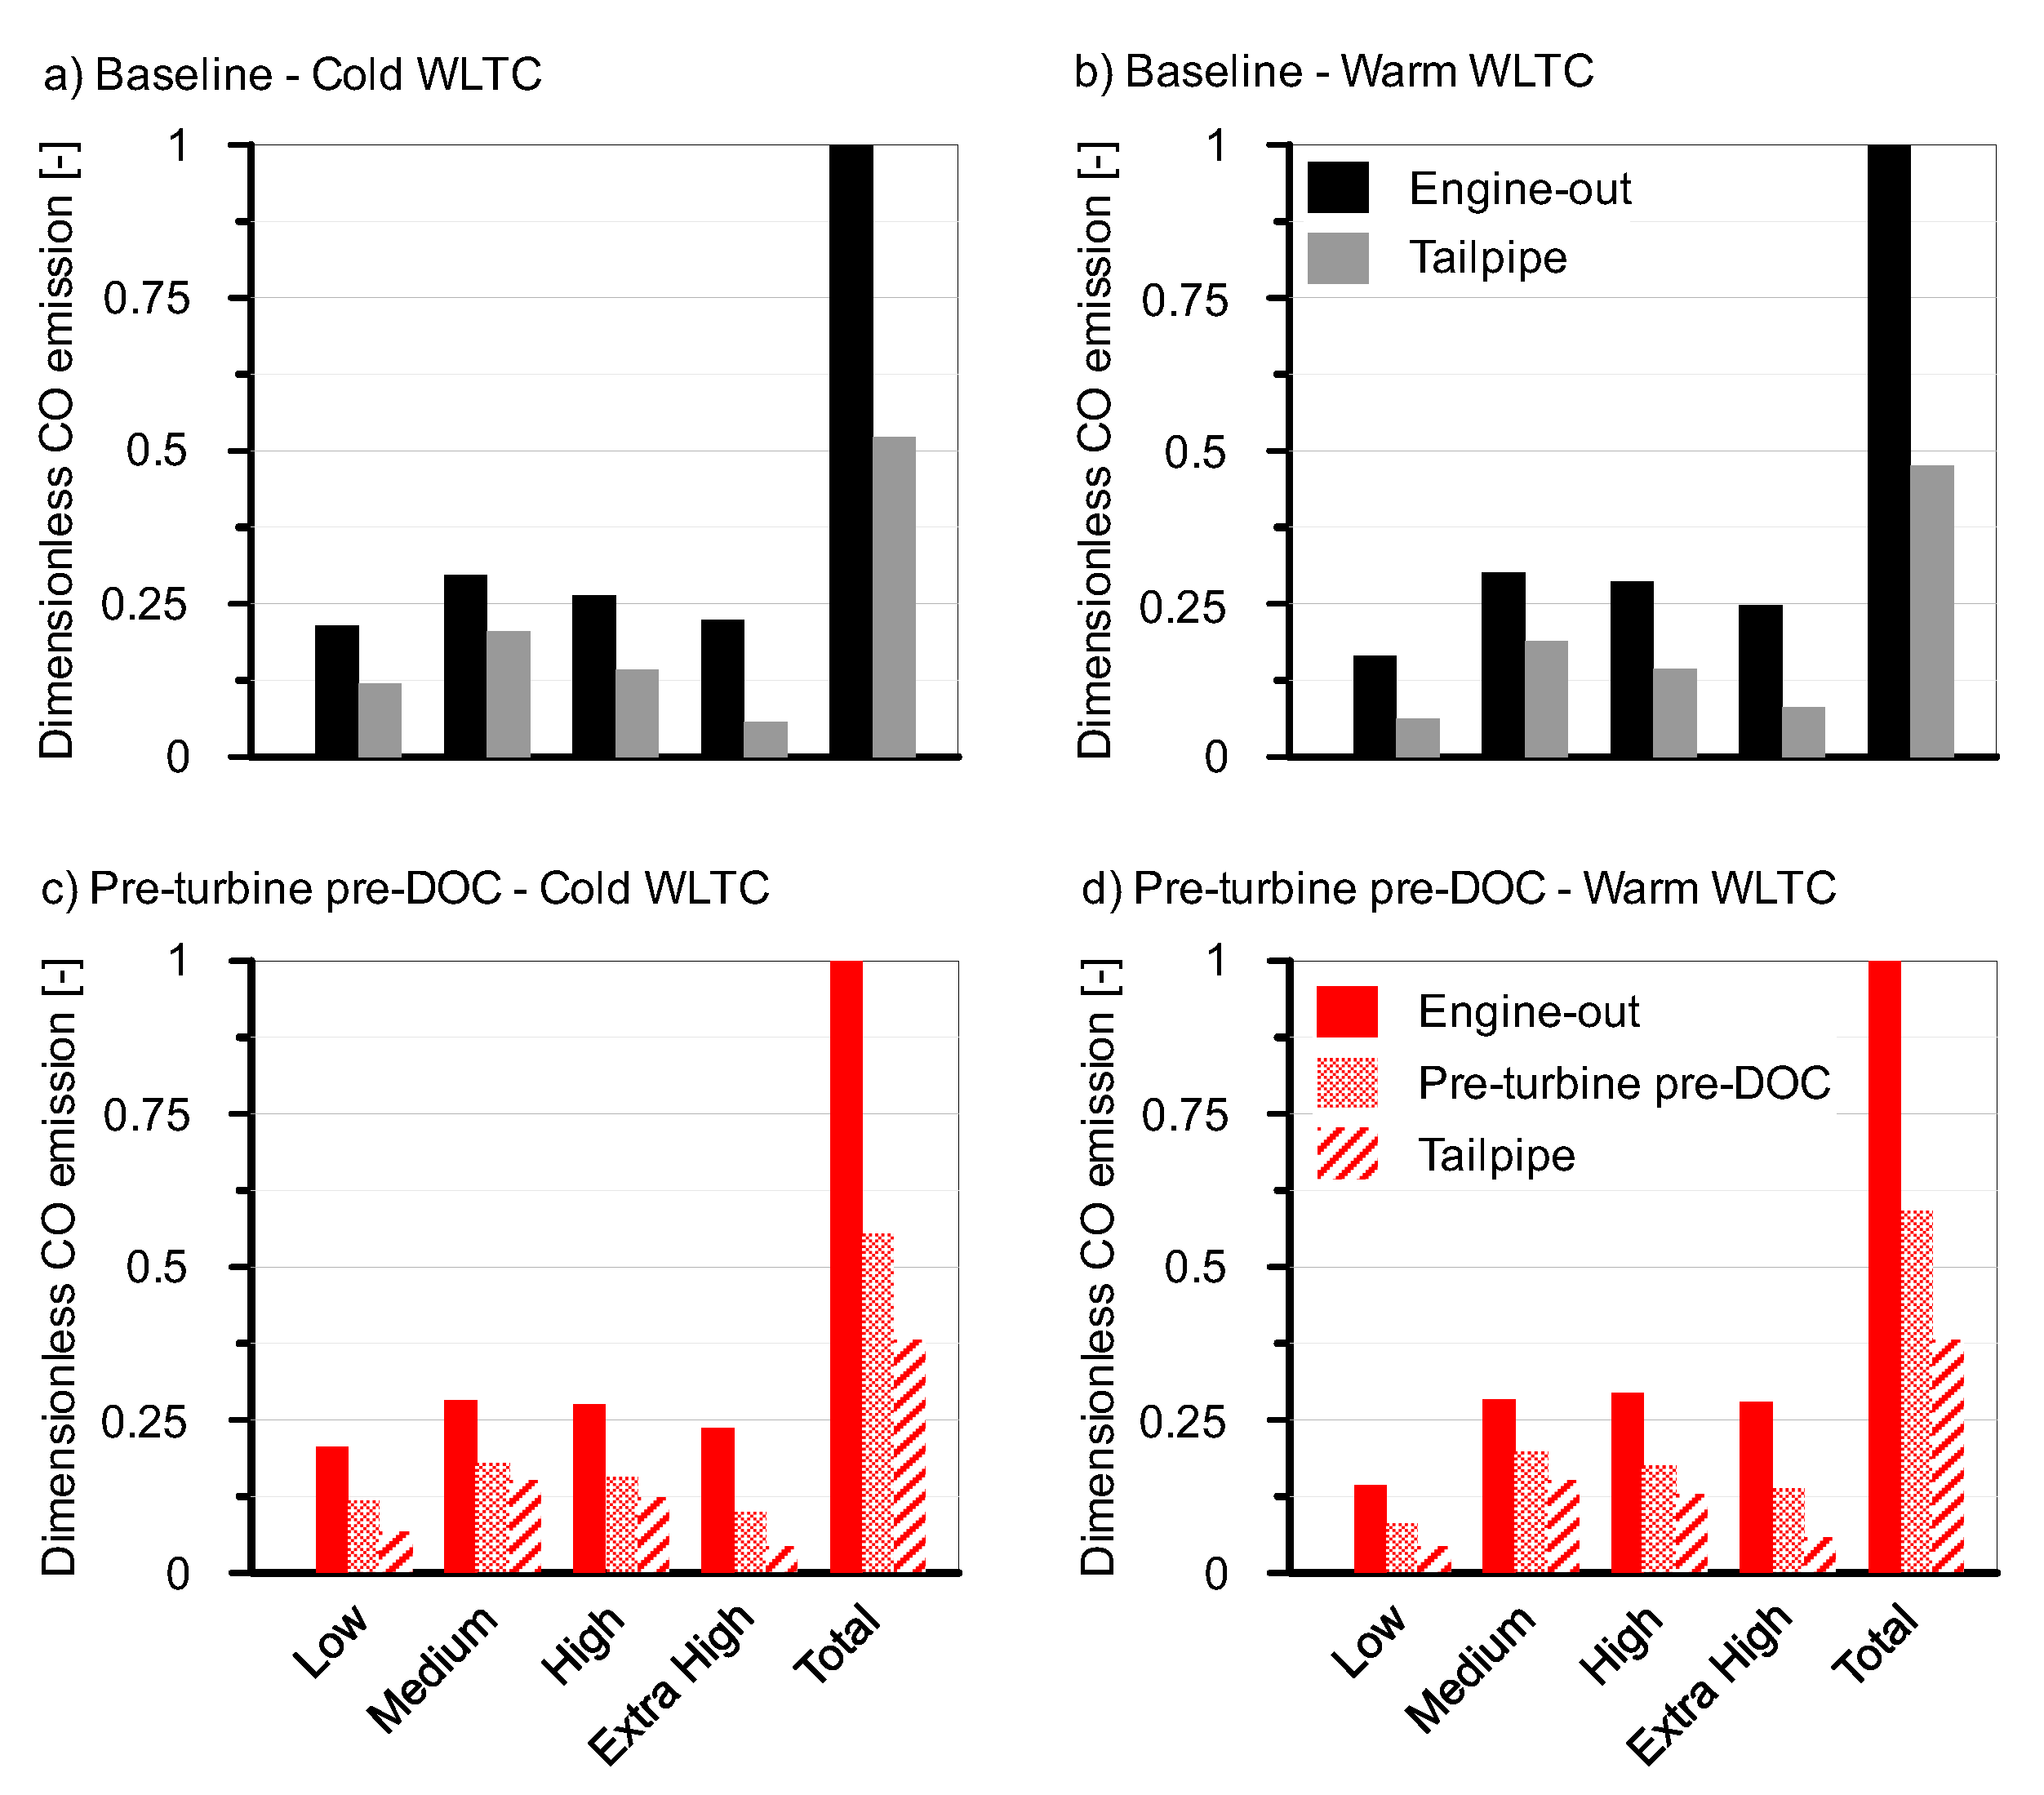
To understand better the new emission pattern,
Figure 9 shows the cumulative CO emission in the relevant locations of the exhaust line normalized against the total engine-out emission in every test. Top charts are referred to the baseline ATS configuration, distinguishing between cold and warm WLTC in plots (a) and (b) respectively. The cumulative engine-out CO emission presents almost identical distribution along the speed phases between cold and warm tests. The main discrepancies appeared in the low-speed phase, especially in cold WLTC. Nevertheless, the medium- and high-speed phases involved almost 60% of the total engine-out CO emissions due to their higher duration and concurrence of sharp engine load demands, which avoid complete in-cylinder CO oxidation. Tailpipe CO emissions showed similar pattern than engine-out ones but with more marked differences between cold and warm tests during the low-speed phase because of the faster DOC warm-up in warm WTLC. Consequently, the tailpipe CO emission reached its lowest contribution during this first cycle phase in the warm test in contrast to the cold-start case. The remainder phases showed a progressive decrease of the cumulative tailpipe CO emission from medium- to extra-high-speed phase with increasing differences with respect to the engine-out cumulative emission.
This last trend means a CO conversion efficiency increase, as depicted in
Figure 10. The black series represents the CO conversion efficiency in baseline ATS configuration (DOC). It is interesting to note that the CO conversion efficiency in the low-speed phase was not the lowest one even in cold WLTC. Despite the warm-up, the DOC inlet temperature exceeded 150
C most of time during this phase (
Figure 7), which enabled the reaching of the CO light-off. Together with the smooth accelerations during this first cycle period, i.e., lack of engine-out CO emission peaks, the result was a CO conversion efficiency of
and
for cold and warm tests. These values were higher than those reached in the medium- and high-speed phases, despite the lower DOC temperature during the low-speed phase. The reason lies on the CO emission peaks along the medium- and high-speed phases during fast acceleration because of the mass flow increase along with high CO emission. As a result, mass transfer and inhibition condition the catalyst performance [
30]. In fact, the gradual DOC temperature increase governs the recovery of the conversion efficiency till reaching its maximum in the extra-high-speed phase.
Complementary,
Figure 9c,d represent the normalized cumulative CO emission distribution for the pre-turbine pre-DOC configuration. The main trends in CO engine-out emission and abatement for the baseline case were also found with the pre-turbine pre-DOC configuration. The cumulative CO emission in every exhaust region behaved as their counterpart in the baseline ATS configuration, both in cold and warm WLTCs. The most relevant result is that the percentage tailpipe CO emission was lower than the one obtained in baseline ATS configuration in every cycle phase. A detailed analysis of the CO conversion efficiency with pre-turbine pre-DOC shown in
Figure 10 reveals that the presence of the pre-DOC enhanced the overall CO abatement throughout the cycle, especially during the low-speed phase in cold WLTC. The pre-DOC contributed with very high conversion efficiency, which was comparable to that of the DOC in baseline ATS configuration during the cold WLTC. The reason of the high pre-turbine pre-DOC reaction rate was two-fold. First, this catalyst operated at higher temperature than the DOC. In addition, the reactants partial pressure in pre-turbine location was also higher than in the DOC because of the higher gas pressure prior to the turbine. Higher CO and HC mole fraction was also found along with slightly lower
amount due to the higher equivalence ratio. Concerning the CO and HC mole fraction increase, this contribution is positive for base-level engine emissions (low mole fraction) but can turn negative during CO emission peaks related to accelerations because of the inhibition [
31]. By contrast, the DOC performance was worsened with respect to the baseline ATS configuration, in which it was dealing with all the engine-out CO emission and operated at lower temperature (
Figure 7). In fact, the DOC provided lower CO conversion efficiency than the pre-DOC when these two catalysts worked together.
The cause of this unexpected result was found in the different pattern of CO mass flow that the two catalysts must face. It is exemplified in
Figure 11, where the CO mass flow and conversion efficiency in pre-DOC (plot (a)) and DOC (plot (b)) are shown during the medium speed phase of the cold WLTC. According to
Figure 11a, the pre-DOC abated most of the base-level engine-out CO emissions, with instantaneous efficiencies ranging 60–80%. However, it was unable to deal with the CO emission peaks due to the previously mentioned mass transfer and inhibition limitations. According to this response, the CO emissions at the DOC inlet were mostly concentrated in the peaks related to the fast accelerations, as depicted in
Figure 11b. Consequently, and despite the higher instantaneous conversion efficiency against base-level emissions (80–95%) than the pre-DOC, the CO conversion efficiency of the DOC decreased with respect to the baseline ATS configuration and was even lower than the one of the pre-DOC. The dependence on the flow pattern was also demonstrated by the fact that the CO conversion efficiency was better in the DOC than in the pre-DOC during the low- and extra-high-speed phases, where the emission peaks are less prominent and frequent. By contrast, the DOC performance was minimum during the medium- and high-speed phases penalized by the high dynamics of these periods.
The results corresponding to HC conversion efficiency are shown in
Figure 12. Unlike CO case, the pre-turbine pre-DOC configuration scarcely improved the overall HC conversion efficiency, especially under warm conditions. This was due to the pre-DOC characteristics and the HC oxidation behavior. On the one hand, the pre-DOC was not coated with zeolites, so that its HC conversion efficiency during the low-speed phase was very poor, especially in cold WLTC. By contrast, the DOC showed very high HC conversion efficiency during the cold start emphasizing the importance of the adsorption mechanism. On the other hand, the small size of the pre-DOC involved additional limitations to mass transfer, which are more relevant in HC than CO because of the higher diffusion volume of species of high molecular weight [
32]. Despite the better fluid-dynamic conditions in pre-turbine location to increase the reaction rate and the advantage to face base-level HC emission first than the DOC, the pre-DOC HC conversion efficiency was almost constant along the WLTC, both cold and warm tests. In fact, a slight decrease in HC conversion efficiency was found from medium- to extra-high-speed phases due to the residence time decrease. By contrast, the higher size of the DOC allowed it to deal better with HC mass transfer limitations and took advantage of the temperature increase throughout the cycle to increase its HC conversion efficiency from medium- to extra-high-speed phases. Nevertheless, its HC conversion efficiency was damaged with respect to the baseline ATS configuration, as for CO abatement, and the benefits of the pre-DOC were partially degraded when evaluating the entire exhaust line layout.
Despite the increase in overall CO and HC conversion efficiency with pre-turbine pre-DOC configuration, the parallel increase of the engine-out CO and HC emissions canceled these improvements out.
Figure 13 shows the variation of the cumulative engine-out and tailpipe CO and HC emissions brought by the pre-turbine pre-DOC configuration in each WLTC. Even though the increase of the engine-out emissions were completely countered in low-speed phases of cold WLTC, the total cumulative tailpipe emissions increased for CO and HC. Nevertheless, there are two relevant remarks. First, the percentage penalty was always lower in tailpipe than engine-out emissions. In addition, the penalties were lower in cold conditions (
for CO and
for HC) than in warm WLTC (
for CO and
for HC) despite the similar percentage increase of engine-out emissions. These two trends confirm the potential for cold-start conversion efficiency improvement of pre-turbine ATS provided that the effects on the engine operation were minimized.
4. Conclusions
The influence of a pre-turbine pre-DOC on the engine performance and emissions has been analyzed experimentally from driving cycle tests in cold and warm conditions. The pre-DOC consisted of a small-sized metallic monolith placed at the exhaust manifold outlet and whose diameter coincided with that of the turbine inlet.
The results indicate that the addition of the pre-turbine pre-DOC had relevant effects on the engine performance and emission abatement. Although the small monolith volume avoided the turbocharger lag, the reduced cross-section generated a high pressure drop upstream of the turbine affecting the gas exchange process. The direct effect was the deterioration of the combustion leading the engine-out CO, HC and soot emissions to increase as well as a small NOx emission decrease because of the increase of internal EGR.
Concerning the engine performance, the increase in soot emission led the SCRF pressure drop to increase causing, in turn, an additional increase of the exhaust manifold pressure with respect to the baseline ATS configuration. As a result, the fuel consumption was penalized in 3.2% and 3.9% in cold and warm WLTCs, respectively.
The increase of the engine-out CO and HC emissions with respect to the baseline ATS were ranging 50% in cold and warm WTLCs. This huge increase was not able to be balance out by the presence of the pre-DOC upstream of the turbine. The CO tailpipe emissions increased by 8% and 21% in cold and warm WLTCs, respectively. In the same conditions, HC did by 24% and 37%. The tailpipe percentage increments were lower than engine-out ones because of the high pre-DOC conversion efficiency. This was promoted by the positive fluid-dynamic conditions upstream of the turbine concerning high temperature and pressure, the last increasing the partial pressure of the reactant species and, hence, the reaction rate. However, these advantages were only evident to abate base-level emissions. The pre-DOC conversion efficiency fell against engine-out emission peaks generated during fast accelerations due to the high mass transfer limitations of small-sized monoliths. The main concern of this behavior is that the close-coupled DOC also reduced its conversion efficiency compared to the baseline ATS configuration. The higher emission peaks with respect to this configuration and the low base-level emissions because of their removal by the pre-DOC compromised the DOC performance. As a result, the overall pollutants conversion efficiency was improved when using the pre-DOC but was not high enough to offset the increase in engine-out emissions.
Considering these results as a part of the literature context, the potential of pre-turbine ATS configuration to increase the pollutants conversion efficiency under driving conditions is confirmed even for very small monolith sizes. This kind of geometry is also positive to reduce the damage on the turbocharger lag, the main concern of pre-turbine ATS layouts. However, the effects on the engine fluid-dynamics and, hence, on the fuel consumption and pollutants formation, penalizes this solution with respect to full-size pre-turbine ATS approaches. These alternatives can improve further the conversion efficiency because of the inherent lower mass transfer limitations at the same time the fuel consumption is highly reduced if the wall-flow filter is placed upstream of the turbine (high reduction in engine backpressure). The high thermal inertia of the monoliths and its management based on e-turbocharger technology would remain as the main challenge to combine high pollutants conversion with fuel savings.


