1. Introduction
Swarm robotics is an approach for the coordination of multirobot systems inspired by the emerging patterns observed in social insects. In this type of robotics, we work with large groups of robots so that miniaturization and cost reduction of the units are both crucial factors. In swarm robotics, individuals do not have to be cognitive, but cognition emerges from their interactions. There are many examples of this type of behavior in nature: bees use swarms to find food sources, ants collaboratively transport food, and fireflies use these strategies for synchronization.
In the field of robotics, multiple systems have been developed based on this approach, for example, systems focused on the formation of patterns (aggregation, self-organization, deployment, coverage, mapping), search (search for a goal, homing, foraging, etc.), and group behavior (cooperative transport, shepherding, flocking, etc.).
Among these behaviors, we are interested in the development of swarm behavior for deployment in unstructured areas. The coordination of robot teams for exploration is a complex problem, even more so when facing large areas, for example, in a devastated area after a disaster [
1].
In these types of environments, unmanned aerial vehicles (UAVs) are a great advantage, given their ease of avoiding obstacles and their reduced sensory deprivation. However, these vehicles have problems with autonomy and reduced loads due to the small vehicles/weight [
2].
We are currently experiencing a time of miniaturization and cost reduction for these devices, going from drones weighing 20 g (autonomies of 10 min, with costs close to 25$ per individual) to drones that are more autonomous, weighing less than 200 g (with greater load capacity and autonomies close to 15 min with a cost of approximately 100 $).
Miniaturization and cost reduction make it possible to use swarm techniques to model systems that contain a large number of individuals. This type of device satisfies the precepts of swarm robotics: simple individuals, with limited sensors and limited autonomy but with the possibility of having a large group to take advantage of their great mobility.
Therefore, it seems logical to propose the design of a behavior, oriented to UAVs, that enables the development of tasks in difficult, unstructured environments, with both signal availability and communication limitations. In addition, this behavior must take the limitations of the individual agents into consideration (e.g., the load capacity of micro-drones is on the order of 5 g, which means that the sensors that can be used in these devices are very limited).
In this article, two deployment behaviors for unstructured environments will be presented. These are distributed, decentralized, scalable behaviors that do not require global localization (and therefore are applicable to indoor environments). Both will be based on one of the most important indirect mechanisms of decentralized communication in swarm intelligence, stigmergy.
In stigmergy, information is stored in the environment, which makes it possible to coordinate agents. This type of communication has several advantages that make it especially attractive for swarm systems: it is simple, scalable, and robust and can be integrated with the environment. However, stigmergy is also one of the most complex communication systems to be implemented in real robots. Taking this aspect into account, in this work, we will consider two different stigmergy approaches without losing sight of what characteristics would be required for final implementation.
The first behavior is oriented to swarms with individuals with very limited perception capacities who are not able to locate themselves locally. Therefore, this behavior will not require localization capabilities of any kind and will require the local communication of only minimal information. Our intention is that this behavior will be easy implementable with existing hardware. The second behavior will require local localization capability, providing a greater convergence but requiring a sensor, such as the one presented in [
3] or more generally in [
4], to support localization.
With this article, we wish to answer mainly the following questions: can we develop a swarm behavior that uses stigmergy without the need to design specific hardware? How does the information available to agents affect the development of the behavior? How does the number of parallel agents influence the task? Does the energy consumed by the swarm depend on the sensor/emitter of stigmergy?
The rest of this article will be structured as follows. On the one hand, the state-of-the-art will be presented, with an exhaustive analysis of the existing deployment strategies. Special emphasis will be placed on those strategies that consider the special characteristics of UAVs. Next, we will describe in greater detail the problem of deployment in unstructured environments to be modeled, together with the type of swarm and individuals to be used. The simulator used and the metrics that will be used later will also be detailed. Subsequently, the two microscopic swarm behaviors will be presented, along with a description of their functioning and the roles of the individuals that compose them. In the results section, a set of tests will be developed to verify the behaviors and to compare both strategies for the aggregation of individuals and their operation in different types of environments (simple, complex, and hard-to-access areas). Finally, the results will be discussed, and the article will be concluded by proposing potential future lines of research.
2. Related Work
Multirobot deployment has become a fundamental research topic in the field of multirobot systems. In this section, we will provide a brief review of the existing types of swarm deployment and coverage of terrestrial robots. Then, we will review some applications designed to be executed using aerial vehicles and comment on some examples of stigmergy communication in swarm systems.
Although many applications are related to multirobot deployment, many of them rely on a preestablished communication network or external localization service. This precludes application to emergency tasks, where we are not able to assume the existence of communication networks or GPS. Therefore, there are several studies where the external communication network is substituted by the deployment of a new network of sensor nodes or radio beacons. For example, in [
5] uses a distributed algorithm to guide a group of robots through a network of sensors, in [
6] defines an artificial pheromone map which consists of arbitrary graph of special devices called “place agents”. However, this and other similar strategies, such as [
7], define the prior deployment of the sensor network, which may be difficult or not practical in emergency situations.
Another alternative is to include the deployment process in the behavior. In this case, the behavior consists of two phases: beacon deployment and robot deployment. [
8] deploys a network of static radio beacons to form a long-range communication network to aid robot exploration. However, in a general way, this strategy cannot be used with micro or small-sized UAVs (the most commonly used type of UAVs in indoor environments) because of their low load capacity and limited autonomy [
9].
In [
10,
11], a different strategy is presented, where each individual integrates a beacon, creating their own communications network. However, the design of this behavior is intended for the physical characteristics of terrestrial robots s-bot, which makes it very difficult to generalize to other types of vehicles due to their different types of sensors and actuators.
In our case, we are interested in developing behavior that uses the advantages of indoor flying vehicles, rather than terrestrial ones, in emergency situations. For example, these vehicles can avoid many obstacles that limit ground vehicles and enable sensor data to be obtained from a vantage point [
12,
13,
14,
15,
16].
This type of device requires specific considerations and algorithms to ensure navigability [
4,
17]. In outdoor UAVs, GPS, which can be adjusted by using onboard inertial sensors, is the most common localization system. For example, in [
18], stigmergy is used in a behavior to search for a target. This behavior requires all the agents to use global location to be able to perceive and place virtual pheromones in a specific location.
However, such systems cannot be used indoors (signal reception occlusion) or in all outdoor locations and situations [
19], so another approximation, such as local localization, must be considered.
Robot local localization commonly requires environment maps and odometry sensing [
20]. Environment maps may be unavailable, and the online creation of maps requires powerful processing that may not be available on small flying robots [
4,
21]. Furthermore, such approaches do not scale appropriately with large swarms [
22]. Moreover, there are simple relative localization applications that are suitable for small UAVs; for example, in [
23] presents the relative positioning of sensors in reference to nearby static robots with a decentralized approach. Nowadays, one of the main technologies required to make the leap from flying a single UAV to flying a decentralized swarm is an accurate and reliable intra-swarm relative localization technology [
4].
One of the first applications related to UAV deployment can be found in [
24]. This application uses a predetermined communication network as the basis for guiding UAVs. Although this behavior does not require an external communications network, it does need a predeployment phase, as in the terrestrial application in [
5], which is not applicable in real emergency situations. In a later work, in [
25] reconfigures the network of sensors to maximize system performance, but the method requires a group of terrestrial robots to transport the sensor network, which is not practical for our needs.
More recently, ref. [
23,
26,
27] present several behaviors where a fully distributed deployment is achieved while creating a communication network. These systems do not require existing communication networks or a global localization system. In addition, it is an effective strategy that is designed to save energy when using UAVs, which is very important for increasing swarm autonomy. in [
23,
27] assume that a robot can temporarily attach to the ceiling or land on the ground for efficient surveillance over extended periods of time. However, as the authors discuss, this behavior requires special environment features (straight walls, 90 degree angles, etc.) to be executed (it is not applicable for unstructured environments) and does not take into account uncertainty (for example, the errors in sensor readings and robot actuators), which is very important in UAVs systems.
Using the ideas presented in [
23,
26,
27,
28,
29], a UAV swarm can establish their own communications network. This network can be used for communicating swarm tasks or even to help other robots or a human team with subsequent work [
5,
10,
11,
24,
30,
31].
In this paper, we will present a behavior inspired by the work of [
28], in terms of establishing their own network of communications, and by [
23,
27], in terms of adapting the behavior to UAVs using a power saving state. However, in contrast to previous articles, our distributed behavior will be executable in any environment, without limitations on the specific features or size.
For this purpose, a virtual sematectonic stigmergy system will be used. The use of this type of communication is not novel in the field of swarm robotics; the literature contains several applications using stigmergy as a communication mechanism. In [
32], swarm behavior that can develop collaborative tasks through sematectonic stigmergy is presented. ref. [
33] discusses a theoretical approach to the use of stigmergy in UAVs using stigmergy potential fields. To implement this type of communication, it is assumed that we have a local positioning mechanism [
4] and a efficient system of communication between individuals, for example, the use of mesh networks of XBEEs devices [
34].
We want to highlight that the probabilistic microscopic model and the stigmergy system that will be presented here take into account the inherent uncertainty of real robotic systems, which is not considered in other approaches that assume ideal worlds, such as [
23,
27,
29].
3. Methods
This section will initially detail the swarm on which the deployment task is planned. Details of the types of base vehicles and the swarm simulator developed for this work will also be presented. Additionally, the process of generating unstructured environments using a cellular automaton will be described briefly. The two stigmergy-based swarm behaviors for deployment tasks will be described in detail.
Stigmergy provides an indirect means of communication between individuals through the environment. There are several types of stigmergy depending on how the communication is achieved. If communication is established through the placement of markers in the environment, we call the approach marker-based stigmergy. If individuals base their actions on the state of the solution, we refer to the approach as sematectonic stigmergy. If we work with discrete signals, we refer to strategy as qualitative stigmergy. On the other hand, if the communicated signals are continuous, we refer to the approach as quantitative stigmergy.
In the first behavior, an approximation of quantitative sematectonic stigmergy will be presented. In this case, some individuals will be deposited in areas of the environment and used as the main elements in the communication of pheromones; that is, the individuals themselves are defined as active markers of the environment.
The second behavior will use a hybrid of sematectonic, marker-based, and quantitative stigmergy. In this case, a group of individuals will be deposited as markers, but these markers will form a local gradient that will indicate the direction of navigation. The gradient of a pheromone map is managed by this same group of individuals.
3.1. Description of the Swarm
3.1.1. The Individuals
As discussed above, our work will focus on the use of pheromones to design various swarm behaviors capable of performing a deployment task in a structured environment. We will use a swarm robotics simulator, which we will detail later, to assess and validate these behaviors. We design a plausible physical swarm close to our physical robots. Then, we will describe the two types of individuals that will be modeled in our simulator.
We will focus on two types of UAVs, which we will call micro informed (micro) and mini informed (mini), depending on the information and, therefore, the sensorization available to them. We consider vehicles that do not exceed 200 g and that range in size from 6 cm to a maximum of 25 cm. We will assume that the linear speeds they can achieve for safe indoor navigation do not exceed 1 m/s. Both types of drones have a flight control board that allows simple movement commands to be sent to the drone for later execution.
The input commands may be high level (rotate 90°, advance 1 m), similar to those used by the current consumer drones (
https://www.parrot.com/,
https://www.dji.com/). To simplify the interface, we will assume that we can send a displacement vector to the drones with the information of the movement to be performed at a given moment and that the control board will adjust the state of the drone according to this information.
Both types of drones use the same set of basic sensors. They will have IMU inertial unit data and a digital compass to obtain their orientation relative to north. These sensors are widely used and integrated by default in most control boards and commercial systems. In addition, the microdrones will have a barometric sensor (which makes it easy to stabilize the flight height), and the mini drones will have an ultrasound system in addition to the barometric system, for low-altitude flight. The mini drones also have a GPS tracking system, although it will not be used in this work since we intend to verify the behaviors presented here in indoor environments or where the GPS signal is not reliable.
We also require the drones to be able to avoid indoor obstacles. We will assume that they have one of the many currently available avoidance systems, although due to the size of the devices the most appropriate system is visual navigation. We do not require high accuracy since we need only a repulsion vector to the area in the visual field of the drone that contains more obstacles.
The drones can perform detection among themselves by using BLE beacons and know if they are near, far or out of range (for example, using the protocol established by Apple ibeacons (
https://developer.apple.com/ibeacon/). If they are close and in the field of vision, the obstacle avoidance system will return a repulsion vector toward the position of the detected drone. The microdrones will not have a relative location system, but the minidrones will. We will assume that they use a system similar to [
3] that allows them to be located in the near space. The Bluetooth technology used for the location will also be used for short-range communications among drones. The autonomy of the drones will be fixed at 15 min of continuous flight. However, as will be discussed later, autonomy increases considerably if other tasks that save the energy consumed by the engines are performed.
As will be seen later, the proposed pheromone system can be implemented directly with the drones described above without any additional sensors.
3.1.2. The Swarm
The proposed drones are characterized by their simplicity and low cost, which limits the type of sensors to be used but makes it possible to use large swarms. With a cost of less than $20 per individual in the case of micro drones, we can raise swarms of hundreds of agents. The behaviors that follow will have this philosophy: with a system of many drones of very low cost, a collision not only does not hinder the achievement of the desired behavior, but can actually help, as we will see later.
Given the simplicity of the individuals, we will not have sensors for the concentration of individuals, such as those proposed in [
27]. However, we assume that we can perform multipoint communications, such as can be achieved with the devices presented in [
34]. These communications could be used indirectly to determine the concentration or, as in the case of this article, to articulate a virtual evaporation system, as required by the pheromone system presented below.
The behaviors that we will see below do not allow redeployment since, given the characteristics of the swarm enumerated previously, it does not contribute substantially to the development. However, it could be added in the future without much difficulty (if the autonomy of the drones and a limited number of them require such an addition). Therefore, the swarm coverage metric will be determined as the area currently seen by the drones, given their position. We will assume that they have a sensor that allows them to see a concentric area centered on their position.
Our intention is to be able to use this behavior to inspect unstructured indoor areas that are difficult to access, such as buildings after a disaster and caves. We will therefore assume that all drones will be launched from the same position: the main (possibly only) entrance.
To verify the operation of the swarm depending on the developed behavior, we will use additional metrics. We will analyze the total flight time of the swarm and the time required to perform deployment, and we will verify the average number of collisions (both between drones and between drones and the environment). Finally, as mentioned in [
27,
29], in this type of vehicle, it is essential to consider the energy required by the swarm. We will therefore analyze the average energy consumed by the swarm to complete deployment in an environment.
3.1.3. Simulator and Environments
In swarm robotics, it is essential to develop an exhaustive analysis of the simulated behavior before real implementation of the system. This article focuses on this analysis, although we have attempted to not leave out how this physical concretion would work.
Hundreds of simulations have been developed to test behaviors, so we require a fast simulator to be able to test hundreds of agents in a multitude of environments. Therefore, we use our simulator, called Multi Agent Swarm simulator in SCAla (MASCA) for the development of the tests. This simulator is briefly described below.
MASCA is based on the MASON platform [
35], which is a multiagent simulation platform that can simulate any type of process. MASON provides facilities for simulations in text mode, 2D and 3D. It has a multitude of simulation-oriented data structures that are optimally developed in terms of access times to allow ultra-fast simulations. We have developed MASCA on this platform. Our aim was to provide a system capable of rapidly simulating swarms with thousands of individuals. We therefore want to focus on simulating the emergency process closest to swarm intelligence, where interaction and simulation with large swarms is fundamental. This is not often the goal of simulators, where there are marked limitations on the number of agents and the size of environments that can be simulated [
35]. The next step (when we know that the proposed global behavior works as expected), which is beyond the scope of this article, focuses on the control, performing a more realistic physical simulation (dynamics of fluids, trajectories and 3D collisions), with a much more limited number of individuals. This simulation is performed prior to the implementation of behaviors and adjustment in physical robots.
MASCA enables the modeling of a range sensors, cameras, pheromone sensors, compasses, local and global location sensors, and several types of actuators. In our concrete case, we have worked with holonomic actuators for multirotor type vehicles. This simulator also makes it possible to use both local and global communication.
Using SCALA as a base language, we provide a functional interface to the system that enables the parallelization of a multitude of tasks in a secure manner. Due to speed issues, we use 2D physics for our simulations and assume that robots are able to maintain themselves constantly in a plane. This ability is not a problem for current micro or minidrones since barometric and ultrasonic sensors are available to measure their height relative to the ground, and the flight controller itself is responsible for stabilizing the height. Although the base physics is 2D, the simulator supports a 3D environment for flight and is able to develop routes at different heights without interfering with the collision calculations.
One of the advantages of our MASCA simulator is the ability to use any image as the basis for a navigation map, which allows us to easily design hundreds of maps for different test environments. In our specific case, we are interested in working with unstructured environments, so the first step is to generate these environments. We have developed a system based on cellular automatons that generate environments with these characteristics and that allows us to conduct our simulations in a great diversity of environments.
The operation is simple and is based on the idea, often used in video games, of how to generate “coherent” caves in a random way. The idea is to start from an initial random map (where each cell can be occupied or free) and iterate from the initial map via some simple rules, for example, a tile becomes a wall if it was empty and if more than of its immediate neighbors were walls, or becames empty if it was a wall and less than of its immediate neighbors were walls. Each iteration makes each tile more uniform, and the entropy of the environment is gradually reduced. The fundamental advantages of this type of generation are that practically all the levels generated are different. This is a very simple strategy to implement, and the results, as will be seen later, are realistic.
More specifically, the function used to generate all these environments is presented in Algorithm 1. Initially, function
RandomMapWithEmptyCells generates a random map where
of the total cells will be empty. Once the random map has been generated, we apply the rule of the cellular automaton through the procedure
ApplyCellularAutomataRule for each map cell. Furthermore, we must adapt the map with
JoinCaves so that the different generated areas are connected to each other and a dilatation process with a
Disk of size
D to produce more uniform environments.
Figure 1 presents a group of maps generated with this algorithm.
| Algorithm 1 Unestructured Environment Generator |
- 1:
functionGenerateEnvironment() - 2:
RandomMapWithEmptyCells (, ) - 3:
SetBorders (M) - 4:
for each in M do - 5:
ApplyCellularAutomataRule () - 6:
end for - 7:
JoinCaves (M) - 8:
Dilation (M, Disk(D)) - 9:
SetBorders (M) - 10:
return M - 11:
end function - 12:
procedureApplyCellularAutomataRule() - 13:
GetNeighborhoodSquare () - 14:
if AdjacentWall(S) then - 15:
- 16:
end if - 17:
if AdjacentWall(S) then - 18:
Wall - 19:
end if - 20:
end procedure
|
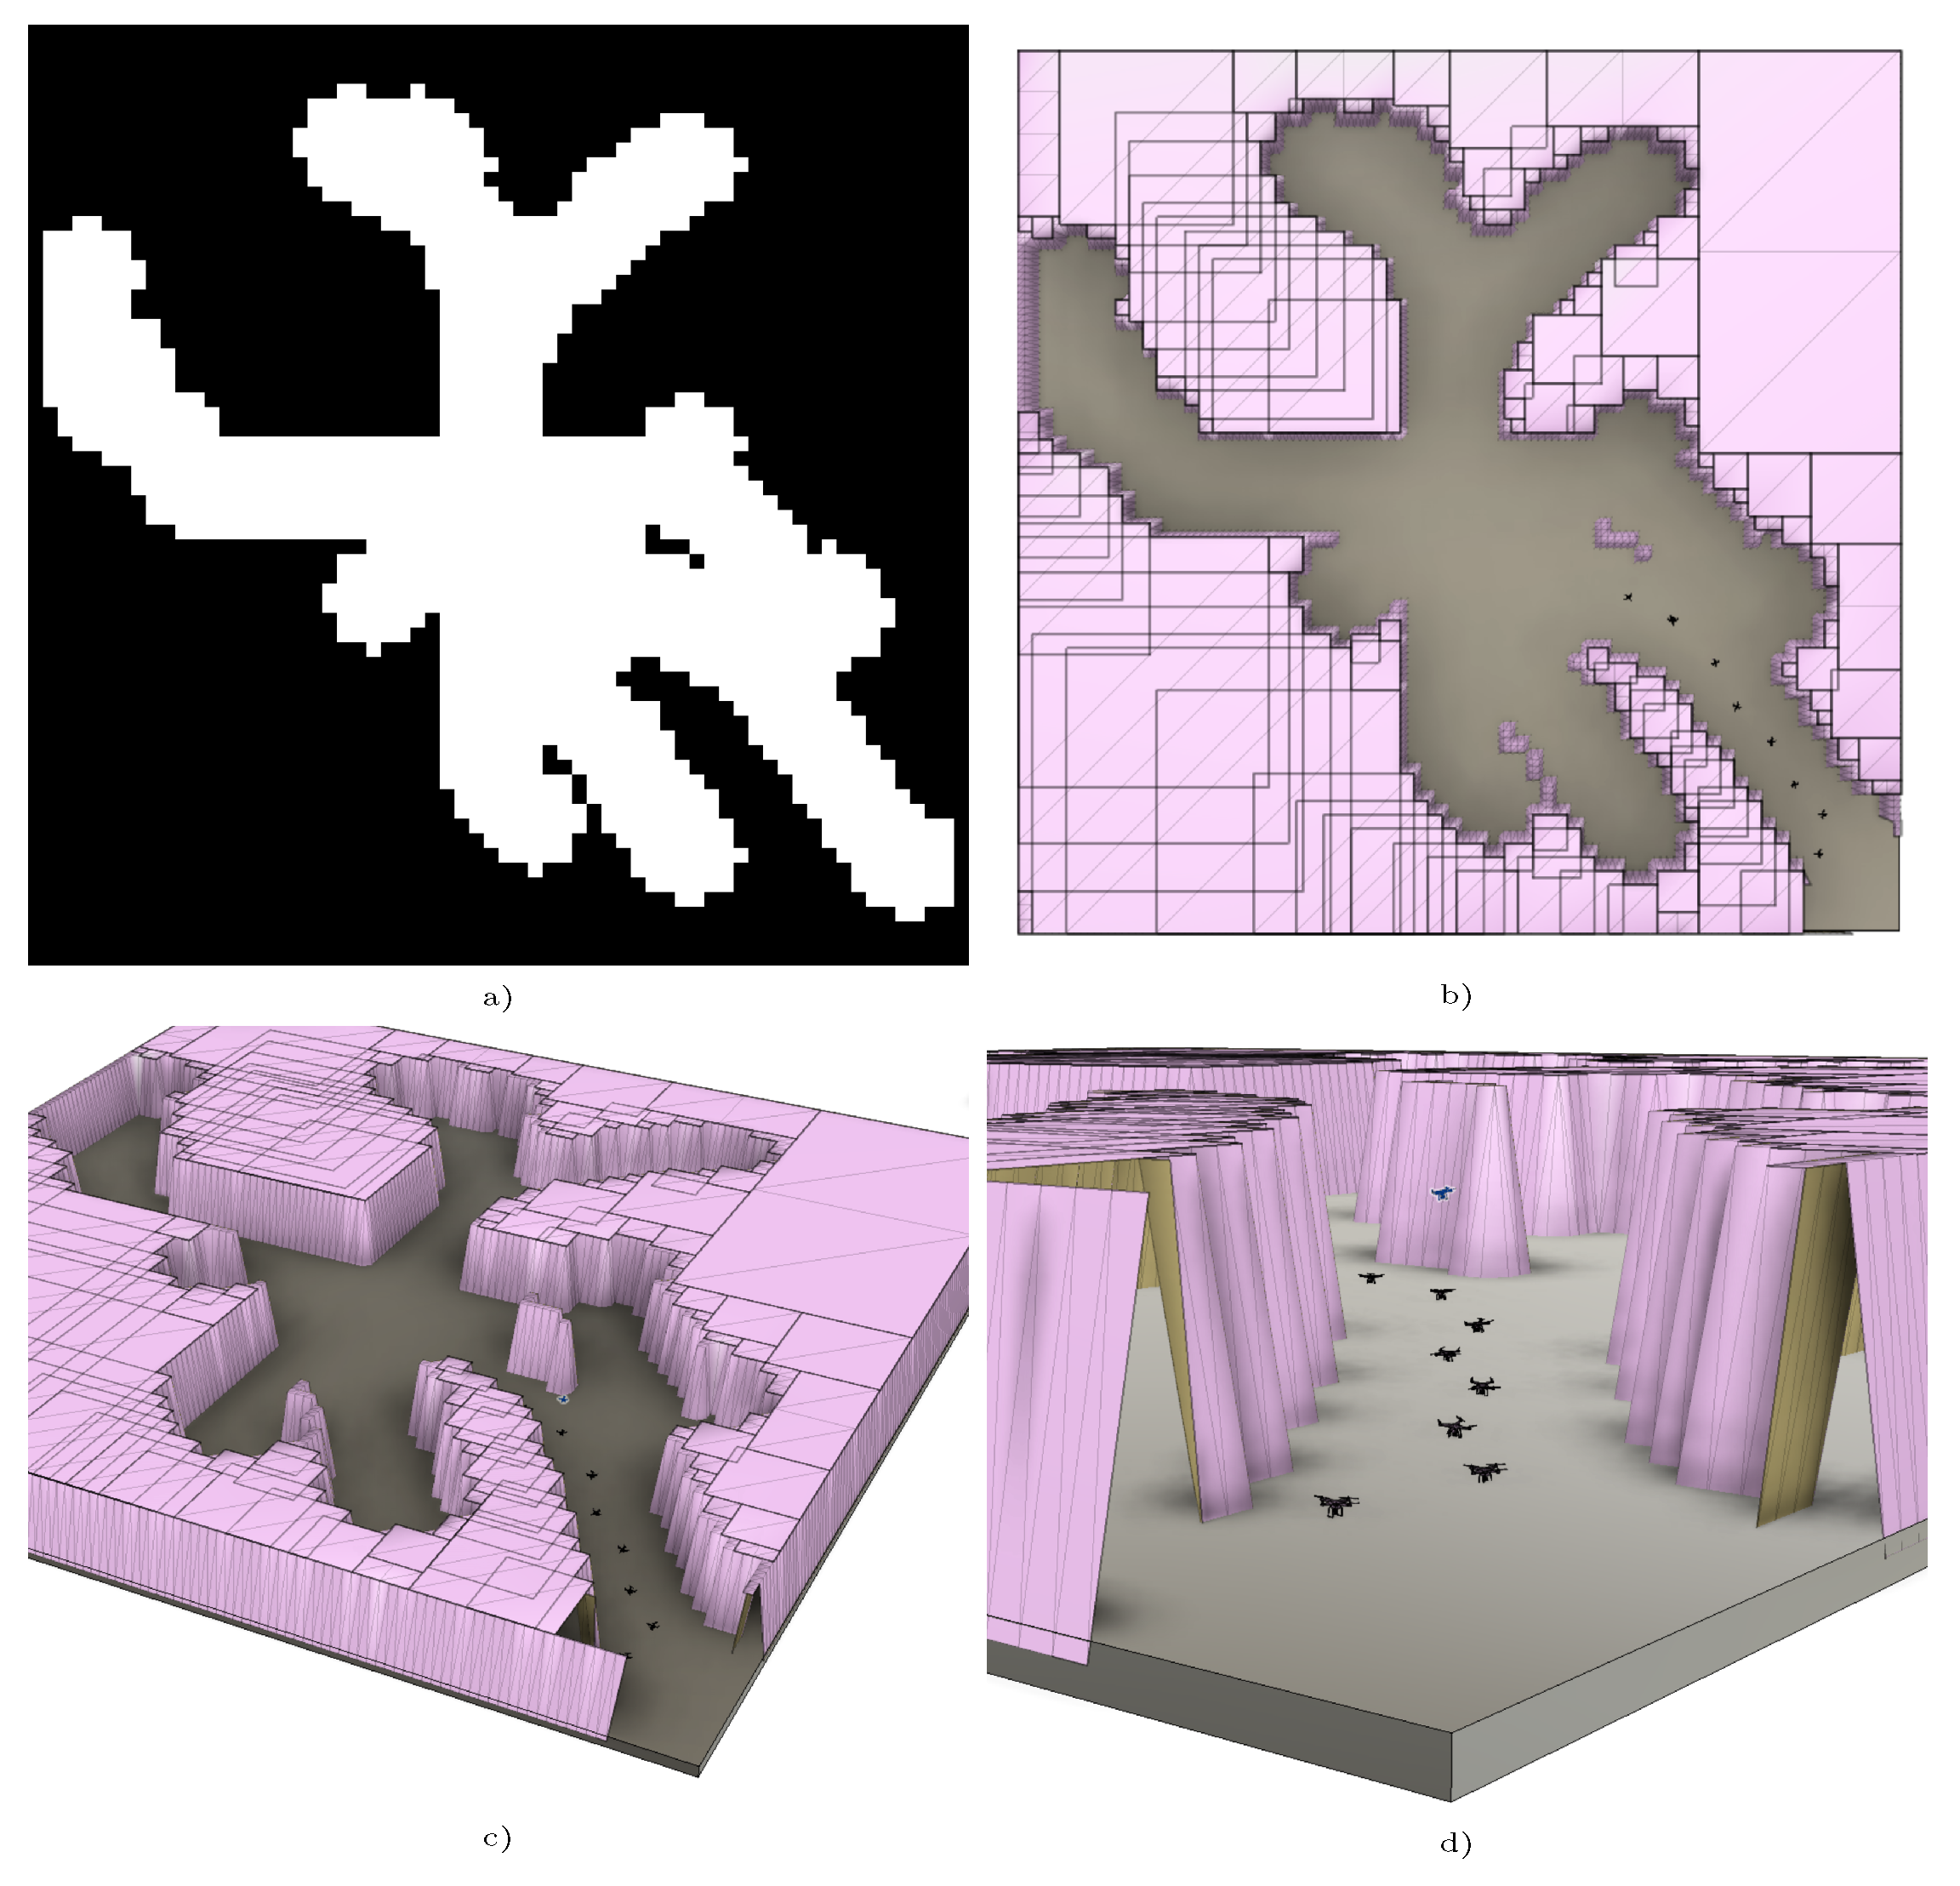
Finally, once a map has been generated, it is used with our physical simulator to develop the simulation tasks required to thoroughly test our proposed behaviors. In
Figure 2, an example of a map and its 3D visualization, together with the first steps of a deployment behavior, are presented.
3.2. Slant Beacon Deployment (SLABE)
3.2.1. Behavior Description
Quantitative marker-based stigmergy is the most common choice in designing swarm intelligence systems. Its simplicity, scalability, robustness, and integration with the environment make it an ideal mechanism for communication in this type of system. However, the main difficulty is the lack of functional systems that allow it to be implemented in real environments.
Sematectonic stigmergy has the advantage in this sense because it does not require any external elements to be returned for communication: the same individuals may be deposited in the environment to communicate. In nature, we can see several examples, such as ant cemetery clustering and wasp nest construction.
Slant beacon deployment (SLABE) behavior aims to cover an unstructured and a priori complex environment. It assumes the existence of a sufficiently large set of simple individuals that can cover the environment without redeployment. As in [
27], we propose the existence of two distinct states of energy consumption. In UAVs, the highest consumption is established in flight, so this energy consumption must be correctly modeled to increase the autonomy of these aircraft, which is a priori very limited. As mentioned above, an initial launch area from which all drones will take off and will be defined. The first drone will be placed in the immediate neighborhood of the launch area and will go into the
beacon state (also called
repeater). Then, a new drone will take off and travel, simply avoiding obstacles, through the interior of the area to be explored. As soon as it detects that it is near the limit of the communication safety zone, it will stop the flight and return to the
beacon status. This process will be repeated until the environment is fully covered.
The role of beacon (repeater) drones is to recommend “the best address” they have observed so far to all active drones that pass by. To do this, they will ask the drones to pass through their immediate vicinity in the direction they were heading just before leaving their area of influence. This direction will be absolute and obtained from the compass of the vehicles. The drones that do not pass through other vehicle again will be assumed to have managed to reach remote areas in the direction they took as they passed through this particular beacon. However, the directions recommended by the drones that repeatedly pass near the beacon should not be considered with the same importance since they do not lead to the vehicle moving away from the drone’s zone of influence. There will also be a mechanism for local communication between the beacons to prioritize promising paths, but this will be described later.
The active drones will navigate while considering several factors, including the obstacles in the environment and the proximity to other active vehicles with which they can coexist at any given moment.They will also take into account the recommendations made by beacon drones.
This behavior does not require local localization, which makes it especially suitable for implementation with microdrones. In addition, the stigmergy used does not require any sensors that are not currently available: we simply need to determine whether a vehicle is in a certain range of action. For example, the iBeacons protocol provides the necessary technical requirements to implement this behavior. This makes it possible to detect the location of two devices in a discreet way (far, near, immediate) with sufficient accuracy, in addition to obtaining the RSSI signal strength.
3.2.2. Deployment Strategies
The previous behavior has not detailed how the robots will be introduced into the environment. We know that the deployment process will be conducted at a single point from which the vehicles will be introduced progressively. However, there are several criteria for deciding when to introduce a new individual into the system.
A detailed analysis of various deployment methods is presented in [
27]. In this case, three main types of strategies are analyzed. Initially, the robots can be introduced one by one in a fixed interval of time, which is known as linear-temporal incremental deployment (LTID). This strategy does not consider whether there are drones in the active state, so we may find that time is wasted in the unexplored state. The single incremental deployment (SID) strategy verifies that no robot is active in the system and then adds a new robot. However, in this case, we find that only one robot is active in the system, which can penalize the deployment process in large environments. The latest strategy presented in this paper, adaptive group size (AGS), adds new robots to the environment on the basis of the density of robots in the environment. To implement this strategy, a sensor is required to estimate the density.
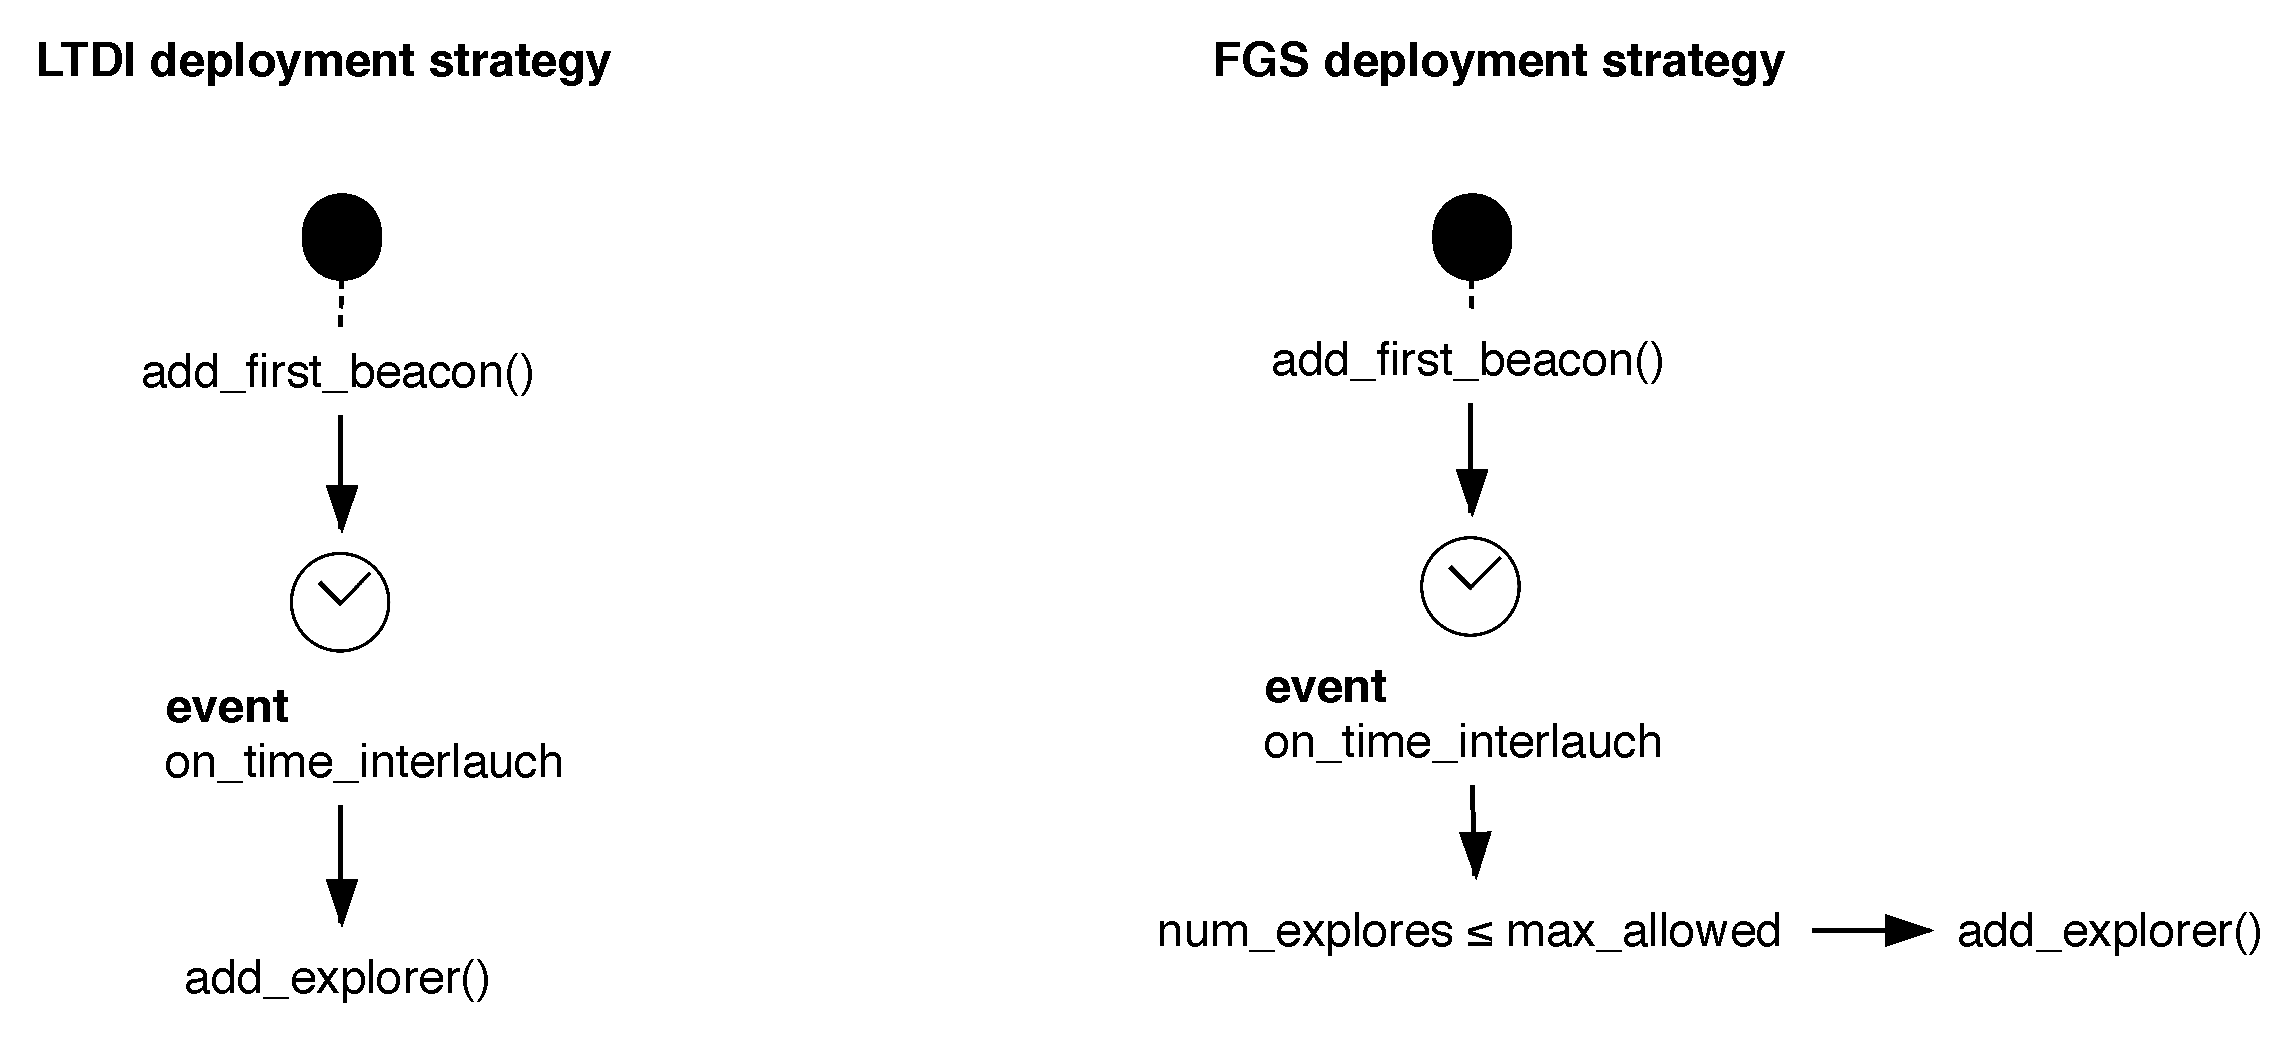
In our work, we will use two types of strategy presented in
Figure 3. On the one hand, we will test the behaviors with LTID deployment. This type of deployment has the advantage of reducing the probability of collision between individuals if the time between deployments is adjusted appropriately, or of prioritizing a parallel search for shorter intervals. This is a simple strategy to implement and requires no special hardware, making it applicable to any type of drone.
We do not consider the SID strategy since it does not allow more than one active robot at a time, preventing a parallel deployment of the swarm. The AGS deployment requires specific sensors for its implementation, so we propose a hybrid strategy of SID and AGS, which we call fixed group incremental deployment (FGID).
The FGID strategy allows the existence of multiple active drones in the system, as the SID strategy does, i.e., instead of a single UAV, several can coexist simultaneously. This allows us to substantially improve the time required for a SID strategy by working with groups of active robots, just as an AGS strategy would allow. However, it requires the choice of group size for a given environment, at the expense of not requiring any vehicle density sensors. In fact, given this strategy, it is easy to see that both LTID and SID are special cases of the same strategy: in SID, the maximum number of drones that can coexist is equal to one, and in LTID, it is equal to the number of drones available.
3.2.3. Role Description
This section will detail the behavior of slant beacon deployment (SLABE) and the roles required to develop it. Initially, the role of active robots, which are responsible for the reconnaissance phase of the environment, will be described to review the role of repeaters or beacon robots, which are mainly responsible for providing the communication and stigmergy mechanisms required by the swarm.
Active
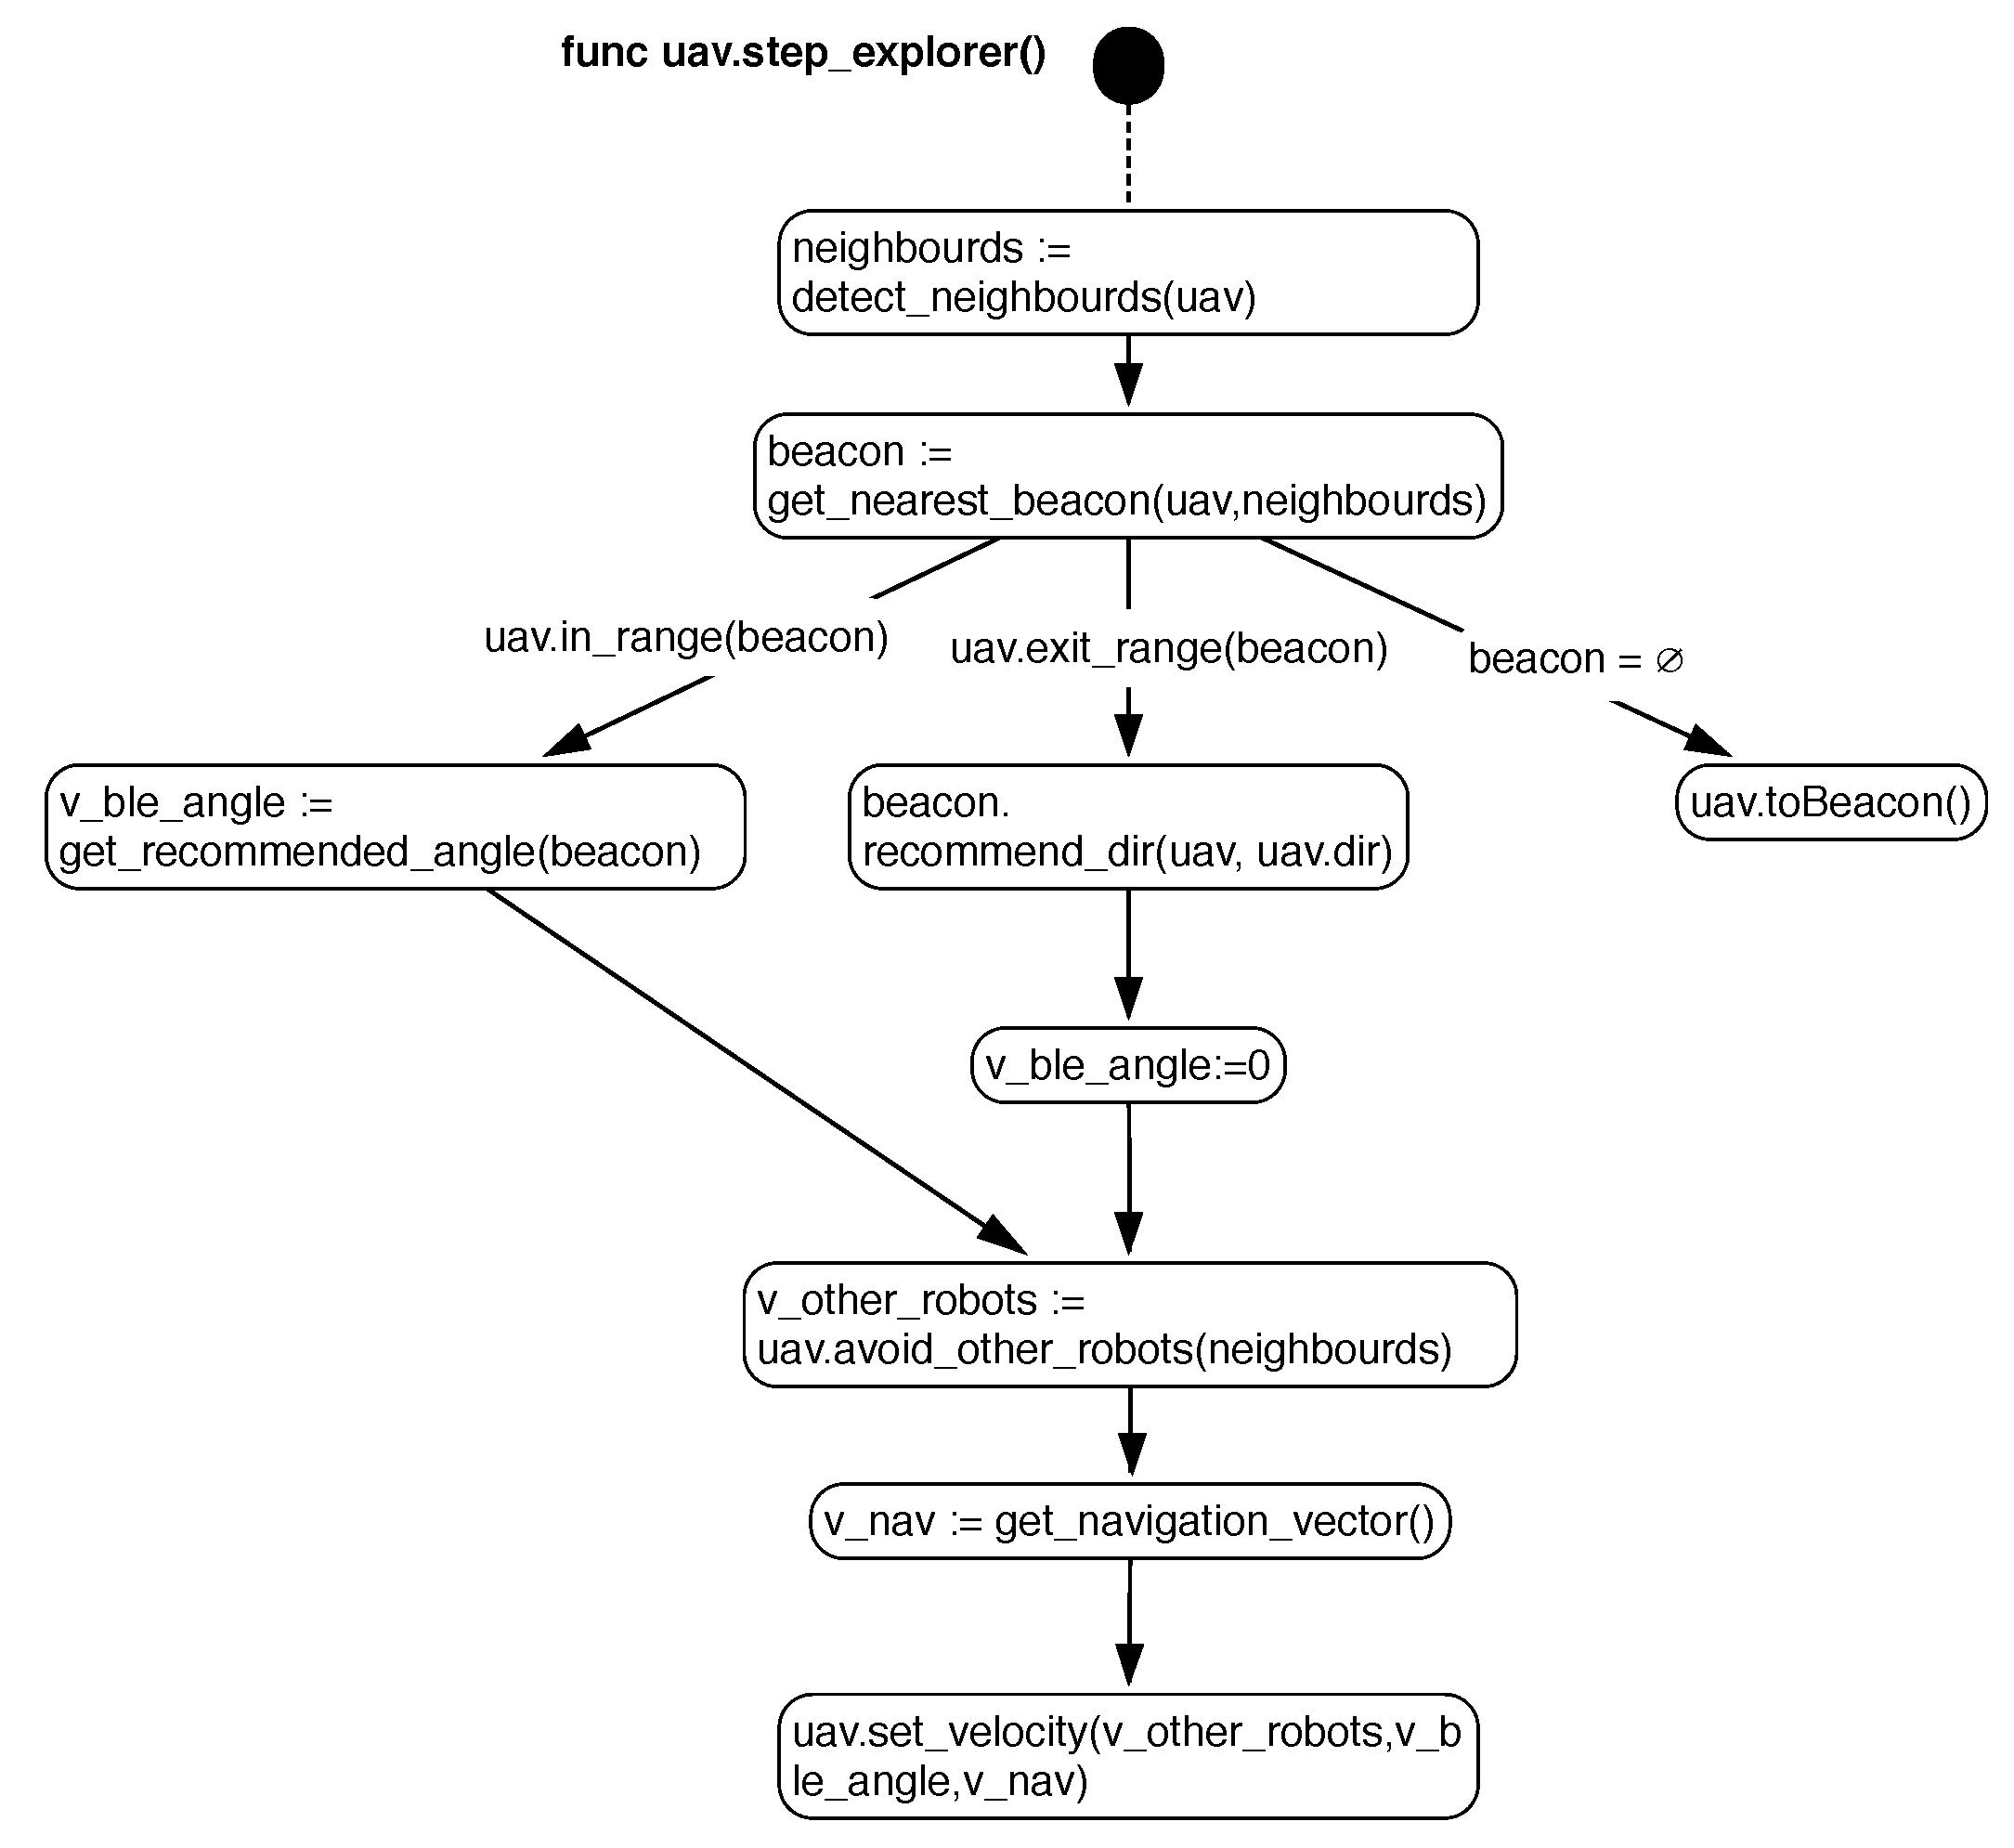
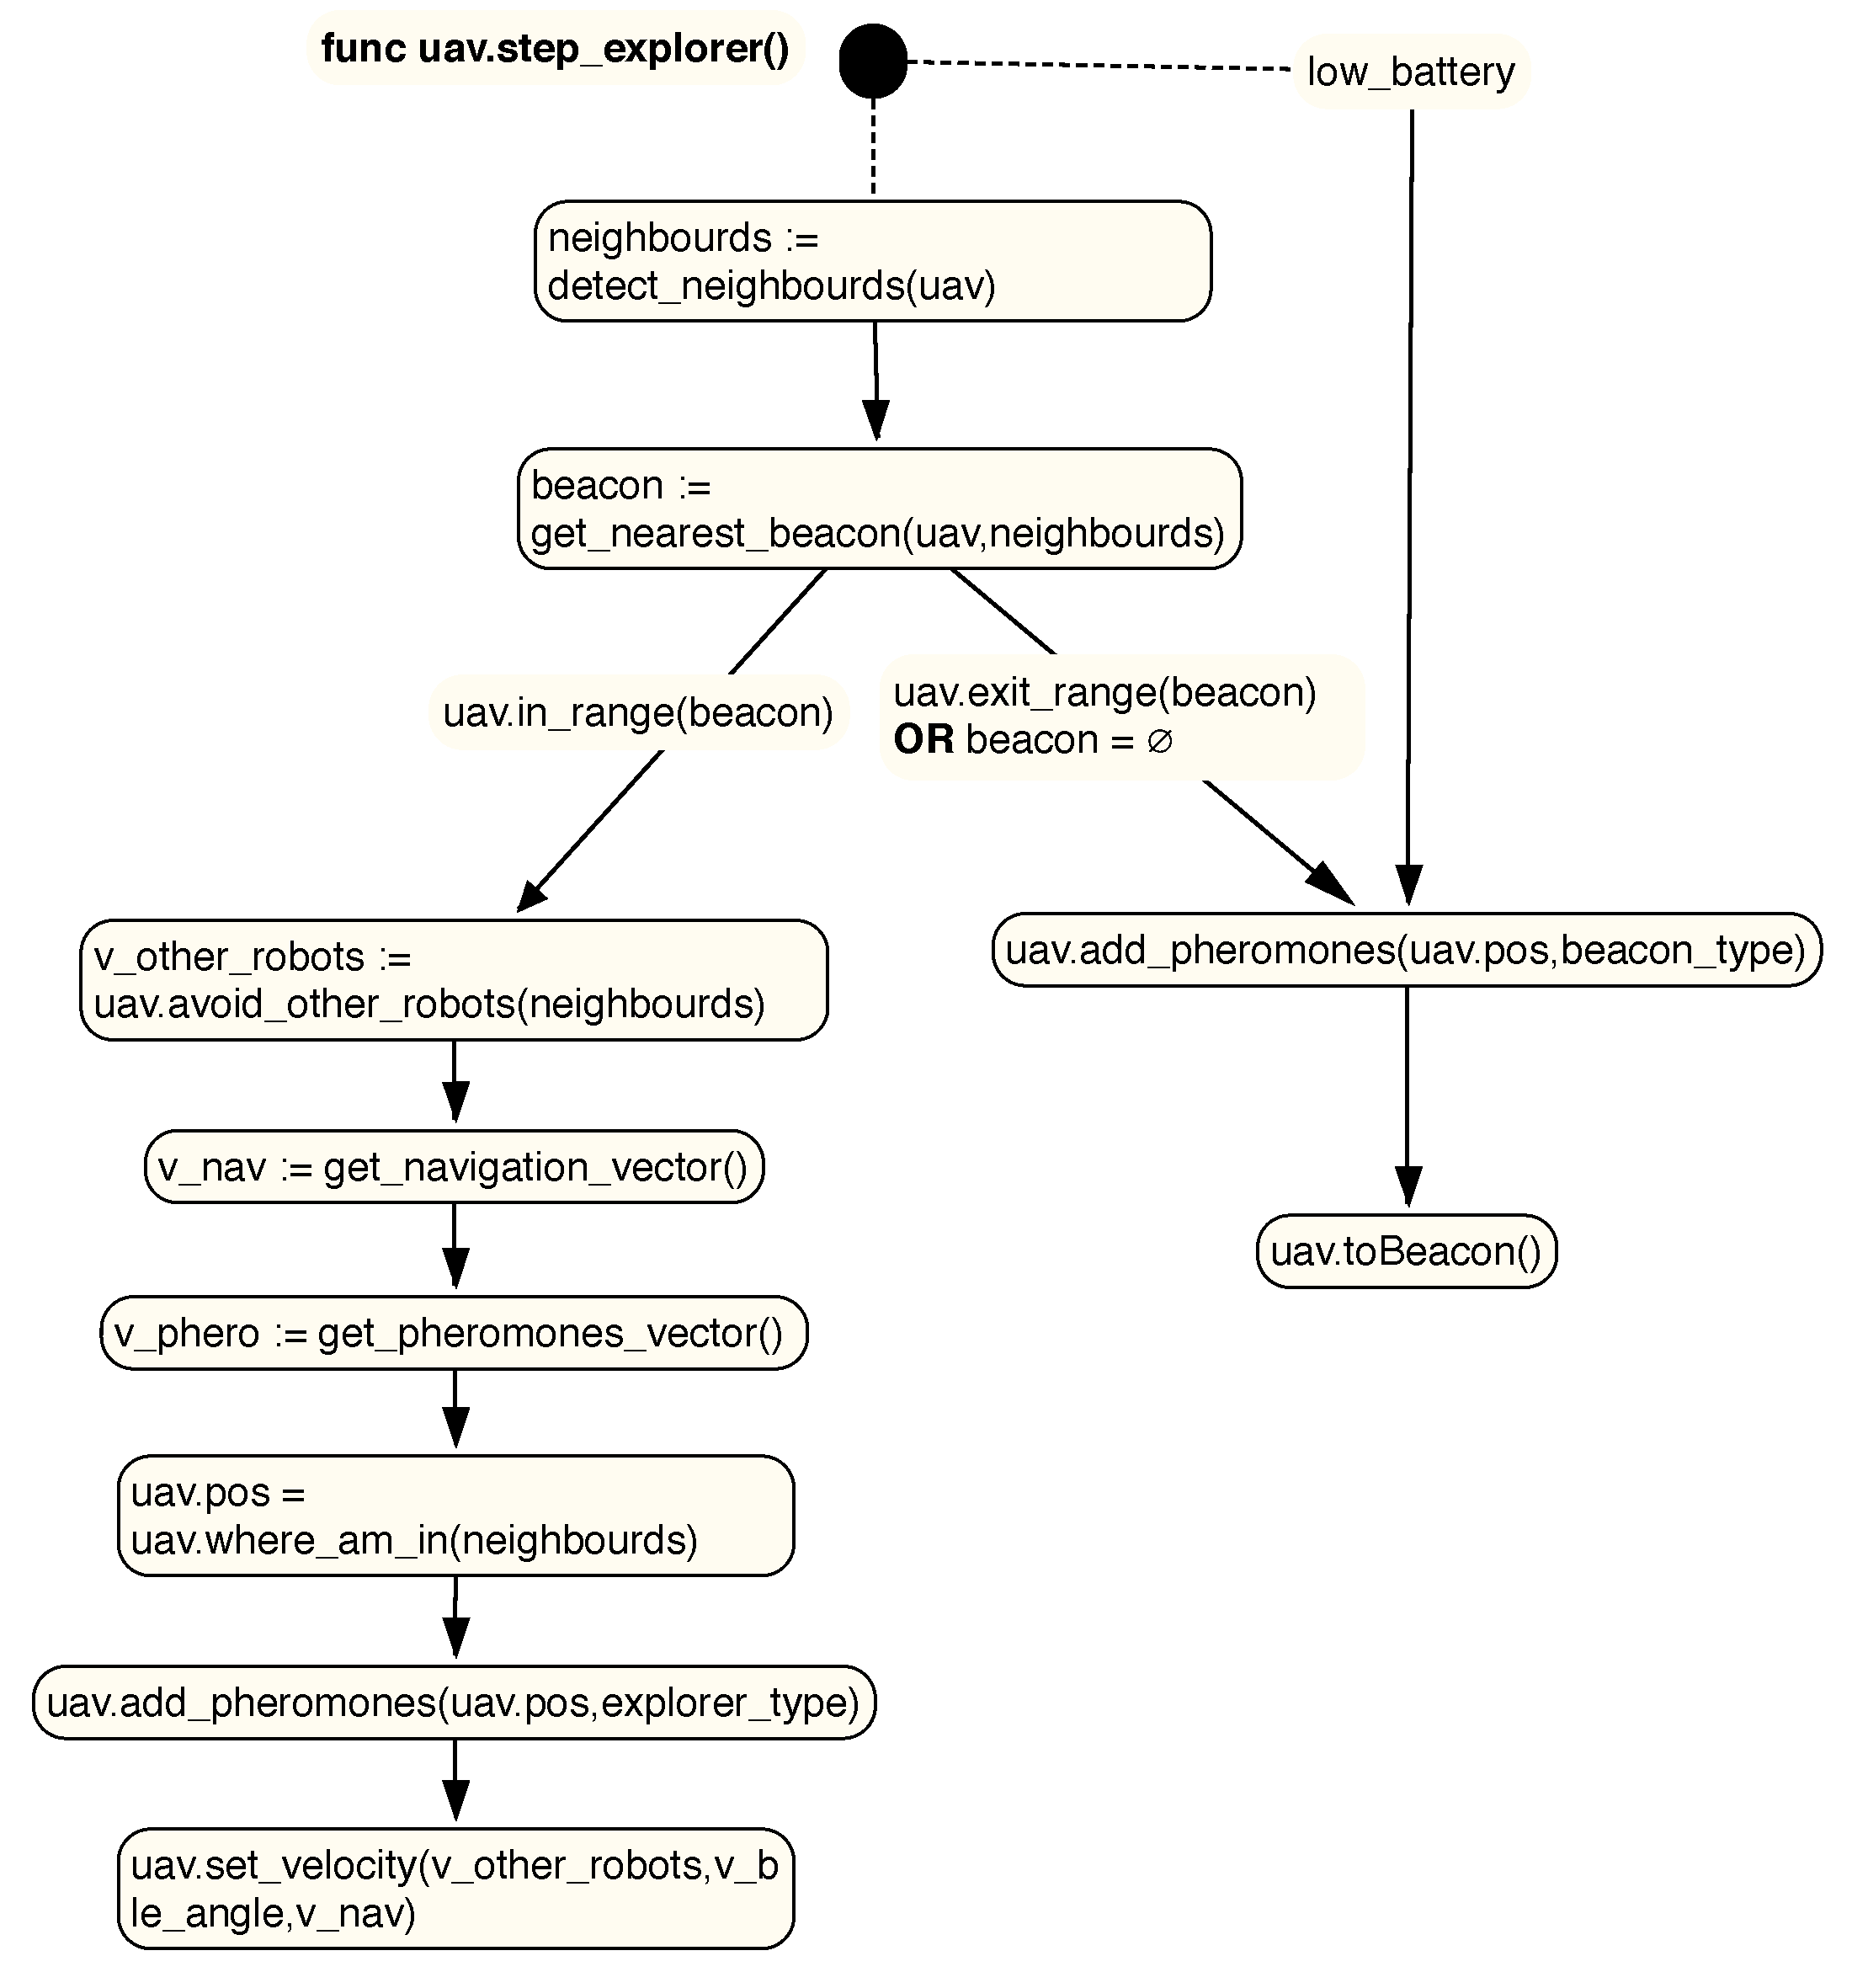
The main purpose of active robots is to explore the environment. Therefore, this behavior has a high energy cost as it requires robots to fly over the environment to develop the deployment behavior. The behavior of these individuals is defined in
Figure 4.
Initially, the active robots (which we will also call explorers) will proceed to determine, through their communication beacons, which drones are close to them (i.e., which drones are within their range of communication). As previously mentioned, the support technology can be Bluetooth Low Energy. Once all the nearby robots are identified, the nearest neighbor will be calculated (for example, using the RSSI signal strength, or for more accuracy, the BLE location protocol). To implement this behavior, we require that our communication system allows the determination of at least three ranges of distance or signal reliabilities: maximum efficiency in communication (near), stable communication (medium), and communication limit (far).
If the vehicle is within a close range (
in_range in
Figure 4), then it will proceed to include the angle recommended by that neighbor
beacon to the path to be performed by the robot. However, the vehicle may not detect a nearest neighbor within the limit of communication or, for any particular failure, it may not detect any nearby neighbor. In either case, the robot will change roles and become a
repeater. Before reaching the limit communication margin, a communication distance is output (
exit_range is established in the diagram). If the nearest neighbor is close to that distance, the
active robot communicates its current angle (obtained by its onboard compass), which will be stored in the neighbor
repeater robot. As we will see later, the purpose of communicating this angle is to determine which angles of exit in this area of the environment make it possible to achieve better deployments. A robot may also become a repeater if it is at a certain battery threshold, in which case, it does not have to fulfill the above conditions.
The movement of the
active robot will be determined mainly by its onboard collision sensors (for example, using visual navigation or range sensors) and by the angle recommendations of its nearest neighbor. If deployment strategies that allow for the coexistence of several
active robots are tested, the robots can have collision-avoidance mechanisms, which should also be taken into account when planning their movement.
Equation (
1) shows how the velocity vector
of a vehicle
r is established by executing the
SLABE behavior at instant
. The position of the robot
and the position of the obstacles detected by the drone are taken into account, where each detected position
i is a coordinate vector
that is stored in a set of obstacles detected by robot
r at time
t (
). In addition, the angle recommended by the
beacon closest to the robot, which we will call
, and its intensity should also be obtained.
is a probability distribution that stores the most promising angles in the area of influence of a
beacon.
represents the recommendation intensity of the drone. In this way, the rotation is included in the drone’s movement function by extracting a random angle following this distribution (
) and generating a unit vector
with this angle by means of the function
. This unit vector is rectified by the recommendation intensity of
beacon .
Speed in a previous instant is taken into account to produce fluid behavior. This velocity will be slightly altered by a random term extracted from a Gaussian distribution to include a noise term that accounts for possible modeling errors in the system. We will assume that the robot is stopped at the initial instant . The normalizing terms allows the performance of the behavior to be adjusted based on the environment and the available sensors and actuators. For this article, we will assume constant values of these parameters.
Repeater
The purpose of the vehicles
beacon or
repeaters is multiple. On the one hand, given that the behavior guarantees that there will be at least one communication channel between two vehicles, they are in charge of providing a communication platform between the drones. This platform could be useful, for example, in case we want to manually inspect a specific area of the environment where the drones have had access. It will also be used, when calculating the angular recommendation intensity of each
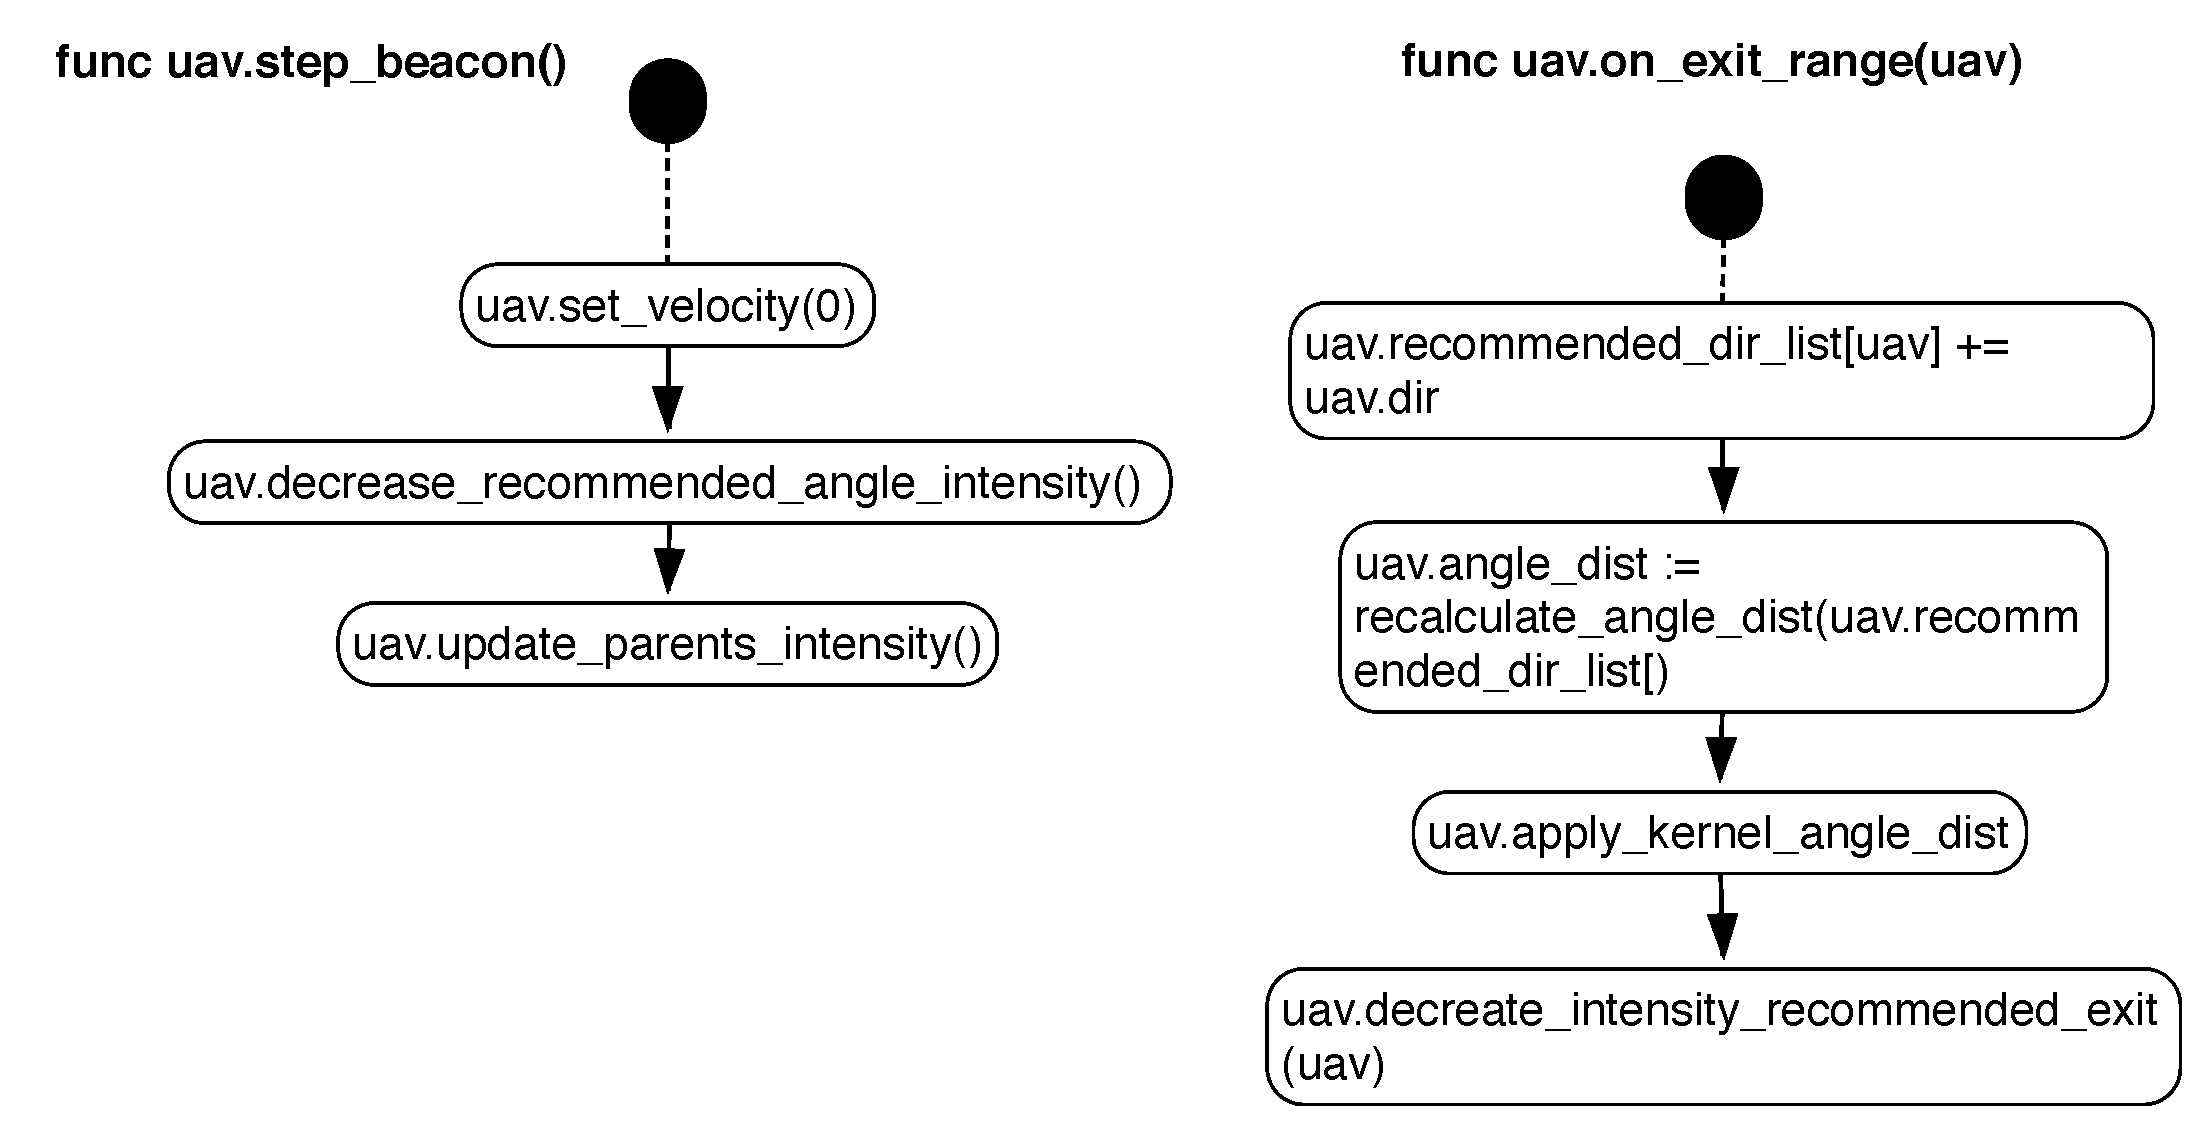
beacon, as we will see later. The behavior of these individuals is defined in
Figure 5.
When a robot performs the role of
repeater or
beacon, it must move to a state of low consumption and therefore stop its engines, setting its speed to 0. As discussed in [
23], in the case of a linkage system, it is preferable for the system to be located in areas as high as possible to maximize the perception and coverage. The robot can land in the nearby area that best achieves these effects.
After stopped the robot becomes part of the swarm, the communication packages that it receives must be communicated to the rest of the drones with which it communicates.This resending process is conducted automatically by XBee devices using the appropriate protocol. However, the main goal was to provide a distributed pheromone system.
Therefore, we wish to develop this behavior with simple drones (microdrones) without requiring specific sensors for the communication of pheromones: we propose the use of repeater robots as sematectonic deposits. In this way, each active drone that leaves the action range of the beacon will recommend its exit angle to the repeater. The repeater will store the angles recommended by each drone and will also take into account how many times the drones visit it.
The number of visits will be used by the repeater to calculate how good the vehicle’s recommendation is. If a vehicle is displayed only once, this probably means that the drone was able to move away from the repeating area in the direction it took. However, if the robot reappears many times, it is likely that its starting angle will not be appropriate.
Specifically, each vehicle b in the beacon state will use a probability distribution at time t. This distribution will store the information about which angles are most promising for the entire swarm. In addition, the recommendation intensity will determine the weight with which it takes into account the recommendations it makes.
The distribution
will be updated at each instant with the information from the environment and will be filtered through the convolution filter presented in Equation (
5), which will enable a new distribution to be obtained for the instant
. The previous filtering process makes it possible to consider not only the discrete angles through which other vehicles passed but also the angles close to their area of influence. More specifically, the distribution
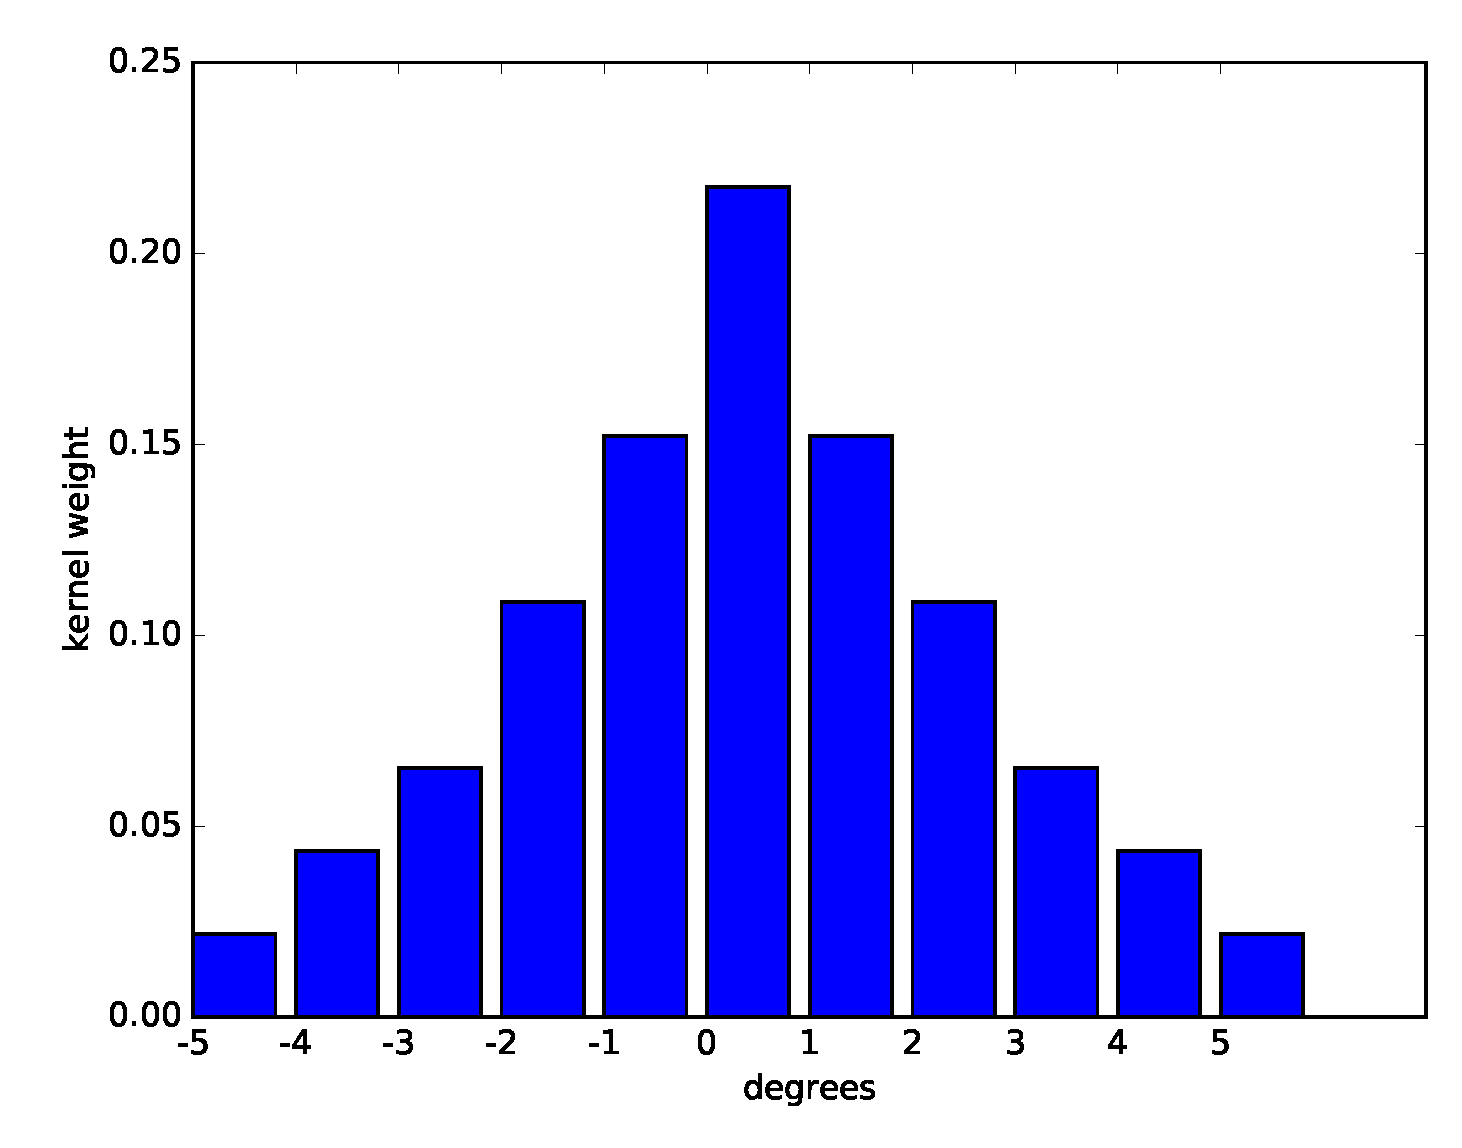
will be implemented discretely using a histogram of 360 values (one value for each degree). In
Figure 6, the discrete kernel
used for the convolution process is shown.
The process of calculating the distribution for each instant
t is presented in Equaiton (
3), where
is the set of all the angles recommended to
beaconb for a drone
r, and
is a distribution normalization term. The variable
represents the angle recommended to the
beacon by robot
r, which is calculated from the sum of all the angles recommended by that robot to the
beacon, where
is each of the angles.
Note that when an active drone is about to leave the area of a beacon drone, it will communicate its angle, and the intensity of its recommended angle will decrease proportionally to a value so that each beacon will gradually reduce its influence over time.
Finally, the
beacon drones will form a structure of parents/children so that when a drone transitions from
active to
beacon, it will consider the last
beacon node that it visited (which, according to the behavior definition, should be in contact with it). As mentioned above, the recommendation intensity of a drone
decreases with each visit by a factor of
. However, there is a way to increase the intensity of the influence. For each instant of time
t, the recommendation intensity of a drone is calculated as presented in Equation (
6). In this way, the most promising roads, where a priori more
beacon drones are located, are enhanced. Finally, as time passes, the intensity of the pheromones will decrease by a factor of
.
3.2.4. Example of Operation
As noted above, several parameters must be established for the performance of the presented behavior. Most of the parameters can be established in a simple way based on the environment or the type of sensors and actuators available on the robots. In all the experiments that we will perform, we will use the fixed parameters that we present next, which are chosen for their versatility and good performance in various environments. It is important to emphasize that these parameters will not be altered, even for different types of maps (simple or complex) on which the behavior will be tested. The tuple of behaviors that define the
behavior used for all the experiments in this article is defined in Equation (
7).
It should be mentioned that the normalizing term
will be calculated for each instant of time
t, in a simple way from the current data of the distribution
for each beacon
b. As discussed earlier, the kernel
is discretely specified in
Figure 6.
A robot that implements SLABE behavior must also define its sensory and motor characteristics, as established in Equation (
8). The maximum coverage range
to guarantee our radio frequency system is set to 6 m, and a robot is considered to be within the margin of influence of a beacon
if the robot is within a 3 m radius of the beacon’s position. The detection range of the obstacle detection system of the robot
, its maximum velocity
, and the area that is considered to be covered by its position
are detailed in
Figure 6.
Finally, we will use an energy model based on [
27], where a common energy consumption for both types of drones will be used to facilitate the comparisons. A consumption of 120 W will be assumed for a drone in the
active state, and 1 W will be assumed for a drone in the
beacon state. It should be noted that microdrones with an appropriate configuration can achieve a much lower consumption (mainly due to their reduced weight and therefore lower energy requirements for takeoff).
An example of how this behavior works for a simple-type map is provided in
Figure 7. Various states have been selected, from the initial step to 95% deployment of the map area. Each robot has a viewing area that is used to calculate the percentage coverage of the map (area represented in blue). This figure shows how the behavior and intensity of the recommendation of each
beacon robot evolve (the higher the yellow tone of the drone is, the greater intensity of the recommendation). The communication area
of the drone can vary from white to yellow to represent this intensity. Finally, the recommended angles for each
beacon robot are also displayed.
3.3. Sematectonic Pheromone Deployment (SEPHE)
3.3.1. Behavior Description
As observed in the previous section, the slant beacon deployment behavior requires not special capacity for implementation. Any current UAV can fulfill all the hardware requirements, including communication. Therefore, it is appropriate behavior for implementation in large swarms, where individuals are simple. This type of behavior is therefore especially suitable for a swarm of microdrones, such as those presented above. If we have individuals with more sensory and processing capabilities, we can take greater advantage of the benefits of the use of stigmergy for swarm communication and the emergence of useful behaviors.
In this section, we will present a behavior called sematectonic pheromone deployment (SEPHE) that has the same purpose as that of SLABE, that is, to cover an unstructured and a priori complex environment. For this behavior, the drones will be required to be able to perform local localization among themselves. In [
3], the authors present a sensor that can be used to effectively perform local localization among agents. Like SLABE, there will be two differentiated states.
Active agents will take off and navigate via an obstacle-avoidance algorithm until the signal from the farthest
beacon vehicle is within the safety limit. Then, the
active vehicle will transition to the
beacon state, as in the previous case.
The fundamental difference with SLABE behavior is that while an active drone navigates, it will emit pheromones that will be collected by the beacon vehicles through which it travels. The beacon drones will therefore serve as the local location mechanism of the swarm as well as stores of local pheromone maps. These local maps will be communicated to any drone within range.
The repeater drones will therefore be responsible for the communication, both direct and indirect, of the swarm. They must also maintain their virtual pheromone map, communicate it to their nearby robots, and adjust it, if necessary. The repeater drones should also apply the intensity decrement to the map, so that, among other tasks, areas that have not been explored for a long time can be re-verified.
This behavior is therefore a variation of the use of quantitative sematectonic stigmergy, which requires more communication than that required by the SLABE behavior but which is more similar to the standard implementations of community-based pheromone robotic systems, in addition to providing much more information to the active robots for making decisions in flight. The following describes the behavior in detail.
3.3.2. Role Description
Active
Active drones are drones that are in flight exploring the environment. The behavior of these individuals is defined in
Figure 8. Like the SLABE behavior, active drones determine their movement based on several factors. On the one hand, they determine their position with respect to the repeater vehicles, but in this case, the positioning is much more accurate (not only do they know that they are in rank with a repeater, but they know their position relative to it). On the other hand, they also take into account, in the event that two or more active robots coexist, their relative location, as long as they are within the detection range. We will assume that they also use an onboard collision sensor that will allow them to obtain a repulsion vector for areas that can generate collisions.
The main novelty with respect to SLABE is that a pheromone map sent by the nearest repeater is now available, which will enable them to make more informed decisions. A pheromone type of variable intensity that will lose intensity over time will be used. While active robots navigate through the environment, they will leave a path of pheromones, which will be stored in the repeater robots. The navigation process will continue until either the robot does not have sufficient battery power to continue developing its active task or it is in the limit communication range (exit_range). The pheromone emission of an active robot is characterized by its intensity and its radius .
Specifically, the motion of an active robot will be determined mainly by its onboard collision sensors and the local pheromone map. If deployment strategies that allow the coexistence of several active robots are tested, the local location of those robots within a certain detection range will also be used as planning information. All these parameters will be combined to obtain the robot speed.
where
C is the set of local Cartesian coordinates
that are within the detection radius of the pheromone sensor
.
is the set of obstacles detected by robot
r at time
t,
is a vector formed by the coordinates
normalized by its squared norm.
is a matrix that stores the reading of the corresponding pheromone sensor in position
. The speed of the drone
at instant
, which is defined by the sum of terms in the previous equation, is adjusted by
, whose overall sum is one.
Repeater
As in the SLABE behavior, the repeaters are responsible for maintaining the communication channel. The behavior of these individuals is defined in
Figure 9. In this case, this channel is of special importance since we are not considering sporadic communications with very little bandwidth (as in the previous case) but a channel that is used to update the pheromone map and the local location of the swarm individuals. Repeaters will be responsible for forwarding the required packages to all drones in their range of action.
As soon as a drone transitions from the active state to the repeater state, it will emit a pheromone halo of intensity and radius . The repeater robot will enter a state of low power consumption and should therefore be located in an area of the environment that maximizes its perception and coverage, if possible.
In this behavior, repeaters must provide local positioning mechanisms and must have sufficient memory to store their local pheromone map. This map will be constantly updated, either by the navigation process of the active drones or by the process of the constant reduction in pheromones intensity as time passes. Specifically, each second, the intensity will decrease by a factor of .
3.3.3. Example of Operation
As noted above, several parameters must be established to achieve the presented behavior. Most of the parameters depend mainly on the type of sensors and actuators available on the robots. In all the experiments that we will conduct, we will use the following fixed parameters. It is important to emphasize that these parameters will not be altered, even for different types of maps (simple or complex) on which the behavior will be tested. The tuple of behaviors that define the behavior
that will be used for all experiments in this article is defined in Equation (
11).
In addition, in our simulator, to obtain a more realistic approach with respect to local location systems, the pheromone layout events have a positioning error of around the actual disposition point.
A robot that implements SEPHE behavior must also define its sensory and motor characteristics, as established in Equation (
12). The parameters are consistent with the previous behavior, and the same energy model will be used (120 W consumption per drone in the
active state and 1 W consumption per drone in the
beacon state, so we will assume that the same drones will execute both behaviors; although, as previously shown, SLABE behavior has lower hardware requirements).
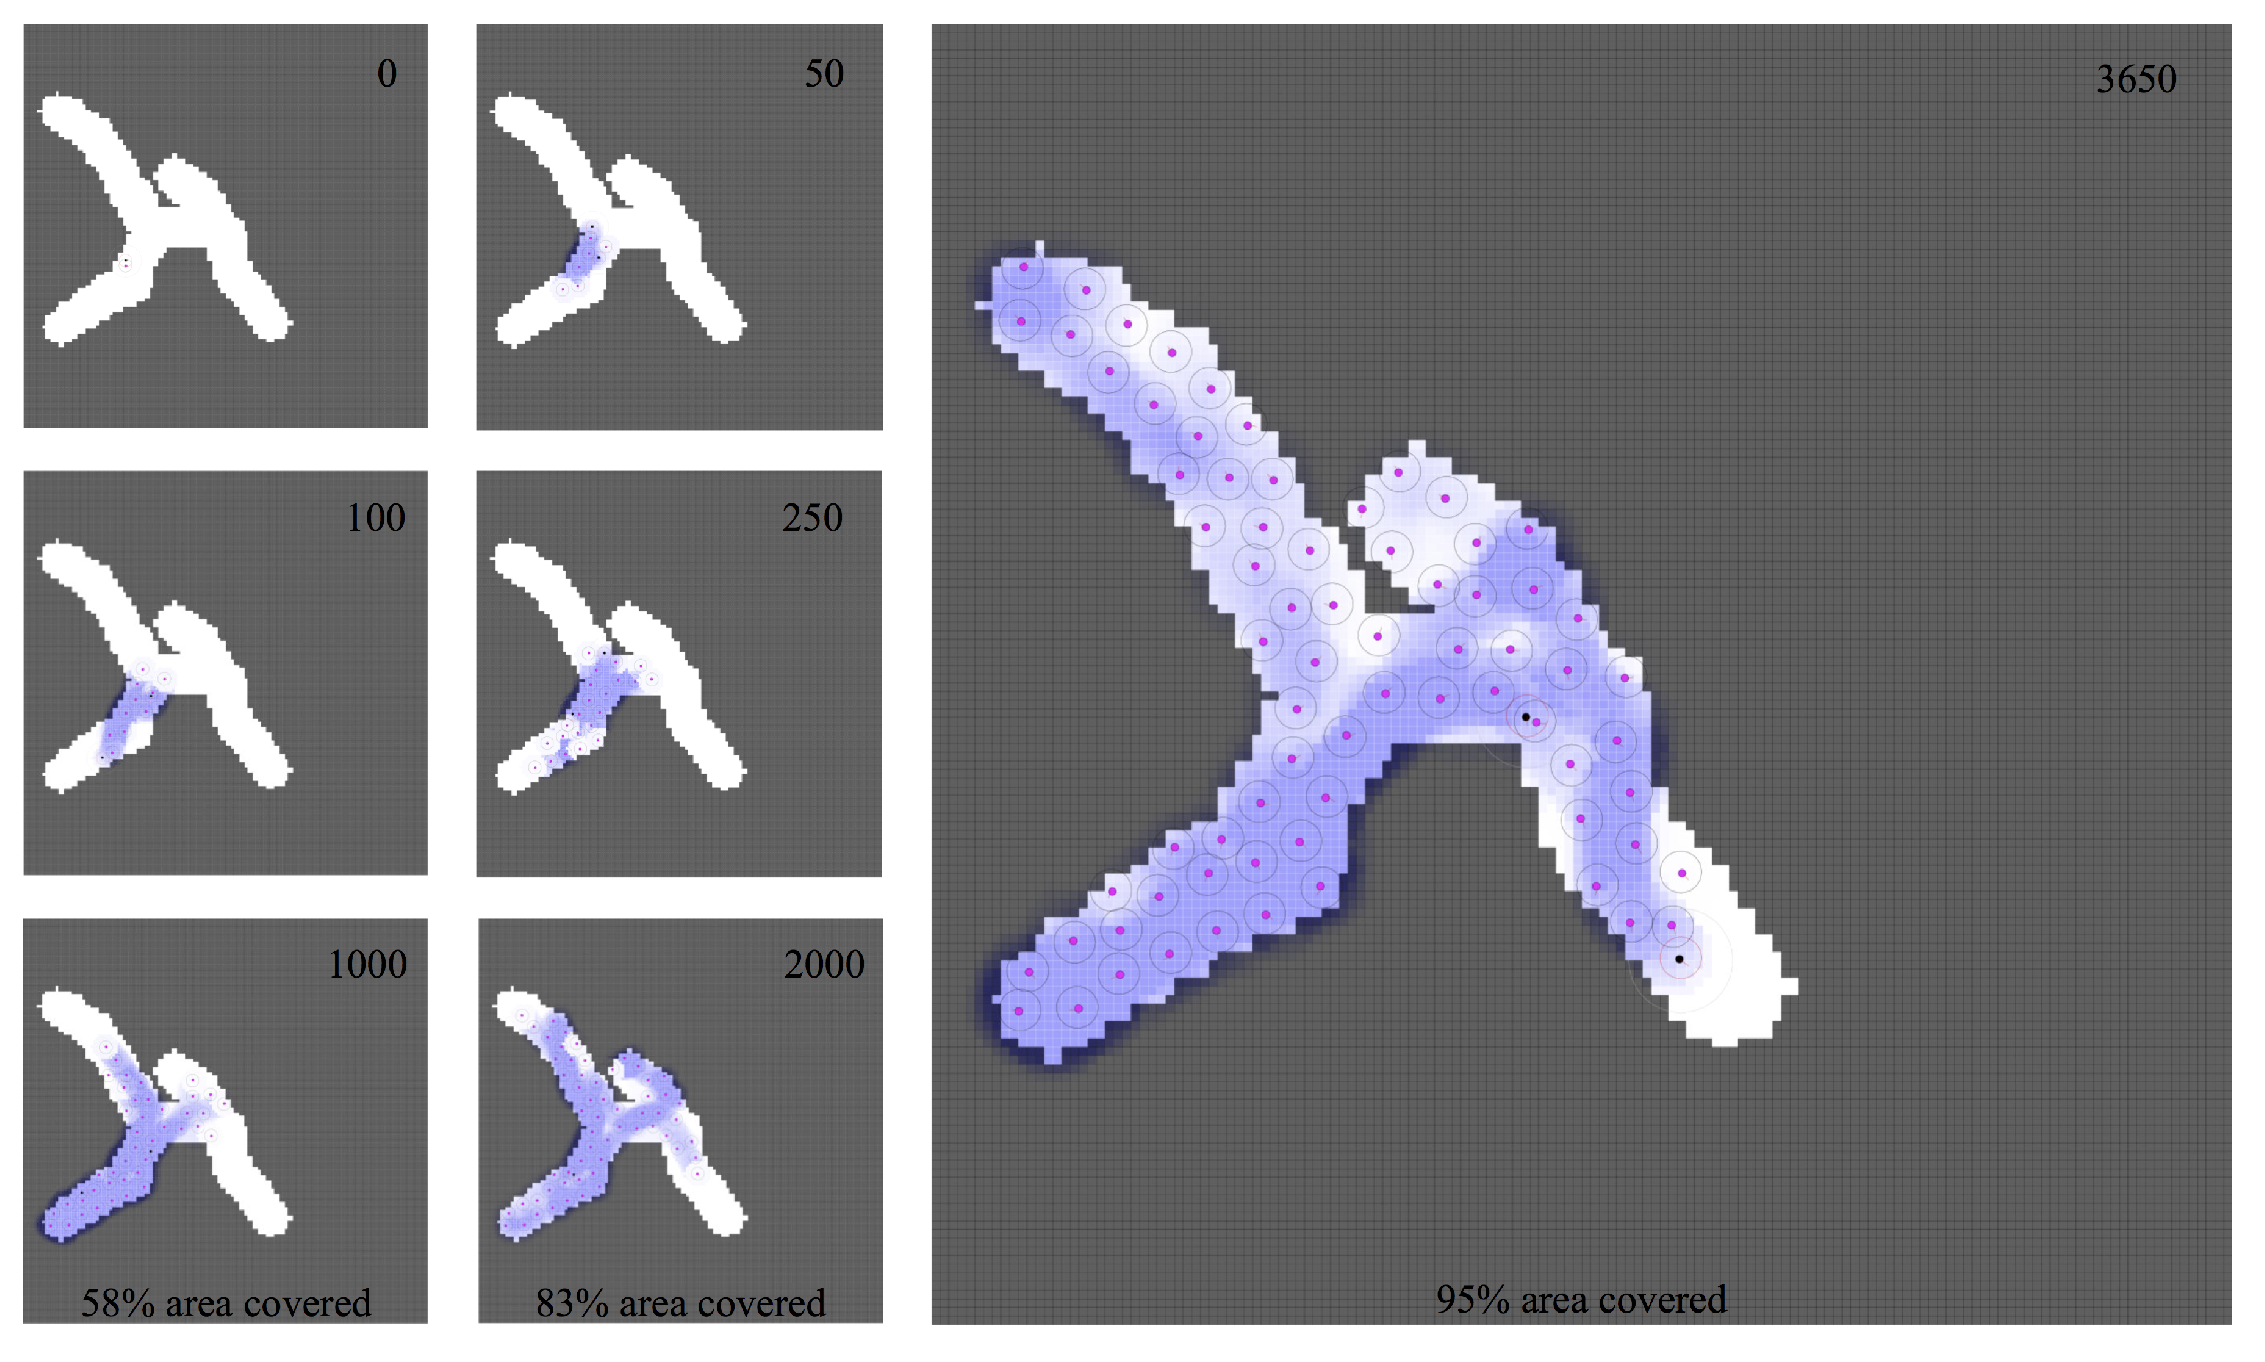
In
Figure 10, we present an example of how this behavior works for a simple-type map. Various states have been selected, from the initial step to 95% coverage of the map area. The distributed pheromone map maintained by
beacon robots is shown in blue. Along the route, the most promising roads are prioritized to achieve greater coverage.
4. Results
4.1. Purpose and Design of Experiments
In this section, several tests will be conducted to verify the behaviors presented in the previous section. Several experiments will be performed to analyze the number of collisions (if a collision occurs, even if it is recoverable, it is counted for each of the agents involved), the time required to cover 95% of the area to be explored, the energy consumed and the total flight time of the swarm.
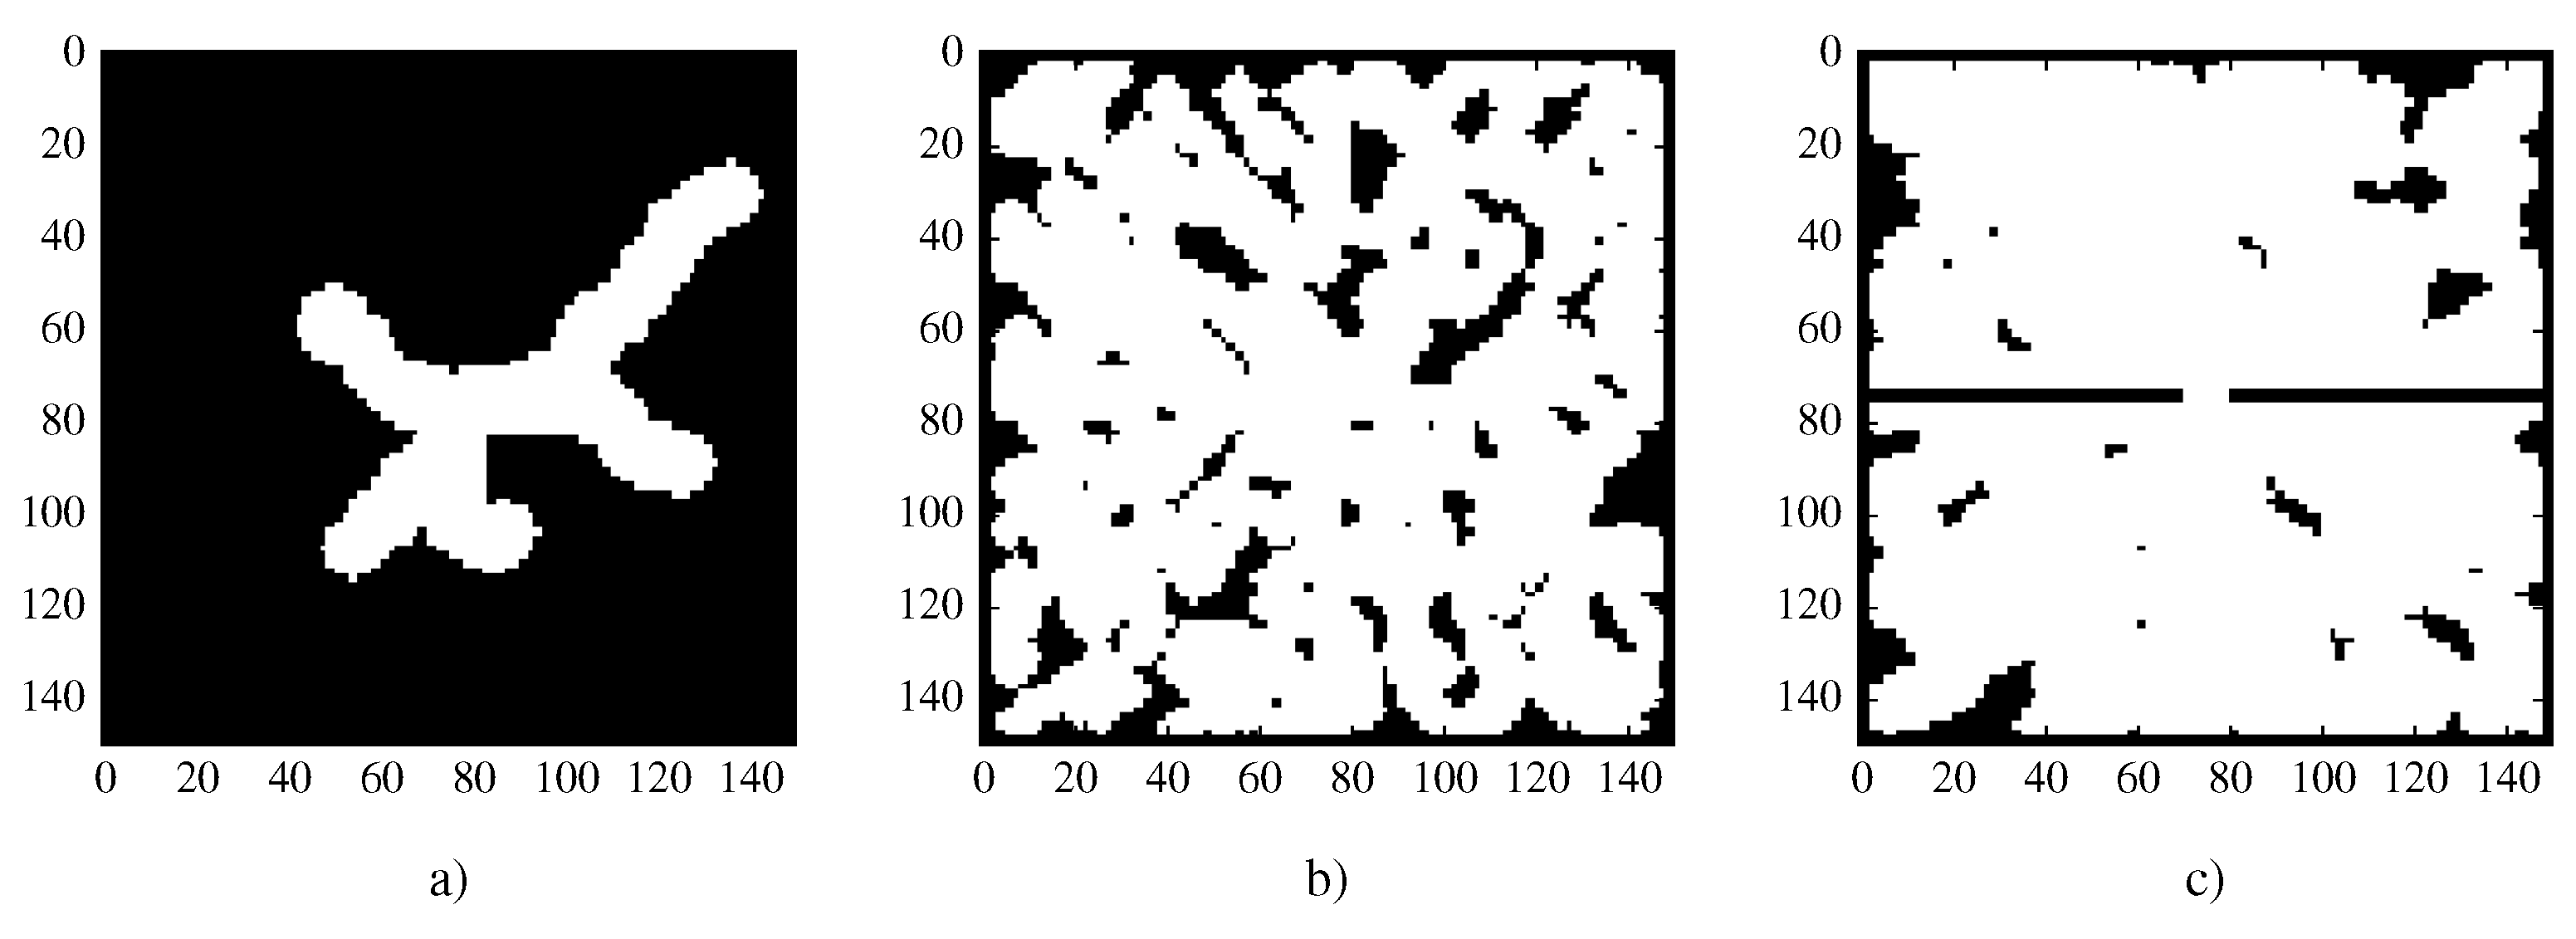
We will use two main types of maps to compare, in a general way, the deployment strategy used as well as the functioning of unstructured behaviors. We will add a type of map that is more oriented to the comparison of the behaviors in complex environments of very difficult access.
For each test, a random map will be generated with the characteristics listed below using cellular automata (as briefly described in the discussion of the simulator). In this way, we will check the robustness of the behaviors in unstructured environments. The free points from which vehicles could be introduced into the system will also be calculated. In this way, random behavior start points will also be used.
The first type of maps will be called
easy and will be maps with a walkable zone of approximately 75 m
. Easy maps will be unstructured maps with few ramifications and obstacles. The second type will be called
hard. Hard maps will be much more extensive maps with an approximately 200 m
walkable zone. These maps will also have much higher entropy, with obstacles that will make it difficult to navigate and with a multitude of paths and variants that will make it difficult to perform the desired behavior. To verify exhaustively the behaviors presented in complex environments, we will perform some tests in
hard environments with very difficult access, where there will be a central wall on the map that will divide it into two parts with a single access point of 10 m. To completely cover these maps, at least half of the swarm must pass through the door. These maps will be called
wall.
Figure 11 shows an example of each of type of map.
In this section, we want to provide a set of tests that allow us to verify several aspects. On the one hand, the take-off time interval is important in terms of the number of collisions and the total energy required by the swarm. We are interested in validating two strategies (LTID and FGID), taking into account a new parameter, the maximum number of active vehicles that may be navigating at a specific moment. In addition, we want to validate the importance of the take-off time interval is maintained in all types of maps.
We also want to test the energy efficiency of our two behavior patterns. The implementation requirements are the same, so we assume that there will be variation in both with respect to the energy required, deployment times and number of collisions. It is also important to verify how different types of maps affect the behavior. We will verify the performance of both types of behavior with all three types of maps.
To test the LTID deployment strategy, 50 tests will be developed for different take-off time intervals (6, 8, 10, 12, 18, and 24 s). Each test will have a randomly generated map of the type to be tested, as well as a different starting point. By not considering redeployment, we will assume that we have a sufficient number of individuals to completely cover the environment (given their area of perception, in our case, set to ). In these tests, we will assume an upper limit of 100 individuals, which allows us to cover a maximum area of 1000 m.
In the case of the FGID deployment strategy, each of the previous take-off time intervals will be tested for a maximum number of 2, 5, 10, and 20 individuals in flight. To reduce the influence of the random generation of maps, because an increase in the number of tests per map is not feasible, we will assume a single map of each type and a common starting point. In this way, for each behavior and each type of map, 1200 simulations will be conducted (50 simulations on the same map for each combination of take-off time interval and maximum number of vehicles in flight).
4.2. LTID Tests
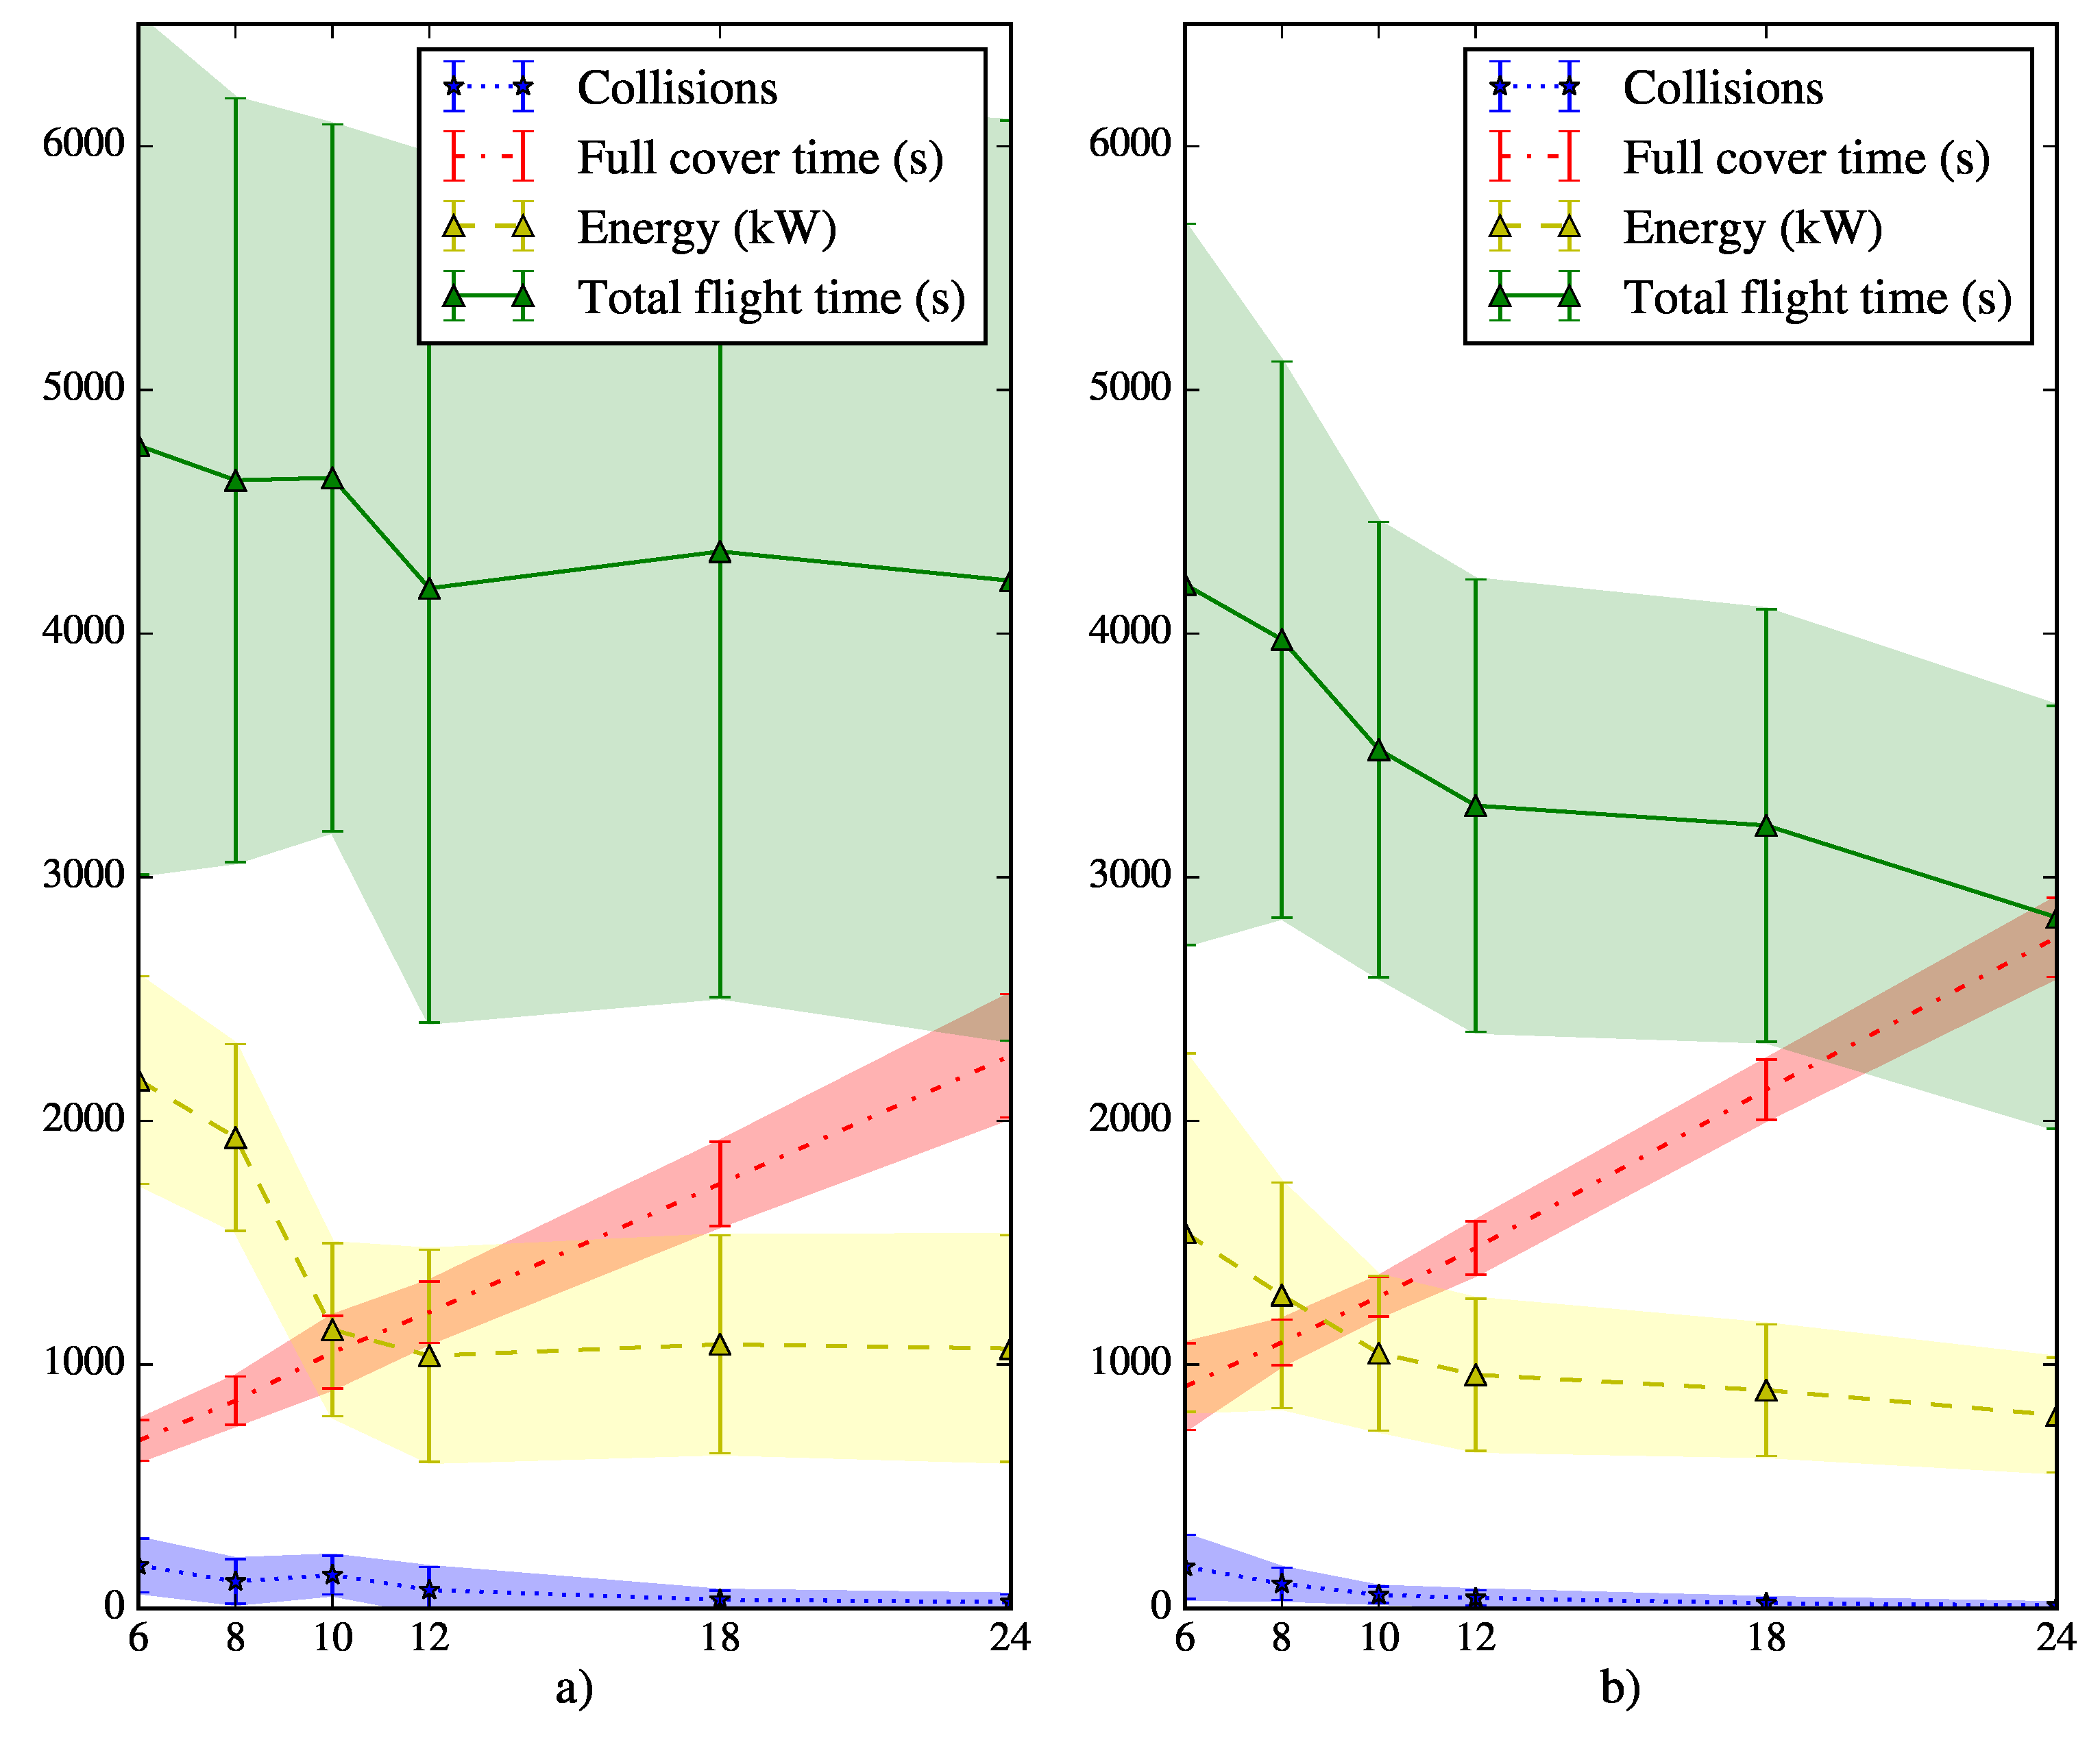
Figure 12 presents the results of 600 simulations performed for SLABE and SEPHE using the LTID strategy for different take-off time intervals on
easy maps. For each take-off value, 50 random maps and random take-off positions are generated. For both behavior types, the figure shows the average and standard deviation of the number of collisions, the time required to cover the 95%of the environment, the energy consumed and the total flight time required by the active members of the swarm.
At a general level, it is easy to see how the minimum time required to reach the desired coverage (approximately 16 min) is achieved with a take-off time interval of 6 s (the shortest used). However, the shorter interval also increases the number of collisions between vehicles. The energy required by the swarm starts at 2000 kW for a take-off time interval of 6 s and decreases to 1000 kW as the time interval increases. This decrease is significant for the initial interval and becomes much less pronounced for an interval of 12 s. The same is not true for the deployment time, which increases continuously from the initial 6 s take-off interval (and 16 min deployment) to the 24 s take-off interval (and 30 min deployment) for the SLABE behavior.
The general tendencies are the same for both types of behavior: less energy is consumed and fewer collisions occur as the take-off time interval increases. There is much greater variability in the total flight time required and in the energy consumed for the SLABE strategy.
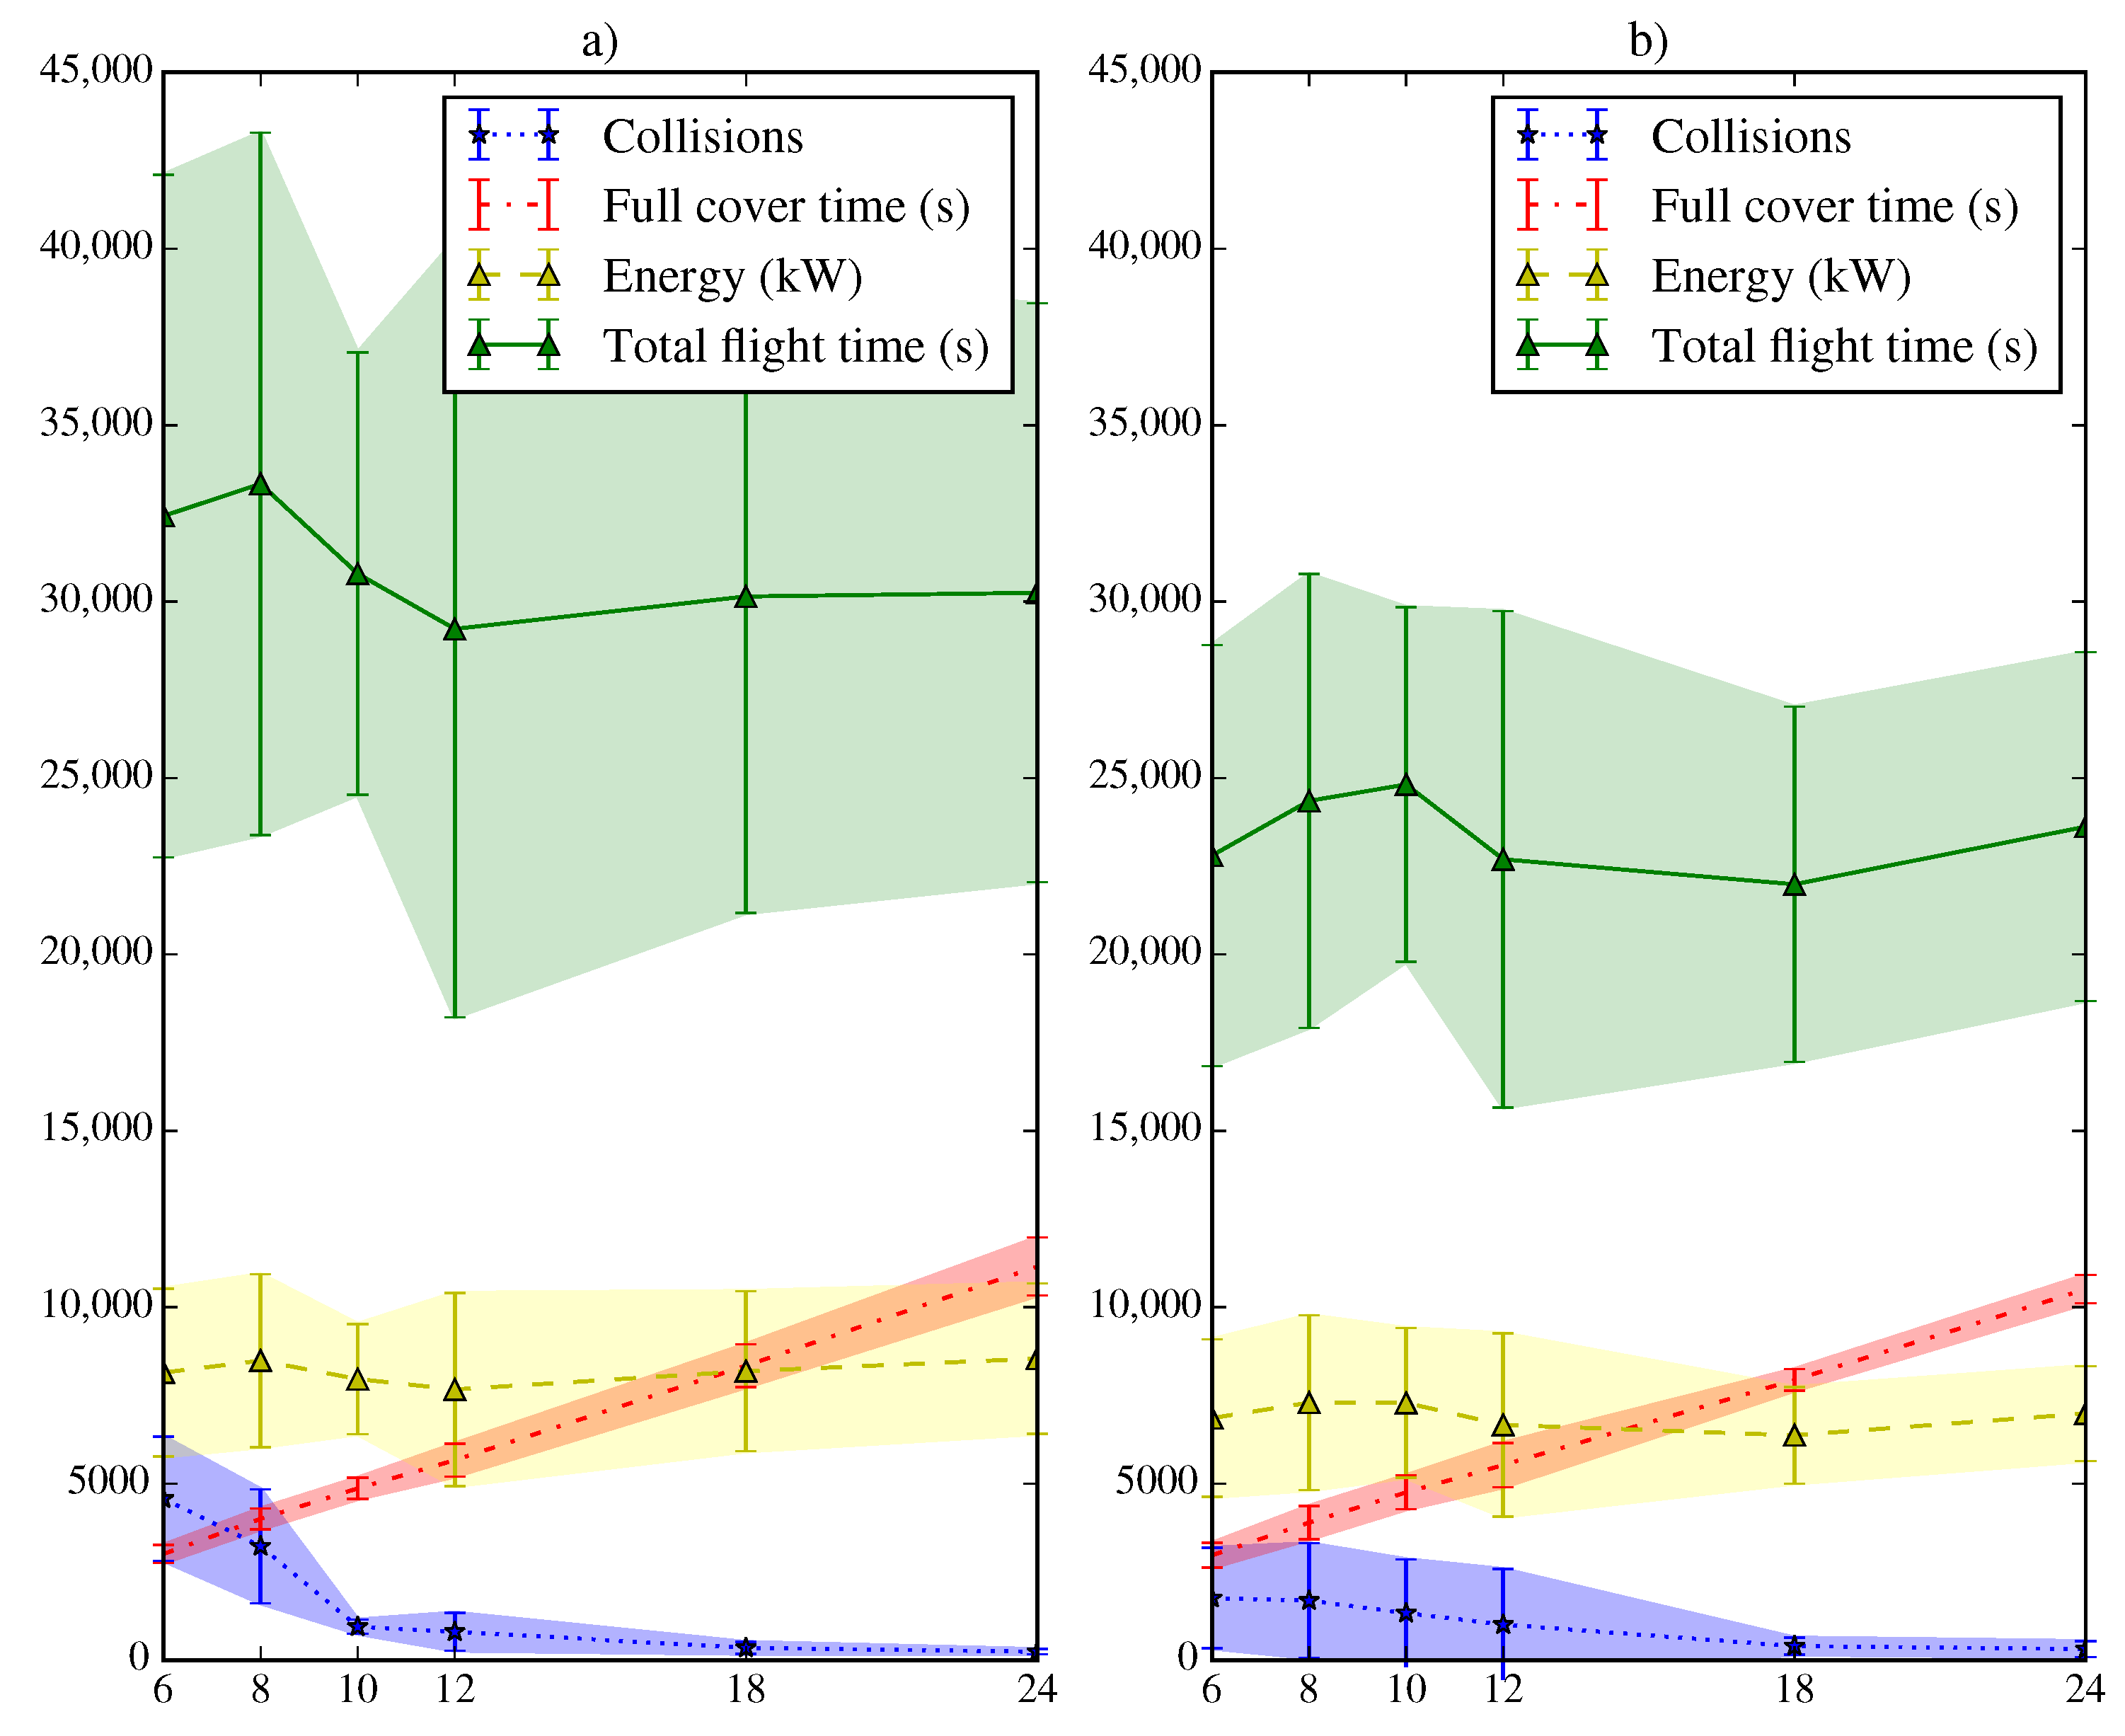
Figure 13 presents the results of 600 simulations for both types of behavior (SLABE and SEPHE) using the LTID strategy for different take-off time intervals on
hard maps. The parameters used in the tests are the same as in the previous case.
The time required for deployment is much longer than that of the previous case (a minimum of approximately 40 min), which is a consequence of the size of the map and the greater difficulty of navigation. The general tendencies observed in the previous case are maintained: the shorter the take-off time interval, the greater the number of collisions and the shorter the time require to achieve the desired coverage. However, the decrease in energy is not as substantial as that in the previous case. Energy consumptions remains almost constant, even for smaller take-off time intervals. The coverage times of the two approaches are similar, although there is still much more variability in the flight time required by the SLABE strategy.
Although the behaviors have been executed on the same type of agents, the SLABE behavior has much lower hardware requirements for its implementation; therefore, the agents that support it do not require higher energy consumption.
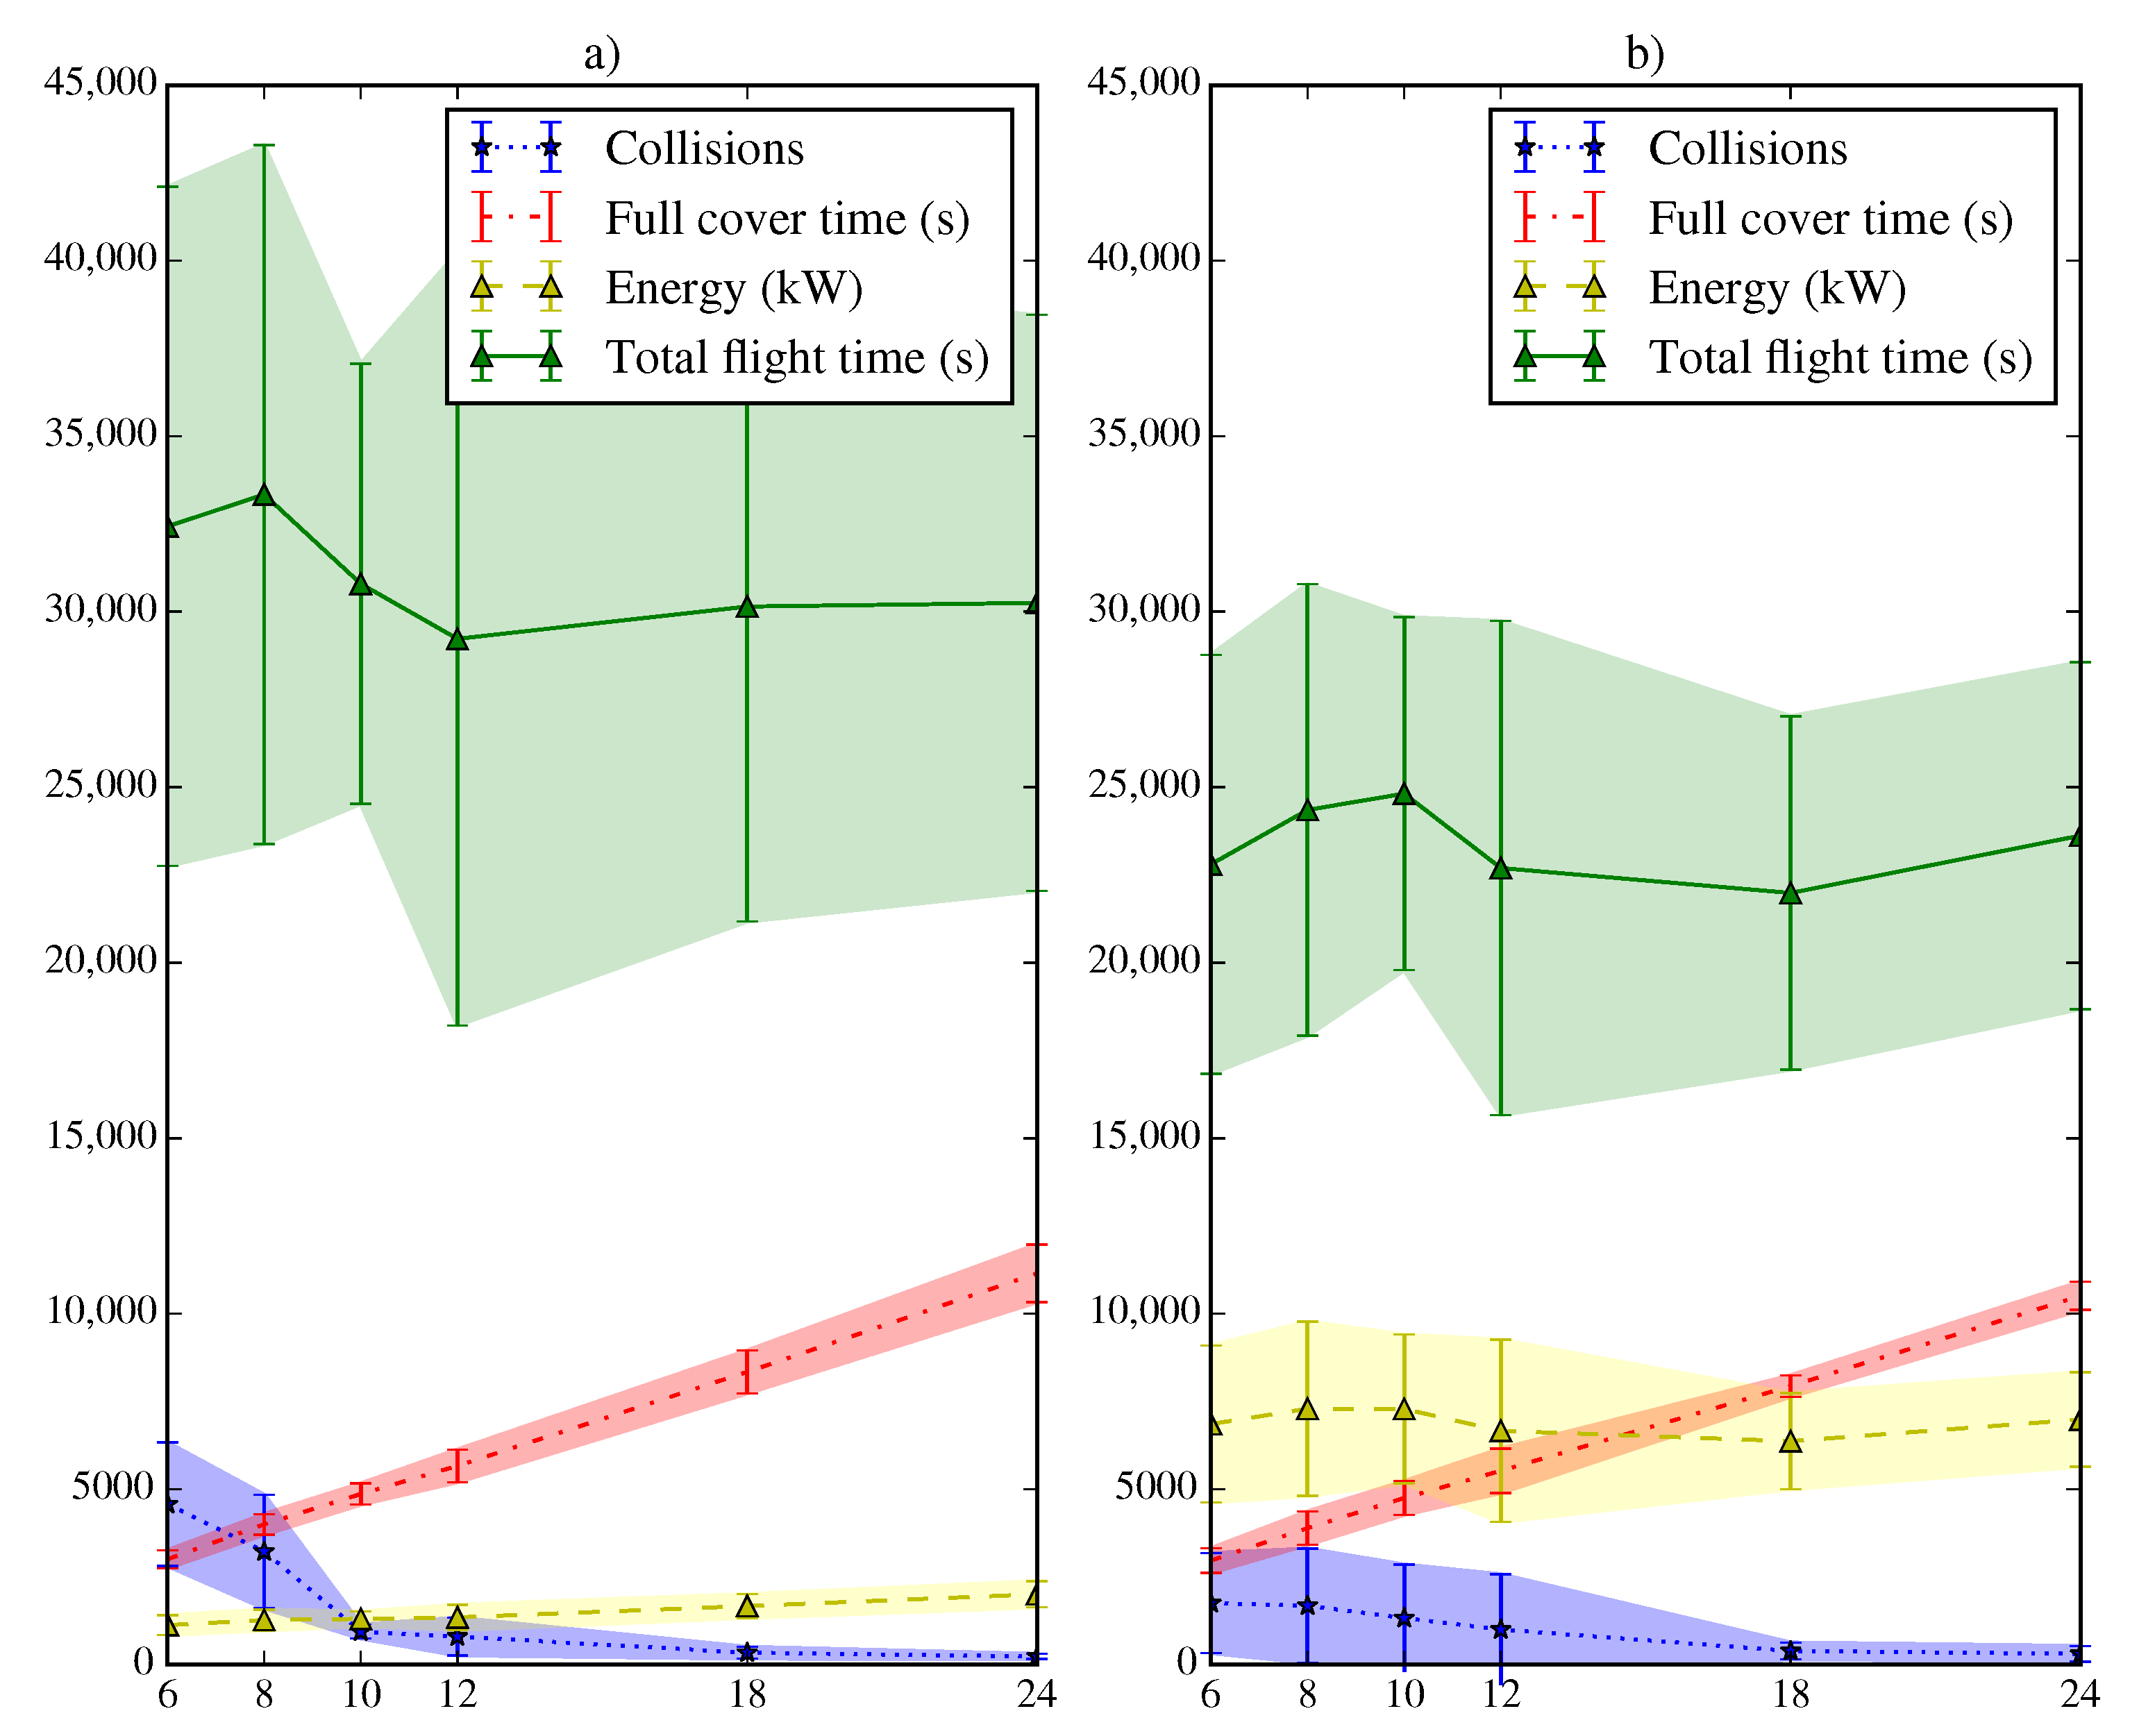
Figure 14 presents a simulation of the SLABE and SEPHE behaviors equivalent to the previous one but with a different energy model for the SLABE agents. In this case, the agents executing this behavior require 15 W in the active state (equivalent to the consumption of vehicles of the ARDrone type) and 0.5 W in the beacon state. The vehicles that execute the SEPHE behavior follow general energy model based on [
27]. With this assumption, the swarm SLABE behavior requires less energy, even for a longer flight time.
Finally, the performance of the behaviors for
wall-type maps has been checked.
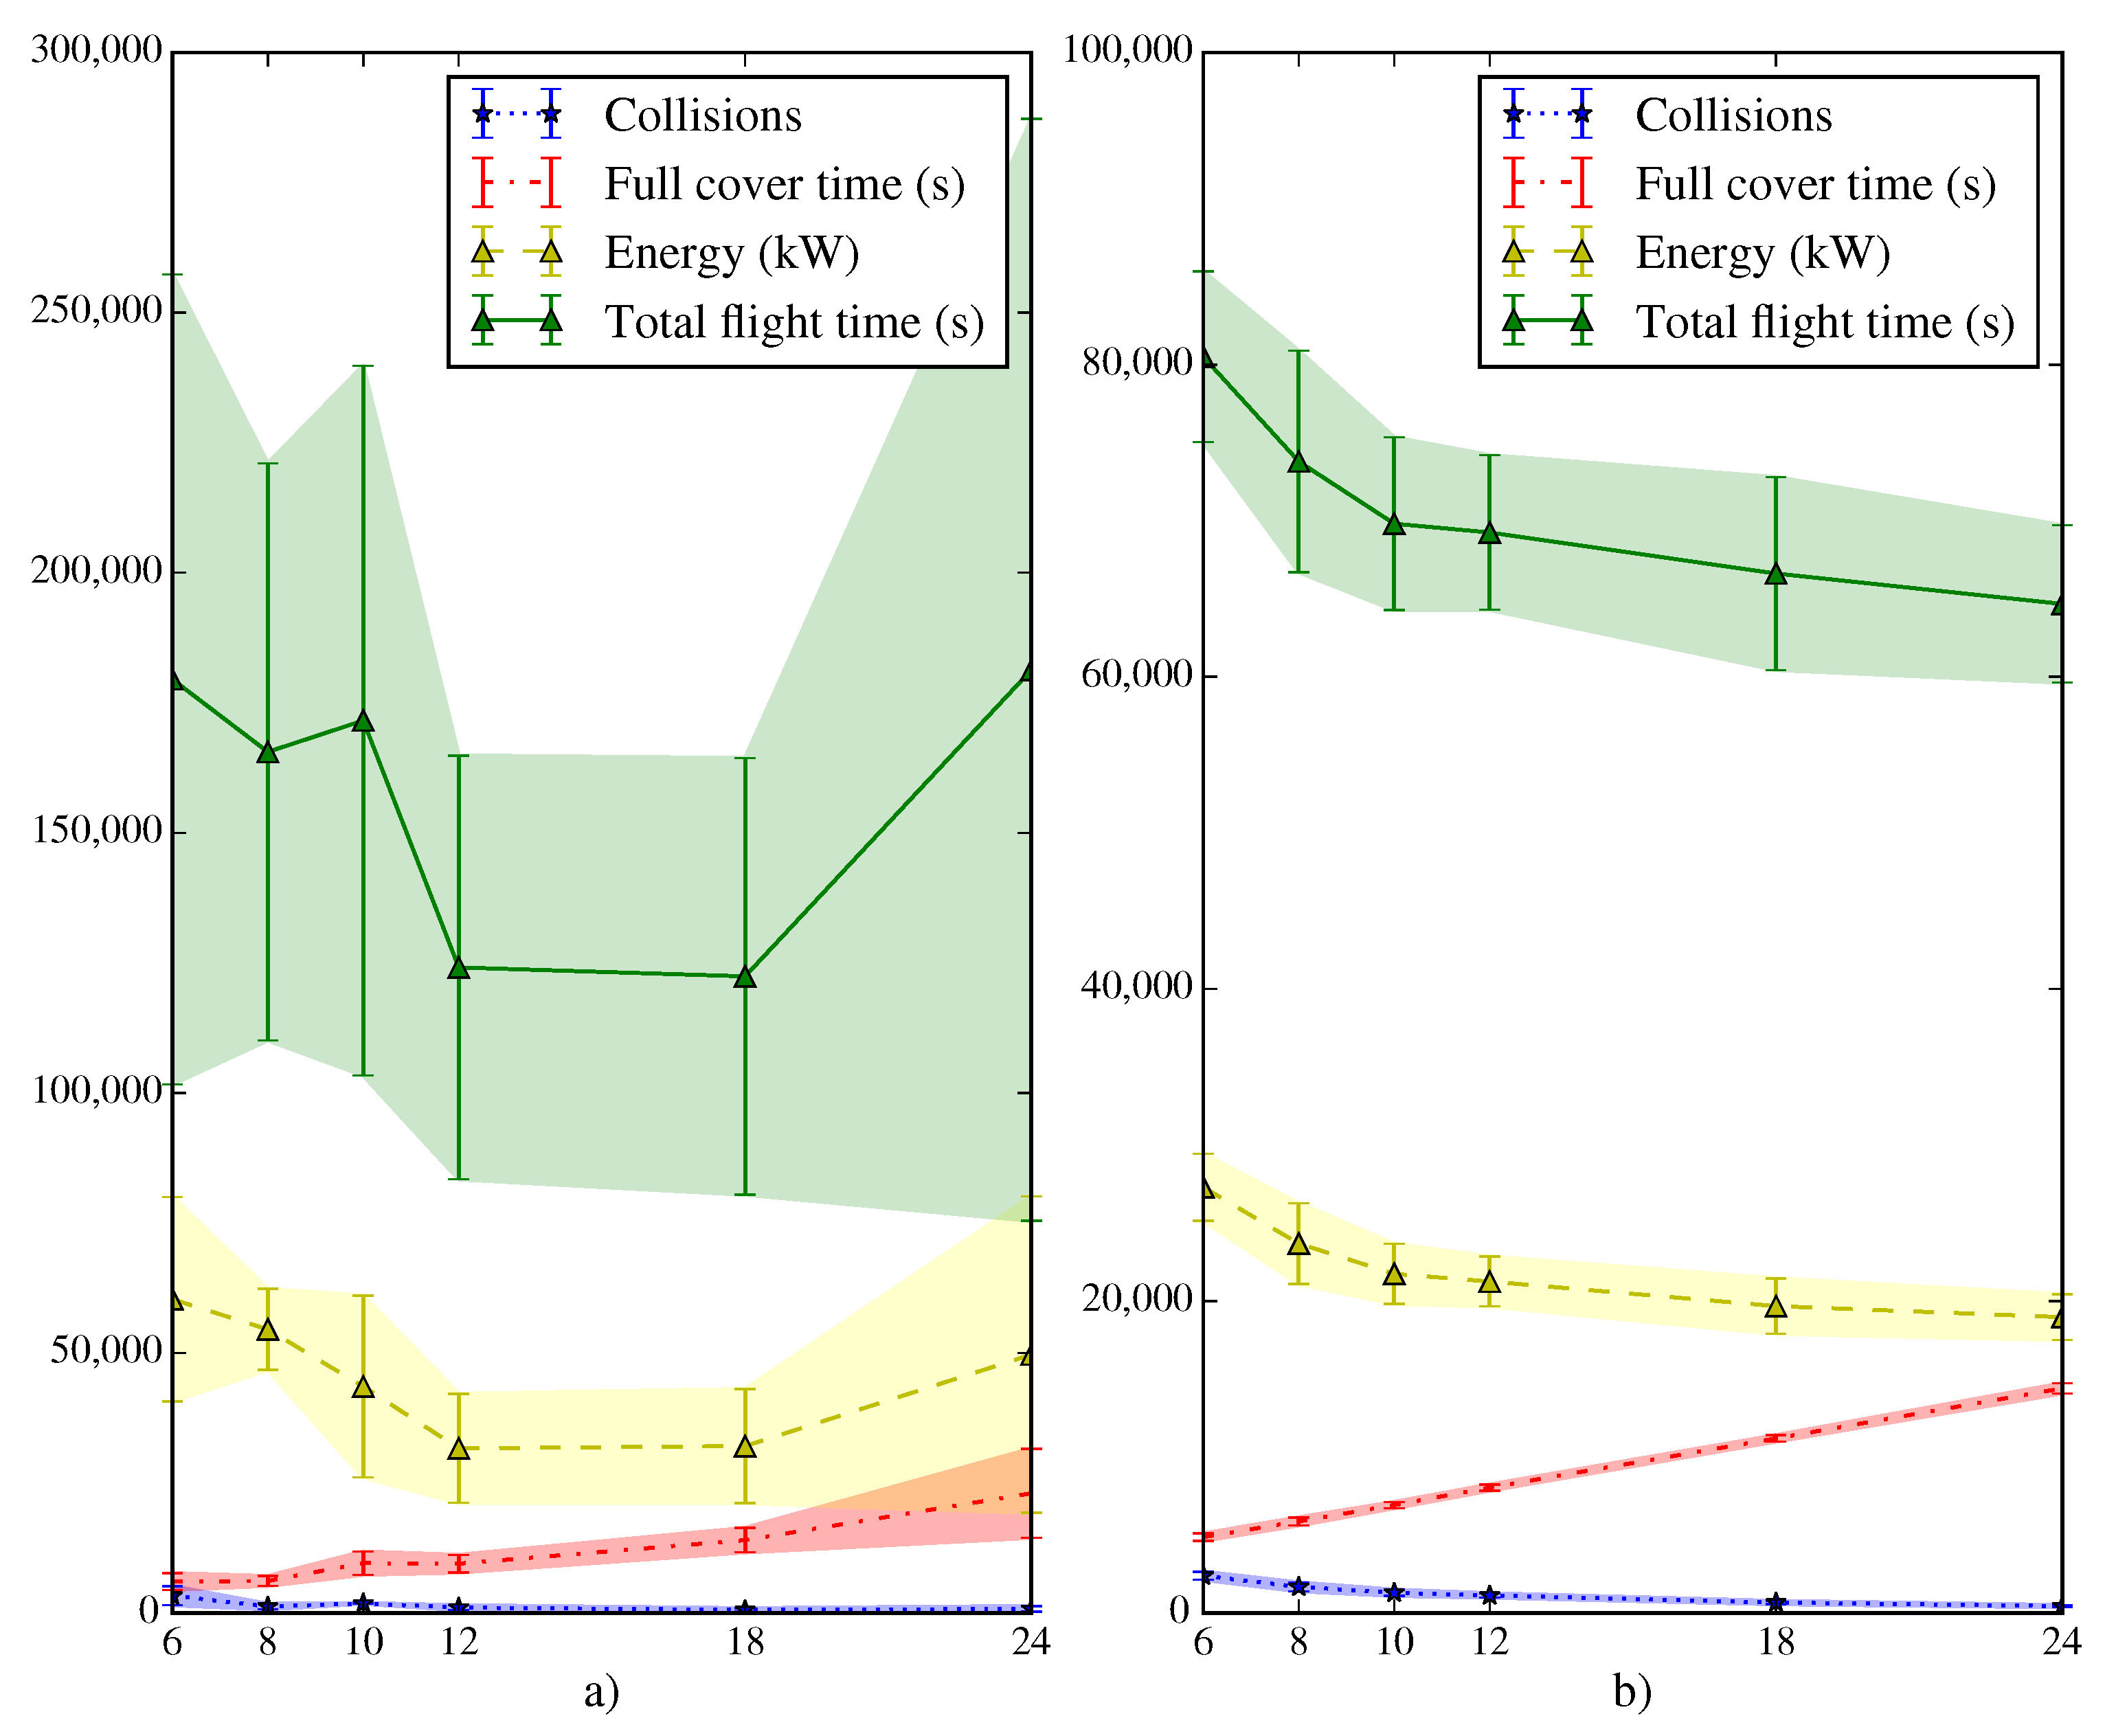
Figure 15 presents the results of 600 simulations for the both types of behavior (SLABE and SEPHE) using the LTID strategy for different take-off time intervals.
In this case, the time required is much longer (a deployment time or approximately 4 h) due to the difficulty of the environment. The energy and time required, as well as the number of collisions, are substantially increased compared to those of the previous tests. In this extreme case, there is an increase in the variability of the SLABE approach due mainly to the low granularity of the local location system.
4.3. FGID Tests
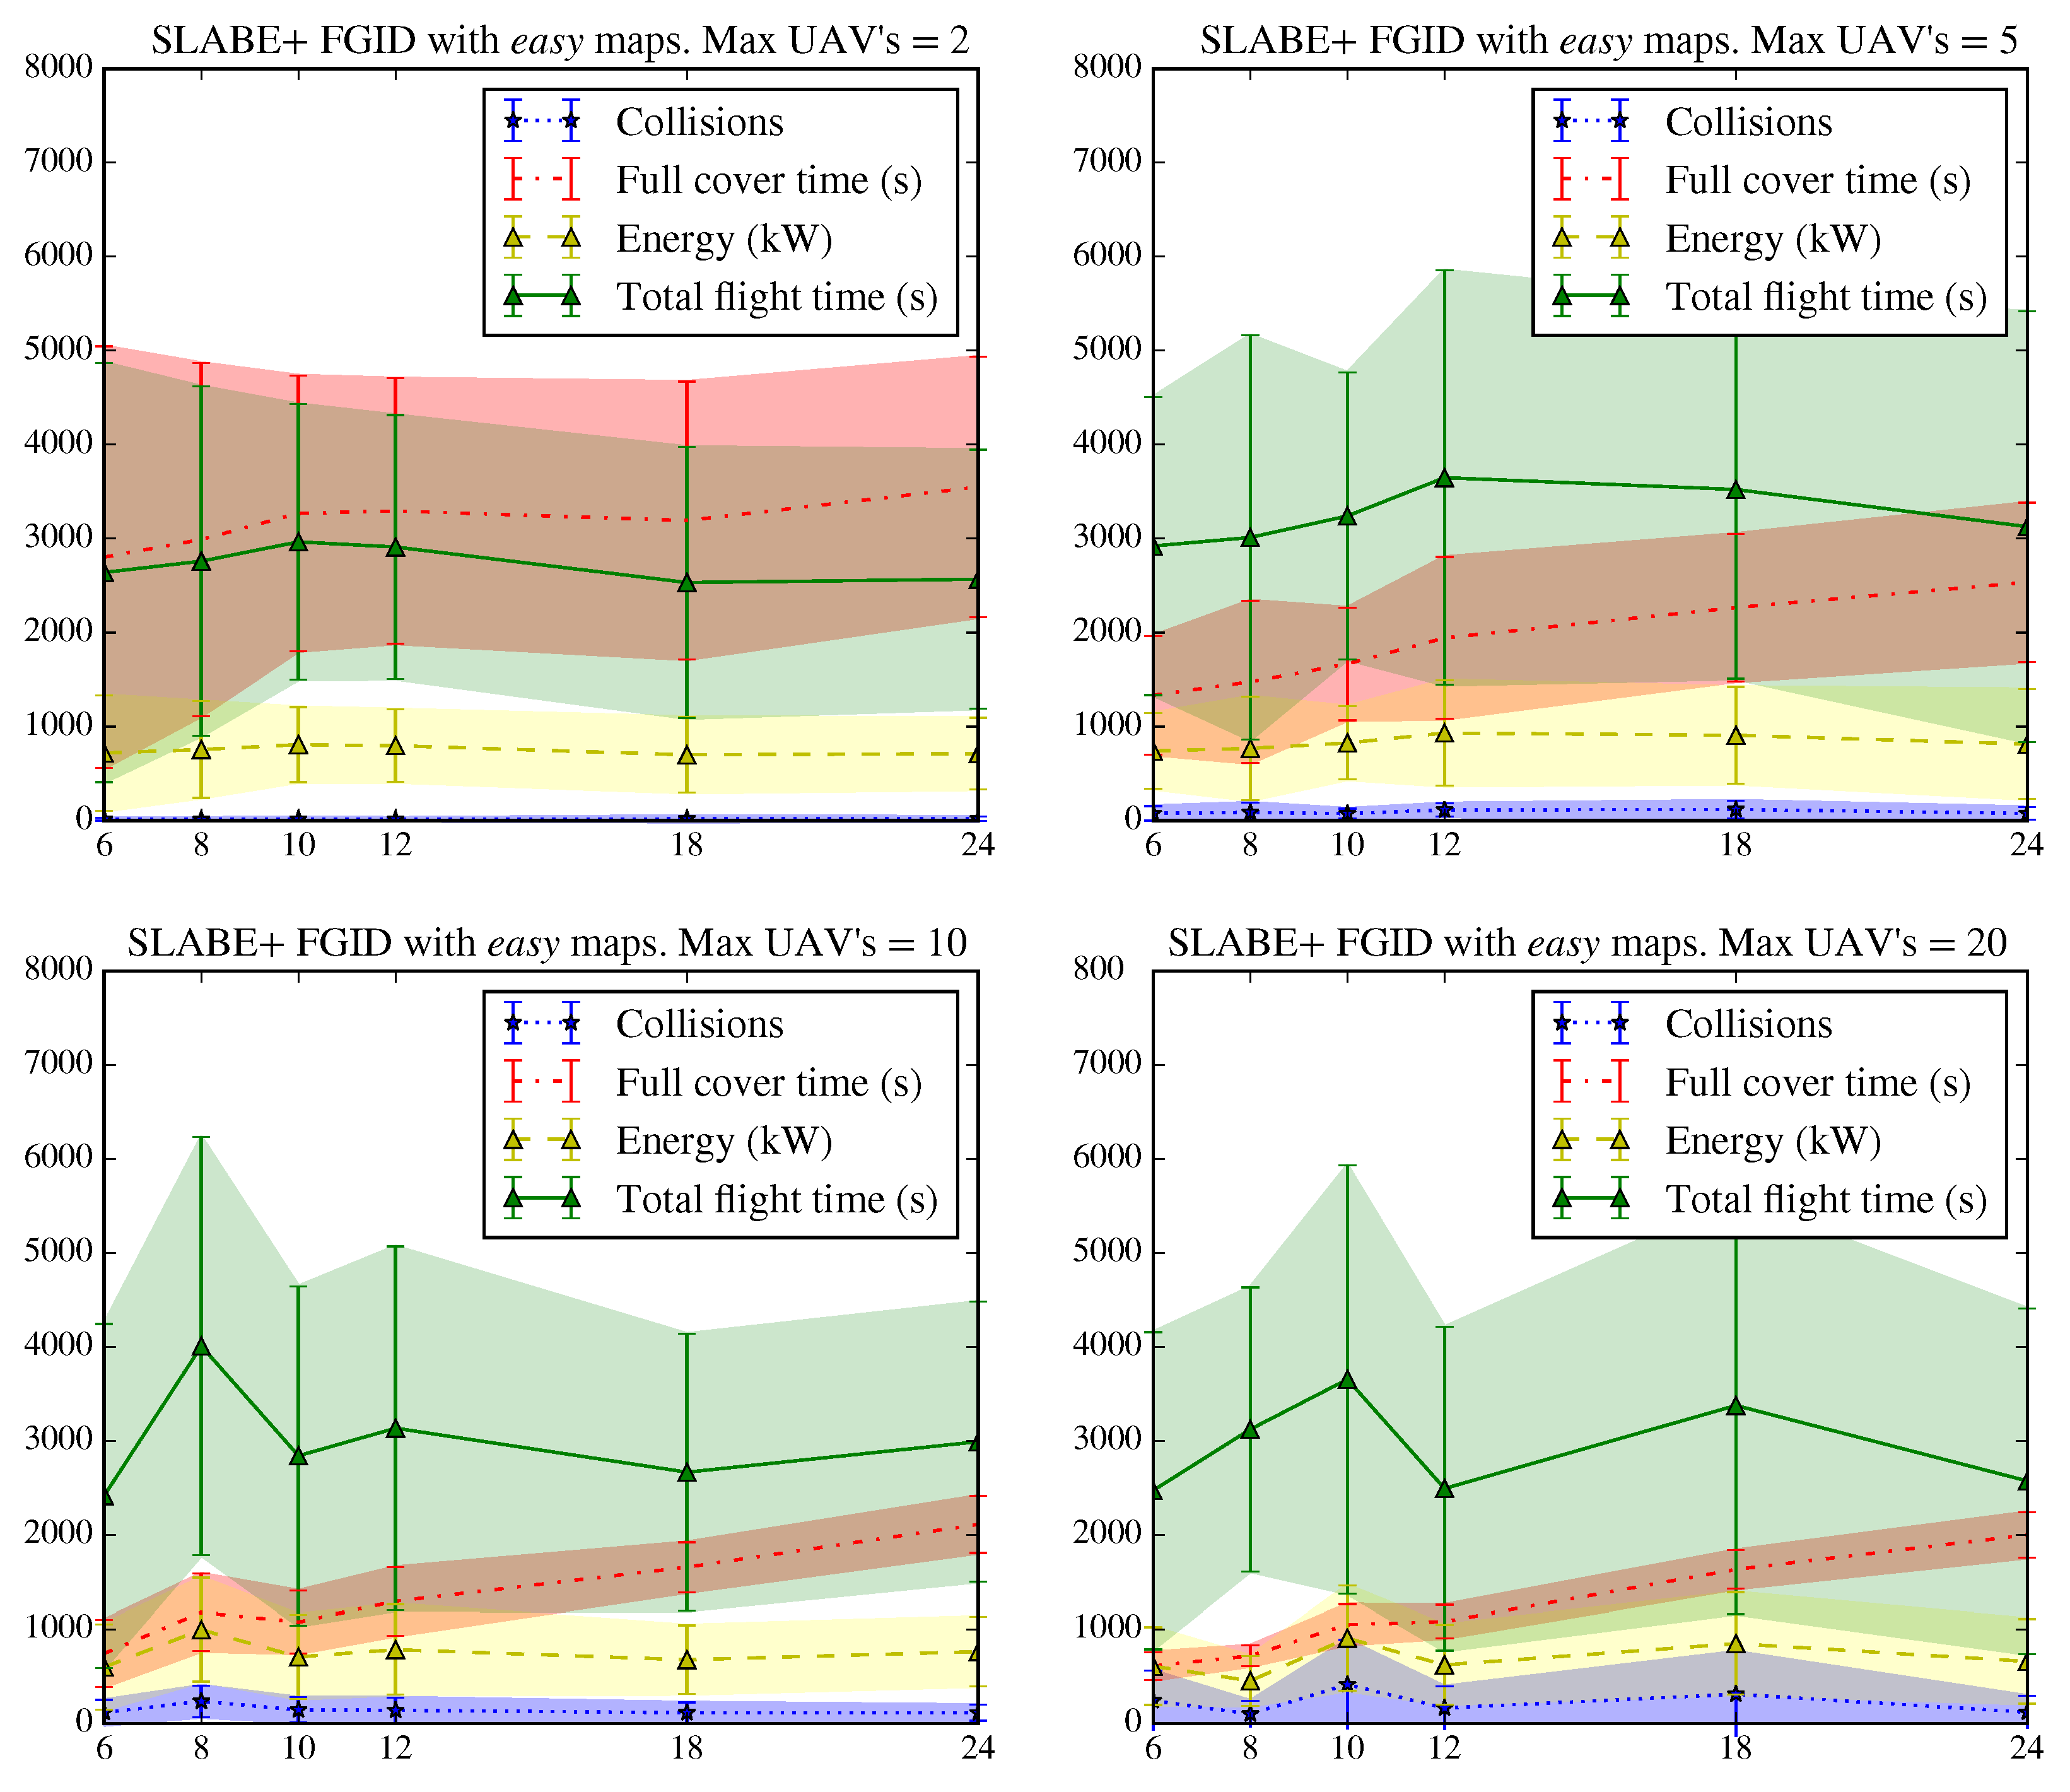
Figure 16 and
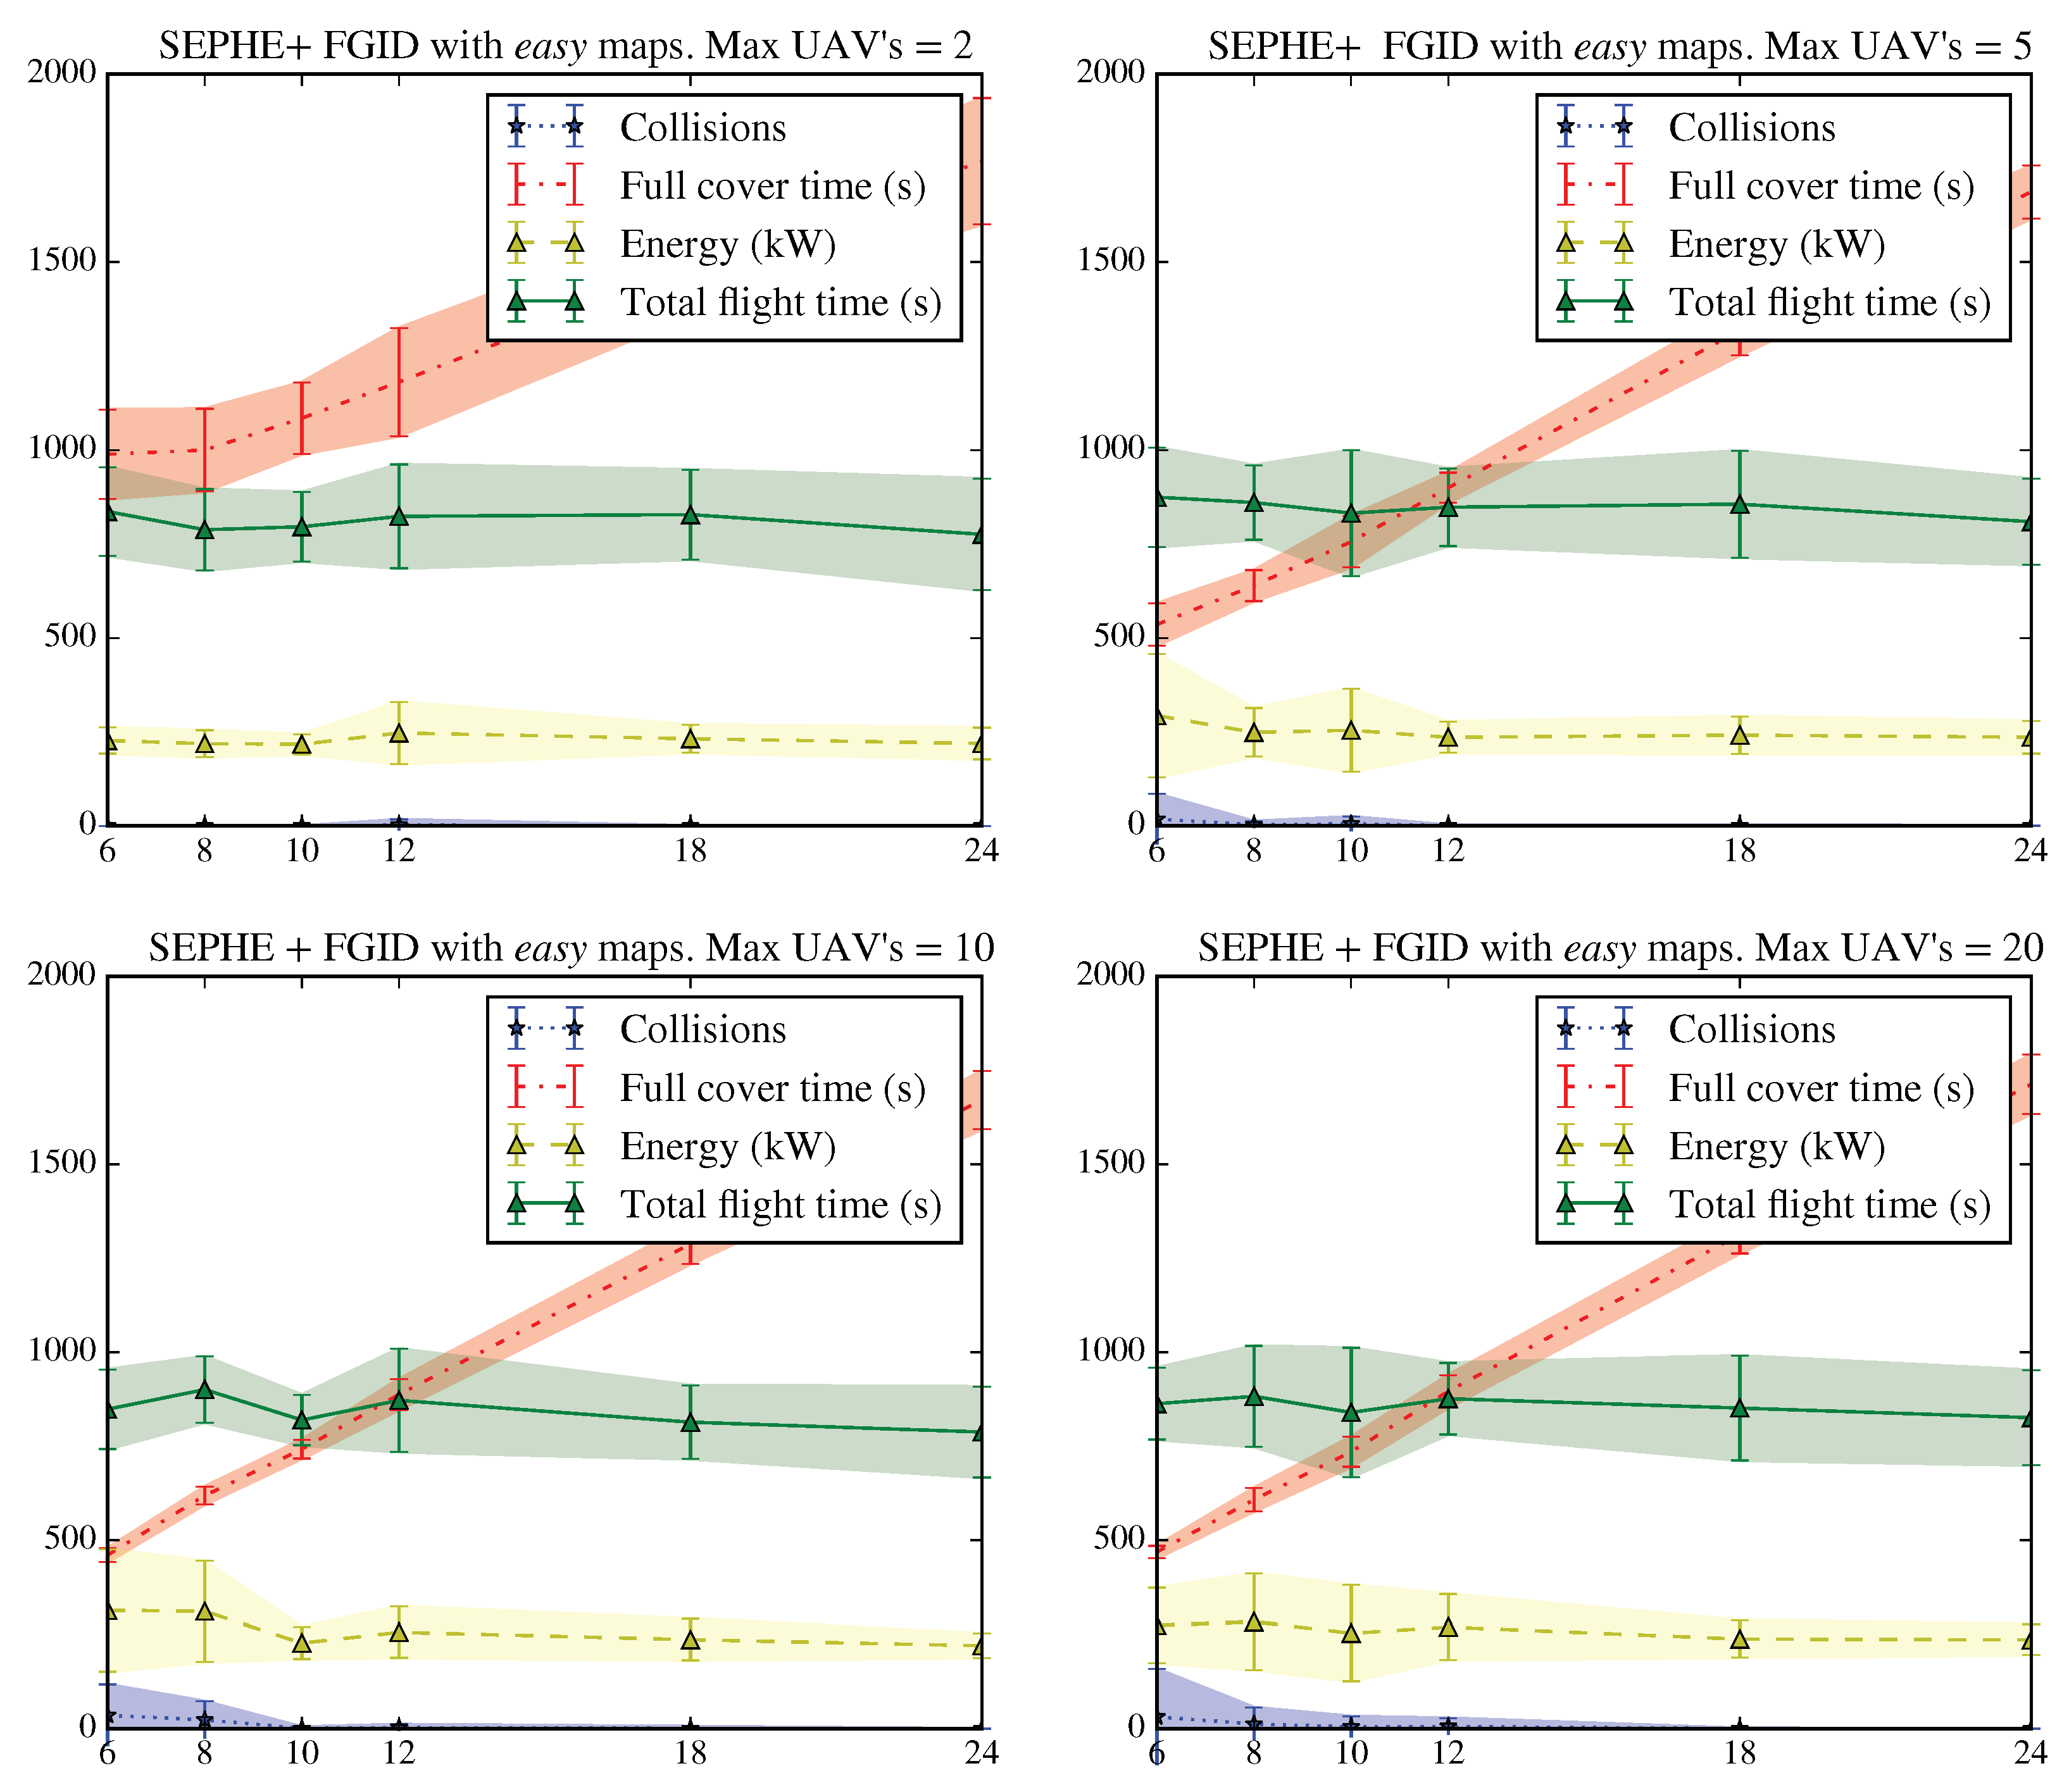
Figure 17 show the tests performed for the SLABE and SEPHE behaviors, respectively, using the FGID deployment strategy for different take-off time intervals and maximum number of vehicles on
easy maps.
In this case, we observe a great variability in the energy consumption and total flight time of the swarm with a reduced maximum number of vehicles, which is important for SLABE behavior. This variability is substantially reduced as the number of vehicles used increases.The SLABE behavior is more constant with respect to energy consumption, which is lower and has less variability in the case of SLABE, even with a limited number of vehicles. The number of collisions increases as the maximum number of vehicles flying in parallel increases. The take-off time interval, which affects the maximum number of active vehicles increases, also affects collisions, as in the previous case.
When the maximum number of active vehicles in the swarm increases, the energy consumption remains constant or even decreases slightly. These results indicate that the energy cost of adding new active agents is balanced by the contribution to swarm deployment. It is important to emphasize that the variability of the energy use decreases as the maximum number of active vehicles increases. However, beyond 5 active drones, the deployment time remains almost constant, regardless of the number of active agents.
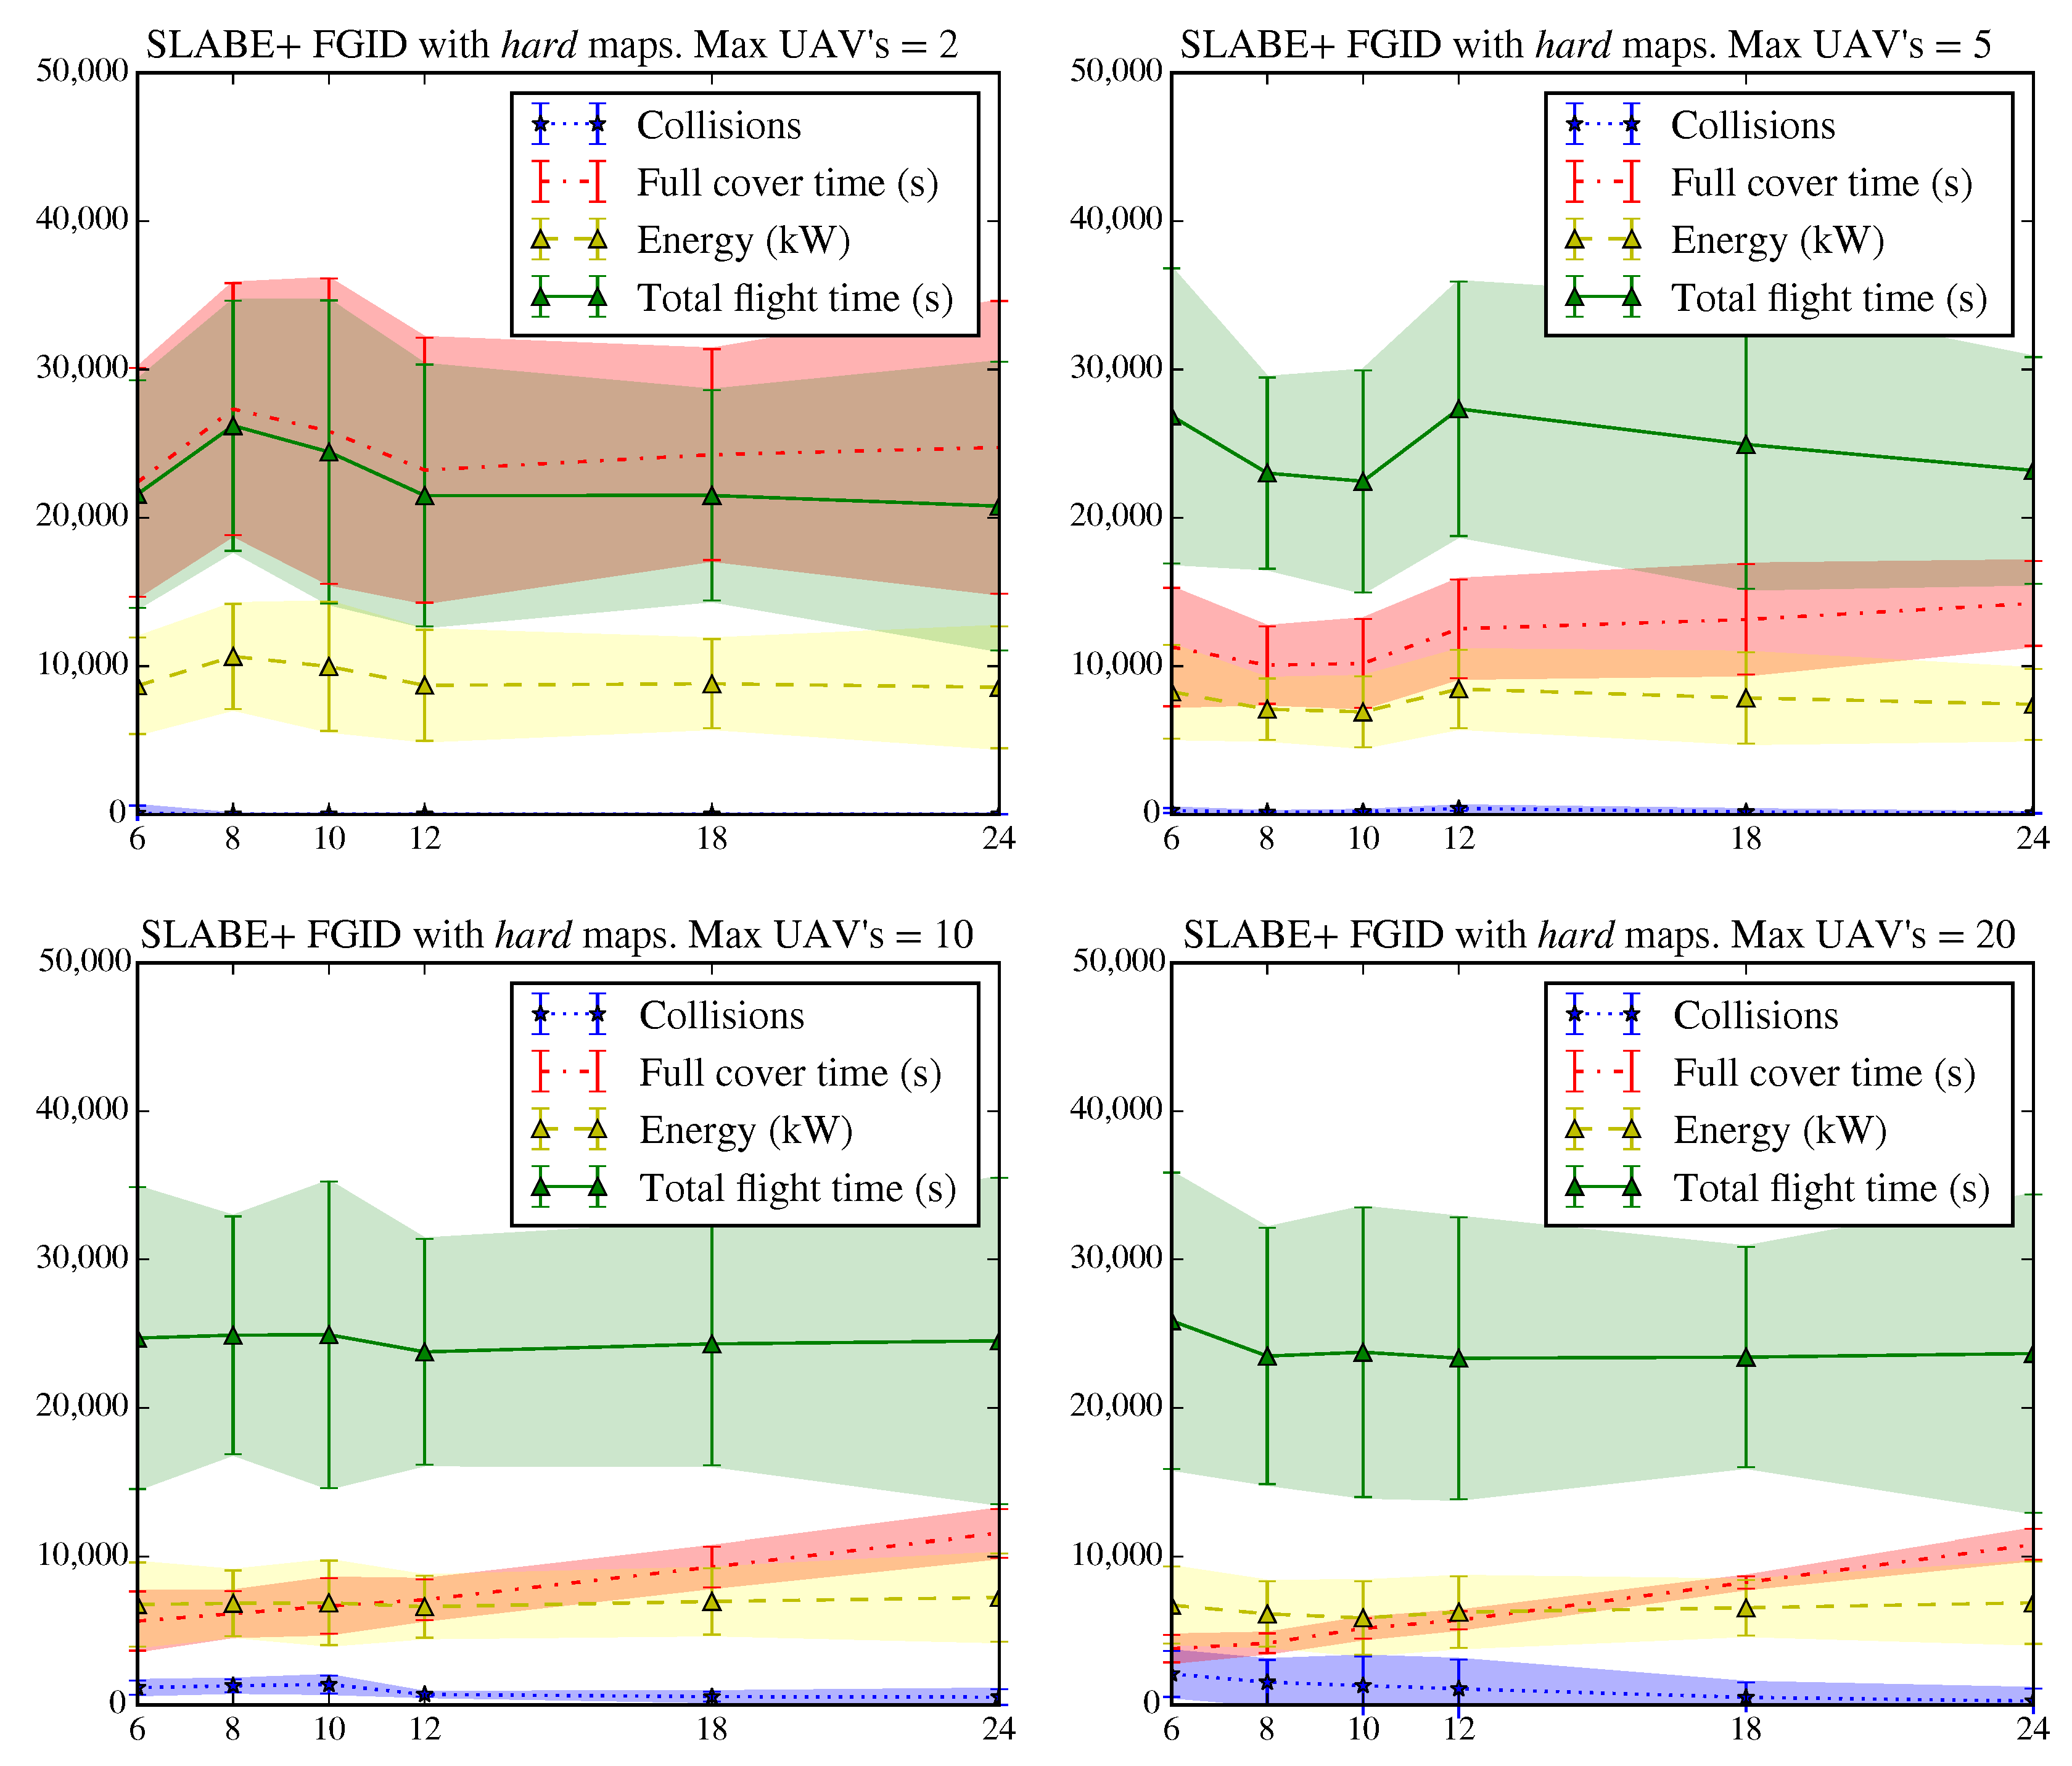
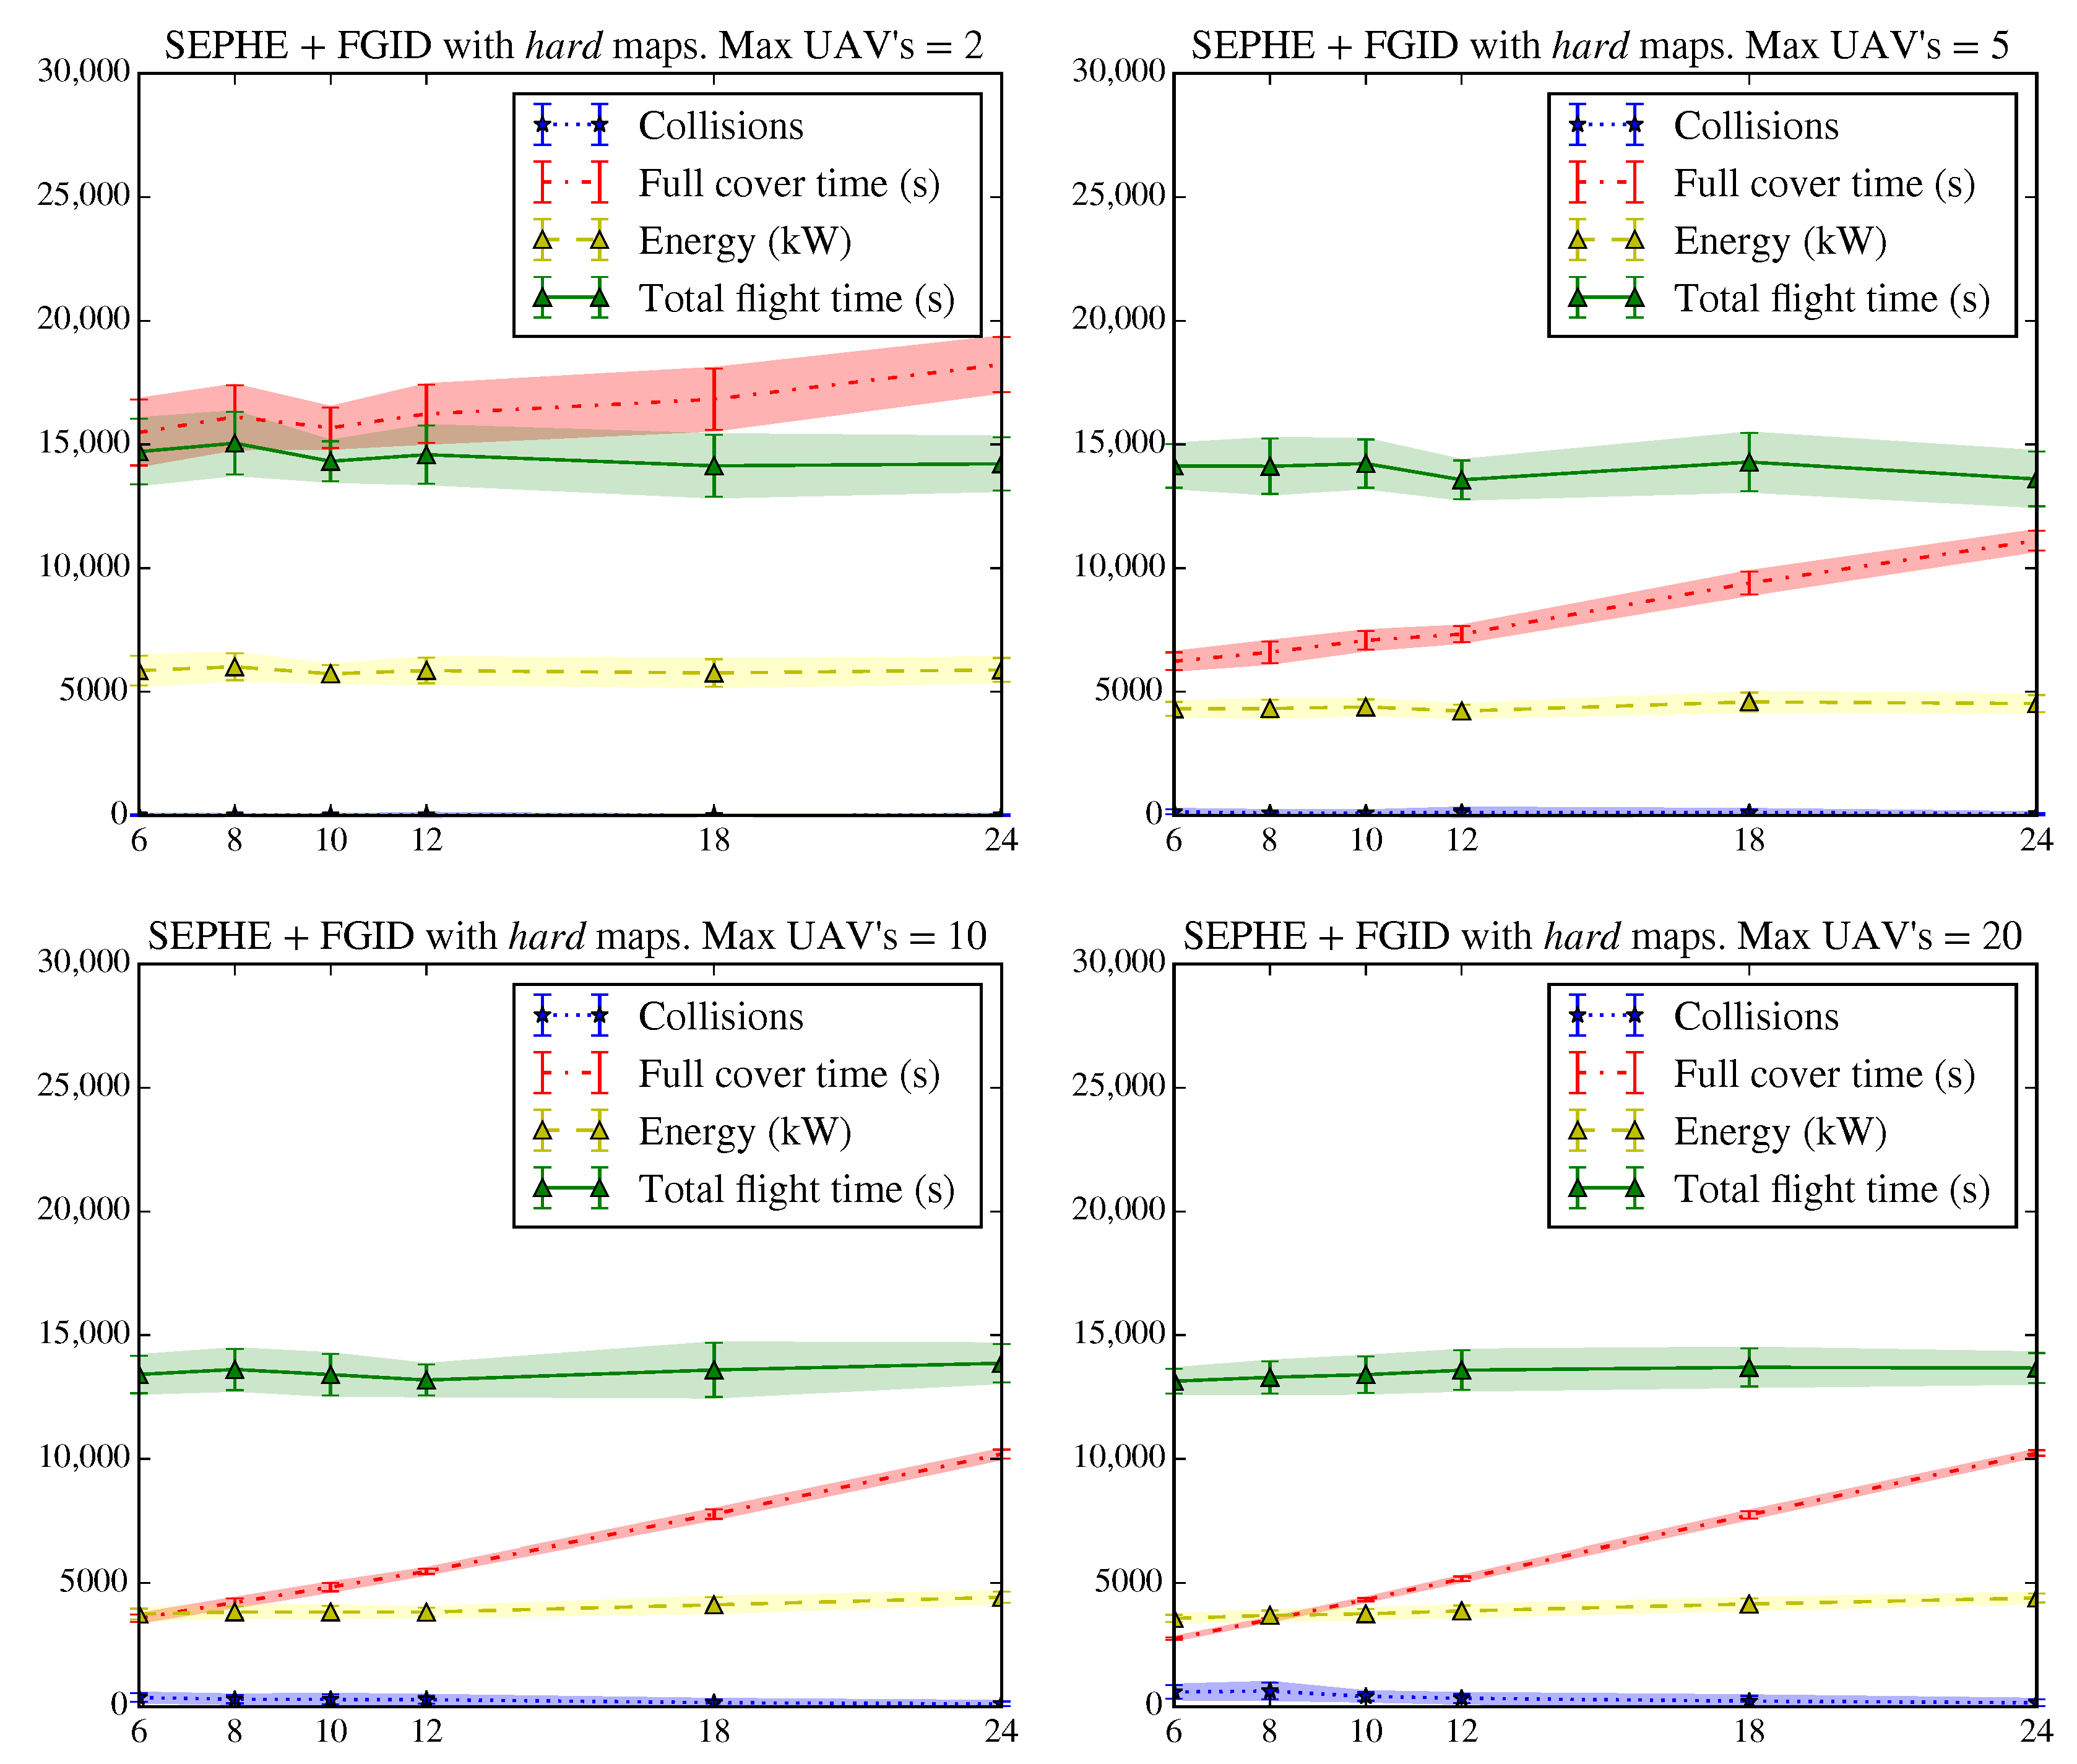
It is interesting to compare the previous results with those presented in
Figure 18 and
Figure 19 for complex maps. In this case, the time required to complete the deployment, the energy consumed and the number of collisions increase substantially. The SLABE behavior shows greater variability in all the observed variables. However, we can see that for a sufficient number of active individuals (greater than or equal to 10), both the time and energy consumption are comparable to those of the SEPHE behavior. In complex environments, the decrease in energy used due to increasing the take-off time interval is not appreciable, which indicates that shorter take-off time intervals are better when the deployment time decreases. However, collisions between devices will increase.
5. Discussion
From the above data, we can draw some interesting conclusions regarding several of the aspects analyzed. Below, we will analyze the two types of proposed behavior, as well as the different deployment strategies.
5.1. Comparison of SLABE and SEPHE Behaviors
Two behaviors based on pheromones have been proposed to solve a common deployment task in unstructured environments. The behaviors differ mainly in the sensory needs required for their implementation. The SLABE strategy is much simpler and does not require a system for local positioning, which is required by the SEPHE strategy.
In all the tests, both behaviors have shown that they are capable of achieving satisfactory coverage of the environment, taking into account the energy limitations imposed by the dynamics of the UAVs of the swarm.
The data appear to confirm that a lower resolution of the location sensor corresponds to a higher collision rate and higher energy consumption of the swarm. We believe that this is due to the low resolution of the stigmergy sensor used in the SLABE approach. This sensor is not continuous and does not produce guidance information at all points in space, so the behavior is more subject to variation. The increase in energy cost is determined by the granularity of the stigmergy sensor and by the indirect increase in the number of collisions.
However, it is important to note that the average deployment times in both cases are comparable. We believe this to be an important conclusion since it reinforces the thesis that a swarm with a greater number of less-informed individuals can perform the same task as a swarm with a smaller number of more-informed individuals.
If a system of stigmergy is available, as required by the SEPHE behavior, we can expect lower variability in all the parameters analyzed and a shorter time to achieve complete deployment. The systems required by each individual will increase the cost of the swarm. However, a swarm of low-cost drones with basic sensors can be used to develop a strategy with an average deployment time very similar to that of the SEPHE behavior at the cost of a higher probability of collision, greater energy needs (assuming that the drones that execute the behaviors have the same individual consumption) and a greater variability (but a much lower total cost).
However, the devices that can execute the SLABE behavior can weigh less, thereby drastically reducing the energy consumption. Therefore, the SLABE behavior may require less energy for its implementation (as observed in
Figure 14, where the drones develop a realistic energy model based on the requirements of ARDrone commercial drones).
5.2. Take-Off Time Interval and Deployment Strategies
We considered how the take-off time interval and the different strategies used in the operation of the behaviors presented affected the results.
In the LTID strategy, the longer the take-off time interval is, the longer the deployment. However, for short take-off time intervals, the number of collisions between individuals increases considerably because the density of vehicles in a given area is not limited and therefore increases the probability of collision in the most active areas.
In general, the greater the number of active agents (shorter take-off time interval), the more energy is required. However, in some cases, a longer take-off time interval can increase, rather than decrease, the energy consumed by the swarm.
This result could be seen in wall maps with SLABE behavior because in some areas of the environment, there is not sufficient information about the beacons that provide robots with navigation information. Therefore, active robots develop a more random search behavior, increasing the flight time for some maps. The results indicate that for the LTID strategy, the best take-off time interval for the unstructured maps is between 12 and 18 s.
The FGID strategy, limits the maximum number of active vehicles that can circulate in the environment. The time required for deployment increases for low values of the maximum number of vehicles (2 or 5 vehicles maximum). However, for more than 10 vehicles, no substantial improvements and a greater probability of collision are observed, regardless of the behavior used. This probability stabilizes the results obtained for the LTID strategy, which has no limit on the number of active vehicles. This evidence suggests that between 10 and 20 active UAVs in parallel is optimal for large maps of the hard typology and between 5 and 10 active UAVs is optimal for small maps of the easy typology.
In general, it is convenient to limit the number of active individuals; therefore, the FGID strategy produces better results than those of the LTID strategy, at the cost of requiring mesh-type point-to-point communication (which allows the number of active individuals available at a given time to be known) and requiring to determine for a certain environment the maximum number of active agents.
6. Conclusions
In this article, two types of swarm behavior that use stigmergy as an indirect communication mechanism have been discussed. A microscopic model of both has been presented, considering the requirements for the final implementation. Specifically, SLABE behavior can be implemented with current hardware using drones and BLE beacons. The behavior has been tested via simulations; this behavior covers the environment and manages to develop a simple but effective stigmergy. In the same way, the SEPHE behavior manages to develop an environmental deployment with a more complex stigmergy sensor that requires local location.
Moreover, the information available under both behavior types affects several parameters. The average deployment time in both cases is comparable, even though there is greater variability in the least-informed option.
However, we consider it to be remarkable that for complex environments, the less-informed approach can complete the deployment process in a similar way to that of the informed approach but with a lower cost (both economic and energetic). This result reinforces the thesis of this type of system: many simple agents can perform the same task as complex agents when they perform appropriate behavior.
Finally, we have shown how the FGID strategy gives better results than those of the LTID strategy. It is advisable to use mesh-type point-to-point communication (where the number of active individuals available at any given time is known) whenever possible. Otherwise, LTID is an effective deployment process that does not require a communications infrastructure.
Now that the performance of both behaviors has been demonstrated, our future line of research will test these behaviors on real robots and adjust the microscopic model used on physical robots.

