Abstract
Emotion detection is an important research issue in electroencephalogram (EEG). Signal preprocessing and feature selection are parts of feature engineering, which determines the performance of emotion detection and reduces the training time of the deep learning models. To select the efficient features for emotion detection, we propose a maximum marginal approach on EEG signal preprocessing. The approach selects the least similar segments between two EEG signals as features that can represent the difference between EEG signals caused by emotions. The method defines a signal similarity described as the distance between two EEG signals to find the features. The frequency domain of EEG is calculated by using a wavelet transform that exploits a wavelet to calculate EEG components in a different frequency. We have conducted experiments by using the selected feature from real EEG data recorded from 10 college students. The experimental results show that the proposed approach performs better than other feature selection methods by 17.9% on average in terms of accuracy. The maximum marginal approach-based models achieve better performance than the models without feature selection by 21% on average in terms of accuracy.
1. Introduction
An electroencephalogram (EEG) is a biosignal that reflects brain activity. In the environment of artificial intelligence, the analysis of EEG is an important research area. It can help medical staff perform intelligent diagnosis, such as epilepsy and Alzheimer [1,2,3,4]. Emotion recognition is an important research issue in EEG, and emotions can be reflected in EEG [5,6]. For example, the emotions of fear and tension have different waveforms on the EEG. These waveforms are not obvious but play an important role in the research area of the brain–computer interface (BCI) and emotion recognition [7,8,9]. Peoples can observe different emotions based on computers and intelligent machines by utilizing BCI technologies. It can help people understand emotions on some occasions, such as at social events [10].
Signal preprocessing and feature selection play an important role in emotion detection, which can remove the noise from the EEG signal and select correlated features with emotions to improve the performance of deep learning models [11,12]. It also can reduce the training time of deep learning model. Existing methods for selecting features from EEG signals to detect emotions mainly have univariate, multivariate, filter, wrapper, and built-in methods. The univariate methods input single feature to the model and multivariate methods consider grouping the features as inputs to train the classifications [13,14]. The filter methods evaluate the correlation between features and emotions to filter some features that are not useful for emotion detection [15,16]. The wrapper methods select features based on the accuracy of the classification [17]. If the input features increase the accuracy, the features are selected. The built-in methods are applied in the classifications, such as deep learning models [18]. They select features by observing the weight of each feature. The features with low weights are dropped since they are not useful for emotion detection. These approaches focus on the difficulty of EEG-based emotion detection, which discovers the correlation between features and emotions from EEG signals.
To select the valuable features, we propose an approach on EEG signal preprocessing to select features. The selected features indicate the least similar segments between two classes of EEG signals. The signal similarity is defined as follows.
Definition 1
(Signal similarity). The signal similarity is described as the distance between two signals and , which is formulated as . The signal similarity is negatively related with the distance.
Figure 1 gives the segments of two EEG signals with different emotions on two time intervals. The similarity between the two signals at the first time interval is smaller than the second time interval. The segments at the first time interval are selected as the features for detecting emotions.
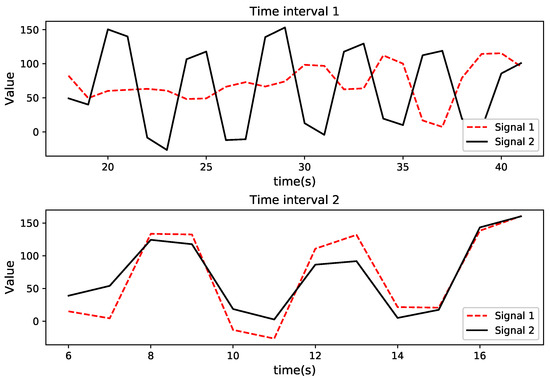
Figure 1.
Example of the maximum marginal feature.
The proposed method selects the features from the frequency domain of EEG. The frequency domain is helpful to preprocess and analyze EEG. The EEG signal on time domain is hard to analyze since it usually combines with noise caused by different behaviors. To research the EEG produced by specific behavior, we have to remove the noise. The frequency of noise is different from regular brain waves so that the noise can be detected on the frequency domain.
Wavelet transform is a popular tool for time-frequency analysis [19,20]. It overcomes the shortcoming of short-time Fourier transformation that the filter window size does not change with frequency. It utilizes a wavelet to decompose EEG into an approximate component and a detail component. The approximate component consists of the low frequency band of EEG, and the detail component consists of a high frequency band. The difference of EEG signals is reflected in the high frequency band so that the features are selected on the detail component.
The main contributions of this study are as follows.
- We propose a maximum marginal approach (MM) on the EEG signal preprocessing for emotion detection. It defines the similarity of two class signals and selects the feature on the frequency domain. The results show that MM performs better than other feature selection methods on emotion detection.
- We conducted experiments on real EEG data by applying the selected features to bi-direction long short-term memory model (BiLSTM). The results show that the MM-based models performed better than the models without signal processing. The MM-based BiLSTM achieved better performance than others.
The remainder of this paper is organized as follows. In Section 2, studies related to the emotion detection and feature selection are described. In Section 3, the maximum marginal feature selection method is detailed. In Section 4, the BiLSTM model is detailed. In Section 5, the experimental results are presented. Finally, in Section 6, some concluding remarks regarding this study are provided.
2. Related Work
Deep learning is the most popular supervised learning architecture, and some studies are related to the EEG classification by using deep learning. Ni et al. [21] used a BiLSTM to classify the student’s brain activity. It gave ten college students courses and classified whether these students feel confused about the contents of courses. They found that the high frequency component of EEG is most important for identifying the emotion. Chao et al. [22] proposed that the existing methods for the emotion recognition based on EEG ignore the spatial information. They constructed a multi-band feature matrix to record the frequency domain and spatial information of EEG. The capsule networks are used to learn the feature from the matrix for classifying emotions. Li et al. [18] constructed a neural network that can capture the spatial and temporal relationships of EEG electrodes. They considered the neuroscience and mentioned that brain regions play different roles when a human feels a different emotion.
Feature selection is an important method in EEG signal preprocessing, and existing methods are based on machine learning and statistical-based methods. Sun et al. [23] applied an unsupervised learning method to extract features from EEG. They mentioned that supervised learning methods lead to a decrease in the performance of EEG classification. They utilized an echo state network to construct a recurrent autoencoder for extracting features from EEG. Rahman et al. [24] combined principal component analysis (PCA) and t-statistics for feature extraction. It utilized PCA to reduce the dimension of EEG and used t-statistics to select valuable features. According to the experimental results, the neural network performed the best compared to other models. Alyasseri [25] selected features from the frequency domain by using a wavelet transform for the identification system. Hong et al. [26] considered a combination of EEG and functional near-infrared spectroscopy (fNIRS) as features to identify patients with cognitive and motor impairments. The experimental results show that the average of fNIRS and the highest frequency band of EEG have a value for diagnosing.
Converting the signal from the time domain to the frequency domain for analysis is a common EEG signal preprocessing method. Wavelet transform is a general tool for decomposing EEG to the frequency domain, and many studies applied wavelet transform to analyze the EEG signal. Bhattacharyya et al. [27] applied wavelet transform to determine amplitudes and frequencies of seizure patients from an adaptive frequency band in the EEG signal. They utilized the wavelet transform to calculate the frequency domain of EEG and used a slice window to extract the patterns from frequency components. These patterns are used to detect the seizure. Gupta et al. [28] utilized wavelet transform based on the Fourier–Bessel series expansion to get the frequency domain of EEG. The least-squares support vector machine is used to classify epilepsy. The proposed system can detect epilepsy automatically. Follis et al. [29] applied maximal overlap wavelet transform to decompose EEG signal. The Kruskal–Wallis test was used for the difference in the wavelet variances for detecting seizure and non-seizure. The experimental results show that no pattern can be evidenced for detecting seizures. Jiao et al. [30] utilized wavelet transform to extract the frequency domain from EEG and electro-oculogram. The long short-term memory (LSTM) model is utilized to learn these features for detecting diver sleepiness.
3. Maximum Marginal Approach
This section describes the maximum marginal approach on EEG signal preprocessing, which is to select segments where the detail component of EEG signals are least similar. These segments represent the difference in brain waves caused by emotions so that they are utilized to detect emotions.
3.1. Detail Components Set Construction
Wavelet transform is a decomposition of EEG based on the frequency. It utilizes a scalable and shiftable wavelet to decompose the EEG for calculating the frequency components. The narrow scale indicates that the frequency is high, while the wide scale indicates low frequency. The wavelet transform is formulated as follows.
where a indicates the scale, indicates translation, t is time. In addition, is EEG and is the wavelet signal. Wavelet transform utilizes a wavelet to infinitely approximate the EEG by changing the scale and translation for calculating the detail and approximate components. The frequency of EEG is the reciprocal of scalar a, and the corresponding time is represented as the translation . Emotions can cause small changes in EEG, and these changes are observed in the detail component. We construct a set to include each EEG signal’s detail component. The detail component is defined as follows:
Definition 2
(Detail component). The detail component of EEG signal is computed by using wavelet transform, which is formulated as d. The set consists of detail component of EEG signal, which is formulated as
As shown in Figure 2, there are two detail components and of EEG signals with different emotions, which are extracted by using wavelet transform. The set consisting of these two components is formulated as .
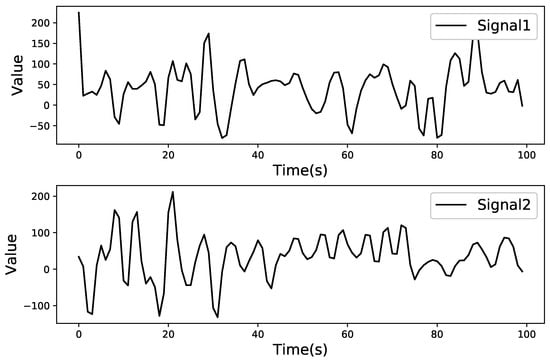
Figure 2.
Example of the detail component set.
A discrete wavelet transform utilizes a wavelet to decompose the EEG signal for N times. Figure 3 shows an example of a two-level wavelet transform for decomposing EEG signal, where and indicate the approximate and detail component at the level n, respectively. The approximate component and detail component at level 1 can be calculated after the first decomposition of EEG. The detail component at level 2 can be calculated by applying wavelet transform on the approximate component at level 1.
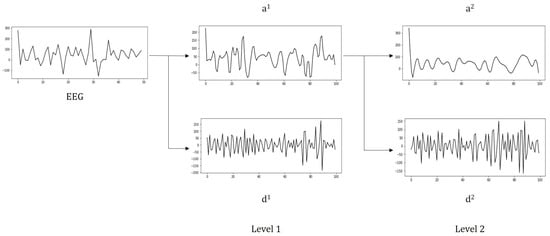
Figure 3.
Example of two-level wavelet transform.
3.2. Feature Selection
To find out the time interval where the segment of two classes signals are least similar, we calculate the dot product for the average of two classes signals. We assume that there are two classes of EEG signals with different emotions and the sets of detail components are formulated as and , where i and j indicate number of EEG signals in two sets, and , respectively. The average signals of two classes EEG are calculated as and . The similarity between signals and is formulated as . The dot product of signals and is calculated to divide the time interval for EEG signal, which is formulated as .
Figure 4 shows the dot product of two signals and at each time point where the x-axis is time, the y-axis is the dot product between two signals, and the 0-axis is the horizontal axis with a dot product of 0. The EEG is divided into four time intervals based on the area between the dot product of signals and the 0-axis. The similarity at each time interval is formulated as , where and are the start time and end time of the time interval, respectively. The segments with the least similarity between two signals and are selected as the features. The selected features indicate the components of the brain waves caused by different emotions.
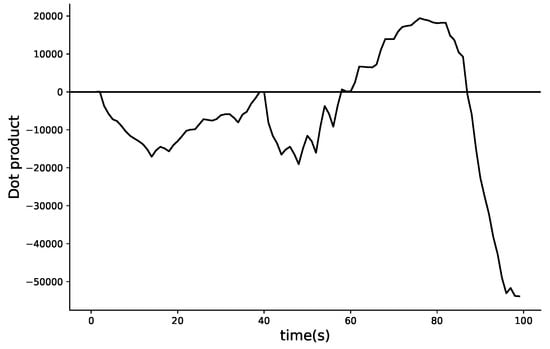
Figure 4.
The dot product of signals at each time point.
4. BiLSTM Network
BiLSTM is utilized to detect emotions by using the selected features, which constructs a bi-direction recurrent network by using LSTM units [31]. It can capture the past and future information to detect emotions by using non-linear functions.
BiLSTM consists of forward LSTM and backward LSTM. The main idea of LSTM is to forget the information that is not useful for detecting emotion and pass the valuable information to the future time point.
As shown in Figure 5, each LSTM unit consists of a forget gate, input gate, and output gate. The information transmission of the LSTM unit is based on the forget gate. It receives the previous hidden state and current information to determine whether the information is not useful for detecting emotions. The input gate utilizes previous cell state , previous hidden state , and current information to obtain the current cell state C. The output gate is used to give the probability of two emotions by using the current information or previous information. For each LSTM unit, each gate at time t is calculated as
where is sigmoid function, is hyperbolic tangent function, C is the cell states, and h is the hidden states. The forget gate, output gate, and input gate are formulated as f, o, and i. The weight and basis of each gate are formulated W and b. The input of each function is calculated by using the current signal value and the previous hidden state . The input of the first LSTM unit only has the current signal value.
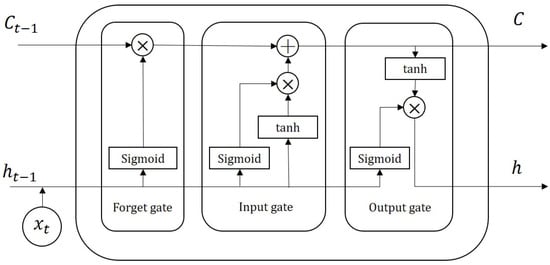
Figure 5.
Architecture of a LSTM unit.
Figure 6 gives an example of EEG-based emotion detection by using BiLSTM, where the input is the selected segments, indicates the value at t, indicates the hidden state of forward LSTM, and indicates the hidden state of backward LSTM. The forward LSTM processes the signal from the left to right, and it utilizes hidden layers to pass the information. The current hidden state is calculated based on the previous hidden state and the current input . The backward LSTM passes the future information to the history unit and the previous hidden state is calculated based on the current hidden state and the input .
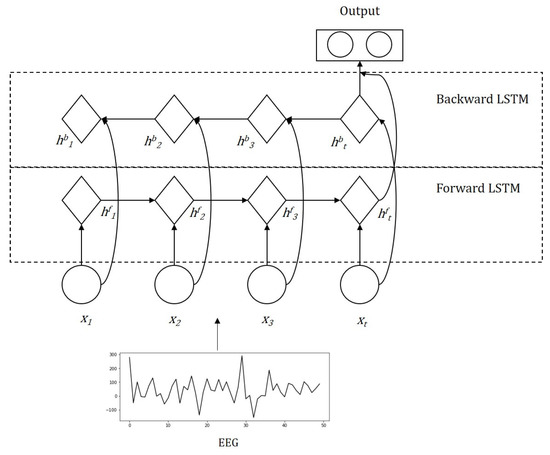
Figure 6.
Example of EEG-based emotion detection by using BiLSTM.
We formulate the weights of BiLSTM as , the loss function of the BiLSTM is established based on the cross entropy, which is formulated as where y indicates the real emotion, indicates the detected emotion, and N indicates number of EEG signals. The training of the model is to calculate weights W and basis b for minimizing the loss function L. The gradient descent algorithm is used to update the parameters W and b, which is formulated as and where indicates the learning rate [32]. The initial parameters are given randomly. To update the parameters W and b at each layer, the backward propagation algorithm is utilized, which is based on the chain rule to calculate the partial derivatives of compound functions [33].
5. Experimental Results
This section analyzes the experimental results of the maximum marginal approach on EEG signal preprocessing. The selected features are validated by applying to detect emotions. We extracted the frequency components of EEG signals by using the ppwt library that is a module of wavelet transform in python and constructed classifications by using the torch and scikit-learn libraries. The code and dataset are detailed in our GitHub (https://github.com/ligen0423/EEG-based-emotion-detection.git).
5.1. Dataset
The dataset is collected from the study [34], which contains EEG data recorded from 10 college students. The EEG dataset records the brainwave while these students watch massive open online course clips. The EEG data have been labeled depending on whether or not the students are confused about the video content. The brainwave is collected from MindSet equipment. They prepared 20 videos, and each video was 2 min long. Each student was given ten videos, and the equipment recorded the brainwave of students. Most of these students were 24 years old, including eight Han Chinese and eight male students.
5.2. Results and Analysis
The maximum marginal approach is utilized to select the features, we apply the selected features to the BiLSTM model for detecting emotions. K nearest neighbor (KNN), convolutional neural network (CNN), LSTM, and neural network (NN) are selected as baselines to validate the proposed approach. KNN is a machine learning model that detects emotions based on the class of the nearest neighbor. NN is utilizing non-linear functions to extract the features from the EEG signal for detecting emotions. It does not consider the time of EEG signals. CNN utilizes convolutional kernels for the local sampling of input. LSTM is based on the recurrent neural network that utilizes forget gates to drop some information that is not useful in detecting emotions.
Table 1 shows the comparison results under the discrete wavelet transform on level 1. According to the results, MM-based BiLSTM achieves the highest performance on the accuracy, precision, and F1-score. The reason is that BiLSTM model considers the bi-directional temporal information of the EEG signals. Since the precision and the recall affect each other, the recall of MM-based BiLSTM is lower than LSTM. Overall, in the results, MM-based classifications perform better than the classifications without signal preprocessing. This indicates that the proposed maximum marginal approach can improve the performance of emotion detection.

Table 1.
Comparison results under the discrete wavelet transform on level 1.
Figure 7 shows the performance of the discrete wavelet transform by using MM-based BiLSTM, where the x-axis represents the level, and the y-axis represents the value of each evaluation metrics. The proposed approach achieves the best performance at level 1 with an accuracy of 0.86. With the improvement of the level, accuracy, precision, and F1-score show a downward trend. When the level is greater than 6, these three evaluation metrics of the method tends to be stable. With the increase in the level, the small features are difficult to be selected, so the metrics of emotion detection has decreased. When the level is greater than 6, the recall of the method has decreased.
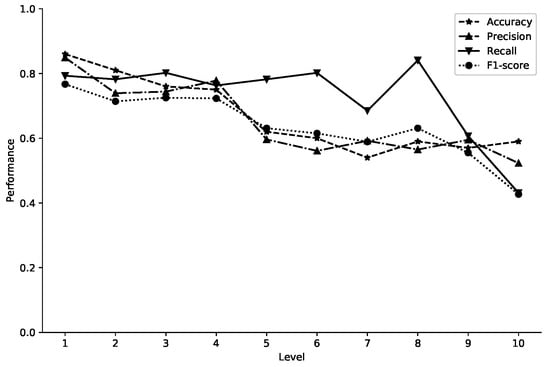
Figure 7.
The performance of MM-based BiLSTM.
Table 2 shows the comparison results between different feature selection methods. We utilized the wrapper, built-in, filter, and fisher score to conduct a comparison experiment. For the wrapper method, we input the EEG signal at each time point to obtain the performance. The features of the wrapper method are selected with the best performance. The built-in method is to select the features by obtaining the weights of the BiLSTM model’s weights. The Fisher score is selecting the features by calculating the variances of two classes of EEG signals. The proposed maximum marginal approach achieves the best performance on the accuracy, precision, and F1-score. In addition, it achieves a lower result than wrapper and fisher score on the recall.
Table 2.
Comparison results under the BiLSTM model.
6. Conclusions
In this paper, we propose a maximum marginal approach to EEG signal preprocessing for emotion detection. The approach selects the features that are the least similar segments between EEG signals from the detail components. In the future, we can apply the proposed approach to select and study bispectrum features from the EEG signals for diagnosing [35,36]. The proposed approach includes a time interval division method based on the dot product between two signals. It can be used in other time-series domains, such as in financial series and meteorological series in future research. Our experiments verify the performance of different models based on the selected features for emotion detection. The experimental results show that the proposed approach performs better than other feature selection methods by 17.9% on average in terms of accuracy. The MM-based models achieve better performance than the models without feature selection by 21%, on average, in terms of accuracy. We validate the performance by using the discrete wavelet transform. The results show that the first-level of wavelet transform achieves the best performance on emotion detection tasks. As the level increases, the evaluation metrics of accuracy, precision, and F1-score exhibit a downward trend. If the wavelet transform levels are more than 6, the performance tends to be stable.
Author Contributions
Conceptualization, G.L.; methodology, G.L.; software, G.L.; validation, G.L. and J.J.J.; formal analysis, G.L.; investigation, G.L.; resources, G.L.; data curation, G.L.; writing—original draft preparation, G.L.; writing—review G.L. and J.J.J.; supervision, J.J.J.; project administration, J.J.J.; funding acquisition, J.J.J. All authors have read and agreed to the published version of the manuscript.
Funding
This work was supported by the National Research Foundation of Korea (NRF) grant funded by the Korea government (MSIP) (NRF-2019K1A3A1A80113259).
Conflicts of Interest
The authors declare no conflict of interest.
References
- Tsipouras, M.G. Spectral information of EEG signals with respect to epilepsy classification. EURASIP J. Adv. Signal Process. 2019, 2019, 10. [Google Scholar] [CrossRef]
- Khan, K.A.; Shanir, P.; Khan, Y.U.; Farooq, O. A hybrid Local Binary Pattern and wavelets based approach for EEG classification for diagnosing epilepsy. Expert Syst. Appl. 2020, 140, 112895. [Google Scholar] [CrossRef]
- Gupta, V.; Pachori, R.B. Epileptic seizure identification using entropy of FBSE based EEG rhythms. Biomed. Signal Process. Control 2019, 53, 101569. [Google Scholar] [CrossRef]
- Li, Y.; Liu, Y.; Cui, W.G.; Guo, Y.Z.; Huang, H.; Hu, Z.Y. Epileptic seizure detection in EEG signals using a unified temporal-spectral squeeze-and-excitation network. IEEE Trans. Neural Syst. Rehabil. 2020, 28, 782–794. [Google Scholar] [CrossRef] [PubMed]
- Pandey, P.; Seeja, K. Subject independent emotion recognition from EEG using VMD and deep learning. J. King Saud Univ. Comput. Inform. Sci. 2019. [Google Scholar] [CrossRef]
- Xing, X.; Li, Z.; Xu, T.; Shu, L.; Hu, B.; Xu, X. SAE+ LSTM: A New framework for emotion recognition from multi-channel EEG. Front. Neurorobot. 2019, 13, 37. [Google Scholar] [CrossRef]
- Li, Z.; Qiu, L.; Li, R.; He, Z.; Xiao, J.; Liang, Y.; Wang, F.; Pan, J. Enhancing BCI-Based Emotion Recognition Using an Improved Particle Swarm Optimization for Feature Selection. Sensors 2020, 20, 3028. [Google Scholar] [CrossRef]
- Jin, L. Emotion Recognition based BCI using Channel-wise Features. In Proceedings of the 2020 CHI Conference on Human Factors in Computing Systems, Honolulu, HI, USA, 25–30 April 2020; pp. 1–6. [Google Scholar]
- Huang, H.; Xie, Q.; Pan, J.; He, Y.; Wen, Z.; Yu, R.; Li, Y. An EEG-based brain computer interface for emotion recognition and its application in patients with Disorder of Consciousness. IEEE Trans. Affect. Comput. 2019. [Google Scholar] [CrossRef]
- Jirayucharoensak, S.; Pan-Ngum, S.; Israsena, P. EEG-based emotion recognition using deep learning network with principal component based covariate shift adaptation. Sci. World J. 2014, 2014. [Google Scholar] [CrossRef]
- Xu, X.; Wei, F.; Zhu, Z.; Liu, J.; Wu, X. Eeg Feature Selection Using Orthogonal Regression: Application to Emotion Recognition. In Proceedings of the 45th International Conference on Acoustics, Speech and Signal Processing (ICASSP), Virtual Barcelona, Span, 4–8 May 2020; pp. 1239–1243. [Google Scholar]
- Li, G.; Lee, C.H.; Jung, J.J.; Youn, Y.C.; Camacho, D. Deep learning for EEG data analytics: A survey. Concurrency and Computation: Practice and Experience 2020, 32, e5199. [Google Scholar] [CrossRef]
- Rathi, S.; Kaur, B.; Agrawal, R. Enhanced Depression Detection from Facial Cues Using Univariate Feature Selection Techniques. In International Conference on Pattern Recognition and Machine Intelligence; Springer: Berlin/Heidelberg, Germany; pp. 22–29.
- Nemrodov, D.; Ling, S.; Nudnou, I.; Roberts, T.; Cant, J.S.; Lee, A.C.; Nestor, A. A multivariate investigation of visual word, face, and ensemble processing: Perspectives from EEG-based decoding and feature selection. Psychophysiology 2020, 57, e13511. [Google Scholar] [CrossRef] [PubMed]
- Taran, S.; Bajaj, V. Emotion recognition from single-channel EEG signals using a two-stage correlation and instantaneous frequency-based filtering method. Comput. Methods Programs Biomed. 2019, 173, 157–165. [Google Scholar] [CrossRef] [PubMed]
- Ghosh, M.; Kundu, T.; Ghosh, D.; Sarkar, R. Feature selection for facial emotion recognition using late hill-climbing based memetic algorithm. Multimed. Tools Appl. 2019, 78, 25753–25779. [Google Scholar] [CrossRef]
- He, H.; Tan, Y.; Ying, J.; Zhang, W. Strengthen EEG-based emotion recognition using firefly integrated optimization algorithm. Appl. Soft Comput. 2020, 94, 106426. [Google Scholar] [CrossRef]
- Li, Y.; Zheng, W.; Wang, L.; Zong, Y.; Cui, Z. From Regional to Global Brain: A Novel Hierarchical Spatial-Temporal Neural Network Model for EEG Emotion Recognition. IEEE Trans. Affect. Comput. 2019. [Google Scholar] [CrossRef]
- Anuragi, A.; Sisodia, D.S. Alcohol use disorder detection using EEG Signal features and flexible analytical wavelet transform. Biomed. Signal Process. Control 2019, 52, 384–393. [Google Scholar] [CrossRef]
- Aydemir, E.; Tuncer, T.; Dogan, S. A Tunable-Q wavelet transform and quadruple symmetric pattern based EEG signal classification method. Med. Hypotheses 2020, 134, 109519. [Google Scholar] [CrossRef]
- Ni, Z.; Yuksel, A.C.; Ni, X.; Mandel, M.I.; Xie, L. Confused or not confused? Disentangling brain activity from eeg data using bidirectional lstm recurrent neural networks. In Proceedings of the 8th ACM International Conference on Bioinformatics, Computational Biology, and Health Informatics, Boston, MA, USA, 20–23 August 2017; pp. 241–246. [Google Scholar]
- Chao, H.; Dong, L.; Liu, Y.; Lu, B. Emotion recognition from multiband EEG signals using CapsNet. Sensors 2019, 19, 2212. [Google Scholar] [CrossRef]
- Sun, L.; Jin, B.; Yang, H.; Tong, J.; Liu, C.; Xiong, H. Unsupervised EEG feature extraction based on echo state network. Inf. Sci. 2019, 475, 1–17. [Google Scholar] [CrossRef]
- Rahman, M.A.; Hossain, M.F.; Hossain, M.; Ahmmed, R. Employing PCA and t-statistical approach for feature extraction and classification of emotion from multichannel EEG signal. Egypt. Inf. J. 2020, 21, 23–35. [Google Scholar]
- Alyasseri, Z.A.A.; Khadeer, A.T.; Al-Betar, M.A.; Abasi, A.; Makhadmeh, S.; Ali, N.S. The effects of EEG feature extraction using multi-wavelet decomposition for mental tasks classification. In Proceedings of the International Conference on Information and Communication Technology, Baghdad, Iraq, 1–8 April 2019; pp. 139–146. [Google Scholar]
- Hong, K.S.; Khan, M.J.; Hong, M.J. Feature extraction and classification methods for hybrid fNIRS-EEG brain-computer interfaces. Front. Hum. Neurosci. 2018, 12, 246. [Google Scholar] [CrossRef]
- Bhattacharyya, A.; Pachori, R.B. A multivariate approach for patient-specific EEG seizure detection using empirical wavelet transform. IEEE Trans. Biomed. Eng. 2017, 64, 2003–2015. [Google Scholar] [CrossRef] [PubMed]
- Gupta, V.; Pachori, R.B. Classification of focal EEG signals using FBSE based flexible time-frequency coverage wavelet transform. Biomed. Signal Process. Control 2020, 62, 102124. [Google Scholar] [CrossRef]
- Follis, J.L.; Lai, D. Variability analysis of epileptic EEG using the maximal overlap discrete wavelet transform. Health Inf. Sci. Syst. 2020, 8, 1–12. [Google Scholar] [CrossRef]
- Jiao, Y.; Deng, Y.; Luo, Y.; Lu, B.L. Driver Sleepiness Detection from EEG and EOG signals Using GAN and LSTM Networks. Neurocomputing 2020, 408, 100–111. [Google Scholar] [CrossRef]
- Yang, J.; Huang, X.; Wu, H.; Yang, X. EEG-based emotion classification based on Bidirectional Long Short-Term Memory Network. Procedia Comput. Sci. 2020, 174, 491–504. [Google Scholar] [CrossRef]
- Ruder, S. An overview of gradient descent optimization algorithms. arXiv 2016, arXiv:1609.04747. [Google Scholar]
- Cao, Q.; Parry, M.E. Neural network earnings per share forecasting models: A comparison of backward propagation and the genetic algorithm. Decis. Support Syst. 2009, 47, 32–41. [Google Scholar] [CrossRef]
- Wang, H.; Li, Y.; Hu, X.; Yang, Y.; Meng, Z.; Chang, K.m. Using EEG to Improve Massive Open Online Courses Feedback Interaction. In Proceedings of the 16th international conference on artificial intelligence in education, Memphis, TN, USA, 9–13 July 2013. [Google Scholar]
- Ieracitano, C.; Mammone, N.; Hussain, A.; Morabito, F.C. A novel multi-modal machine learning based approach for automatic classification of EEG recordings in dementia. Neural Netw. 2020, 123, 176–190. [Google Scholar] [CrossRef]
- Yean, C.W.; Wan Ahmad, W.K.; Mustafa, W.A.; Murugappan, M.; Rajamanickam, Y.; Adom, A.H.; Omar, M.I.; Zheng, B.S.; Junoh, A.K.; Razlan, Z.M.; et al. An Emotion Assessment of Stroke Patients by Using Bispectrum Features of EEG Signals. Brain Sci. 2020, 10, 672. [Google Scholar] [CrossRef]
Publisher’s Note: MDPI stays neutral with regard to jurisdictional claims in published maps and institutional affiliations. |
© 2020 by the authors. Licensee MDPI, Basel, Switzerland. This article is an open access article distributed under the terms and conditions of the Creative Commons Attribution (CC BY) license (http://creativecommons.org/licenses/by/4.0/).