Article

Global Mechanical Behavior Characterization of Uniaxially Loaded Rock Specimen Based on Its Structural Evolution

1
School of Aerospace Engineering, Beijing Institute of Technology, Beijing 100081, China
2
Flexible Optical Measurement Technology Center, Institute of Flexible Electronic Technology of THU, Jiaxing 314006, China
3
School of Civil Engineering, North China University of Technology, Beijing 100144, China
4
School of Naval Architecture, Ocean & Civil Engineering, Shanghai Jiaotong University, Shanghai 200240, China
*
Author to whom correspondence should be addressed.
Appl. Sci. 2020, 10(21), 7647; https://doi.org/10.3390/app10217647
Submission received: 9 October 2020 / Revised: 24 October 2020 / Accepted: 28 October 2020 / Published: 29 October 2020
(This article belongs to the Special Issue Evaluation of Geomechanical Characteristics)

Abstract

:
Characterizing global mechanical behavior accurately is important for a detailed understanding of the deformation mechanism of rock material. In this paper, a new characterization model of the global mechanical behavior of rock is proposed, based on the structural characteristics of rock deformation. Uniaxial compression tests were carried out using the digital image correlation method and acoustic emission to obtain the interrelationship between mechanical behavior and deformation evolution. The test results show that the appearance of deformation localization leads to non-linear evolution of global mechanical behavior in a rock specimen. Further, due to the gradual evolution of deformation localization bands, the rock specimen evolves from a complete whole to a rock structure with a “weak interlayer”. Thus, the global mechanical behavior of the rock specimen depends heavily on the structural evolution process, especially when close to failure. A simplified characterization model was established according to the deformation process. The finite element method was used to verify the rationality of the proposed structural model. The verification result showed that under uniaxial compression, the structural model can reproduce the global mechanical behavior evolution process of the rock specimen.

1. Introduction

Mechanical characterization methods for rock materials are crucial for continued developments in rock mechanics and stability assessment of rock masses in engineering projects [1]. Many characterization methods have been proposed by researchers to describe rock mechanical behavior conveniently and accurately [2,3,4,5].
Existing studies on the characterization methods of rock mechanical behavior can be categorized as either macroscopic or mesoscopic. Macroscopic characterization methods involve direct characterization by obtaining a mechanical response through experimental phenomena [6,7], and do not consider the deformation mechanism in detail. Theoretical models corresponding to the stress–strain curve obtained from experiments are used to characterize rock mechanical behavior [8]. However, these macroscopic characterization methods are extremely simplified in that they mainly focus on the change in the external characteristics of rock mechanical behavior from elastic to plastic [9]. Thus, more detailed rock mechanical characteristics and deformation mechanisms, especially close to failure, cannot be revealed by macroscopic characterization methods.
Mesoscopic methods involve carrying out several mesoscopic experiments to understand the relationship between mesoscopic deformation and rock mechanical behavior [10,11,12,13]. Mesoscopic models consider micro-crack development and damage evolution when characterizing rock mechanical behavior [14,15,16]. In addition, some numerical means, such as rock failure process analysis (RPFA) [17,18], particle flow code (PFC) [19], and the finite element method (FEM) [20], were also used to establish a numerical model, which was divided into several elements on the mesoscopic scale. For numerical models, simplified damage criteria for elements are first defined, following which the mechanical response of the model under loading is obtained. Although damage evolution was introduced in mesoscopic characterization models to describe the deformation state and strength characteristics of rock [21,22], the relationship between mesoscopic damage and global mechanical behavior is not clear. In addition, mesoscale models require complex calculations to characterize global mechanical behavior.
Notably, many experiment-based studies have shown that deformation localization is a necessary process in rock deformation and failure [23,24,25,26]. In fact, deformation localization is a macroscopic phenomenon attributed to the propagation and connectivity of micro-cracks in rock. The deformation localization band (DLB) constitutes the concentrated area of damage, and its material properties are obviously weaker than those of the other parts of the rock. After the formation of DLBs, the deformation of rock transforms into “structural control” [27,28,29], a very important characteristic of rock deformation. However, existing studies disregarded these structural evolution characteristics in the characterization of mechanical behavior. Structural evolution is a very important feature in the process of rock deformation, especially in the non-linear stage. Therefore, the structural characteristics must be considered when characterizing the mechanical behavior of rock. In this paper, we explore the structural deformation characteristics of rock and characterize the global mechanical behavior of rock from the perspective of structural evolution.
The remainder of this paper is organized as follows. Section 2 describes the uniaxial compression tests conducted in this study on marble specimens and analyses the deformation evolution characteristics of the specimens. The interrelationship between global mechanical behavior and different deformation stages was obtained. Based on the experimental results, a simplified structural model for the rock specimen is proposed in Section 3. Simulations with the FEM are used to verify the rationality of the structural model. Section 4 presents our conclusions.

2. Experimental Investigation of Structural Evolution of Rock Specimens

To explore the relationship between the global mechanical behavior and the deformation evolution characteristics of a rock specimen, uniaxial compression tests were carried out on marble specimens. The digital image correlation (DIC) [30,31,32] and acoustic emission (AE) methods [33,34] were combined to monitor the deformation information.

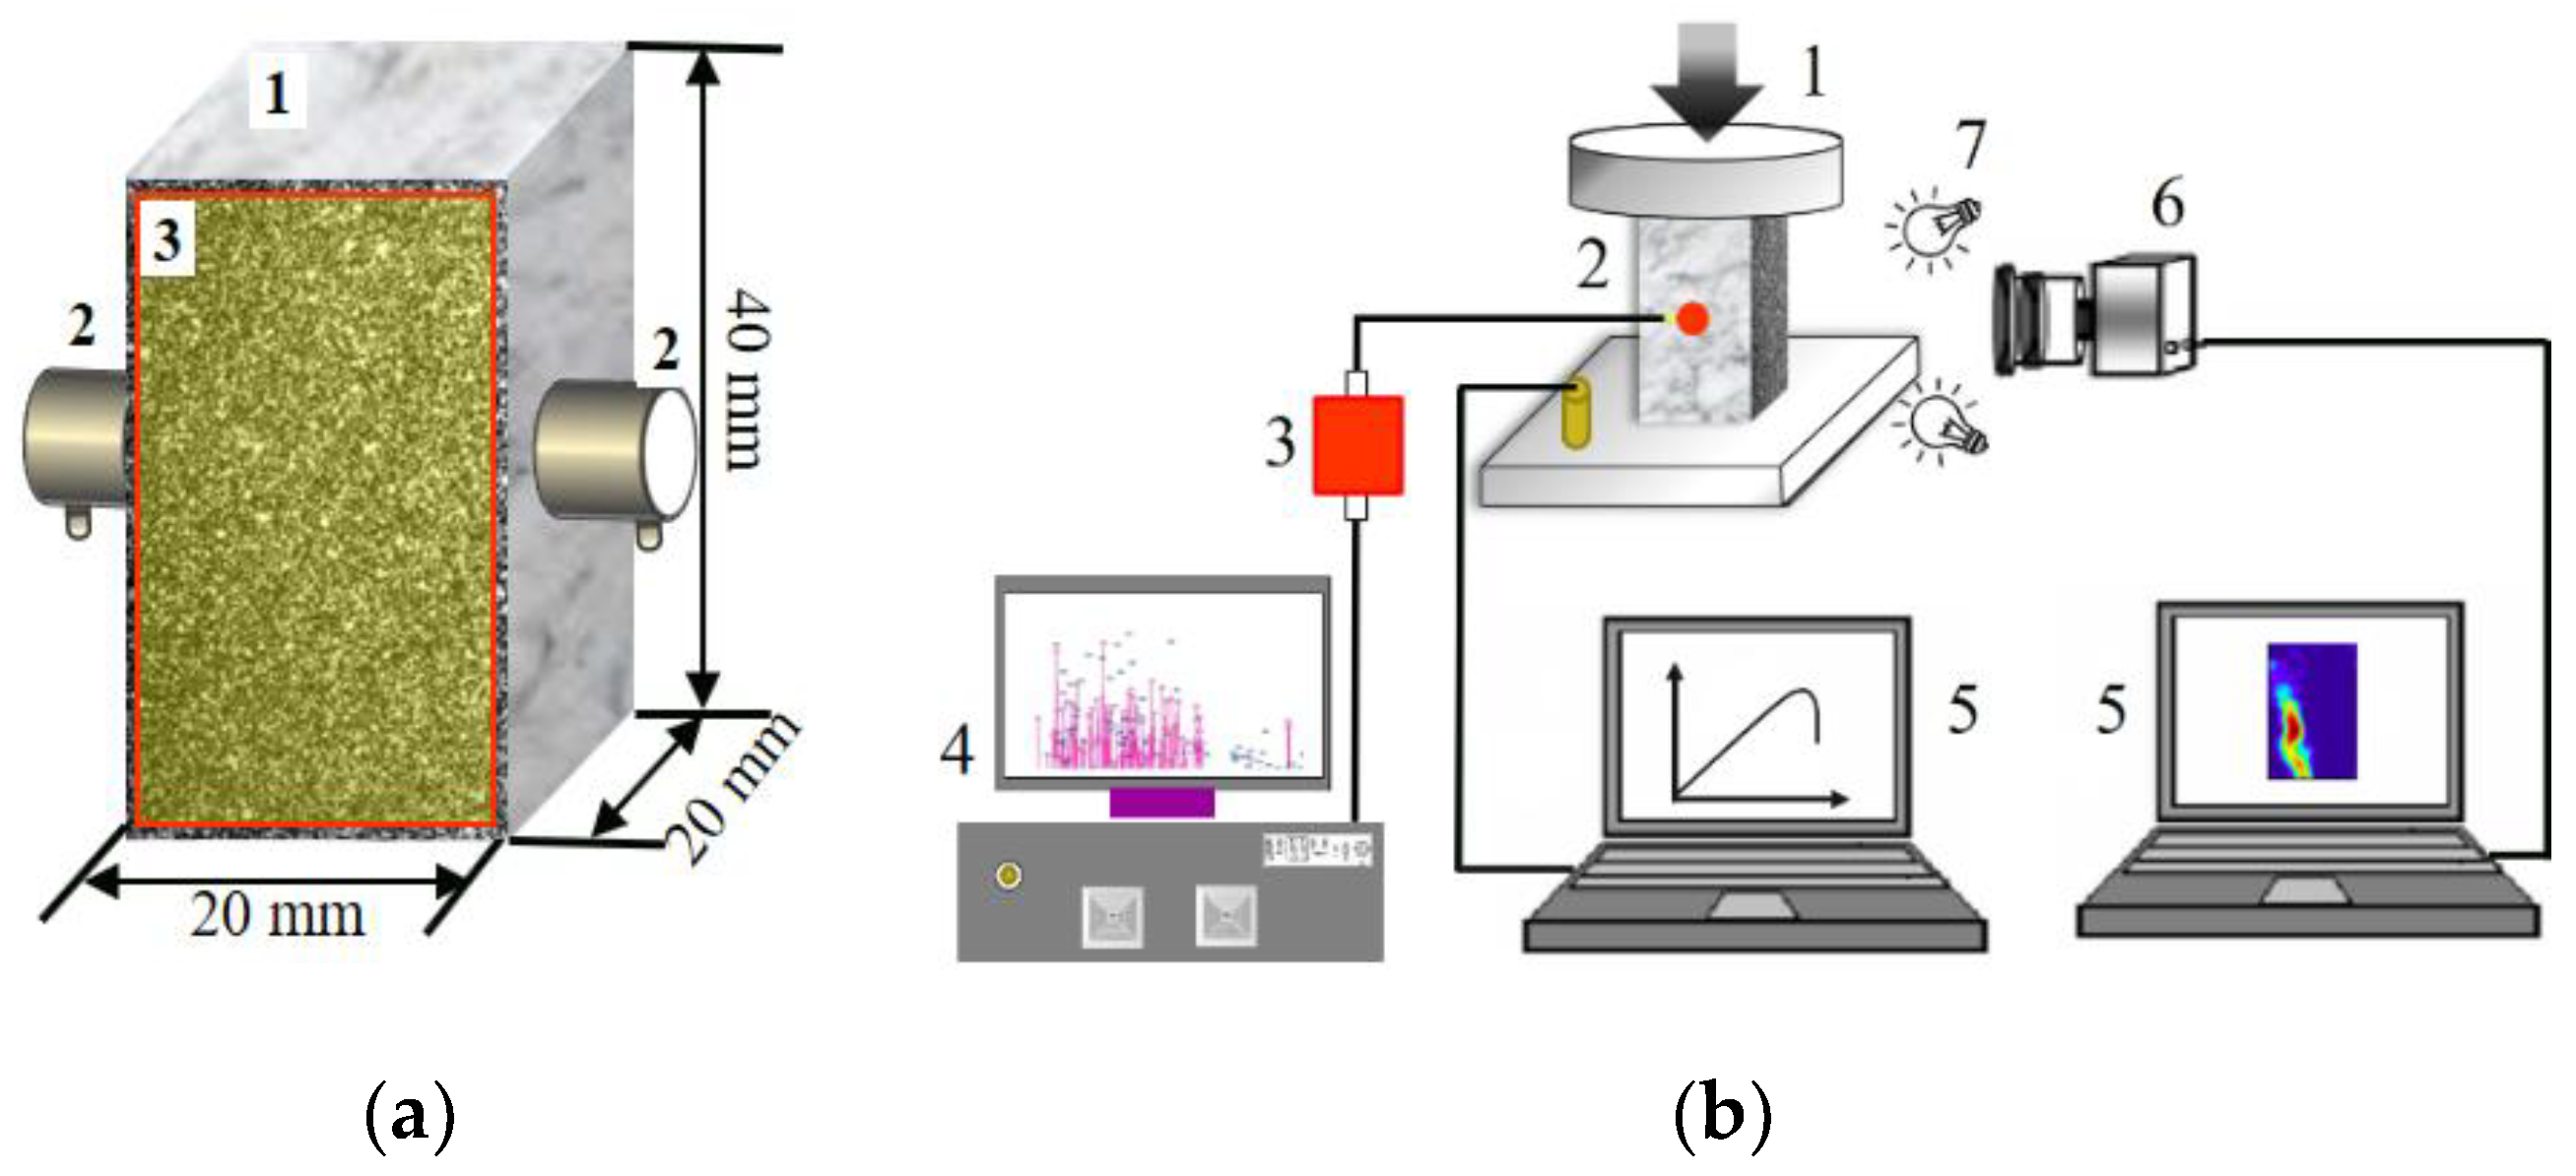
2.1. Experimental Setup and Procedures

The size of each specimen was 20 × 20 × 40 mm3. As shown in Figure 1a, one side of the specimen was painted with a random speckle pattern, and images of this pattern were captured by a charge-coupled device (CCD) camera (Basler-A641f, BASLER, Ahrensburg, Germany.) with a resolution of 1624 × 1236 pixels and a frame rate of 15 fps. The imaging recommendations reported by Zhu et al. [35] were considered in the present work. In addition, two AE sensors were positioned on the other two opposite surfaces of the specimen to monitor the AE signal, as illustrated in Figure 1a. The AE signals measured in the sensors were amplified by a gain of 40 dB with preamplifiers. In addition, a specified threshold value of 50 dB was set for the tests. The AE signal sampling rate was 2.5 MHz. The experimental system is shown in Figure 1b. The image acquisition and AE systems were strictly time calibrated before the experiments started, and were triggered at the same time. The specimens were compressed in the MTS-810 (MTS System Corporation, Minnesota, USA.) test machine and the loading was increased in displacement control mode with a speed of 0.02 mm/min. A preload of 0.5 kN was applied to clamp the specimen and compact the gap between the joints of the loading device. The loading value, speckle images, and AE data were recorded during the tests.
The stress–strain curve was obtained using the displacement and force data extracted from the test machine. Full-field strain (maximum shear strain) of the rock specimens was obtained using DIC [36] with a subset size of 25 × 25 pixels and a step size of 5 pixels. For AE data processing, the number of pulses in which the AE signal exceeded the threshold (i.e., AE ringing) was counted [37].

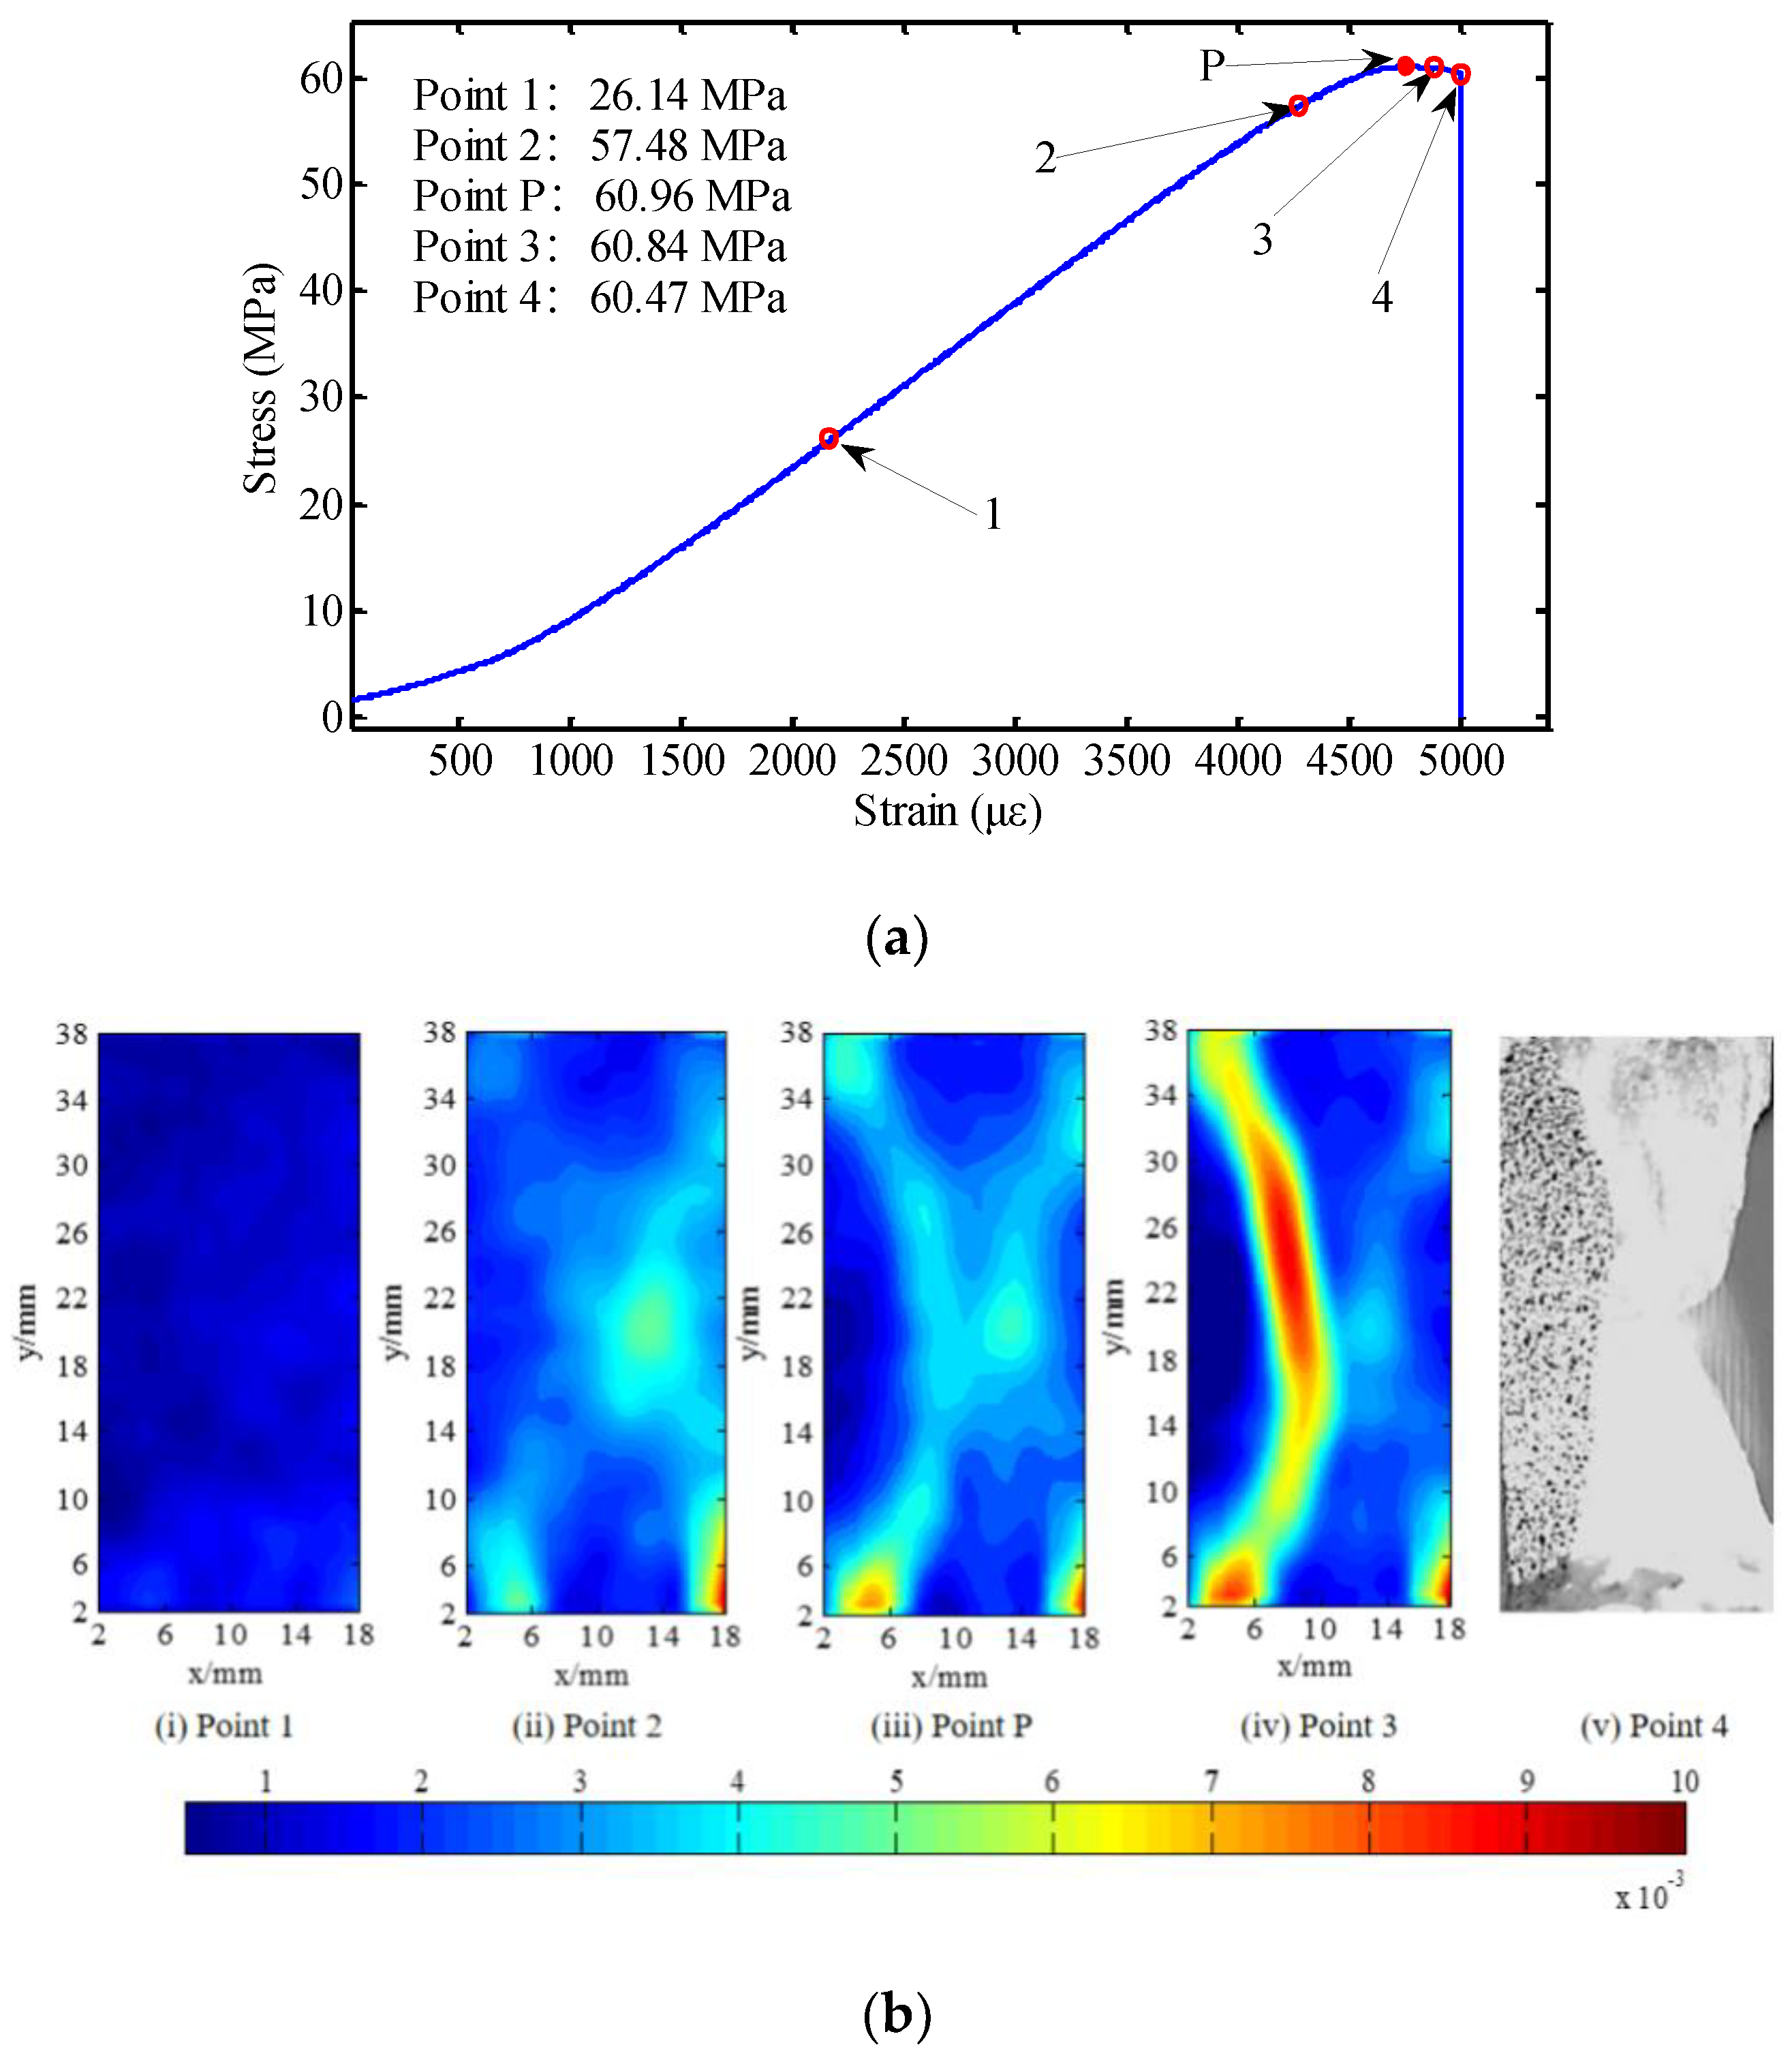
2.2. Experimental Results

Five specimens are loaded in the experiments. Although the evolution details and forms of DLB of these specimens are different, the law of the structural control is consistent. In order to analyses the characteristics of structural evolution in detail, the result of one of them is shown as follows. Figure 2a shows the stress–strain curve of the rock specimen, and in the x-axis με is the micro-strain. The maximum shear strain fields (points 1, 2, P, and 3 on the stress–strain curve) and failure form at point 4 are shown in Figure 2b. At point 1, the rock is still in the stage of elastic deformation, and the deformation field is almost homogeneous. At point 2, the stress–strain curve becomes non-linear, and strain concentration areas appear in the lower and middle part of the rock specimen. Thereafter, the existing strain concentration areas continue to increase, and develop into two obvious DLBs, shaped as “X” at point P, which is the peak point of the stress–strain curve. In the process of stress adjustment, one DLB can develop into the dominant DLB, while others will slow down or even stop developing. In the deformation localization process, the unbalanced evolution of the DLBs can be explained as the competitive process of forming the DLB. However, the DLB to the left becomes the dominant DLB at point 3, as shown in Figure 2b. Finally, a macro-crack appears at the location of the dominant DLB, and the rock specimen fails at point 4. The above deformation process analysis reveals a considerable difference in the evolution of DLBs before and after the peak stress point (point P). It is worth noting that there may be more than one DLB in the early stage of formation. In the evolution process of DLBs, there is a very strong competition mechanism between them. The competition is positive feedback, that is, when one of the DLBs’ development gains an advantage, the degree of deformation concentration will further strengthen. However, the development of other DLBs will slow down or even stop. This complex competition mechanism leads to the fact that not all DLB locations could show macro-cracks.
In addition to the deformation fields under different stress levels, different deformation indexes, including the normalized value of deformation field variance S, the dislocation displacements of dominant DLB, and the accumulative AE ringing counts during the loading process, were determined. The variance S of the maximum shear strain field was obtained using the deformation field data, which can be used to describe the non-uniform degree of deformation field [38]. The accumulative AE ringing counts, which can reflect the damage inside the rock specimen, were obtained from the AE signals [39]. Using the deformation field and the failure form of the rock specimen, the location of the dominant DLB can be determined. Two small areas perpendicular to the crack direction at different sides of the dominant DLB were selected, as shown in Figure 3a. Using the DIC method, the relative displacements Δu and Δv of the two center points (P1 and P2) of the small areas in the u and v directions were calculated, respectively. The sum of components d1 and d2 of Δu and Δv along the direction of the dominant DLB were defined as the dislocation displacement [40], and the calculation principle is shown in Figure 3b. Further, the curves of the four deformation indexes are plotted in Figure 4.
As shown in Figure 4a, before position A, the global mechanical behavior is in the elastic stage. The deformation localization is not significant during the elastic deformation stage, and the accumulative AE ringing counts, variance S and dislocation displacement increase slowly. After position A, the global mechanical behavior of the rock specimen exhibits non-linear evolution. To show the evolution characteristics of different indexes in the non-linear stage clearly, the region of the red dashed line in Figure 4a is magnified and shown in Figure 4b. The με in the x-axis of Figure 4a,b is micro-strain. Figure 4b shows that from position A to position B (the peak stress point) the increase in accumulative AE ringing counts is almost constant. However, the curve of variance S changes direction rapidly and the dislocation displacement increases at a faster rate, reflecting the additional enhancement of deformation localization. The dominant DLB forms at position B. The dominant DLB is the result of micro-crack propagation and connectivity. Therefore, the dominant DLB is equivalent to the “weak interlayer structure” in the rock specimen. It is worth emphasizing that position B marks a turning point at which the dislocation displacement curve changes direction. This phenomenon indicates that the mechanical property of the rock specimen has changed dramatically at position B. After position B, the medium of the rock specimen becomes discontinuous. Next, the sharp increase in the accumulative AE ringing counts indicates that the macro-crack in the rock specimen has expanded, leading to the final failure of the specimen.
The evolution characteristics of deformation field are uniform to non-uniform and continuous to non-continuous. These characteristics can be reflected by different indicators. Thus, the deformation state of rock can be divided according to the change of different indicators. The whole deformation process of the rock specimen can be qualitatively described as follows. First, in the early loading stage, the global mechanical behavior shows linear evolution characteristics, and the deformation field is relatively uniform. The dislocation displacement, variance S and accumulation of AE ringing counts increase slowly. Second, as the loading increases, the presence of non-linear change of variance S indicates that the deformation field becomes non-uniform, and the DLB (weak interlayer with control effect) appears gradually, and the deformation changes to “structural control”. The exhibited global mechanical behavior is non-linear. The peak point is a key turning point of rock mechanical behavior. The turning point of the relative dislocation displacement curve indicates that the rock specimen becomes non-continuous from continuous. Before this point, the loading is carried by the whole specimen and can be increased constantly. However, after the peak point, the load-bearing of the specimen decreases gradually. Finally, the load-bearing capacity reduces rapidly because of the growth of the macro-crack within the dominant DLB, and the dislocation displacement, variance S and accumulation of AE ringing counts changed rapidly.
According to the analysis of the experimental results, when there is a weak interlayer with a control effect in the rock specimen, the global mechanical behavior of rock shows a strong structural control characteristic. The influences on global mechanical behavior evolution can be described as follows: after the structure with the control effect formed, the bearing mode and bearing capacity of the rock were changed. The intact rock, that is, the rock specimen at the initial stage of loading, is a whole specimen to bear external load, and the bearing capacity is strong. However, after the formation of the weak interlayer (i.e., DLB), it becomes a structural specimen to bear external load, and the bearing capacity depends on the mechanical properties of the weak interlayer. The above analyses indicate that there are noteworthy structural characteristics in the process of rock deformation. Accordingly, a structural model is established and validated in next section.

3. Establishment of Structural Model and Verification

The experimental results show that structural characteristics play a key role in the evolution of rock mechanical behavior. In this section, the structural model of the rock specimen is established according to the characteristics of the different deformation stages, and the rationality of the proposed structural model is verified using the FEM.

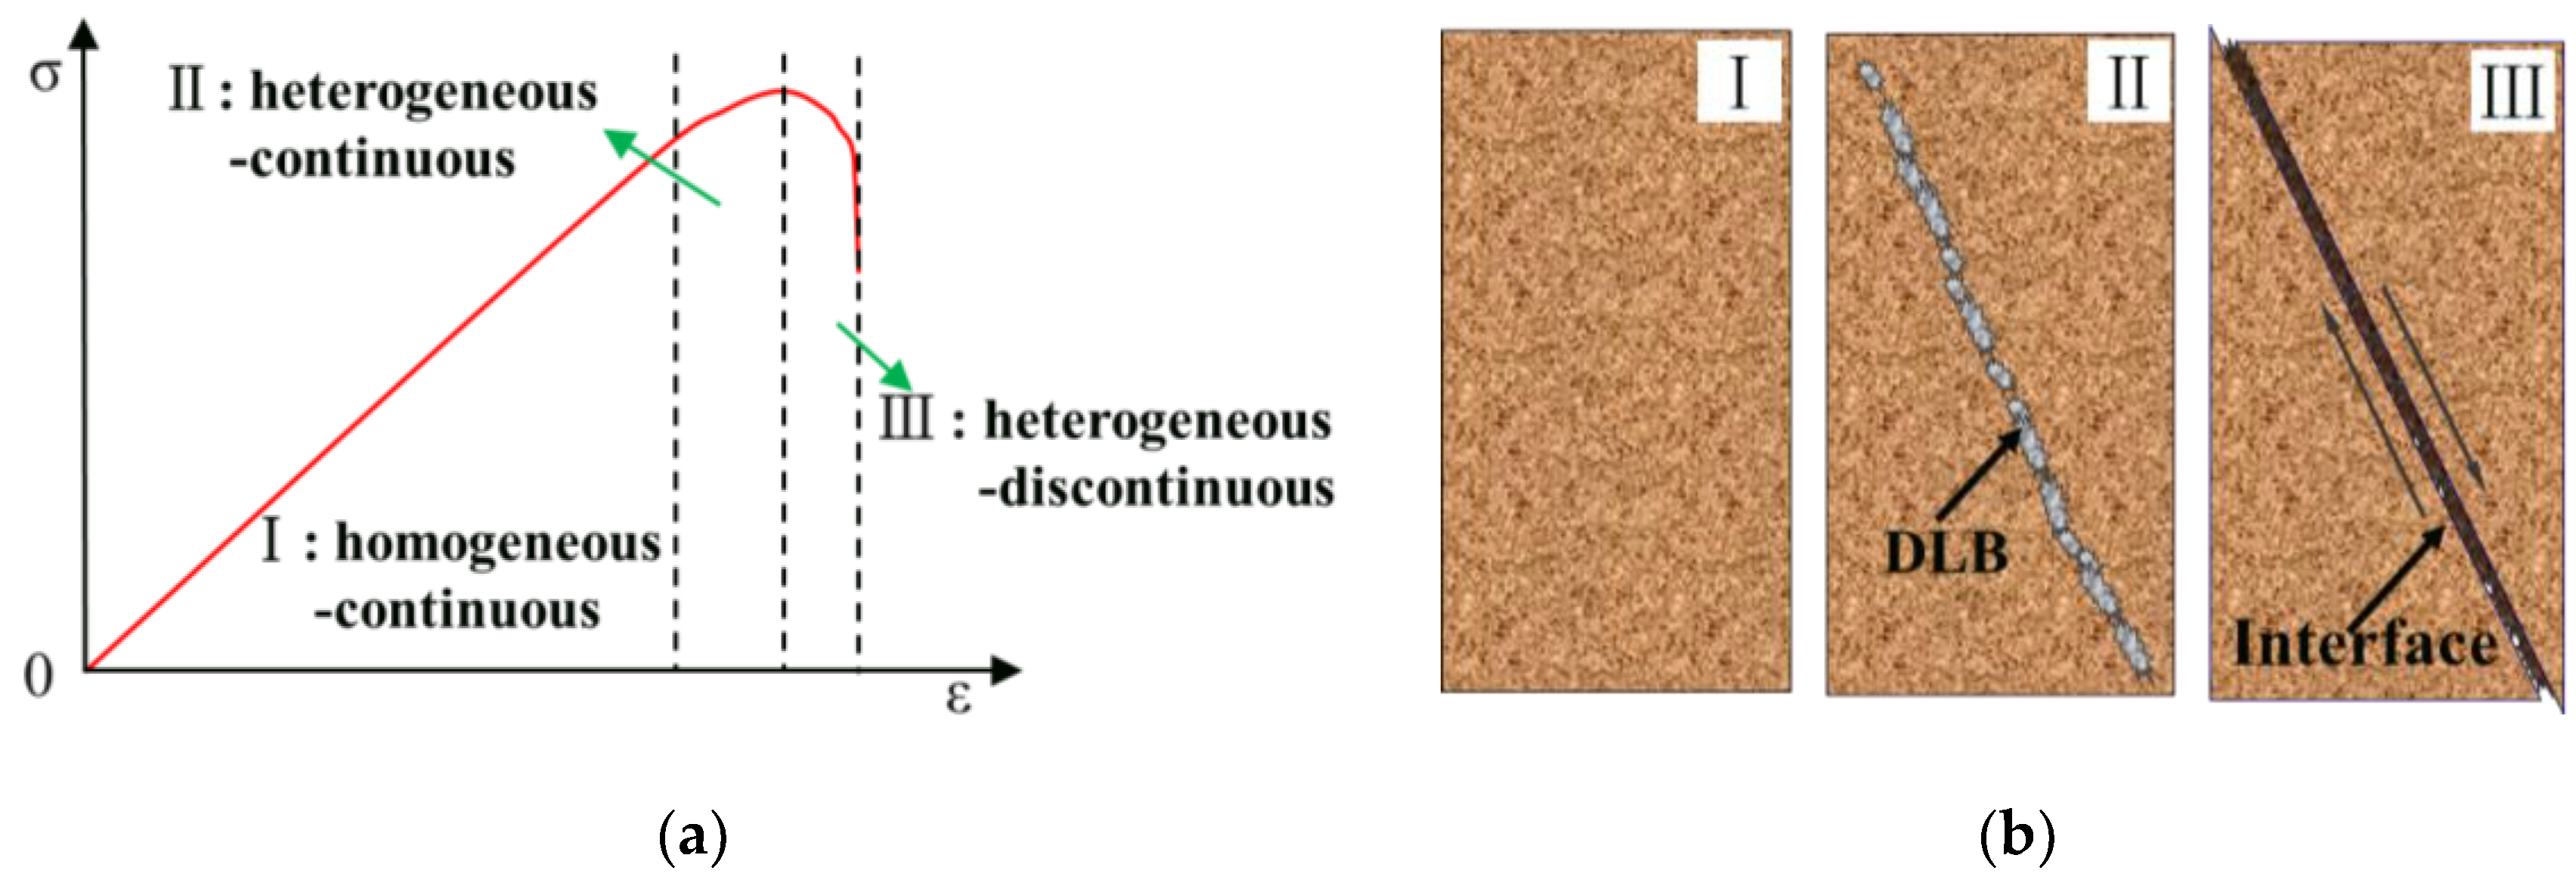
3.1. Structural Model

According to the characteristics of deformation evolution, the whole deformation process of the rock specimen can be divided into three stages: the homogeneous–continuous stage, heterogeneous-continuous stage, and heterogeneous–discontinuous stage. Based on the relationship between these three deformation stages and the mechanical behavior, a simplified structural model of the rock specimen can be established. The sketches of the stress–strain curve and structural model is shown in Figure 5. The characteristics of the structural model in the three stages can be described as follows:
  • (Homogeneous–continuous stage): At this stage, the rock specimen can be considered as a homogeneous material and an intact object with elastic deformation, and the deformation field is almost uniform.
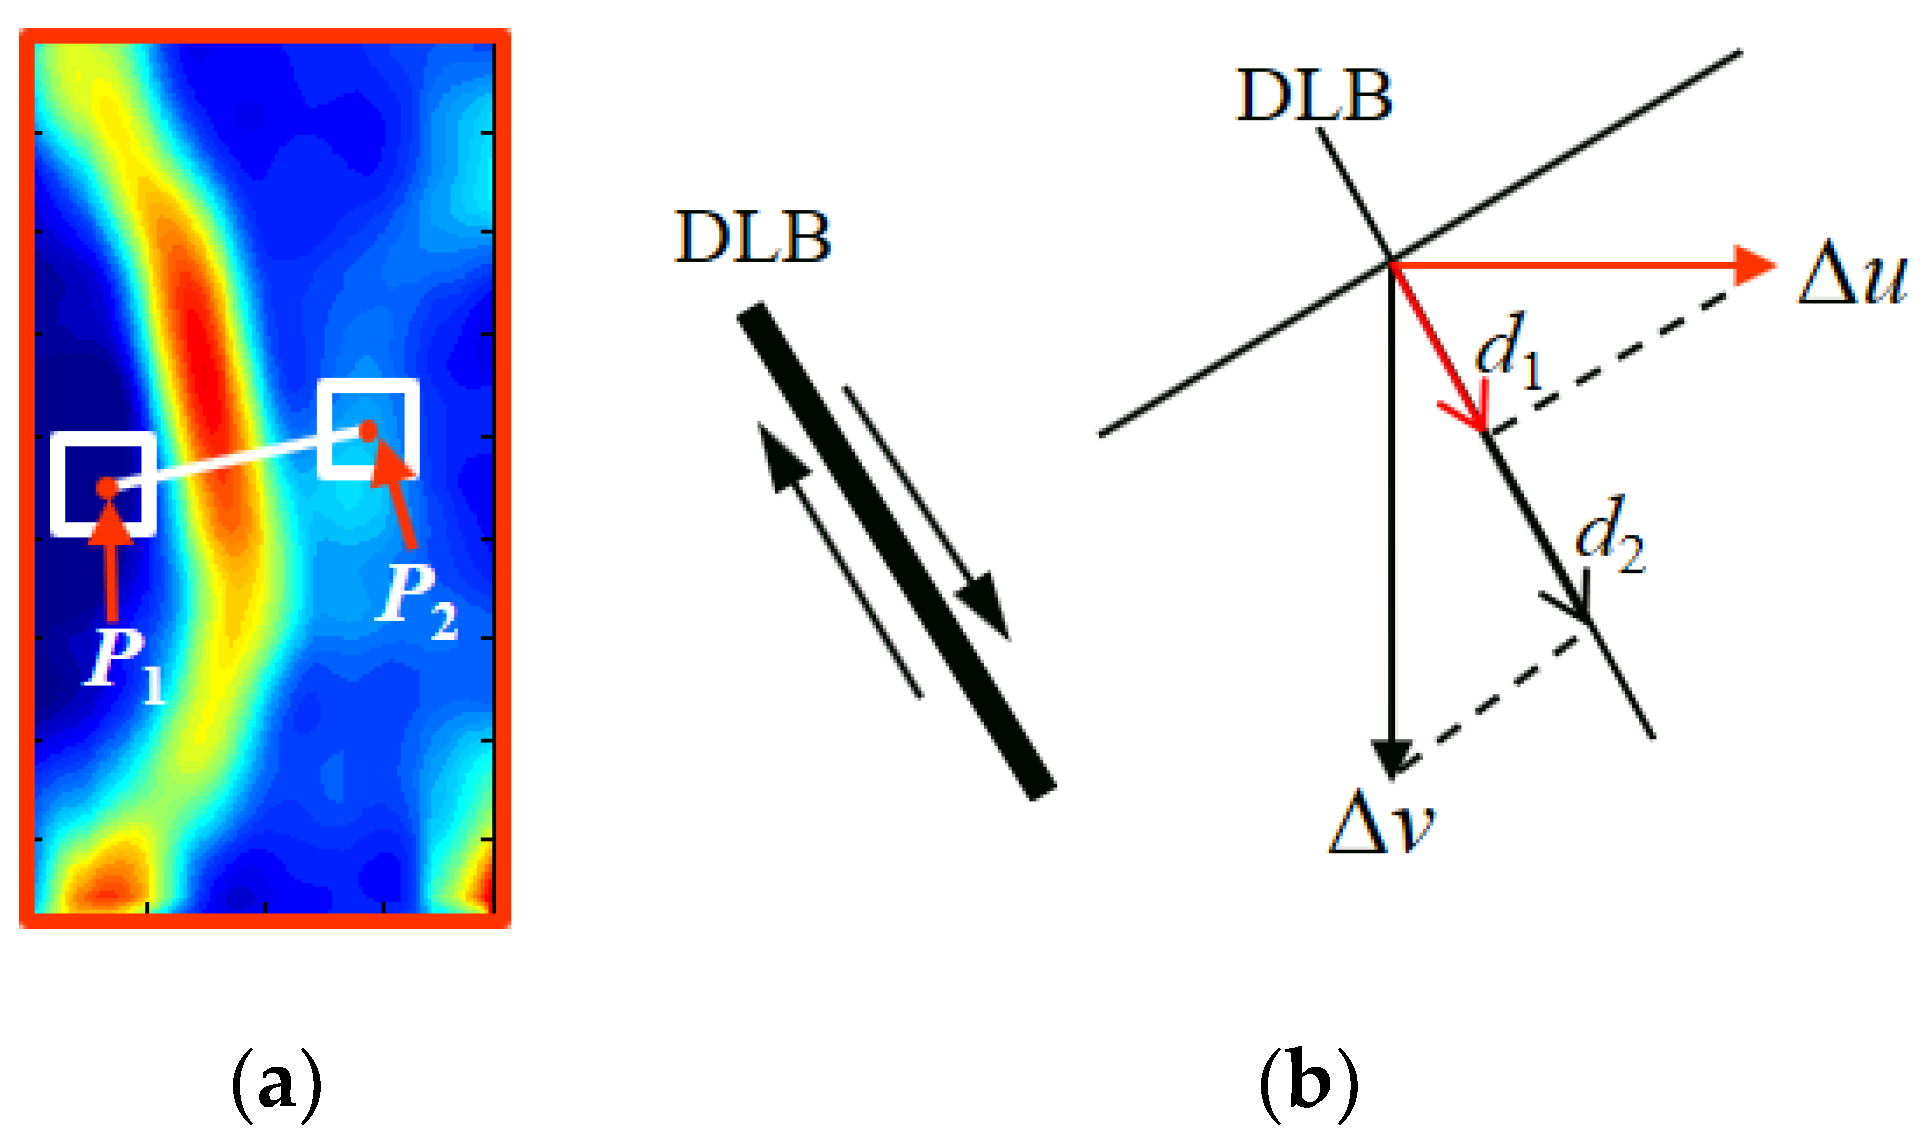
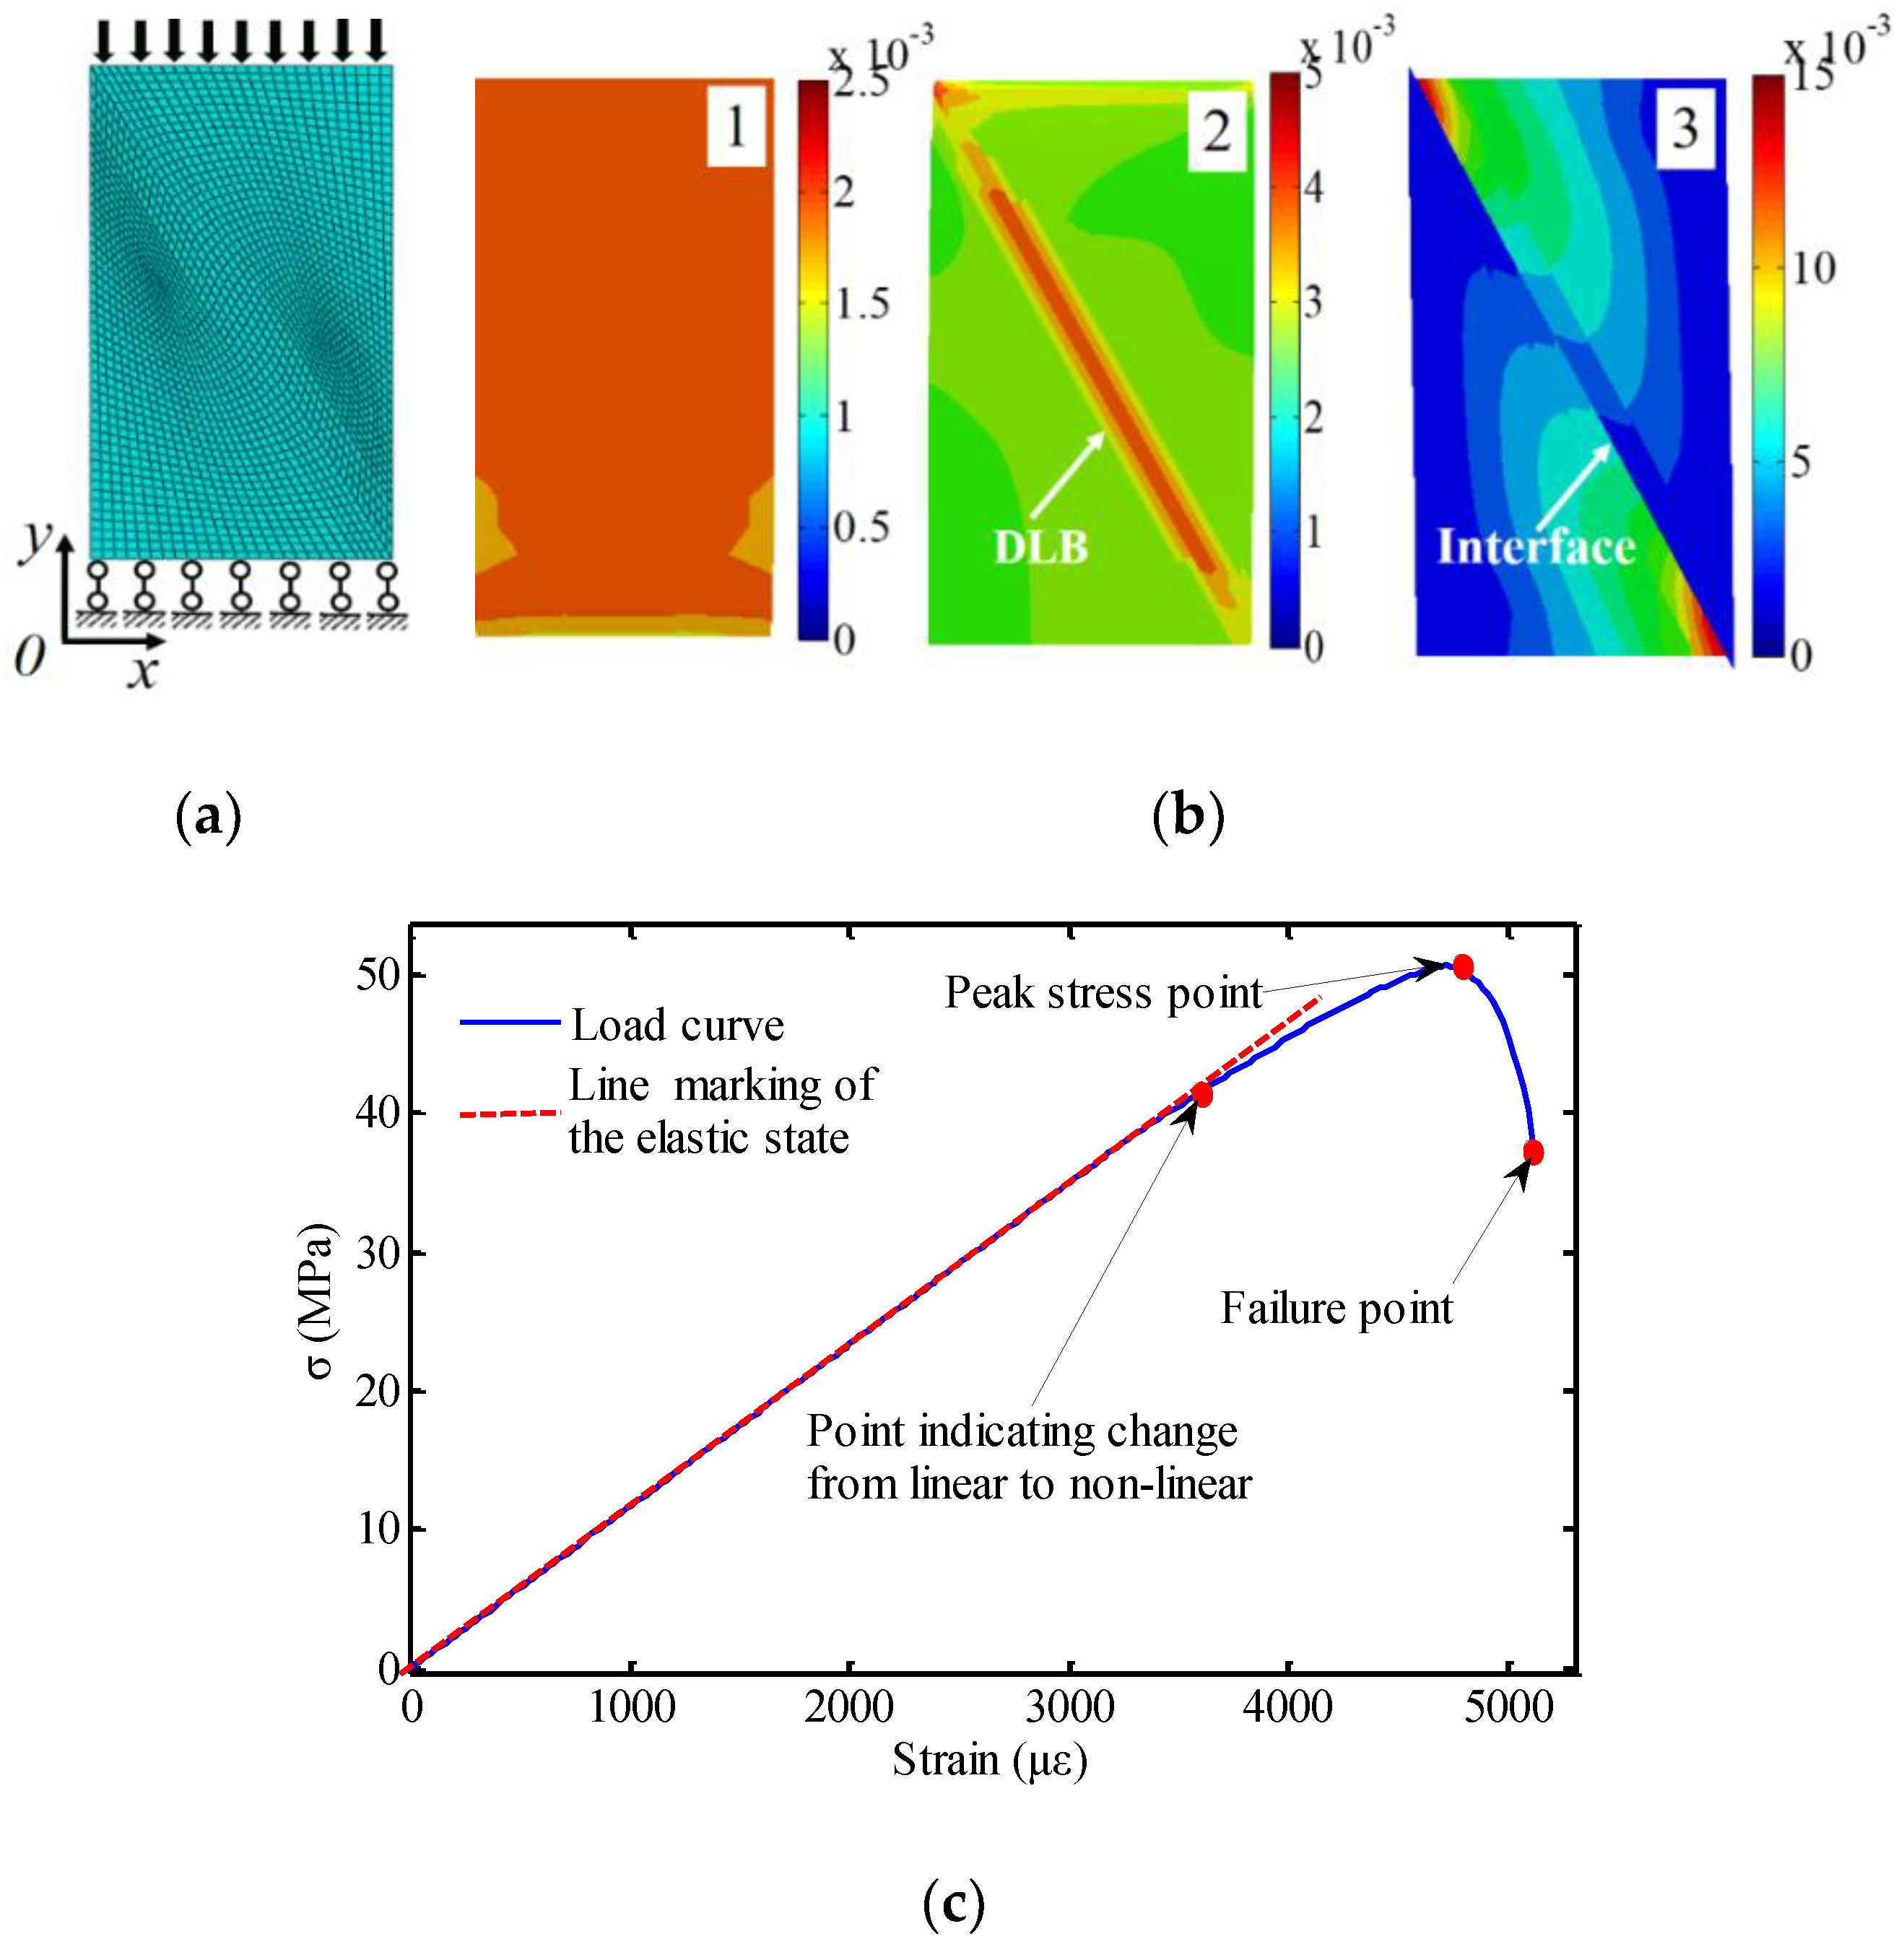
  • (Heterogeneous–continuous stage): At this stage, the deformation localization phenomenon occurs gradually, which induces the specimen to become heterogeneous regarding its material properties, and the global mechanical behavior begins to display non-linear evolution. However, the specimen is still a continuous object. An obvious DLB forms in the rock specimen when the stress reaches the peak point. The rock specimen evolves into a rock structure with a “weak interlayer”. Thereafter, the mechanical behavior of the specimen will be controlled by the rock structure.
  • (Heterogeneous–discontinuous stage): At this stage, the rock specimen is heterogeneous regarding its material properties and discontinuous as a rock structure. After the peak stress point, an interface gradually forms at the position of the DLB. Thereafter, the rock structure slides along the interface until the stress reduces rapidly and the specimen fails.

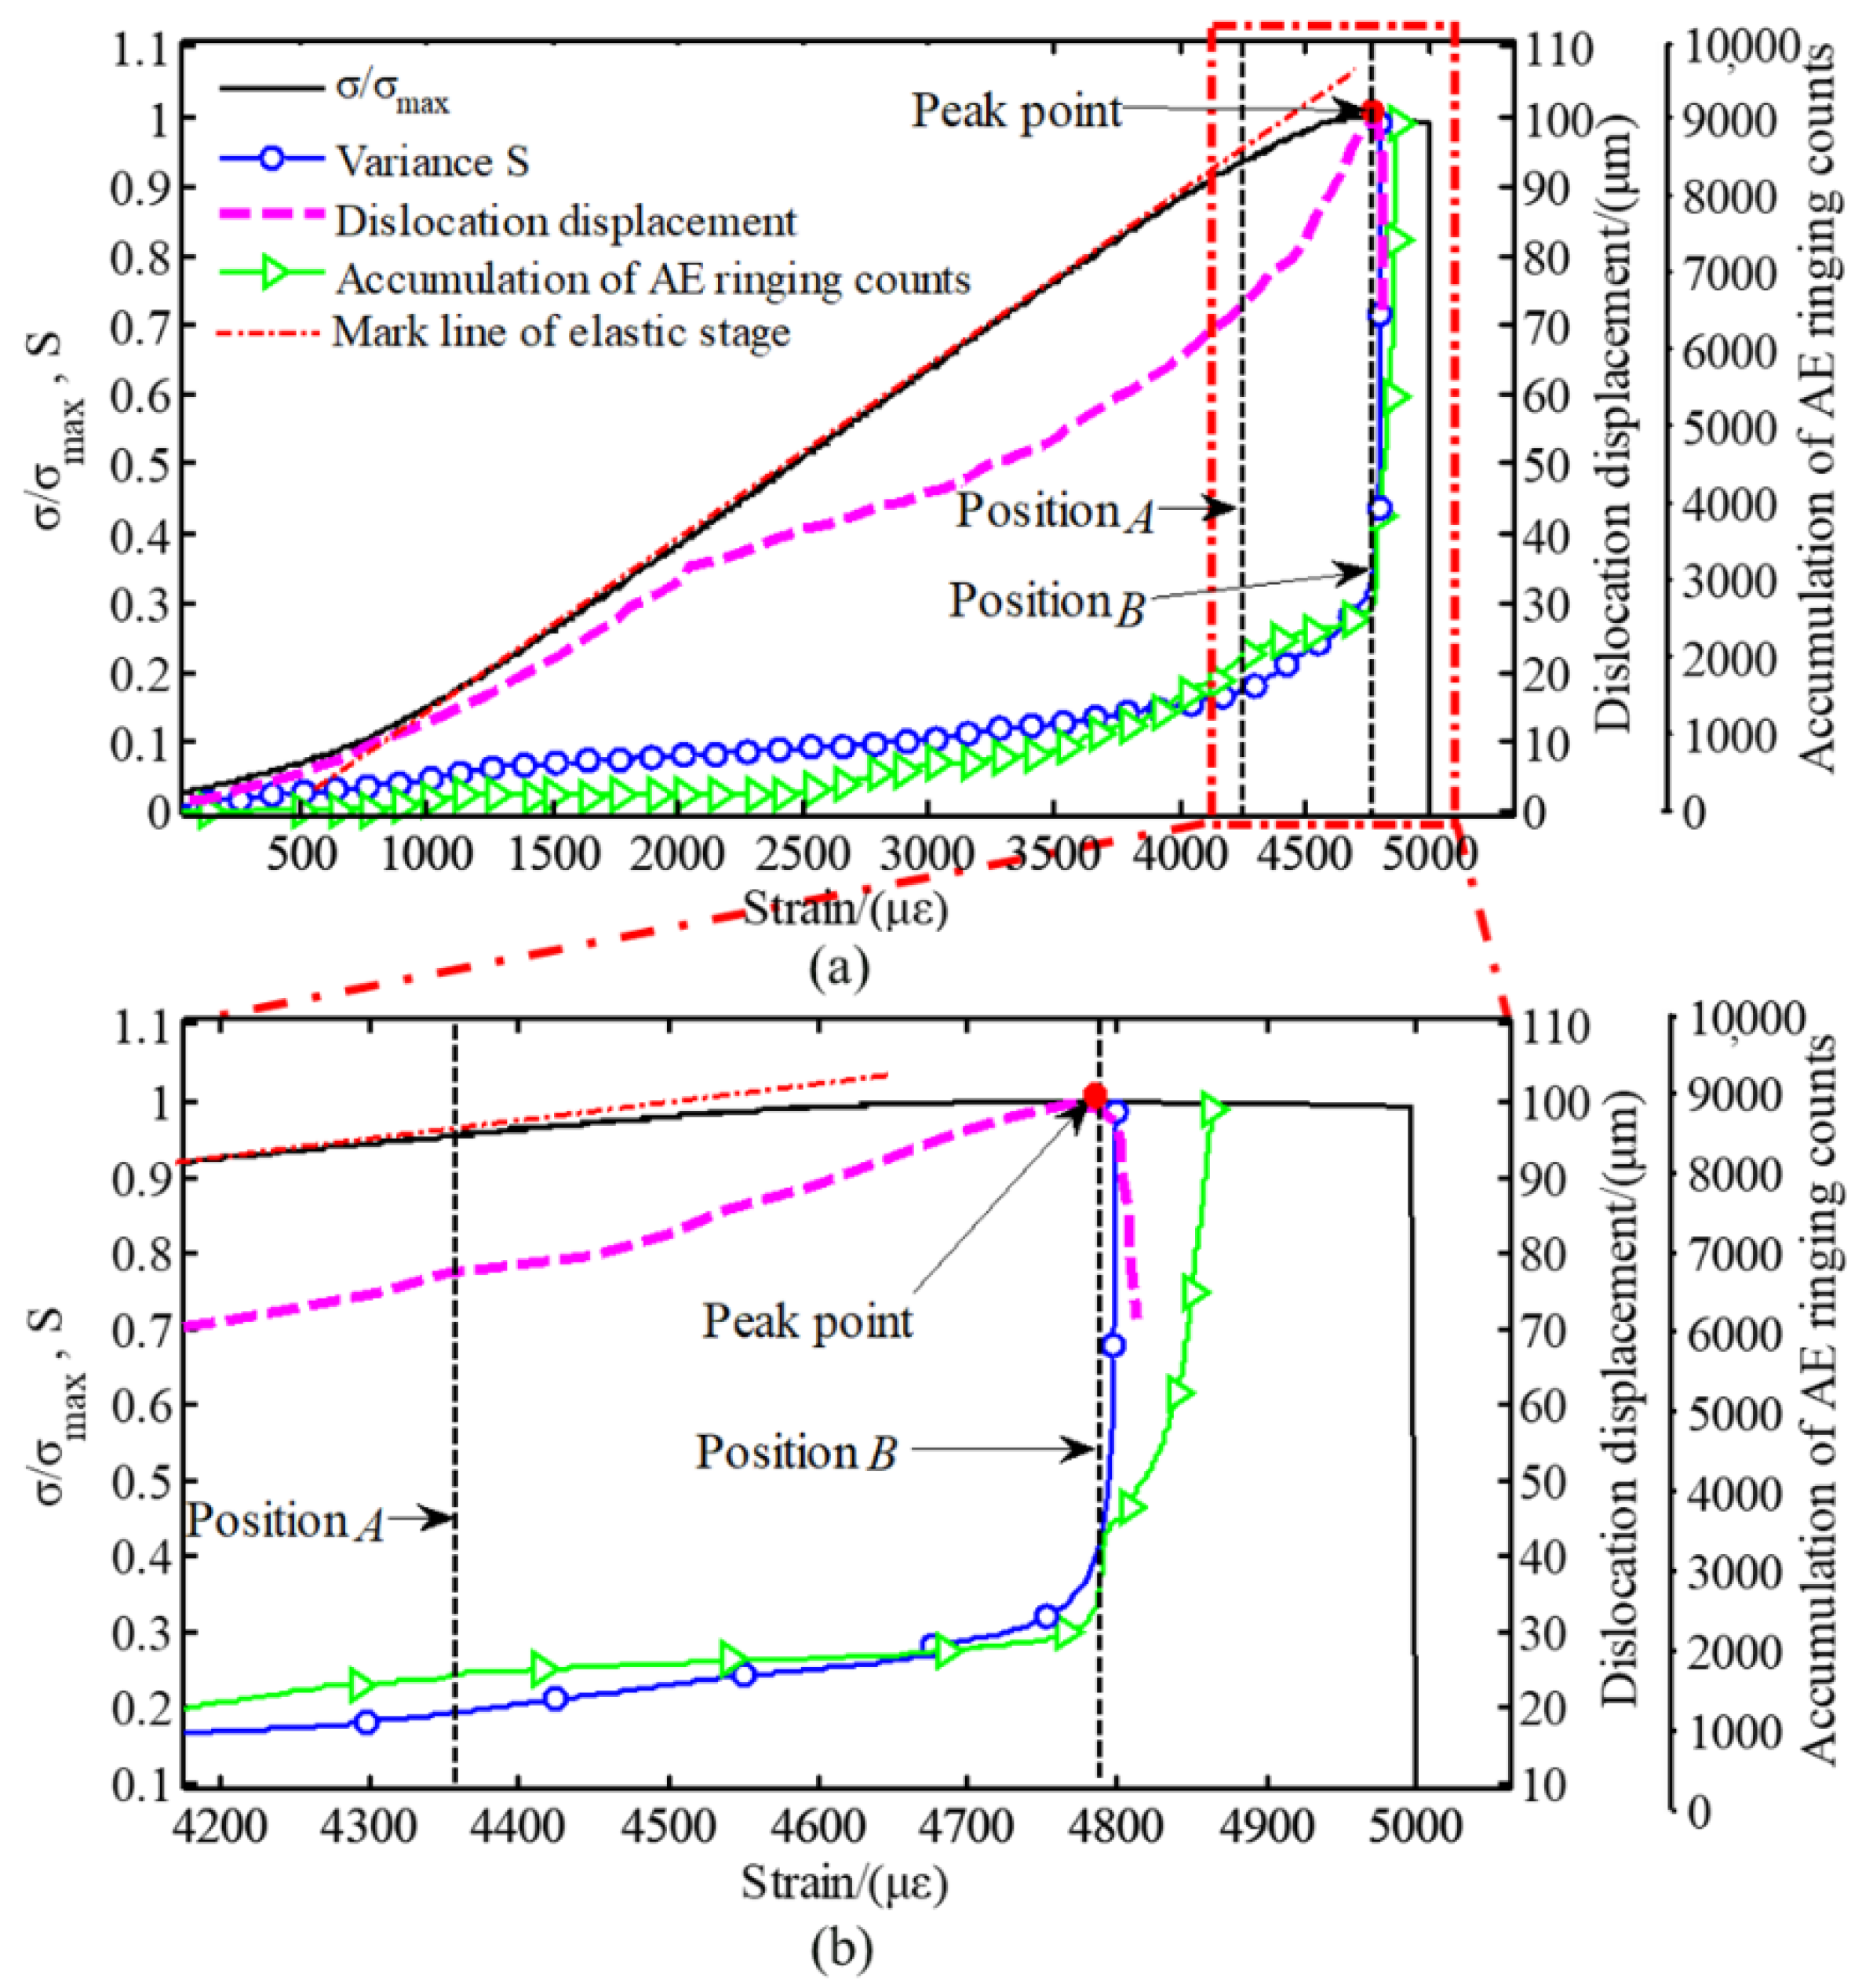
3.2. Verification of Structural Model

A numerical model corresponding to the proposed structural model in this section was established using the commercial finite element software ABAQUS. The size of the numerical model was 20 × 20 × 40 mm3. The settings of the numerical model, meshing, and boundary conditions are shown in Figure 6a. 3D solid elements (C3D8R in ABAQUS notation) were used in this numerical model, which contained 60,544 elements in total. The numerical model was loaded with a speed of 0.02 mm/min on the top surface. Equation (1) is obtained by fitting the nonlinear stage of the stress–strain curve in Figure 2a,
σ = 1.56 ε 3 + 1.86 ε 2 0.77 ε + 1109 ( 4360 ε 4790 μ ε )
where σ is the stress, ε is the strain, and με (10−6 ε) is the micro-strain.
For the finite element simulation, it is assumed that the material remains elastic before deformation localization begins. The global mechanical behavior enters non-linear evolution, which is related to the material stiffness mode on the shear band [5]. After reaching the peak value, the stress reduction is related to the interface sliding of the shear band. Corresponding to three deformation stages of the presented structural model, the finite element simulation was also divided into three stages. The first deformation stage of the numerical model was equivalent to uniaxial compression of the homogeneous material. The elastic modulus of all the elements was 12 GPa, and Poisson’s ratio was 0.25. For the second stage, the evolution process of the DLB equivalent to the gradual decrease in the elastic modulus of the elements at the “weak interlayer” position and the other elements were invariant. The law of elastic modulus decreasing can be obtained by deriving Equation (1). For the third stage of deformation, the elastic modulus of the elements was the same as that in the second stage. After the DLB formed, a contact surface was set up in the finite element model to simulate the relative dislocation of the rock structure under uniaxial compression [41]. The shear strain field of the structural model obtained using the FEM is shown in Figure 6b. The average loading and average displacement of the nodes on the top edge of the numerical model were taken as the global mechanical response of the specimen. The stress–strain curve obtained by the FEM is shown in Figure 6c, and με is micro-strain. The strain maps 1, 2, and 3 in Figure 6b, respectively, correspond to points of non-linear starting, peak stress and failure in Figure 6c.
When the weak interlayer with the control effect appears in the rock specimen, the proposed structural model can be used to describe the global mechanical behavior. The simulation results show that the proposed structural model can reproduce the linear and non–linear mechanical behaviors of the rock specimen. Further, the structural model can reflect the process of deformation localization with the weak interlayer, which has the control effect. Thus, it is reasonable to characterize the mechanical behavior of the rock specimen with the proposed structural model. However, the proposed structural model is not suitable for the DLB without a control effect.

4. Conclusions and Discussions

In this study, uniaxial compression tests were conducted on marble specimens. The evolution and characterization of rock’s global mechanical behavior were studied.
Firstly, for the interrelationship between the global mechanical behavior and deformation characteristics of the rock specimen, the evolution of deformation localization corresponds to the process of rock material from homogeneous–continuous to heterogeneous–continuous and then to heterogeneous–discontinuous. In addition, the reverse of relative displacement on both sides of the DLB and the sharp increase in the AE index correspond to the beginning of the heterogeneous–discontinuous stage, which is the critical stage before the specimen’s failure. After the deformation localization starts, the global mechanical behavior of the rock specimen evolves into nonlinear. Until the DLB has developed completely, the bearing capacity of rock specimen begins to decrease, then the rock failure occurs.
Secondly, the appearance and evolution of DLBs cause the rock specimen to gradually evolve into a structure with a “weak interlayer”. The bearing capacity of the rock specimen depends on the mechanical properties of the “weak interlayer”. Therefore, the global mechanical behavior of the rock specimen has the structural model’s characteristics. The viewpoint of structure control was introduced into global mechanical behavior characterization of rock.
Thirdly, a structural model was established to characterize the global mechanical behavior of the rock specimen, and the rationality of the proposed model was verified using the FEM. The simulation results show that the structural model can reproduce the global mechanical behavior evolution process of the rock specimen.
Lastly, some discussions on the characterization of rock mechanical behavior are added here. In practical engineering, rock mass exists in complex conditions. Therefore, based on the idea of structural evolution, further study on damage evolution and global mechanical behavior characterization of rock under complex boundary conditions (three-dimensional stress, fluids, temperature, etc.) will be carried out in the future.

Author Contributions

Conceptualization, S.M., Y.S. and T.X.; methodology, S.M., T.X. and H.Z.; software, G.L. and T.X.; writing—original draft, T.X.; writing—review and editing, S.M., H.Z., G.L., and Y.S.; funding acquisition, S.M., G.L. and H.Z. All authors have read and agreed to the published version of the manuscript.

Funding

This study was funded by National Natural Science Foundation of China (Grant Nos. 11602022, 11727801, 11872115, and U1837602).

Conflicts of Interest

The authors declare no conflict of interest.

References

  1. Wang, S.; Lee, C.; Ranjith, G.; Tang, C. Modeling the effects of heterogeneity and anisotropy on the excavation damaged/disturbed zone (EDZ). Rock Mech. Rock Eng. 2009, 42, 229–230. [Google Scholar] [CrossRef]
  2. Vásárhelyi, B.; Bobet, A. Modeling of crack initiation, propagation and coalescence in uniaxial compression. Rock Mech. Rock Eng. 2000, 33, 119–139. [Google Scholar] [CrossRef]
  3. Lade, P. Modeling failure in cross-anisotropic frictional materials. Int. J. Solids Struct. 2007, 44, 5146–5162. [Google Scholar] [CrossRef] [Green Version]
  4. Sun, X.; Xu, H.; He, M.; Zhang, F. Experimental investigation of the occurrence of rock burst in a rock specimen through infrared thermography and acoustic emission. Int. J. Rock Mech. Min. Sci. 2017, 93, 250–259. [Google Scholar] [CrossRef]
  5. Munoz, H.; Taheri, A. Local damage and progressive localization in porous sandstone during cyclic loading. Rock Mech. Rock Eng. 2017, 50, 3253–3259. [Google Scholar] [CrossRef]
  6. Nian, D.; Shao, J.; Henry, J.; Fourmaintraux, D. Laboratory investigation of the mechanical behavior of Tournemire shale. Int. J. Rock Mech. Min. Sci. 1997, 34, 3–16. [Google Scholar]
  7. Li, D.; Zhu, Q.; Zhou, Z. Fracture analysis of marble specimens with a hole under uniaxial compression by digital image correlation. Eng. Fract. Mech. 2017, 183, 109–124. [Google Scholar] [CrossRef]
  8. Mansouri, H.; Ajalloeian, R. Mechanical behavior of salt rock under uniaxial compression and creep tests. Int. J. Rock Mech. Min. Sci. 2018, 110, 19–27. [Google Scholar] [CrossRef]
  9. Szwedzicki, T. A hypothesis on modes of failure of rock samples tested in uniaxial compression. Rock Mech. Rock Eng. 2007, 40, 97–104. [Google Scholar] [CrossRef]
  10. Ben, C.; Ismael, F.; Sharif, A.; Juerg, M. Assessing the carbon sequestration potential of basalt using X-ray micro-CT and rock mechanics. Int. J. Greenh. Gas Con. 2018, 70, 146–156. [Google Scholar]
  11. Tao, K.; Zheng, W. Real-time damage assessment of hydrous sandstone based on synergism of AE-CT techniques. Eng. Fail. Anal. 2018, 91, 465–480. [Google Scholar] [CrossRef]
  12. Xue, D.; Zhou, H.; Zhao, Y.; Zhang, L.; Deng, L.; Wang, X. Real-time SEM observation of mesoscale failures under thermal-mechanical coupling sequences in granite. Int. J. Rock Mech. Min. Sci. 2018, 112, 35–46. [Google Scholar] [CrossRef]
  13. Kong, L.; Ostadhassan, M.; Hou, X.; Mann, M.; Li, C. Microstructure characteristics and fractal analysis of 3D-printed sandstone using micro-CT and SEM-EDS. J. Pet. Sci. Eng. 2019, 175, 1039–1048. [Google Scholar] [CrossRef]
  14. Swoboda, G.; Shen, X.; Rosas, L. Damage model for jointed rock mass and its application to tunneling. Comput. Geotech. 1998, 22, 183–203. [Google Scholar] [CrossRef] [Green Version]
  15. Zhou, X.; Cheng, H.; Feng, Y. An experimental study of crack coalescence behaviour in rock-like materials containing multiple flaws under uniaxial compression. Rock Mech. Rock Eng. 2014, 47, 1961–1986. [Google Scholar] [CrossRef]
  16. Selahattin, A.; Murat, K.; Abbas, T.; Taheri, N.; He, M. Effects of thermal damage on strain burst mechanism for brittle rocks under true-triaxial loading conditions. Rock Mech. Rock Eng. 2018, 51, 1657–1682. [Google Scholar]
  17. Tang, C.; Liu, H.; Lee, P.; Tsui, Y.; Tham, L. Numerical studies of the influence of microstructure on rock failure in uniaxial compression–Part I: Effect of heterogeneity. Int. J. Rock Mech. Min. 2000, 37, 555–569. [Google Scholar] [CrossRef]
  18. Li, G.; Tang, C. A statistical meso-damage mechanical method for modeling trans-scale progressive failure process of rock. Int. J. Rock Mech. Min. Sci. 2015, 74, 133–140. [Google Scholar] [CrossRef]
  19. Rafiee, R.; Ataei, M.; KhalooKakaie, R.; Jalali, S.; Sereshki, F.; Noroozi, M. Numerical modeling of influence parameters in capability of rock mass in block caving mines. Int. J. Rock Mech. Min. Sci. 2018, 105, 22–27. [Google Scholar] [CrossRef]
  20. Müller, C.; Frühwirt, T.; Haase, D. Modeling deformation and damage of rock salt using the discrete element method. Int. J. Rock Mech. Min. Sci. 2018, 103, 230–241. [Google Scholar] [CrossRef]
  21. Liu, X.; Ning, J.; Tan, Y.; Gu, Q. Damage constitutive model based on energy dissipation for intact rock subjected to cyclic loading. Int. J. Rock Mech. Min. Sci. 2016, 85, 27–32. [Google Scholar] [CrossRef]
  22. Liu, Y.; Dai, F. A damage constitutive model for intermittent jointed rocks under cyclic uniaxial compression. Int. J. Rock Mech. Min. Sci. 2018, 103, 289–291. [Google Scholar] [CrossRef]
  23. Bésuelle, P.; Desrues, J.; Raynaud, S. Experimental characterization of the localization phenomenon inside a Vosges sandstone in a triaxial cell. Int. J. Rock Mech. Min. Sci. 2000, 7, 1223–1237. [Google Scholar] [CrossRef]
  24. Zhou, X. Analysis of the localization of deformation and the complete stress–strain relation for mesoscopic heterogeneous brittle rock under dynamic uniaxial tensile loading. Int. J. Solids Struct. 2004, 41, 1725–1738. [Google Scholar] [CrossRef]
  25. Pietruszczak, S.; Haghighat, E. Modeling of deformation and localized failure in anisotropic rocks. Int. J. Solids Struct. 2015, 67, 93–101. [Google Scholar] [CrossRef]
  26. Thomas, A.; Kathleen, A.; David, J.; William, A.; Mathew, D. Strain localization and elastic-plastic coupling during deformation of porous sandstone. Int. J. Rock Mech. Min. Sci. 2014, 98, 167–180. [Google Scholar]
  27. Agliardi, F.; Crosta, G.; Frattini, P. Slow rock slope deformation. In Landslides: Types, Mechanisms and Modeling; Cambridge University Press: Cambridge, UK, 2012; pp. 207–221. [Google Scholar]
  28. Agliardi, F.; Crosta, G.; Meloni, F.; Valle, C.; Rivolta, C. Structurally-controlled instability, damage and slope failure in a porphyry rock mass. Tectonophysics 2013, 605, 34–47. [Google Scholar] [CrossRef]
  29. Zondervan, J.; Stokes, M.; Boulton, S.; Telfer, M.; Mather, A. Rock strength and structural controls on fluvial erodibility: Implications for drainage divide mobility in a collisional mountain belt. Earth Planet. Sci. Lett. 2020, 538, 116221. [Google Scholar] [CrossRef] [Green Version]
  30. Ma, S.; Xu, X.; Zhao, Y. Geo-DSCM system and its application to deformation measurement of rock mechanics. Int. J. Rock Mech. Min. Sci. 2004, 41, 411–413. [Google Scholar] [CrossRef]
  31. Shao, X.; Dai, X.; Chen, Z.; He, X. Real-time 3D digital image correlation method and its application in human pulse monitoring. Appl. Opt. 2016, 55, 696–704. [Google Scholar] [CrossRef] [PubMed]
  32. Zhu, H.; Liu, X.; Chen, L.; Ma, Q.; Ma, S. Influence of imaging configurations on the accuracy of digital image correlation measurement. Meas. Sci. Technol. 2018, 29, 035205. [Google Scholar] [CrossRef]
  33. Lockner, D.; Byerlee, J. Acoustic emission and creep in rock at high confining pressure and differential stress. Bull. Seismol. Soc. Am. 1997, 67, 247–258. [Google Scholar]
  34. Liang, Y.; Li, Q.; Gu, Y. Mechanical and acoustic emission characteristics of rock: Effect of loading and unloading confining pressure at the post-peak stage. J. Nat. Gas Sci. Eng. 2017, 44, 54–65. [Google Scholar] [CrossRef]
  35. Zhu, Q.; Li, D.; Han, Z.; Li, X.; Zhou, Z. Mechanical properties and fracture evolution of sandstone specimens containing different inclusions under uniaxial compression. Int. J. Rock Mech. Min. Sci. 2019, 115, 33–47. [Google Scholar] [CrossRef]
  36. Wang, X.; Liu, X.; Zhu, H.; Ma, S. Spatial-temporal subset based digital image correlation considering the temporal continuity of deformation. Opt. Lasers Eng. 2017, 90, 247–253. [Google Scholar] [CrossRef]
  37. Wu, S.; Ge, H.; Wang, X.; Meng, F. Shale failure processes and spatial distribution of fractures obtained by AE monitoring. J. Nat. Gas Sci. Eng. 2017, 41, 82–92. [Google Scholar] [CrossRef]
  38. Song, Y.; Xing, T.; Zhao, T.; Gao, P.; Zhao, Z. Acoustic emission characteristics of deformation field development of rock under uniaxial loading. Chin. J. Rock Mech. Eng. 2017, 36, 534–542. [Google Scholar]
  39. Meng, Q.; Zhang, M.; Han, L.; Pu, H.; Nie, T. Effects of acoustic emission and energy evolution of rock specimens under the uniaxial cyclic loading and unloading compression. Rock Mech. Rock Eng. 2016, 49, 3873–3886. [Google Scholar] [CrossRef]
  40. Guo, W.; Ma, S.; Kang, Y.; Ma, Q. Virtual extensometer based on digital speckle correlation method and its application to deformation field evolution of rock specimen. Rock Soil Mech. 2011, 32, 3196–3200. [Google Scholar]
  41. Haghighat, E.; Pietruszczak, S. On modeling of discrete propagation of localized damage in cohesive-frictional materials. Int. J. Numer. Anal. Methods Geomech. 2015, 39, 1774–1790. [Google Scholar] [CrossRef]
Figure 1. Schematic of specimen and testing system: (a) Sketch of specimen: 1. specimen, 2. acoustic emission (AE) sensors, 3. area of interest; (b) schematic of testing system: 1. loading equipment, 2. specimen, 3. AE amplifier, 4. AE system, 5. computers, 6. charge-coupled device camera, 7. light sources.
Applsci 10 07647 g001
Figure 2. Response of rock specimen under uniaxial compression: (a) Stress–strain curve; (b) maximum shear strain fields under different stress levels and failure forms of the rock specimen.
Applsci 10 07647 g002
Figure 3. Principle of dislocation displacement calculation: (a) Layout of measuring points; (b) decomposition of displacement.
Applsci 10 07647 g003
Figure 4. Curves for different parameters: (a) Whole process loading; (b) non-linear stage.
Applsci 10 07647 g004
Figure 5. (a) Sketches of stress–strain curve; (b) structural model.
Applsci 10 07647 g005
Figure 6. Model and simulation results: (a) Numerical model; (b) shear strain field obtained using the FEM; (c) load curve obtained using the FEM.
Applsci 10 07647 g006
Publisher’s Note: MDPI stays neutral with regard to jurisdictional claims in published maps and institutional affiliations.

