Featured Application
The present work is conducive to understand the effect of filling on the deformation and failure of rock and to accurately determine the crack stress thresholds of rock with holes or inclusions.
Abstract
To study the effect of strength, stiffness and inclination angle of square inclusions on failure characteristics of rock, uniaxial compression tests were carried out on prismatic sandstone containing a square hole with different filling modes and hole angles using a servo-hydraulic loading system. Digital image correlation and acoustic emission techniques were jointly applied to analyze the damage and fracture process, and the crack stress thresholds were determined qualitatively and quantitatively by combining the stress–strain behavior. The results show that the mechanical properties and crack stress thresholds of pre-holed specimens increase with the increase of the strength and stiffness of inclusions, and are affected by the hole angle. Rock failure is mainly caused by secondary crack propagation and shear crack coalescence, eventually forming mixed tensile-shear failure. The crack behavior, especially the crack initiation position, is affected by the filling mode and the hole angle. Interface debonding tends to initiate at the vertical interface, while interface slipping tends to propagate along the inclined interface. Under identical loading conditions, the specimen with 45° hole is more susceptible to crack and damage than that with 0° hole. Notably, inclusions can inhibit the hole deformation and the fracture of rock matrix, especially the sidewall spalling of 0° hole.
1. Introduction
Natural defects such as joints, fissures and holes, are commonly included in rock masses because of weathering evolution, geological structure and human actions [1]. Under loading, cracks may initiate from the corners or tips of these defects due to stress concentration, and crack propagation and coalescence may eventually lead to instability and failure of rock structures [2]. Moreover, the excavated openings in geotechnical engineering, such as tunnels, roadways and shafts, can also be regarded as artificial defects formed in rock masses. Nowadays, it is generally believed that the mechanical properties of rocks or rock masses are significantly influenced by the size, number, shape and distribution of these defects [3,4,5,6,7,8,9]. Virtually, the defects in natural rock are usually filled with sands, ooze, calcareous cements, etc. The filling can also be manually filled with mortar, concrete and other cementing materials during the construction process, such as grouting, shotcrete, etc., to arrest the crack propagation and improve the strength and stability of rock mass [10,11]. It is well known that the rock strength is governed by the crack propagation during loading [12,13], and the crack behavior around filled defects is complicated. Therefore, it is of great engineering significance to study the effect of filling on mechanical behavior and fracture evolution of rocks.
Until now, some studies on the cracking behavior of rock or rock-like materials containing various inclusions have been conducted. Based on Kirsch’s solution [14], Goodier [15] first derived a closed form solution to calculate the stress concentration around a spherical particle in the matrix under compressive stress. Zaitsev and Wittmann [16] applied the sliding crack model to study the crack propagation and coalescence around polygonal inclusions in a heterogeneous matrix subjected to far field compression. The results showed that the crack initiated from the inclined interface will continue to slip along the interface in the form of shear, but will propagate into the matrix in the form of tension when it reaches the ends of the interface. Compression tests on prismatic concrete with two circular openings and inclusions were first carried out by Maji and Shah [17]. It was observed that interface cracking always initiated at the interface of inclusions, while matrix cracking always initiated at the roof and floor of the circular openings. Tasdemir and Shah [18] performed uniaxial compression tests concrete specimens containing stone-matrix interface oriented at four different angles, and studied the mixed-mode crack initiation initiated from the aggregate-matrix interface in concrete using fracture mechanics approach, finite element modeling and holographic interferometry techniques. The analytical results were later verified by Maji et al. [19]. They found that tensile debonding at the interface of inclusion always precedes the initiation of tensile cracks in the matrix. Moreover, the mode of crack initiated at the interface of rectangular inclusion was not pure tensile, but a mixed-mode (tensile behavior dominated, however). Zhang et al. [20] and Zhuang et al. [21] compared the crack behavior of unfilled and filled flaws by conducting uniaxial compression tests on rock-like specimens, and found that the crack initiation time, initiation location and propagation behavior of cracks were all influenced by the filling.
Recently, the effect of different filling materials on rock properties has been the focus of many researchers. Janeiro and Einstein [22] studied the crack process in prismatic gypsum specimens containing either one or two inclusions with different sizes, shapes, stiffness and strength, and the experimental tests were further discussed and verified by Wu and Wong [23] through numerical simulation with the enriched numerical manifold method. To study the effects of ligament length, inclination angle and filling mode on the strength properties and failure patterns of rock, Du et al. [24] carried out uniaxial compression tests on plate shaped sandstones containing two circular holes filled with gypsum and high-strength concrete respectively. Miao et al. [25] also conducted uniaxial compression tests on sandstone to study the effects of different filling materials and flaw inclination angles on the mechanical response and crack behavior of sandstone specimens with a single filled flaw. Zhu et al. [26] applied digital image correlation (DIC) and acoustic emission (AE) techniques to analyze the fracture process of sandstone with different inclusions and obtained the crack behavior in the inclusion. Wang et al. [27] studied the effects of different filling materials on the strength, fracture behavior and strain state of flawed granite specimens in four different filling states.
These pioneer works provide good insights into the crack behavior around inclusions. However, most of them focused on the influence of inclusion type and geometry on the strength and fracture process of rock or rock-like materials, while the effect of filling mode on the crack behavior and stress thresholds of rock with a square hole, as well as the relationship between interface angle and crack mode were rarely studied. In rock mechanics and rock engineering, it is important to determine the characteristic crack stress thresholds for evaluating the damage degree and revealing the failure mechanism of rocks. Therefore, in the present study, uniaxial compression tests were carried out on prismatic sandstone specimens containing a square inclusion of various properties, including inclusion strength, stiffness and inclination angle. The effect of filling mode and hole angle on the mechanical properties and failure patterns of sandstone were investigated, especially the inhibition effect of filling on the deformation and failure of holes. The damage and fracture process were analyzed by DIC and AE techniques, and the crack stress thresholds were qualitatively and quantitatively determined by combining the stress–strain behavior.
2. Test Preparation and Procedures
2.1. Specimen Preparation
The rock matrix material in our test is green sandstone taken from Neijiang, Sichuan province of China. The sandstone was identified as fine-to-medium-grained sandstone with clastic texture and massive structure. It is mainly composed of quartz (28%), plagioclase (24%), potassium feldspar (19%), chlorite (18%), siliceous debris (7%), calcite (2%) and iron (2%), with a grain size distribution of 0.04–0.4 mm. The prismatic sandstone specimen was processed to have the geometric dimension of 120 mm (height ‘H’) × 60 mm (width ‘W’) × 30 mm (thickness ‘T’), and the end surfaces of the specimens were polished according to the standards of the International Society for Rock Mechanics (ISRM) [28]. The height-to-width ratio of the specimen was 2.0 to minimize the end friction effect under uniaxial compression, and the designed thickness could ensure the consistency of surface fracture and internal damage [29]. A square hole with the side length of 13.3 mm was fabricated in the center of sandstone specimens using a high-pressure water jet cutting system, and two inclination angles of 0° and 45° were considered to investigate the relationship between the crack behavior and the hole angle.
The prefabricated square holes in the specimens were filled with two types of cement mortar with different mixture proportions: Type I and Type II inclusion, which were mainly composed of 42.5 Portland cement, quartz sand with particle size less than 0.425 mm, purified water and 0.5% expansion agent. The mixture mass ratio of Type I inclusion was 1:4:0.75 (cement: sand: water), while that of Type II inclusion is 1:2:0.45. After curing for 28 d at a temperature of 20° and a humidity of 95%, some essential physical and mechanical properties of the tested sandstone and inclusions are listed in Table 1. The longitudinal wave velocity of the sandstone and filling materials was measured by the wave velocity measurement system (ZT801 model). The uniaxial compressive strength (UCS), Poisson’s ratio and Young’s modulus were obtained by testing standard cylindrical specimens with a size of φ50 × 100 mm using the Instron-1346 testing system. The Brazilian tensile strength was calculated by testing standard Brazilian disc specimens with a size of φ50 × 25 mm under radial compression. The mode I fracture toughness of sandstone was obtained by three-point bending test on semi-circular bend (SCB) sandstone specimens. However, since it was difficult to prepare fracture test specimens with filling materials, the fracture toughness of filling materials was not measured. The results show that the UCS and Young’s modulus of Type I inclusion are much lower than the sandstone, so it can be treated as weak filling materials in rocks. While Type II inclusion is a kind of filling material with relatively stronger strength and stiffness, such as calcium or siliceous fillers.

Table 1.
Some essential physical and mechanical properties of the tested sandstone and inclusions [26].
In addition, intact specimens and specimens with open holes were also prepared for testing for comparison purposes. Therefore, three filling modes were considered, including no inclusion, Type I inclusion and Type II inclusion, which are represented by letters A, B, and C respectively. The geometric sketch and photographic images of the prepared specimens are shown in Figure 1. Table 2 lists the geometrical sizes and mechanical parameters of the tested specimens. The specimen number describes the inclination angle and filling mode of the square hole. For example, Sq-45-B denotes the specimen containing a square hole with an inclination angle of 45° under the Filling Mode B. In this study, due to the DIC method that relies on contrasting random textures, artificial speckle fields were fabricated on the surface of the specimen [30].
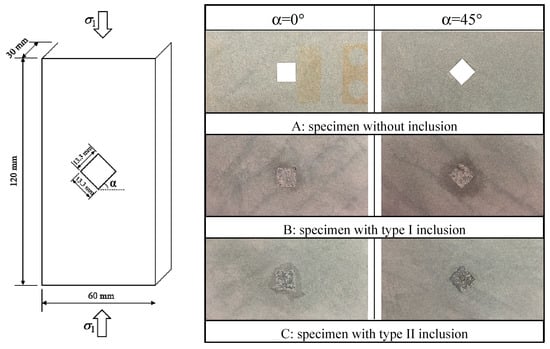
Figure 1.
Geometry of the pre-holed specimens and filling modes.
Table 2.
Geometrical sizes and mechanical parameters of specimens.
2.2. Experimental Setup and Testing Method
The photographic view of the testing system is shown in Figure 2. The uniaxial compressive stress that applied to the sandstone specimens were conducted by a servo-hydraulic rock mechanics testing system (Instron-1346) with a maximum axial loading capacity of 2000 kN. The loading direction is parallel to the height of the specimens. The axial load was imposed incrementally with a constant displacement loading speed of 0.6 mm/min, and the axial displacements were measured by an axial linear variable displacement transducer (LVDT).
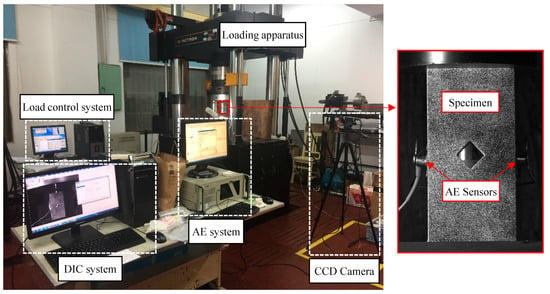
Figure 2.
Photographic view of the testing system.
DIC technique has been widely used in rock mechanical testing to analyze the rock deformation and fracture on specimen surface. Especially, it provides an effective way to describe the fracture evolution around inclusions in this test. Through the deformation fields of the specimen surface, it is easy to obtain quantitative information that is difficult to be directly observed in high-resolution pixel images. The detailed principle of DIC can be seen in reference [30]. During the test, a charge-coupled device (CCD) camera (Basler PiA2400-17 gm) was applied to capture the images on the specimen surface at a frequency of 15 frames/s under the illumination of a gooseneck lamp. The resolution of the camera is 2448 × 2050 pixels, and the length-pixel ratio is 0.0935 mm/pixel. After the test, the digital images collected in the test were post-possessed by VIC-2D image correlation software, and the calculation configurations in DIC post-processing are as follows: subset: 19, step: 4, subset weights: Gaussian weights, interpolation: optimized 8-tap, correlation criterion: normalized squared differences. During the correlation, the confidence margins were under 0.05 pixel controlled by a computing threshold, and the filter size was chosen to be seven in the strain computation.
Generally, the internal damage of rocks under loading can be reflected by the AE activities [31]. Hence an AE data acquisition system (PCI-2 model) was adopted to detect the damage behavior of sandstone specimens under compression. Using vaseline as a coupling agent, two Nano30 sensors were attached on both sides of the specimen, and gently affixed with cellulose tape, as shown in Figure 2. The AE signals measured in the sensors were amplified by pre-amplifiers with a gain of 40 dB. To avoid the possible noise interference caused by the test equipment and surrounding environment, the recording threshold level was set at 45 dB. During the test, the loading system, DIC system and AE system were started synchronously so as to reveal the relationships between the stress–time curves and surface strain fields and internal AE events in real time.
3. Test Results and Discussion
3.1. Influence of Heterogeneity
The influence of heterogeneity on the mechanical behavior of the tested sandstone was analyzed through the test results for three intact sandstone specimens (Int-1, Int-2 and Int-3). As depicted by the stress–strain curve shown in Figure 3, the uniaxial compressive strength (UCS) of Int-1, Int-2 and Int-3 are 76.64 MPa, 76.94 MPa and 71.50 MPa respectively. The standard deviation of the data is 2.50 MPa, and the coefficient of variation (the ratio between the standard deviation and the average value) is 3.33%. Similarly, the standard deviation of peak strain is 0.19, the standard deviation of elastic modulus is 0.68 GPa, and their coefficient of variation are 2.95% and 5.22%, respectively. According to the above comparison, it can be seen that the influence of heterogeneity on strength and deformation behavior of the tested sandstone specimen is small and thus can be ignored.
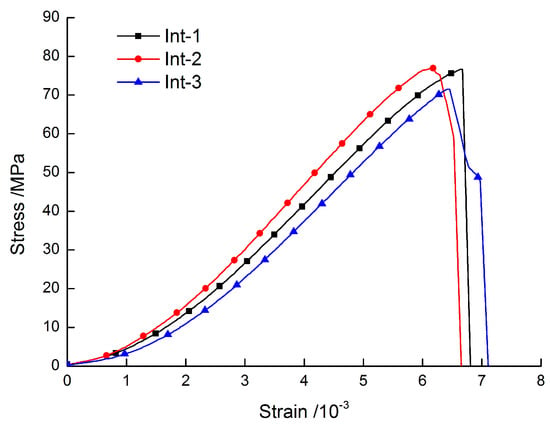
Figure 3.
Effect of heterogeneity on axial stress–strain curves of sandstone specimens under uniaxial compression.
3.2. Axial Stress–Strain Response
The typical axial stress–strain curves of intact specimen and specimens containing a square hole are shown in Figure 4. It is obvious that the mechanical properties of specimens with a square hole under uniaxial compression are significantly lower than that of the intact specimen, and the reduction extent is affected by the hole inclination angle. The axial stress–strain behavior of sandstone specimens can be approximately divided into four typical stages, including the initial pore compaction stage, elastic deformation stage, crack growth stage and post-peak stage.
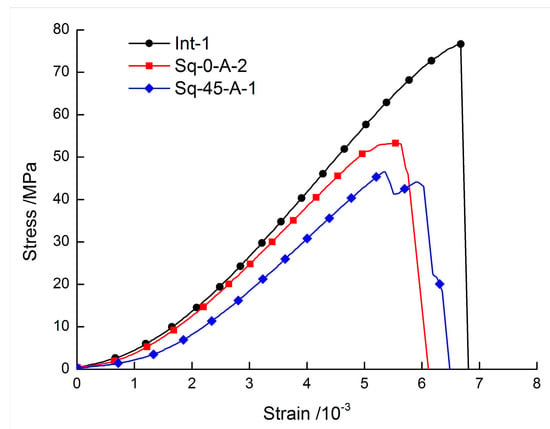
Figure 4.
Typical stress–strain curves of intact specimen and specimens containing a square hole.
At the stage of crack closure, the stress–strain curves of the specimens show an initial downward concave shape and nonlinear deformation at low stress levels, resulting from the closure of initial micro-defects in rock under compressive squeeze. The initial elastic modulus (the slope of the tangent passing through the origin on the stress–strain curve) of Int, Sq-0-A and Sq-45-A are 3.24 GPa, 2.22 GPa and 1.44 GPa, respectively, and the nonlinear deformation section of the specimen Sq-45-A is more obvious than that of other specimens, which indicates that the pore compaction behavior is not only affected by the existence of prefabricated holes but also by the hole shape. Once the majority of these micro cracks or pores has been closed, the axial stress grows linearly with the increase in the strain, indicating that the stress–strain curve turns into the elastic deformation stage. Even though the responses of these pre-holed specimens are mainly elastic deformation, some primary tensile cracks around the square hole begin to initiate and stably propagate in this stage. As the increase of uniaxial loading, the stress–strain curves deviate from the elastic behavior and show nonlinear deformation, which is mainly caused by the secondary crack initiation, propagation and coalescence. At the post-peak stage, many macro cracks around the hole grow rapidly, accompanied by stress adjustments inside the pre-holed specimen, resulting in step-like stress fluctuations. For the intact specimen, the axial stress drastically drops to 0 MPa within 0.06 s after the peak stress, and brittle splitting failure occurs during the stress dropping, accompanied with a loud sound.
The effect of filling mode and hole inclination angle on the stress–strain behavior of sandstone specimen is shown in Figure 5. It can be seen that the stress–strain behavior of the filled specimens is similar to that of the unfilled specimens. They all show plastic–elastic–plastic deformation characteristics before the peak stress. However, for the filled specimen, its mechanical properties are improved compared to the unfilled specimen, and there is still a residual strength after rock failure, which means that the specimen with inclusions remains a certain bearing capacity even after the failure of rock matrix. In addition, under the same filling mode, the mechanical properties of the pre-holed specimens with α = 0° are better than those with α = 45°.
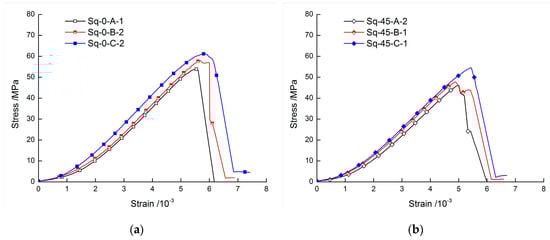
Figure 5.
Typical stress–strain curves of specimens containing a square hole under different filling modes: (a) α = 0°; (b) α = 45°.
3.3. Strength and Deformation Properties
The effect of filling mode and hole angle on the strength and deformation parameters of sandstone specimens under uniaxial compression are investigated, as shown in Figure 6, and the specific parameters are listed in Table 2. It is clear from Figure 6 that the peak strength, peak strain and elastic modulus of specimens containing a square hole are all lower than that of the intact specimen. In Figure 6a, the average UCS of the intact specimen is 75.03 MPa, while that of the specimens Sq-0-A and Sq-45-A is 53.59 MPa and 46.22 MPa, with a decrease of 28.58% and 38.40%, respectively. Similarly, the decrease extent of peak strain is 14.00% and 21.85% (Figure 6b), and the decrease in elastic modulus is 16.41% and 24.29% (Figure 6c), respectively. It can be seen that the strength and deformation properties of rock are weakened more obviously by the square hole with α = 45° than that with α = 0°.
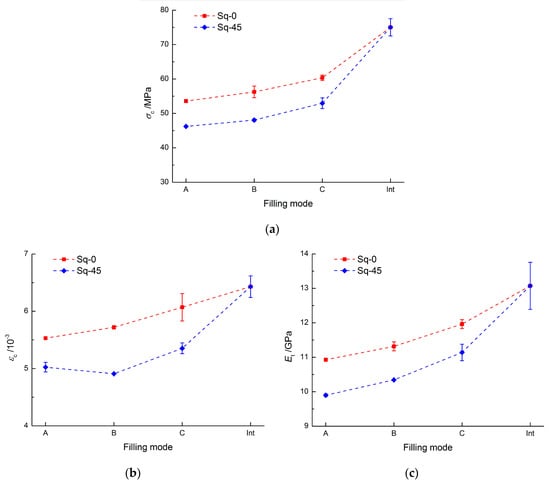
Figure 6.
Effect of filling mode and hole angle on the mechanical parameters of specimens: (a) peak strength σc; (b) peak strain εc; and (c) elastic modulus Et.
After filling, the differences of mechanics properties between intact specimens and pre-holed specimens decrease as the filling mode changes from B to C. For the pre-holed specimens under the Filling Mode B, the UCS of Sq-0-B and Sq-45-B slightly increase compared to the unfilled specimens, and the increasing degrees are only 4.96% and 3.98%, respectively. However, for the specimens under the Filling Mode C, Sq-0-C and Sq-45-C, the UCS increase significantly by 12.65% and 14.58% respectively. The variation of peak strain and elastic modulus of the pre-holed specimens with different filling modes is similar to that of UCS. The strength and deformation properties of the specimen with Type II inclusion is the largest, followed by the Type I inclusion, and finally the unfilled holes among the three filling modes. Therefore, one can be concluded that the strengthening effect of relatively rigid inclusion on the mechanical properties of the pre-holed specimens is obviously stronger than that of the weak inclusion. This is mainly because the rigid infilling material can significantly improve the internal stress state of rocks [15,22]. In addition, the mechanical properties of the specimens with 0° inclusions are always larger than those with 45° inclusions, and the enhancing effect of filling on the mechanical properties of the specimens with α = 0° and 45° is almost the same at the same filling mode.
In order to better understand the effect of filling and hole angle on hole deformation, two virtual extensometers with length D of 14.3 and 19.8 mm were arranged on the boundary of 0° and 45° holes respectively by DIC, to obtain the variation of hole aperture with time in horizontal and vertical directions (ΔDx and ΔDy) before the peak stress, as shown in Figure 7. It can be seen that before about 5 s, the deformation of the hole in the horizontal and vertical directions is basically 0. After that, the value of ΔDx is always positive and increases with time, which indicates that the hole expands horizontally under the external force, resulting in interface debonding or slipping between the rock matrix and inclusion [26]. On the contrary, the value of ΔDy is always negative and decreases with time, indicating the hole shrinks in the vertical direction under the external force. Obviously, the deformation of the holes under the three filling modes is different. Generally, the deformation of the unfilled hole is the largest, followed by the hole filled with Type I inclusion, and finally with the Type II inclusion. On the other hand, by comparing Figure 7a,b, it can be found that the inclination angle also has a significant effect on the deformation of holes or inclusions. The deformation of the hole with α = 0° is more sensitive to the change of the filling mode, and the resistance effect of filling on hole deformation improves with the time. This indicates that as the load increases, the inclusion will gradually produce a passive supporting effect on the surrounding rock matrix, especially the inclusion with better strength and stiffness, which can effectively improve the stress state of the surrounding rock, thereby improving the strength and deformation behavior of the specimens with inclusions [10,32].
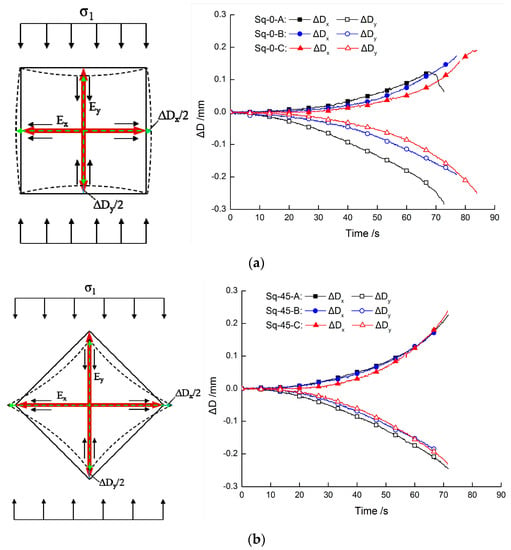
Figure 7.
Layout of virtual extensometers around 0° (a) and 45° (b) square hole and the variation in hole apertures with filling mode.
Table 3 lists the deformation values of 0° and 45° holes under different filling modes at the stresses of 10, 20, 30 and 40 MPa. It can be seen that under the same filling mode, no matter how the applied stress changes, the deformation of the 45° hole is always greater than that of the 0° hole, indicating that the structural stability of the 45° hole is worse than that of the 0° hole, and large deformation is more likely to occur in 45° hole under external force, which results in the mechanical properties of pre-holed specimens with α = 45° is lower than those with α = 0°. In addition, for the 0° hole, the deformation of the hole after filling is significantly reduced, and the reduction degree increases with the increase of stress. However, for the 45° hole, the resistance effect of Filling Mode B on hole deformation is poor, while that of Filling Mode C is relatively obvious.
Table 3.
Deformation of 0° and 45° hole under different filling modes at stresses of 10–40 MPa.
3.4. AE Behavior and Fracture Process
In this study, special attentions are paid to the damage and fracture process around the square holes under different filling modes, and the effect of interface angle on the crack behavior. For this purpose, the AE and DIC techniques were jointly applied to analyze the cracking process of rock qualitatively and quantitatively. The AE counts and cumulative acoustic emission counts (CAEC) were obtained to reflect the damage evolution in the whole loading process [33]. The major principal strain fields in the cracking process were also given, and the strain localization characteristics could identify rock fracture as early as possible compared to other strain variables [25,34]. Through careful observations, it was found that when the major principal strain is about 2.5%, a crack can be considered as macro cracks for the tested sandstone specimen. In order to determine the crack stress thresholds and reduce the influence of subjective factors, the legend range for major principle strain fields is set as 0–2.5% in this paper. Figure 8, Figure 9 and Figure 10 show the damage and fracture process of the intact specimen, specimens with a 0° hole and a 45° hole, respectively. The left side of the figures shows the stress–time curves in combination with AE counts and CAEC, and the right side shows the major principal strain fields on specimen surface at the characteristic stress points.
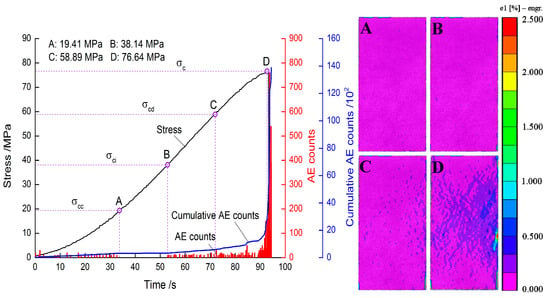
Figure 8.
Acoustic emission (AE) behavior and strain fields of intact specimen Int-1.
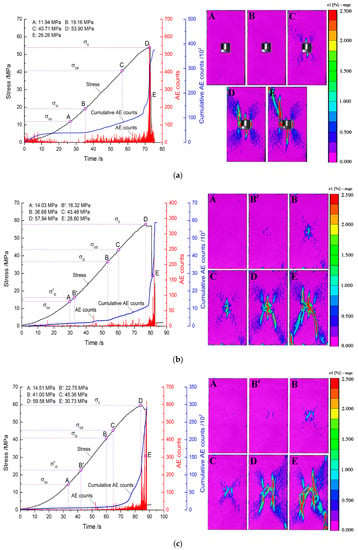
Figure 9.
AE behavior and strain fields of pre-holed specimens with α = 0° under different filling modes: (a) Sq-0-A-1; (b) Sq-0-B-2; and (c) Sq-0-C-1.
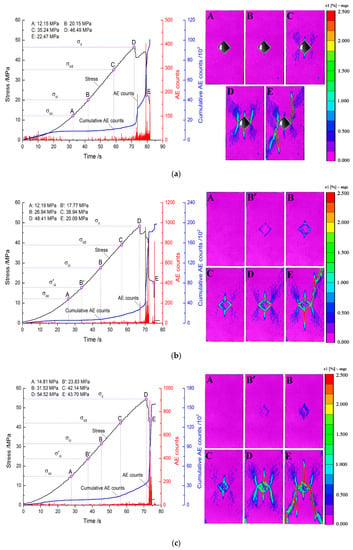
Figure 10.
AE behavior and strain fields of pre-holed specimens with α = 45° under different filling modes: (a) Sq-45-A-1; (b) Sq-45-B-2; and (c) Sq-45-C-1.
Obviously, the damage and fracture process of rock, including crack initiation, nucleation, propagation and coalescence, is closely related to several characteristic stress thresholds of rock (i.e., σcc, σci, σcd and σc) [35,36]. Where σcc and σci represent the stresses at the closure of initial defects and the initiation of new cracks, respectively. The crack damage stress σcd refers to the stress that unstable cracks begin to appear, and the peak stress σc is equal to the UCS. In regard to the values of σci and σcd for sandstone specimens in this test, they can be qualitatively and quantitatively determined by combining DIC and AE results [37,38]. Firstly, find out the time when AE counts increase significantly or CAEC deviate from the linear segment; then, observe the feature of major principal strain fields at these moments. If the characteristic AE behavior corresponds to crack initiation, propagation or coalescence in the major principal strain fields, the corresponding stress is the crack initiation or damage stress. However, the crack closure stress σcc is difficult to be directly identified by this method. It is generally considered that the axial stress at the critical point of the stress–strain curve from nonlinear to linear is the crack closure stress. Based on this, an objective approximate estimation method of crack closure stress was proposed, which is helpful to reduce human subjective error. Taking the specimen Sq-A-0-1 as an example, the calculation steps are as follows: first, select two points on the stress–strain curve where the stresses are 0.2 and 0.3 times of the peak stress (i.e., 10.33 MPa and 16.05 MPa), and mark them as P1 and P2 respectively; second, the stress–strain curve is linearly fitted between the two points (P1 and P2) to obtain the slope of 10.97 GPa, and then a line (σ = 10.97ε) is drawn from the origin Point 0 (see Figure 11a); third, calculate the axial strain difference (Δε = εx2 − εx1) between the straight line and the stress–strain curve for the same axial stress σx; finally, plot the curve of axial strain difference versus axial stress, and find out the Point A with the largest axial strain difference. The stress at Point A is the crack closure stress σcc, as shown in Figure 11b.
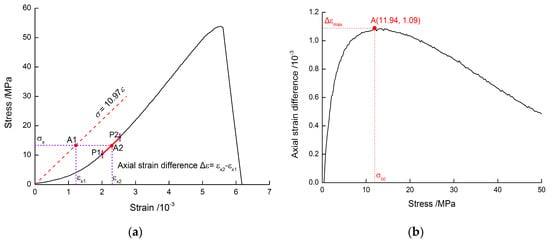
Figure 11.
Determination of crack closure stress of specimen Sq-0-A-1: (a) schematic diagram of axial strain difference and (b) location of Point A with the maximum axial strain difference.
Therefore, the stresses at Points A, B, C and D shown in Figure 8, Figure 9 and Figure 10 can be defined as crack closure stress (σcc), crack initiation stress (σci), crack damage stress (σcd) and peak stress (σc), respectively. The stress Point E is at the post-peak. It should be noted that the crack initiation stress σci mentioned in this paper is the stress corresponding to the cracking of rock matrix. However, for the filled specimens, since the interface between the filling material and the hole is the weakest plane, it can be clearly seen from Figure 9b,c and Figure 10b,c that, comparing the principal strain fields at Points A and B′, strain localizations first concentrate at the boundary or inside of the filled holes and initiate from it, which indicates that the corresponding stress at Point B′ can be regarded as the crack initiation stress σ′ci of the inclusions in the filled specimens.
For the intact specimen, it can be seen from Figure 8 that some AE events can be detected during the pore compaction stage (OA), which is caused by the closure of the micro cracks and pores in the rock specimen. When the stress increases to Point A, the specimen turns into the elastic deformation stage (AB), and the axial stress–time curve increases linearly, with a large amount of strain energy being stored. In this stage, the AE counts enters the quiet period, and the CAEC also show as the platform interval. From Point B, the AE counts become active again, and the CAEC begin to increase slowly and linearly with the increasing stress, which indicates that the micro-cracks in the specimen begin to initiate and propagate steadily, i.e., the stable crack growth stage (BC). Some strain localization dots are randomly distributed on the specimen surface, but the range and density of the micro cracks are not enough to form macro cracks. As the stress increases to Point C, the AE counts are more active than the previous stages, and the CAEC increase nonlinearly, which indicates that the specimen enters into the unstable crack growth stage (CD). At this time, there are more strain localization points on the specimen surface, and some of them gradually gather and coalesce on the right side of the specimen. When the stress rises to the peak Point D, a large range of strain localization region appears on the specimen surface, and those concentrated on the right side of the specimen evolve into narrow high strain bands. After the peak stress, the high strain bands rapidly propagate and penetrate the specimen, resulting in final brittle splitting failure. Meanwhile, the AE counts and CAEC soar to the highest level, and the axial stress rapidly drops to 0 MPa.
For the specimens with an open hole (Sq-0-A and Sq-45-A), as shown in Figure 9a and Figure 10a, the AE behavior of the pre-holed specimens under uniaxial compression are similar to that of the intact specimen, but the stress thresholds are significantly decreased and the corresponding crack behavior is obviously different. At the crack closure stress Point A, there is no obvious feature of major principal strain field on the specimen surface, which indicates that the crack closure stress threshold is hard to be directly determined by only strain field. At the crack initiation stress Point B, due to tensile stress concentration, strain localizations concentrate at the center of the roof and floor of the 0° hole and the upper and lower corners of the 45° hole, indicating the initiation of tensile cracks from these areas. With the increase of the stress, the specimen enters the stable crack growth stage (BC), and the tensile cracks propagate stably parallel to the loading direction. At the crack damage stress Point C, two pairs of symmetrical localized bands appear at the corners of both sides of the hole, and gradually gather and nuclear as the stress increases to peak Point D, forming macro secondary cracks. Therefore, the initiation and unstable growth of secondary cracks are the signs that the pre-holed specimens enter the stage of unstable crack growth. Different from the 45° hole, there are high strain concentrations on both sides of the 0° square hole at the peak stress, which is an indication of slabbing on the sidewalls of the square hole due to local high compressive stress concentration [39]. With the further propagation of the secondary cracks and the coalescence with the far-field cracks at the corners of the specimen, the primary tensile cracks are forced to be closed [5], and the stress drops to Point E. During the dropping, the AE counts and CAEC both soar to the highest level.
The damage and fracture process of the specimens with a square inclusion (Sq-0-B, Sq-0-C, Sq-45-B and Sq-45-C) are shown in Figure 9b,c and Figure 10b,c. Consistent with the unfilled specimen, the ultimate failure of the filled specimen is mainly caused by the propagation and coalescence of secondary cracks. However, striking differences can be observed in the crack initiation position and the corresponding stress value. At the stress Point B′, strain localizations first concentrate at the boundary or inside of the inclusion, causing interface debonding or interface slipping [26]. Then the cracks coalesce with each other, penetrate through the inclusion boundary and finally propagate into the rock matrix to form tensile cracks as the stress increases to Point B. This indicates that under the low axial load, the applied energy is mainly concentrated in the filling material, resulting in inclusion deformation and fracture, which has a certain crack arrest effect on rock matrix. The results also show that the stress thresholds of filled specimens are significantly improved than unfilled specimens, and the mode and distribution of cracks around the inclusion are more complex, which will be discussed in detail in following sections. Notably, after filling, the high strains concentrated on the sidewalls of the 0° square hole disappear, which indicates that the filling treatment can effectively inhibit the occurrence of the sidewall slabbing.
In conclusion, the AE counts of all specimens during the loading process can be roughly divided into five periods: initial active period (OA), quiet period (AB′(B)), active period (B′(B)C), intensive period (CD), and sudden increase period near the peak Point D. Similarly, the corresponding CAEC can also be divided into five intervals: parabolic interval, platform interval, linear growth interval, nonlinear growth interval, and exponential rising interval. By verifying the major principal strain fields obtained by DIC technique, the critical points between these characteristic periods or intervals can be regarded as the crack closure stress, initiation stress, damage stress and peak stress, respectively. Therefore, it can be concluded that both DIC and AE techniques can reliably characterize the damage characteristics and fracture evolution of sandstone specimens during uniaxial compression, and their results are in good agreement with the mechanical behavior of the specimens.
3.5. Crack Behavior and Failure Pattern
The failure patterns of pre-holed specimens with different filling modes and hole angles are shown in Figure 12. Generally, the types of macro cracks in rock are mainly identified by the crack orientation in experimental tests [40,41]. Cracks with a propagation path parallel to the loading direction and a smooth and clean surface are considered as tensile cracks, whereas cracks propagating obliquely with respect to the loading and forming visible shear bands are regarded as shear cracks. It can be seen from Figure 12a,e that the failure mode of the specimens with a square hole is mainly the shear dominated mixed failure. There are three main macro cracks leading to the final rock failure, including two diagonal shear cracks intersecting at both sides of the square hole and one wing crack initiated from the corners of the hole. Especially for the square hole with α = 0°, splitting fractures first occur on the sidewalls of the hole as a result of the high compressive stress concentration, and then slabbing starts at the wall and develops inwards under the combined effect of shear stress, eventually forming a V-shaped notch (Figure 12b) [42,43].
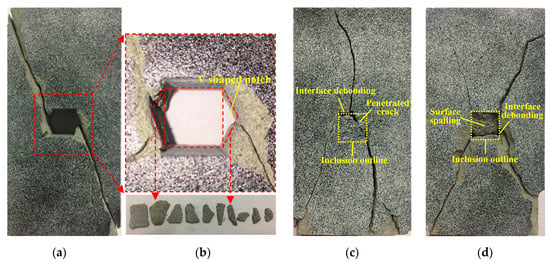
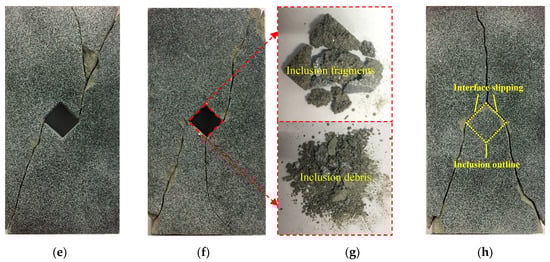
From Figure 12c, it can be considered that the failure mode of the specimen with α = 0° under the Filling Mode B is tensile dominated mixed failure, while the specimen with α = 45° is still dominated by shear failure. There are also three main macro cracks, including one tensile crack initiated from the upper or lower part of the rectangular inclusion, and two shear or mixed cracks that initiate from the inclusion corners. Different from the unfilled hole, the tensile cracks initiated from the upper and lower parts of the filled hole plays a key role in the rock failure. It should be noted that due to the relatively poor mechanical properties of the Type I infilling material, the inclusions are easily damaged by shear cracks. As shown in Figure 12f,g, the inclusion in 45° hole is cut into several fragments by shear cracks, accompanied by many particles or debris from the fracture surface of the infilling material.
For the specimen with α = 0° under the Filling Mode C, as shown in Figure 12d, the failure mode is shear dominated mixed failure. The specimen is basically cut into four parts by four conjugate shear or mixed cracks, showing a X shape, and obvious spalling can be observed along the crack path. While the failure pattern of the specimen with α = 45° under the Filling Mode C is composed of one tensile crack and two shear cracks sliding along the inclined interface of the inclusion, showing an inverted Y shape (Figure 12h). However, the inclusions are not penetrated through by the macro cracks due to the better mechanical properties of the Type II infilling material, but the interface debonding or slipping occurs.
In conclusion, the crack initiation, propagation and final failure pattern of the specimens with a square hole are affected not only by the filling mode but also by the hole angle. However, under different filling modes and hole angles, the failure mode of the specimens can be generally considered as mixed tensile-shear failure, and the difference is dominated by tensile or shear. In addition, it is found that the filling effect can effectively restrain the spalling on sidewalls of the square hole. The underlying mechanism is closely related to the stress distribution around the hole or inclusion. Notably, the effect of end friction on the crack propagation should not be ignored. Taking the specimen Sq-45-B as an example, the macro tensile crack initiated from the lower corner of the hole propagates parallel to the loading direction at first, but gradually deflects under the end friction effect when it approaches the bearing end of the specimen, finally forming a curved crack.
By observing the final failure patterns of pre-holed specimens and the analysis of fracture process in Section 3.4, especially the cracks characterized by strain localizations in the filled holes, summaries of typical crack patterns for each group of specimens are depicted in Figure 13, where T1 represents tensile cracks that initiate at the rock matrix and propagate straight; T2 represents tensile cracks that initiate at the inclusion interface and propagate straight; S1 represents shear cracks that initiate at the side corners of the hole in rock matrix and propagate obliquely; S2 represents shear cracks that initiate at the inclusion interface and propagate obliquely; TS represents a mixture of tensile and shear cracks that propagate with curvature; (T) represents tensile debonding at the inclusion boundary or tensile crack inside the inclusion; (S) represents shear slip along the inclusion interface or shear crack inside the inclusion; B represents buckling or slabbing on sidewalls.
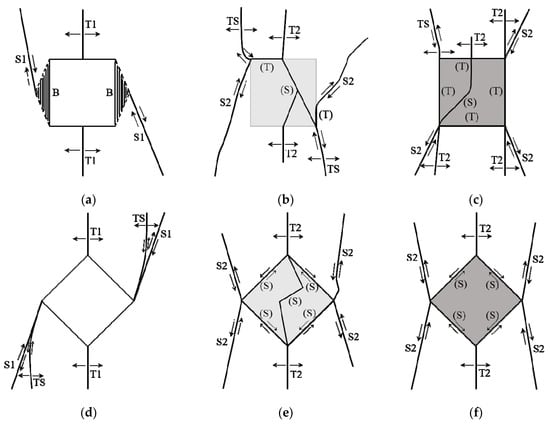
Figure 13.
Crack patterns around a square hole under different filling modes and hole inclination angles: (a) Sq-0-A; (b) Sq-0-B; (c) Sq-0-C; (d) Sq-45-A; (e) Sq-45-B; and (f) Sq-45-C.
In this study, as can be seen from Figure 13a,d, four types of cracks can be summarized around a square hole: T1 cracks due to tensile stress concentration at top and bottom parts, TS or S cracks distributed at corners and B cracks induced by compressive stress at sidewalls. Among them, B cracks only occur on the sidewalls of the hole with α = 0°, and TS cracks only occur at the corners of both sides of the hole with α = 45°. Compared with the unfilled hole, it can be seen from Figure 13b,c,e,f that the number of cracks around the filled hole significantly increases and the crack pattern is more complex, which can be mainly divided into five types, i.e., T2, S2, TS, (T) and (S). In addition, the crack behavior around the inclusion is also affected by the hole angle, especially the interface angle. For example, it is observed that the crack type in 0° inclusions is mainly interface debonding (T), while (S) cracks only occur inside inclusions. On the contrary, no (T) crack is observed in 45° inclusion. Interface slipping or internal slipping (S) are dominant in the 45° inclusion, and the surrounding cracks are mainly shear ones. It seems that the interface angle is related to the shear behavior. The interface slipping (S) is more prone to initiate at the inclined interface with a certain angle to the loading direction, and then slips along the interface into the rock matrix as S2 cracks. The results are basically consistent with the observations of Zaitsev and Wittmann [16] and Janeiro and Einstein [22]. They attributed this phenomenon to the shear stress on the inclined interface.
3.6. Crack Stress Thresholds
According to the method proposed in Section 3.4, several stress thresholds corresponding to the fracture process of intact specimens and pre-holed specimens were calculated, as listed in Table 4. The effect of filling mode and hole angle on the crack closure stress σcc, initiation stress σci and damage stress σcd of each group of specimens and their corresponding stress levels are shown in Figure 14. It can be seen from Figure 14a that the σcc of the pre-holed specimens with α = 0° and 45° are 12.14 MPa and 12.15 MPa, which are 39.30% and 39.25% lower than that of intact specimens, respectively. After filling, with the increase of the mechanical properties of the filling material, the σcc of the pre-holed specimens increases, but it is still smaller than that of the intact specimen. Among them, the increase rates of σcc of specimens with α = 0° and 45° are 13.10% and 6.01% in filling mode B, and 24.88% and 22.88% in Filling Mode C, respectively. The above results show that the crack closure stress of rock can be significantly reduced by the existence of holes and improved by the filling treatment, but it seems to be less affected by the hole angle. In addition, the crack closure stress levels σcc/σc of the pre-holed specimens also increase with the change of Filling Mode from A to C, but the increase rate is very small. The stress levels of specimens with α = 0° are 0.23–0.25, and that of specimens with α = 45° are 0.26–0.28. However, the stress levels of specimens with α = 45° are generally higher than that of specimens with α = 0°, especially in Filling Mode C, the stress level of the specimen with α = 45° is even greater than that of intact specimen. This indicates that the effect of hole angle on the crack closure stress levels of the pre-holed specimens is more significant than that of the filling effect.
Table 4.
Crack stress thresholds and corresponding stress levels of the specimens under uniaxial compression.
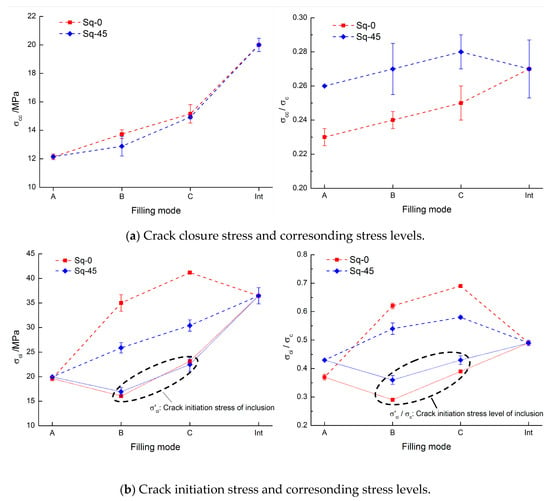
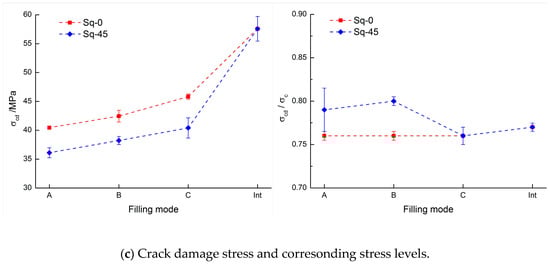
Figure 14.
Effect of filling mode and hole angle on typical stress thresholds of sandstone specimens.
The crack initiation stress and corresponding stress levels of each group of specimens are shown in Figure 14b. It can be seen that the crack initiation stresses of pre-holed specimens with α = 0° and 45° are 19.62 MPa and 20.00 MPa, which are 46.19% and 45.15% lower than that of intact specimens, respectively. After filling, it is interesting to note that for the specimens with inclusions, i.e., under Filling Mode B and C, there are two crack initiation stress values, σ′ci and σci, which are the crack initiation stress of inclusions and rock matrix, respectively, as mentioned in Section 3.4. Due to the weak mechanical properties of Type I inclusion and strong mechanical properties of Type II inclusion, the σ′ci of the pre-holed specimens first decreases and then increases with the change of filling mode from A to C, but the difference of σ′ci between 0° and 45° specimens is very small. However, the crack initiation stress levels σ′ci/σc of 0° specimens in Filling Modes B and C are 0.29 and 0.39, while those of 45° specimens are 0.36 and 0.43, respectively. The above results show that the hole angle has little effect on the σ′ci of inclusions, but has a significant enhancing effect on the corresponding stress levels, and the effect of 45° hole is greater than the 0° hole. On the other hand, the σci and σci/σc of rock matrix in the pre-holed specimens increase with the increase of the mechanical properties of the filling material, and the filled specimens with α = 0° is much larger than those with α = 45°. Among them, the σci/σc of 0° specimens under Filling Modes A, B and C are 0.37, 0.62 and 0.69, while that of 45° specimens are 0.43, 0.54 and 0.58, respectively. All in all, the hole and inclusion in specimens with α = 0° are easier to crack than that with α = 45°, but the rock matrix in filled specimens with α = 0° is more difficult to crack than that with α = 45°. This indicates that the filling effect can significantly change the stress distribution around the hole and produce similar effect of crack arrest, so as to significantly increase the crack initiation stress of rock matrix, and the degree of increase is related to the hole angle.
Figure 14c shows the crack damage stress σcd and corresponding stress levels σcd/σc of each group of specimens. Among them, the σcd of pre-holed specimens with α = 0° and 45° are 40.45 MPa and 36.11 MPa, which are 29.75% and 37.29% lower than that of intact specimens, respectively. After filling, the change of σcd with the filling mode is similar to that of UCS, which is basically linearly increasing with the change of Filling Mode from A to C, and the σcd of specimens with α = 0° is generally greater than that with α = 45°. However, the σcd/σc of specimens with α = 45° is slightly higher than that with α = 0°, but there is no significant difference among each group. The damage stress levels of specimens with α = 0° is 0.76 under different filling modes, while that of specimens with α = 45° is 0.76–0.80. The above results show that both the hole angle and the filling mode have an effect on the crack damage stress of the pre-holed specimen, but have little effect on the corresponding stress level.
4. Conclusions
- (1)
- Compared with the intact sandstone, the strength and deformation properties of specimens with a square hole are decreased, and the decrease rate is closely related to hole angle. After filling, the mechanical parameters of the pre-holed specimens are strengthened, and the strengthening effect of relatively rigid inclusions is much stronger than that of weak inclusions. Moreover, virtual extensometers were arranged on hole boundaries by DIC to measure hole deformation. It is found that the inclusions can restrain the hole deformation, especially the rigid inclusion can gradually passively support the surrounding rock matrix with the increase of load, thereby effectively improving the mechanical behavior of the pre-holed specimen.
- (2)
- The crack behavior and final failure pattern of the specimens with a square hole, especially the crack initiation position, are affected by the filling mode and the hole angle. The crack pattern around the square hole can be categorized into four types, while the number of cracks around the square inclusion increases and the crack pattern is more complex, which can be mainly divided into five types. Furthermore, the interface debonding tends to occur at the inclusion interface parallel to major principal stress direction, and the interface slipping tends to propagate along the inclined interface. The fracture evolution of the specimen during uniaxial compression proceeds from primary tensile cracks through secondary cracks to shear cracks, and the rock failure is mainly caused by secondary crack propagation and shear crack coalescence. The failure mode can be generally considered as mixed tensile–shear failure, and the difference is dominated by tension or shear. Notably, the inclusion not only has a certain crack arrest effect on rock matrix, but also can effectively inhibit sidewall spalling.
- (3)
- The damage and fracture evolution during uniaxial compression tests on sandstone specimens can be qualitatively and quantitatively characterized by DIC and AE techniques, and their results are in good agreement with the rock mechanical behavior. The AE counts and cumulative AE counts can be roughly divided into five periods or intervals, which correspond to five stages in the stress–strain curve of the specimen, i.e., pore compaction stage, elastic deformation stage, stable crack growth stage, unstable crack growth stage and rock failure stage. By verifying the major principal strain fields obtained by DIC, the critical points between these characteristic periods or intervals can be identified as the crack stress thresholds.
- (4)
- Since the crack closure stress is hard to be directly determined by the strain field, an objective approximate estimation method based on stress–strain curves was proposed. In addition, based on the observation of strain localizations on specimen with inclusions, the crack initiation stresses of inclusion and rock matrix were defined. The crack stress thresholds of sandstone can be significantly reduced by the hole and improved by the inclusion. The improvement effect of inclusion increases with the increase of mechanical properties of filling materials and is affected by the hole angle. The hole angle has little effect on crack closure stress, damage stress levels and initiation stress of inclusion, but has obvious effect on crack closure stress levels, damage stress, initiation stress of rock matrix and corresponding stress levels.
Author Contributions
Conceptualization, D.L.; data curation, D.L.; funding acquisition, Q.Z. and D.L.; investigation, Q.Z.; validation, D.L.; writing—original draft preparation, Q.Z.; writing—review and editing, D.L. Both authors have read and agreed to the published version of the manuscript.
Funding
This research was funded by the National Natural Science Foundation of China (No. 52074349), the Outstanding Youth Science Foundations of Hunan Province of China (No. 2019JJ20028) and the Fundamental Research Funds for the Central Universities of Central South University (No. 2019zzts884).
Conflicts of Interest
The authors declare no conflict of interest.
References
- Horii, H.; Nemat-Nasser, S. Compression-induced microcrack growth in brittle solids: Axial splitting and shear failure. J. Geophys. Res. Atmos. 1985, 90, 3105–3125. [Google Scholar] [CrossRef]
- Martini, C.D.; Read, R.S.; Martino, J.B. Observations of brittle failure around a circular test tunnel. Int. J. Rock Mech. Min. Sci. 1997, 34, 1065–1073. [Google Scholar] [CrossRef]
- Feng, F.; Chen, S.J.; Li, D.Y.; Hu, S.T.; Huang, W.P.; Li, B. Analysis of fractures of a hard rock specimen via unloading of central hole with different sectional shapes. Energy Sci. Eng. 2019, 7, 2265–2286. [Google Scholar] [CrossRef]
- Lajtai, E.Z.; Lajtai, V.N. The collapse of cavities. Int. J. Rock Mech. Min. Sci. Geomech. Abstr. 1975, 12, 81–86. [Google Scholar] [CrossRef]
- Li, D.Y.; Zhu, Q.Q.; Zhou, Z.L.; Li, X.B.; Ranjith, P.G. Fracture analysis of marble specimens with a hole under uniaxial compression by digital image correlation. Eng. Fract. Mech. 2017, 183, 109–124. [Google Scholar] [CrossRef]
- Li, D.Y.; Han, Z.Y.; Sun, X.L.; Zhou, T.; Li, X.B. Dynamic mechanical properties and fracturing behavior of marble specimens containing single and double flaws in SHPB tests. Rock Mech. Rock Eng. 2018, 52, 1623–1643. [Google Scholar] [CrossRef]
- Sammis, C.G.; Ashby, M.F. The failure of brittle porous solids under compressive stress states. Acta Metall. 1986, 34, 511–526. [Google Scholar] [CrossRef]
- Wong, R.H.C.; Lin, P.; Tang, C.A. Experimental and numerical study on splitting failure of brittle solids containing single pore under uniaxial compression. Mech. Mater. 2006, 38, 142–159. [Google Scholar] [CrossRef]
- Zeng, W.; Yang, S.Q.; Tian, W.L. Experimental and numerical investigation of brittle sandstone specimens containing different shapes of holes under uniaxial compression. Eng. Fract. Mech. 2018, 200, 430–450. [Google Scholar] [CrossRef]
- Kirsten, H.A.D.; Stacey, T.R. Backfill support mechanisms in stopes with low convergence. In Backfill in South African Mines; South African Institute of Mining and Metallurgy and Association of Mine Managers of South Africa: Johannesburg, South Africa, 1988; pp. 137–151. [Google Scholar]
- Han, Z.Y.; Li, D.Y.; Zhou, T.; Zhu, Q.Q.; Ranjith, P.G. Experimental study of stress wave propagation and energy characteristics across rock specimens containing cemented mortar joint with various thicknesses. Int. J. Rock Mech. Min. Sci. 2020, 131, 104352. [Google Scholar] [CrossRef]
- Inglis, C.E. Stresses in a plate due to presence of cracks and sharp corners. Inst. Naval. Arch. 1913, 55, 219–230. [Google Scholar]
- Griffith, A.A. The phenomenon of rupture and flow in solids. Philos. Trans. R. Soc. A 1920, 221, 163–198. [Google Scholar]
- Kirsch, E.G. Die Theorie der elasitzität und die bedürfnisse der festigkeitslehre. Z. Ver. Dtsch. Ing. 1898, 42, 797–807. [Google Scholar]
- Goodier, J.N. Concentration of stress around spherical and cylindrical inclusions and flaws. J. Appl. Mech. 1933, 1, 39–44. [Google Scholar]
- Zaitsev, Y.B.; Wittmann, F.H. Simulation of crack propagation and failure of concrete. Mat. Struc. 1981, 14, 357–365. [Google Scholar] [CrossRef]
- Maji, A.K.; Shah, S.P. Application of acoustic emission and laser holography to study microfracture in concrete. ACI Spec. Publ. 1989, 112, 83–110. [Google Scholar]
- Tasdemir, M.A.; Shah, S.P. Crack propagation in concrete under compression. J. Eng. Mech. 1989, 116, 1058–1076. [Google Scholar] [CrossRef]
- Maji, A.K.; Tasdemir, M.A.; Shah, S.P. Mixed mode crack propagation in quasi-brittle materials. Eng. Fract. Mech. 1991, 38, 129–145. [Google Scholar] [CrossRef]
- Zhang, B.; Li, S.C.; Zhang, D.F.; Li, M.T.; Shao, D.L. Uniaxial compression mechanical property test, fracture and damage analysis of similar material of jointed rock mass with filled cracks. Rock Soil Mech. 2012, 33, 1647–1652. [Google Scholar]
- Zhuang, X.; Chun, J.; Zhu, H. A comparative study on unfilled and filled crack propagation for rock-like brittle material. Theor. Appl. Fract. Mech. 2014, 72, 110–120. [Google Scholar] [CrossRef]
- Janeiro, R.P.; Einstein, H.H. Experimental study of the cracking behavior of specimens containing inclusions (under uniaxial compression). Int. J. Fract. 2010, 164, 83–102. [Google Scholar] [CrossRef]
- Wu, Z.; Wong, L.N.Y. Modeling cracking behavior of rock mass containing inclusions using the enriched numerical manifold method. Eng. Geol. 2013, 162, 1–13. [Google Scholar] [CrossRef]
- Du, M.R.; Jing, H.W.; Su, H.J.; Zhu, T.T.; Chen, M.L. Strength and failure characteristics of sandstone containing two circular holes filled with two types of inclusions under uniaxial compression. J. Cent. South Univ. 2017, 24, 2487–2495. [Google Scholar] [CrossRef]
- Miao, S.T.; Pan, P.Z.; Wu, Z.H.; Li, S.J.; Zhao, S.K. Fracture analysis of sandstone with a single filled flaw under uniaxial compression. Eng. Fract. Mech. 2018, 204, 319–343. [Google Scholar] [CrossRef]
- Zhu, Q.Q.; Li, D.Y.; Han, Z.Y.; Li, X.B.; Zhou, Z.L. Mechanical properties and fracture evolution of sandstone specimens containing different inclusions under uniaxial compression. Int. J. Rock Mech. Min. Sci. 2019, 115, 33–47. [Google Scholar] [CrossRef]
- Wang, Y.X.; Zhang, H.; Lin, H.; Zhao, Y.L.; Li, X.; Liu, Y. Mechanical behavior and failure analysis of fracture-filled gneissic granite. Theor. Appl. Fract. Mech. 2020, 108, 102674. [Google Scholar] [CrossRef]
- Brown, E.T. Rock Characterization, Testing & Monitoring: ISRM Suggested Methods; Pergamon Press: London, UK, 1981. [Google Scholar]
- Nolen-Hoeksema, R.C.; Gordon, R.B. Optical detection of crack patterns in the opening-mode fracture of marble. Int. J. Rock Mech. Min. Sci. Geomech. Abstr. 1987, 24, 135–144. [Google Scholar] [CrossRef]
- Sutton, M.A.; Orteu, J.J.; Schreier, H. Image Correlation for Shape, Motion and Deformation Measurements; Springer: New York, NY, USA, 2009. [Google Scholar]
- Zhou, Z.L.; Wang, H.Q.; Cai, X.; Chen, L.; E, Y.D.; Cheng, R.S. Damage evolution and failure behavior of post-mainshock damaged rocks under aftershock effects. Energies 2019, 12, 4429. [Google Scholar] [CrossRef]
- Yamaguchi, U.; Yamatomi, J. A consideration on the effect of backfill for the ground stability. In Proceedings of the International Symposium on Mining with Backfill, Lulea, Sweden, 7–9 June 1983; pp. 443–451. [Google Scholar]
- Cai, X.; Zhou, Z.L.; Liu, K.W.; Du, X.M.; Zang, H.Z. Water-weakening effects on the mechanical behavior of different rock types: Phenomena and mechanisms. Appl. Sci. 2019, 9, 4450. [Google Scholar] [CrossRef]
- Zhang, H.; Fu, D.H.; Song, H.P.; Kang, Y.L.; Huang, G.Y.; Qi, G.; Li, J.Y. Damage and fracture investigation of three-point bending notched sandstone beams by DIC and AE techniques. Rock Mech. Rock Eng. 2015, 48, 1297–1303. [Google Scholar] [CrossRef]
- Zhao, X.G.; Cai, M.; Wang, J.; Li, P.F.; Ma, L.K. Objective determination of crack initiation stress of brittle rocks under compression using AE measurement. Rock Mech. Rock Eng. 2015, 48, 2473–2484. [Google Scholar] [CrossRef]
- Kim, J.S.; Lee, K.S.; Cho, W.J.; Choi, H.J.; Cho, G.C. A comparative evaluation of stress–strain and acoustic emission methods for quantitative damage assessments of brittle rock. Rock Mech. Rock Eng. 2015, 48, 495–508. [Google Scholar] [CrossRef]
- Wu, H.; Zhao, G.Y.; Liang, W.Z. Mechanical properties and fracture characteristics of pre-holed rocks subjected to uniaxial loading: A comparative analysis of five hole shapes. Theor. Appl. Fract. Mech. 2020, 105, 102433. [Google Scholar] [CrossRef]
- Wu, H.; Zhao, G.Y.; Liang, W.Z. Mechanical response and fracture behavior of brittle rocks containing two inverted U-shaped holes under uniaxial loading. Appl. Sci. 2019, 9, 5327. [Google Scholar] [CrossRef]
- Weng, L.; Wu, Z.J.; Li, X.B. Mesodamage characteristics of rock with a pre-cut opening under combined static-dynamic loads: A nuclear magnetic resonance (NMR) investigation. Rock Mech. Rock Eng. 2018, 51, 2339–2354. [Google Scholar] [CrossRef]
- Sagong, M.; Bobet, A. Coalescence of multiple flaws in a rock-model material in uniaxial compression. Int. J. Rock Mech. Min. Sci. 2002, 39, 229–241. [Google Scholar] [CrossRef]
- Yang, S.Q.; Jing, H.W.; Li, Y.H.; Wang, S.Y. An experimental study of the fracture coalescence behaviour of brittle sandstone specimens containing three fissures. Rock Mech. Rock Eng. 2012, 45, 563–582. [Google Scholar] [CrossRef]
- Wu, W.X.; Gong, F.Q.; Yang, W.M. Experimental simulation study of spalling in deep rectangular tunnel with plastic fine grain marble. Tunn. Undergr. Space Technol. 2020, 98, 103319. [Google Scholar] [CrossRef]
- Qiu, J.D.; Li, D.Y.; Li, X.B.; Zhu, Q.Q. Numerical investigation on the stress evolution and failure behavior for deep roadway under blasting disturbance. Soil Dyn. Earthq. Eng. 2020, 137, 106278. [Google Scholar] [CrossRef]


Publisher’s Note: MDPI stays neutral with regard to jurisdictional claims in published maps and institutional affiliations. |
© 2020 by the authors. Licensee MDPI, Basel, Switzerland. This article is an open access article distributed under the terms and conditions of the Creative Commons Attribution (CC BY) license (http://creativecommons.org/licenses/by/4.0/).