Article

Fault Investigation of Circulation Pumps to Detect Impeller Clogging

by
Vincent Becker
1,2,
Thilo Schwamm
1,
Sven Urschel
1,* and
Jose Alfonso Antonino-Daviu
2
1
University of Applied Sciences Kaiserslautern, Schoenstraße 11, 67659 Kaiserslautern, Germany
2
Instituto Tecnológico de la Energía, Universitat Politècnica de València (UPV), Camino de Vera s/n, 46022 Valencia, Spain
*
Author to whom correspondence should be addressed.
Appl. Sci. 2020, 10(21), 7550; https://doi.org/10.3390/app10217550
Submission received: 30 September 2020 / Revised: 20 October 2020 / Accepted: 23 October 2020 / Published: 27 October 2020
(This article belongs to the Special Issue Modeling, Design and Control of Electric Machines)

Abstract

:
Pumps have a wide range of applications. Methods for fault detection of motors are increasingly being used for pumps. In the context of this paper, a test bench is built to investigate circulation pumps for faults. As a use case, the fault of impeller clogging was first measured and then examined with the help of motor current signature analysis. It can be seen that there are four frequencies at which there is an increase in amplitude in case of a fault. The sidebands around the supply frequency are in particular focus. The clogging of three and four of a total of seven channels leads to the highest amplitudes at the fault frequencies. The efficiency is reduced by 9 to 15% in case of faulty operation. These results indicate that the implementation of fault detection algorithms on the pump electronics represents added value for the pump operator. Furthermore, the results can be transferred to other applications.

1. Introduction

In the industry and the service sectors, pumps are applied to transport liquids. Pumps are driven by different types of electric motors. In the past, induction motors (IM) were used as the motor in most cases. Due to their higher efficiency, permanent magnet synchronous motors (PMSM) are now increasingly applied.
A field of application where pumps are used the transportation of water in heating systems. In Europe alone, the operation of over 100 million circulation pumps accounts for 2–3% of total electrical energy consumption [1]. In order to meet the efficiency requirements of the European Union, they are constructed as PMSM driven wet-rotor pumps [2,3]. Control, frequency converter, motor and impeller are combined in one integrated product [4] (see Figure 1). Microcontrollers are used to control these pumps. In addition to current tasks, such as controlling the pump [5] and motor [4] or determining parameters such as flow or head [6], the electronics provide a platform for implementing fault detection algorithms. A few hard faults, such as overvoltage, overheating and rotor blockage can already be detected by new types of circulation pumps [7,8]. It is shown in the literature that in addition to a potential failure, faults can also reduce the efficiency of a motor or pump [9]. Due to the large number of pumps in operation, a large amount of energy could be saved by the application of fault-detection algorithms. In circulation pumps, faults can be bearing wear, deformation of the can, dry-running or contamination of the rotor space, impeller damage, clogging of the impeller or cavitation.
Before an application of fault detection algorithms is discussed in detail, it is necessary to analyze which faults and on the basis of which method can be detected. In order to save additional costs for sensors, the analysis should be limited to the data that is available anyway. For circulation pumps only the motor current is available [4]. The most widespread approach for motor fault detection on the basis of motor current evaluation is the motor current signature analysis (MCSA). The MCSA is based on the Fourier analysis of the motor current in stationary operation [10]. The MCSA, which was developed for fault detection of IM, is used today for different motor types, as well as the PMSM. Ref. [11] gives an overview of potential faults of PMSM including magnet damage and demagnetization, eccentricity, unbalanced magnetic pull, bearing damage and stator winding faults. Another current based approach is the space vector angle fluctuation method. This method is mainly used for fault detection of IM [12]. While several approaches for the detection of typical motor faults can be found in the literature, there are significantly fewer approaches for the detection of faults in pumps that are based on the motor current evaluation.
In [13] it is shown that damaged impeller and pipe blockages can be detected by analyzing the pattern of the d-q-current. In [14], damaged impellers are analyzed with the help of MCSA. It is shown that the fault slightly influences the amplitude of a sideband in MCSA. In [15] a clogged impeller is examined and a decrease in the effective value of the motor current is detected. Ref. [16] shows a successful detection of cavitation phenomena using an adapted MCSA. The papers [13,14,15,16] are all based on driving the pump via IM. In [17], an approach to detect dry running, bearing failure and impeller clogging based on MCSA is shown, where the pump is operated by PMSM.
Since circulation pumps are driven by PMSM and the d-current is controlled to zero, approaches based on the d-q-current pattern are not applicable. After analysis of the state of the art, the application of MCSA looks promising. However, as is well known, the implementation of spectral analysis requires a large storage capacity and computing power from the electronics. Not all applications can provide this. Some publications show that MCSA can also be implemented on electronics that do not meet the requirements for a spectral analysis [18,19,20]. One approach is that only defined frequencies are examined, which minimizes computing and storage costs.
In the context of this paper, a detailed analysis of the fault impeller clogging takes place. For this purpose, a circulation pump is measured in a specially constructed test bench. The data is recorded in a healthy condition and for different levels of clogging. The data is then analyzed in terms of efficiency and fault indicators. The MCSA is used for fault analysis. The analysis is completed by comparison with the state of the art. The results are the basis for the implementation of fault detection algorithms.

2. Materials and Methods

The following is an introduction to the design and the concept of measuring the circulation pumps with the aim of fault detection. This is followed by an introduction to the theory of detecting impeller faults in pumps. The section is concluded with a description of the test procedure.

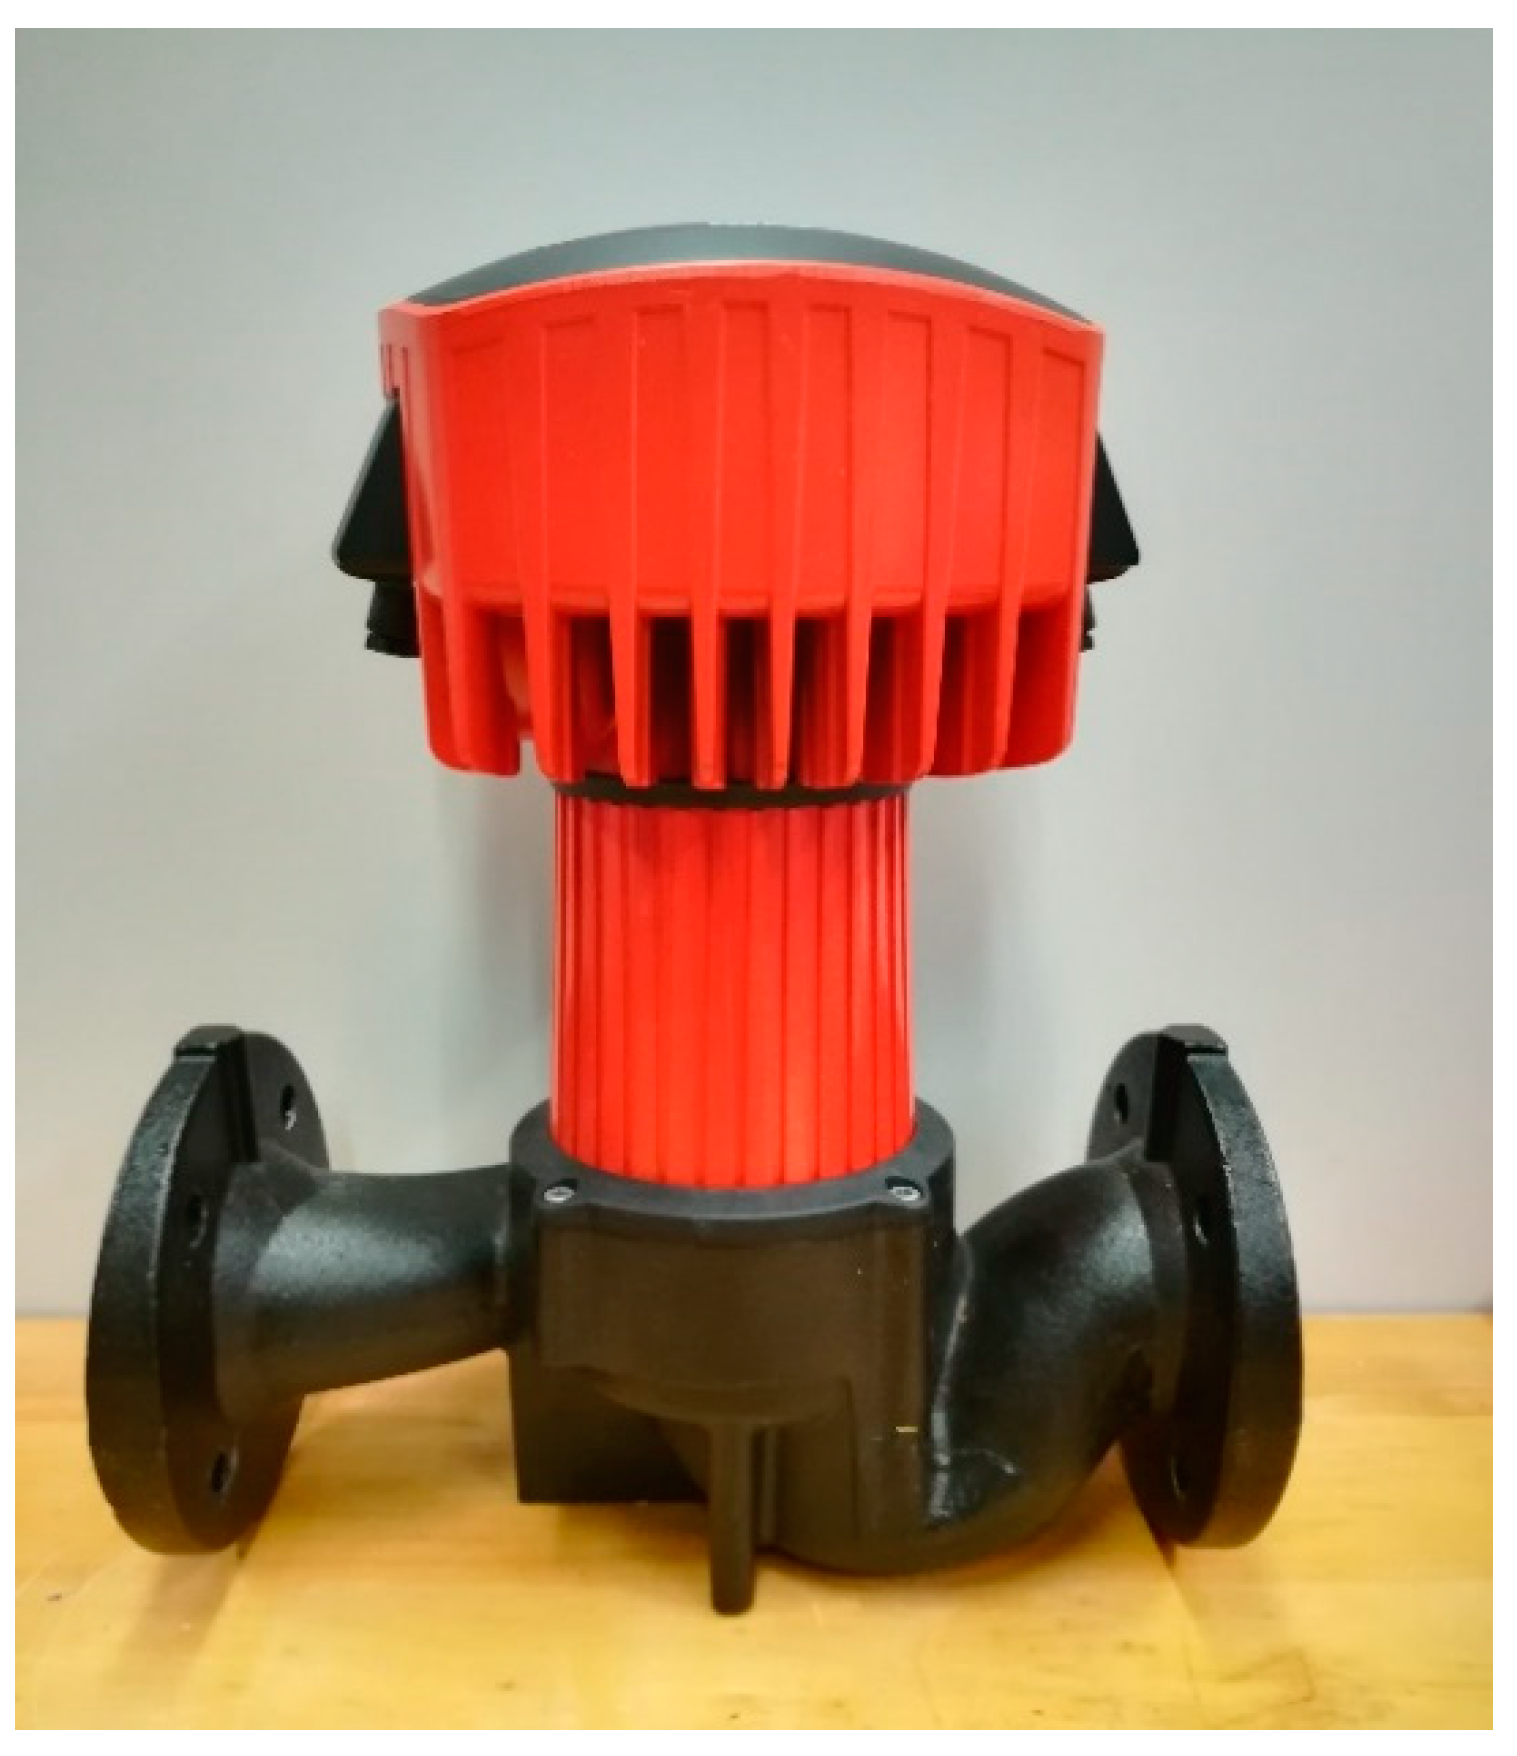
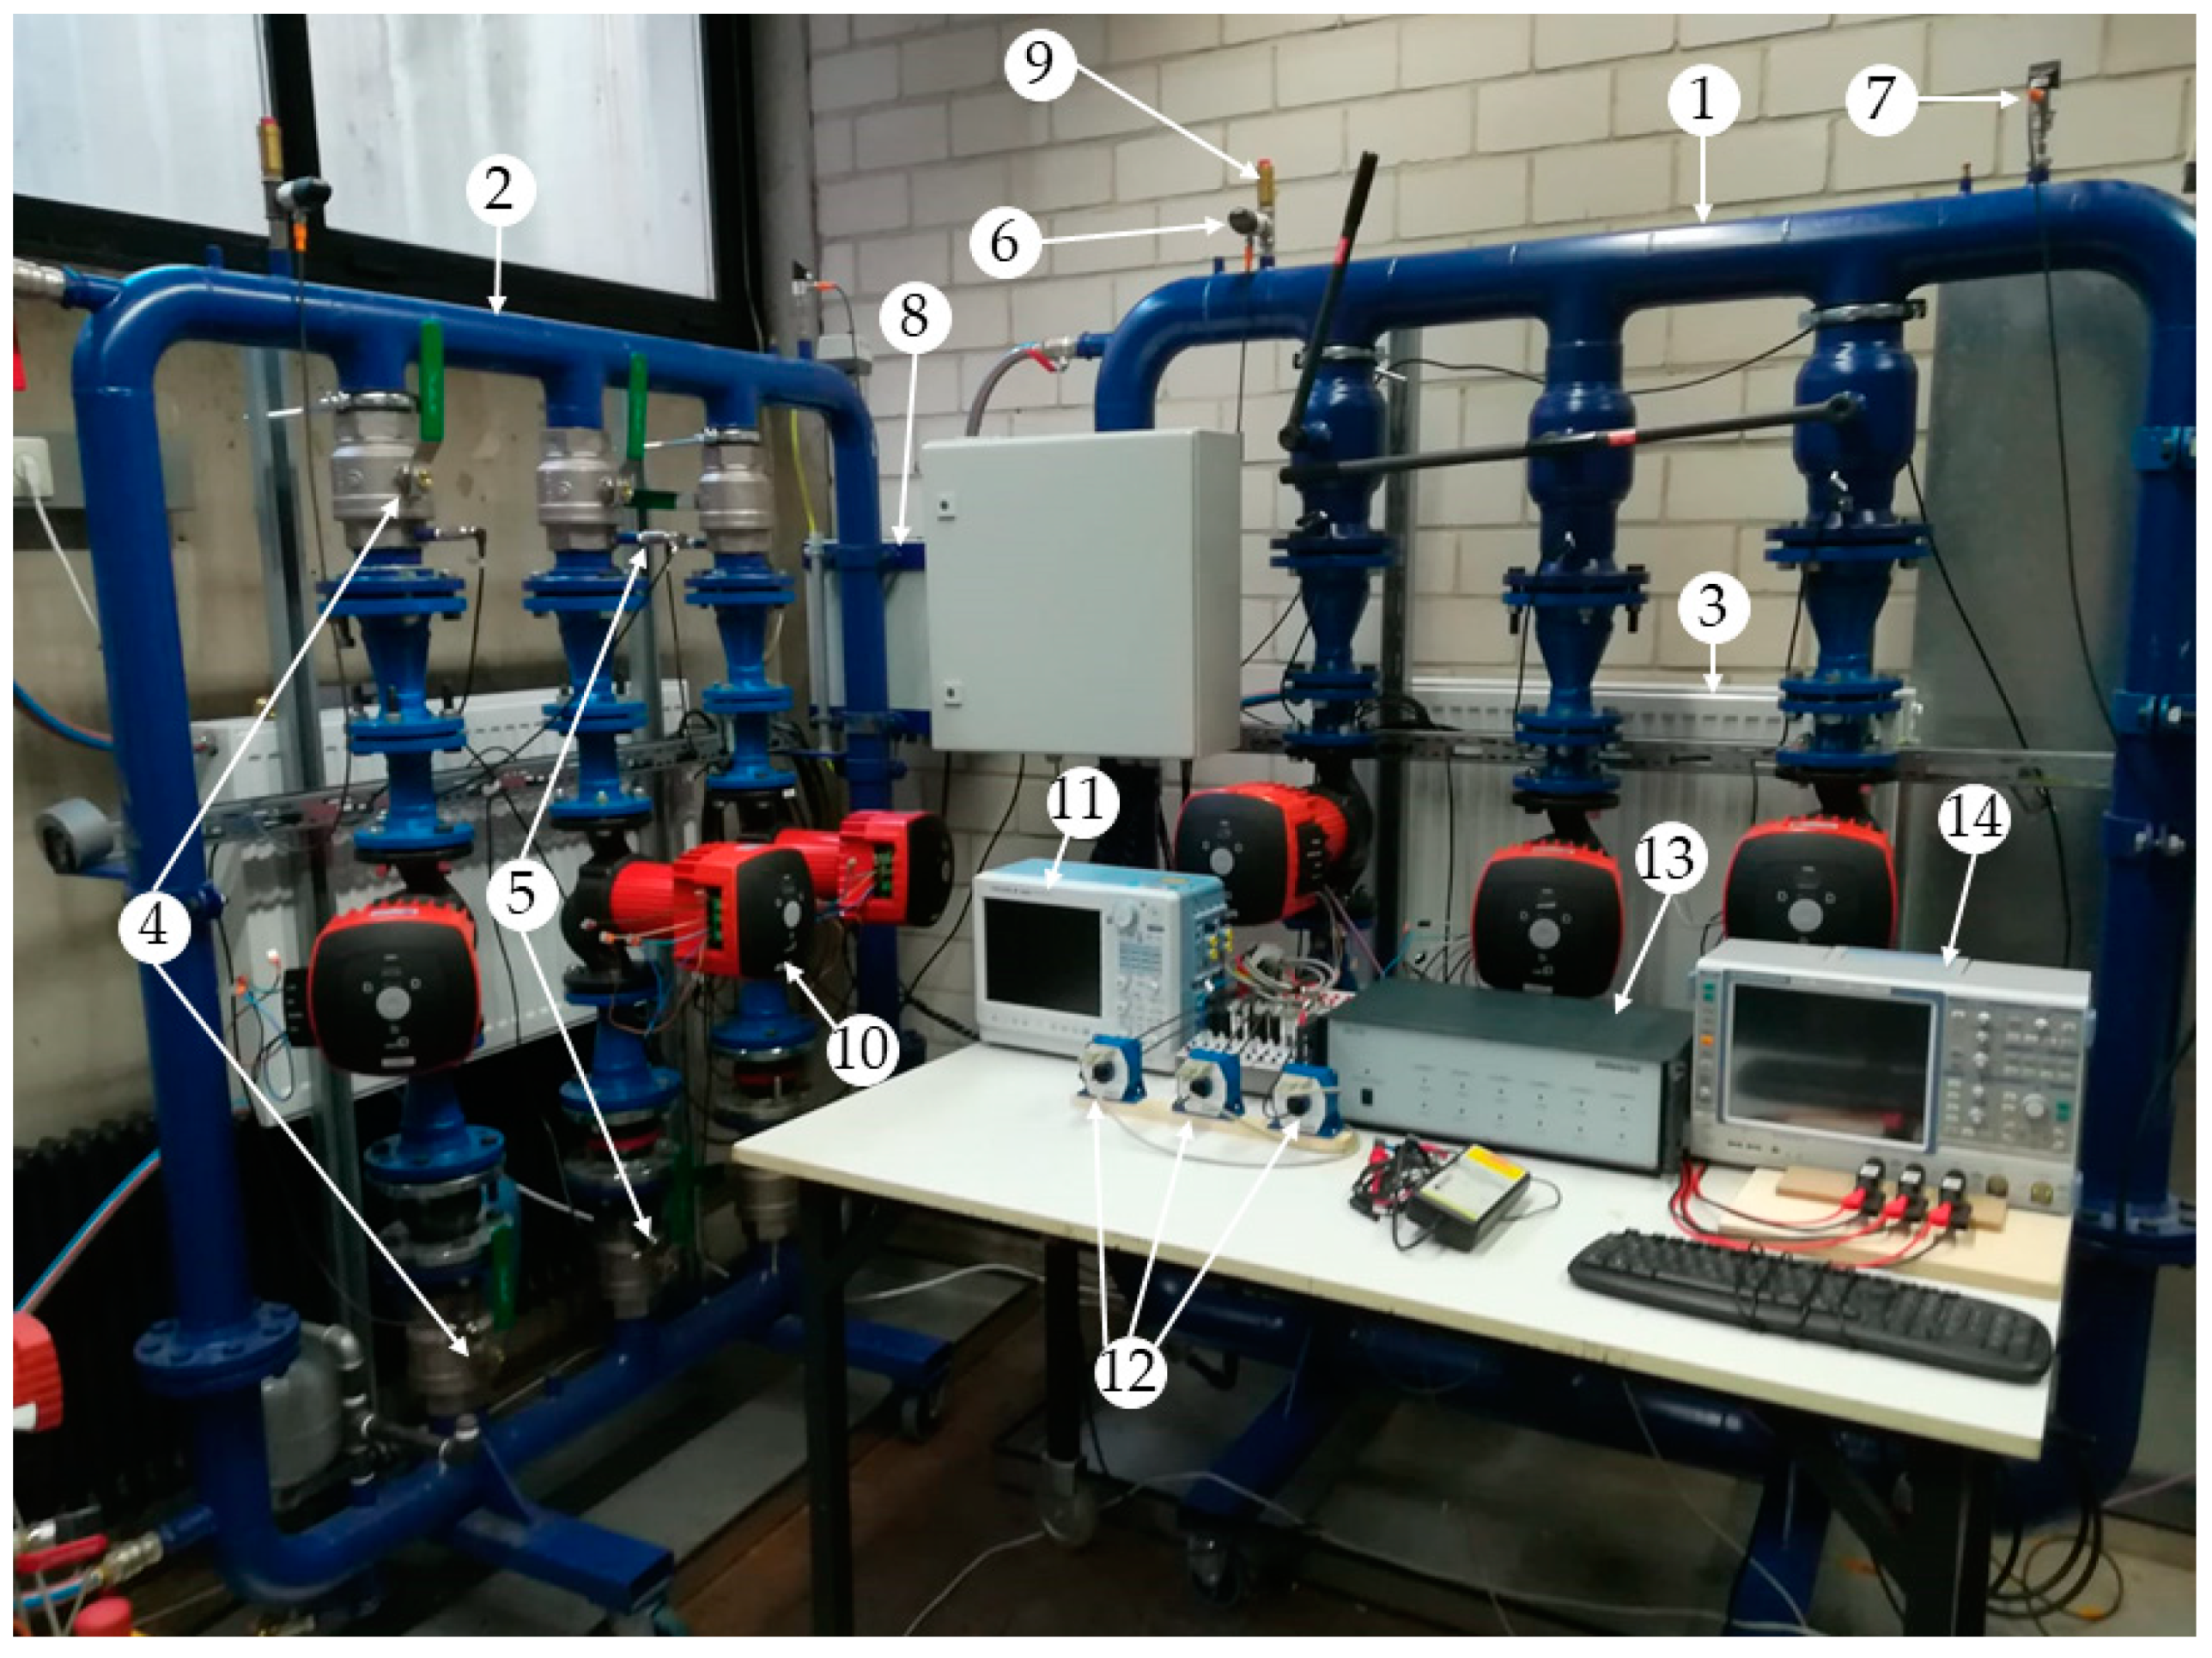
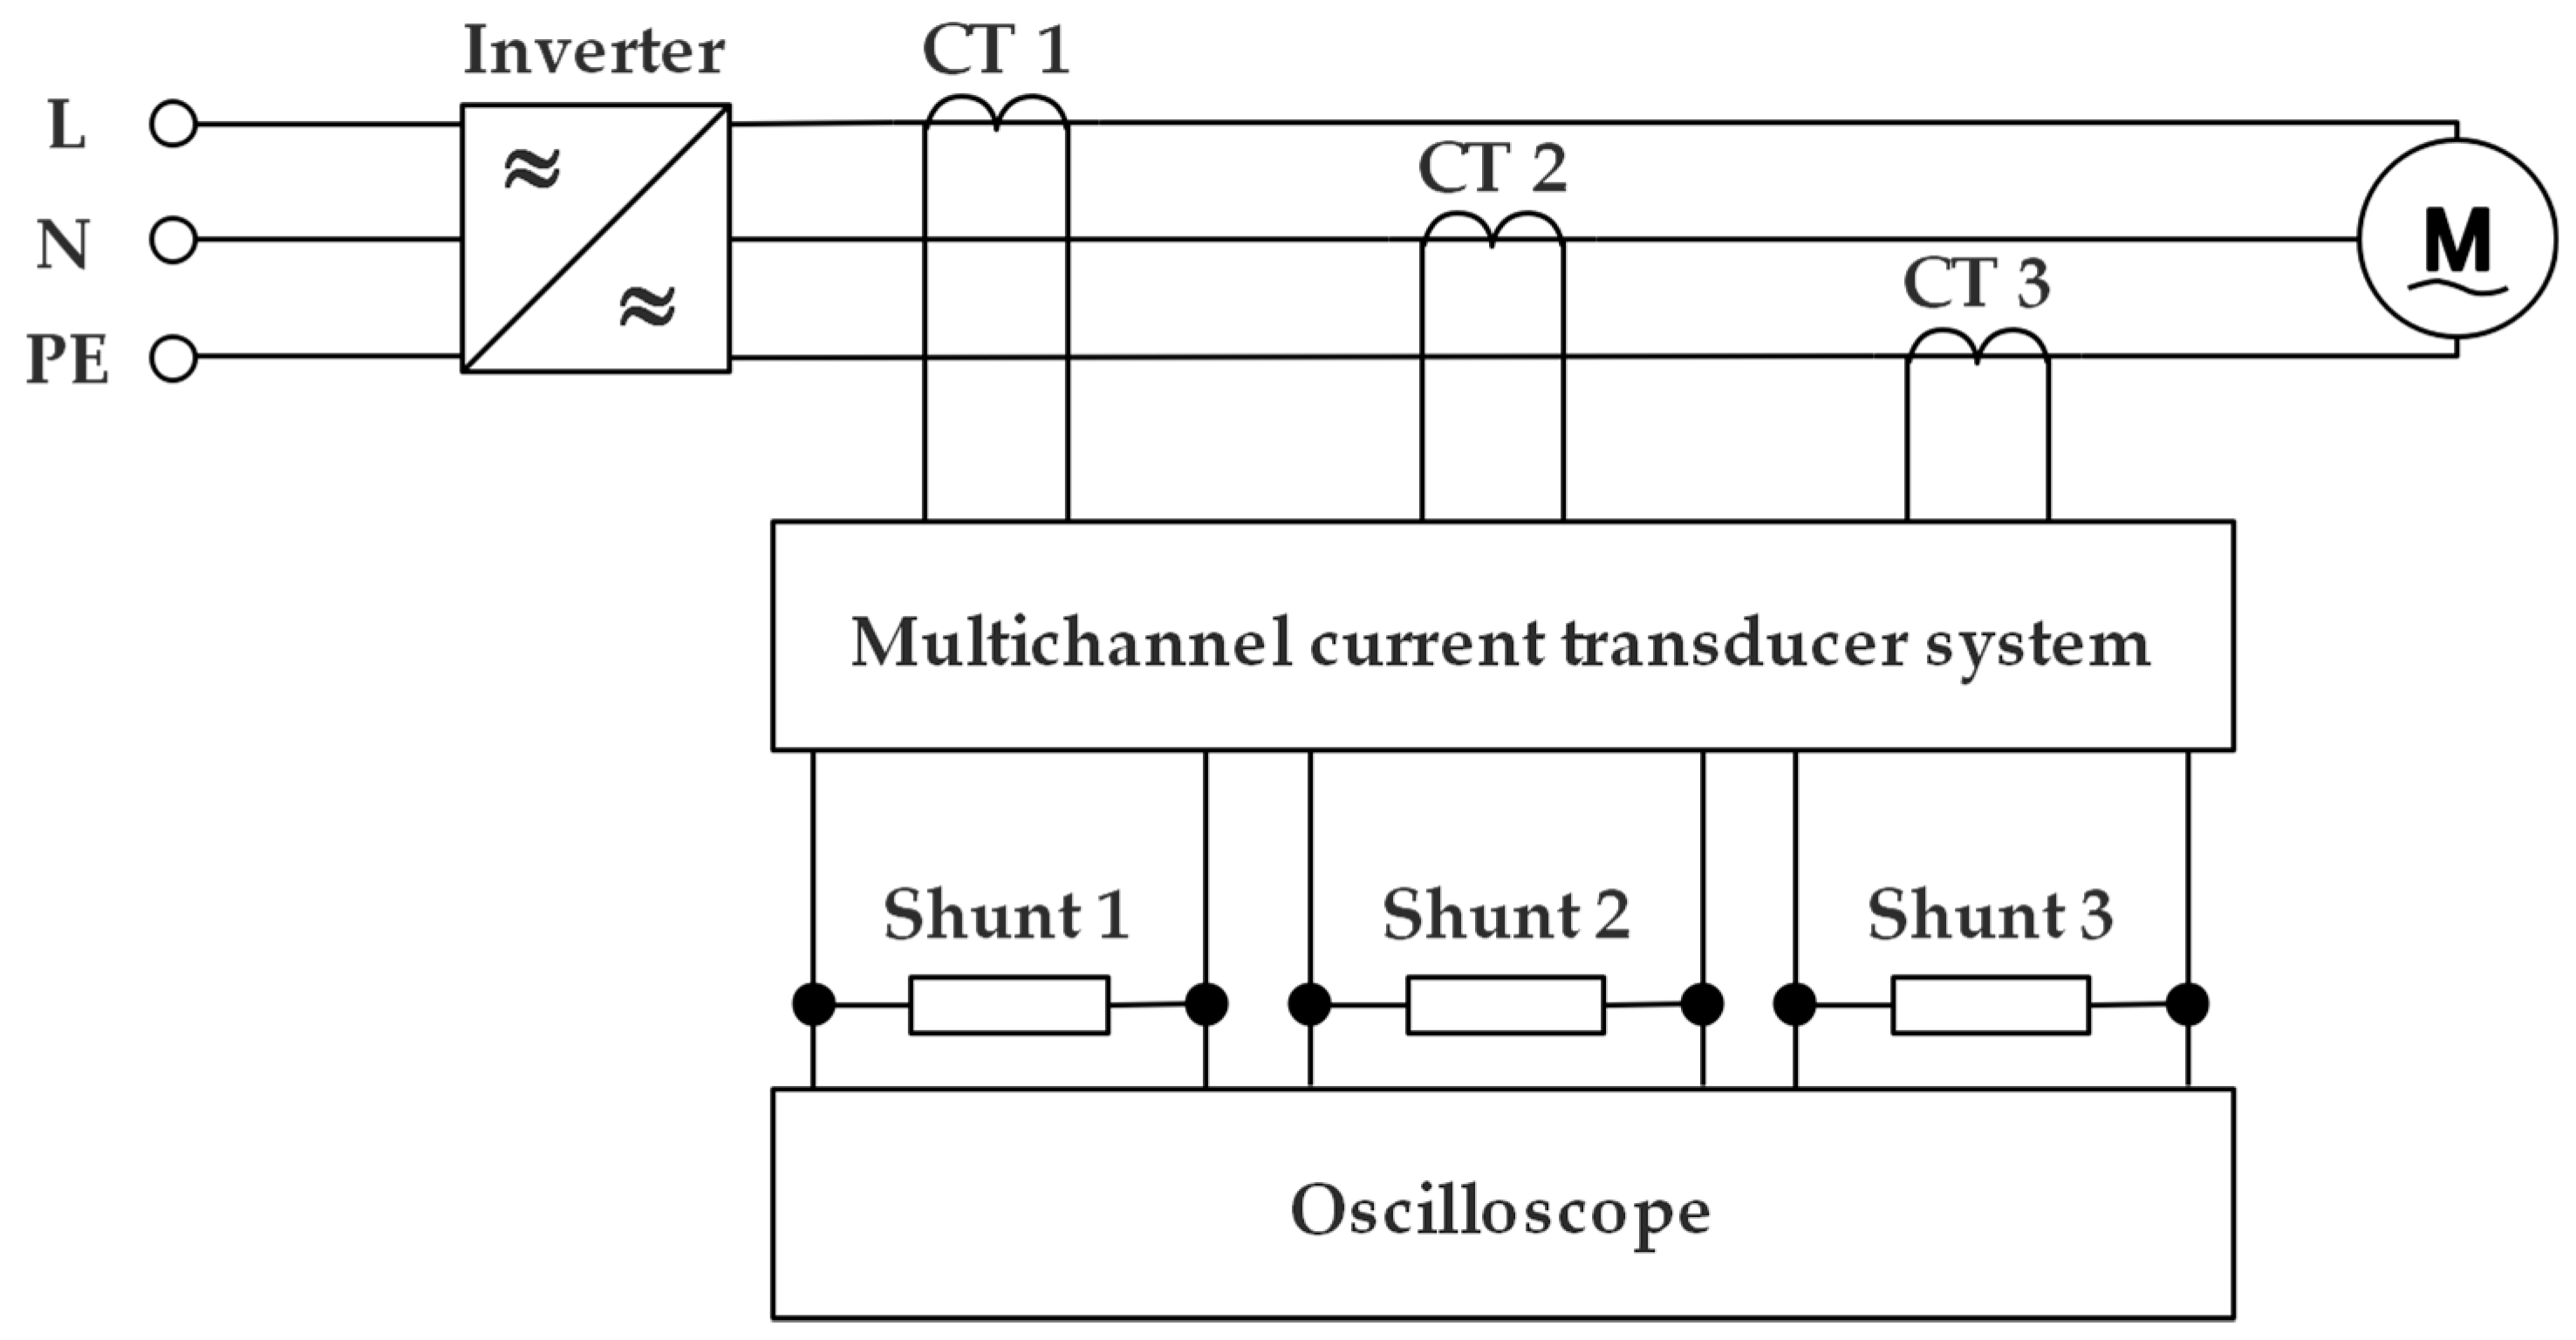
2.1. Experimental Setup

To find out whether the above-mentioned faults can be detected, a test bench is required. This test bench must fulfill two different requirements. The first requirement is that the test bench has to provide all relevant data. This includes an accurate acquisition of the motor currents with a high sampling rate and the acquisition of static variables such as current, voltage, flow and head. Due to the background of testing circulation pumps, the second requirement is that it should be possible to carry out life-accelerated tests. In order to record the wear process of a pump during a life accelerated test, the test bench must allow automatic data acquisition. The design and measuring the concept of the built test bench is explained in the following.
Two hydraulic circuits were combined into one test bench (see Figure 2). Each hydraulic circuit consists of five parallel vertical pipes. The larger circuit (see ① in Figure 2) had a nominal diameter of DN 100 and the smaller one ② had a nominal diameter of DN 80. Pumps can be installed in the three middle pipes. The medium flows through the outer pipes back to the suction port of the pumps. Additional radiators ③ were mounted on the back of both hydraulic circuits, which can be switched on if the medium temperature is too high. Shut-off valves ④ were installed in each of the central pipes on the suction side and the pressure side. They allow a complete separation of the single pipes, but also the change of the hydraulic resistance and thus the load of the pump in a pipe strand. In addition, pressure sensors ⑤ (IFM PU5415) were installed in each pipe strand on the pressure and suction side of the pump. They measure the differential pressure provided by the pump. The measuring signal of the pressure sensors is transmitted to the data acquisition system (NI USB-6363) via an 0–10 V signal.
Sophisticated safety technology is particularly necessary for life-accelerated tests. For this reason, an electronic pressure switch ⑥ (WIKA PSD-30) and an electronic temperature switch ⑦ (WIKA TSD-30) were used in both circuits. Both were integrated into the enabling logic of the energy supply to the pumps. The pressure switch enables an absolute pressure of 1 bar or more, which ensures that no pressure loss of the test bench, e.g., due to leakage, occurs. It closed from a pressure of 5.5 bar. The temperature switch enabled temperatures of up to 50 °C. As a safety switchgear a Siemens 3TK2825-1BB40 is used. An electronic time relay (3RP1555-1AP3O) is additionally integrated into the enabling logic. This makes it possible for the supply to the pump to be automatically switched on and off for certain periods of time. The electronics and safety technology are designed for pumps with a one-phase connection. Pumps with a three-phase connection can be tested on the test bench, but cannot be integrated into the safety engineering. The electrical components are located in a control cabinet ⑧. Additional mechanical protection was provided by a pressure relief valve, which is triggered at a pressure of 6 bar ⑨.
A circulation pump ⑩ with a maximum power consumption of 1.1 kW and a nominal pipe size DN 50 was used as a test item. The functional principle is based on a wet-rotor pump driven by an 8-pole PMSM. The motor was fed by an integrated converter with the option to set the speed to any value between 1000 and 3000 rpm. The impeller was designed as a radial impeller with seven blades. The pump data can be transferred via a Modbus interface. The pump supplies important parameters such as flow and head. The typical accuracy of flow estimation of that kind of circulation pump is 5% of the final value [8].
The measurement of electrical values is designed in such a way that only one pump can be measured at a single time. With the help of the power analyzer Yokogawa PX8000 ⑪ the one-phase input values (U, I, power factor) of the pump are measured. To record the motor values, the pump lines were led to the outside. The processing of the signals takes place with the help of the following measuring set-up, whereby Figure 3 shows a representation of the electrical plan. The motor current induces an equivalent voltage signal in the current transformer ⑫ (LEM IT 400-S). This signal is passed on to a current transformer system ⑬ (Signaltec MCTS), whose internal power supplies are galvanically isolated from each other as well as from ground potential. On the one hand, this system increases the range of the measuring signal and on the other hand, both external and internal disturbances are reduced. The current output signal is then converted into an equivalent voltage signal via shunts (Yokogawa 19/SH5/BNC/0.05) for acquisition on the oscilloscope ⑭ (Rhode and Schwarz RTE 1034).

2.2. Fault Detection of Pumps

It has been shown that faulty impellers can lead to a reduction of head and flow [14]. In the case of built-in head and flow sensors, such a fault could be detected. Since circulation pumps calculate head and flow, these variables can be used for fault detection. However, these two variables were determined based on stored characteristic curves and a motor current measurement [6]. As the stored curves only apply to the healthy condition and the motor current was dependent on the process curve, these values cannot be used for fault detection. The change of the current consumption due to a pump fault, as shown in [15], cannot be used for the mentioned reason.
Features that are independent of the process are more suitable. These include the amplitudes at certain fault frequencies of MCSA. When evaluating the motor current spectrum, attention must be paid to the damping behavior of the motor, which was decisively influenced by the motor inertia. The higher the frequency of a load oscillation, the stronger the damping by the transfer behavior of the motor.
A typical frequency that can be used for fault detection is the blade pass frequency (BPF). Due to the finite number of blades, vibrations can occur, which can be seen in both vibration and current spectrum. The frequency where this component appears in the current spectrum was calculated using Equation (1), where k1 is a positive integer, Nb the number of blades, p the number of pole pairs and fs the supply frequency [21]. However, Equation (1) only applies to motors without slip.
f B P F = ( 1 ± k 1 N b p ) · f s .
Amplitudes at fBPF, which can also occur in the healthy condition of a pump, can be influenced by faults. In [16] it is shown, that the amplitude of the fBPF component is increased in the cavitation situation. The results of [14] indicate a decrease of amplitude at fBPF if the impeller has inlet and exit tip faults. The analysis should also consider the fact that the fault frequencies of fBPF can be equal to the fault frequency in the case of the fault of eccentricity [22]. In [23] it is written that the wear of the impeller can influence the amplitude at fBPF. Furthermore, it can be seen in [23] that unbalance or misalignment can influence an additional fault frequency. These oscillations occur in the sidebands of the supply frequency, see Equation (2). In [17], it is shown that the amplitude at this frequency is influenced by the faults dry running, impeller clogging and bearing failure of a pump.
f r , p u m p = ( 1 ± 1 p ) · f s
These frequencies can also be equal to frequencies of faults, which cause eccentricity [22]. This has to be considered when analyzing the data.

2.3. Experimental Execution

The pump described in Section 2.1 was used to investigate the fault impeller clogging. The pump was installed in the middle strand of the right hydraulic circuit (see Figure 2), with the left and right strands remaining shut off. The setup presented in Section 2.1 was used to record the values of the pump and process. The sampling frequency of the current measurement with the help of the oscilloscope is set to 10 kHz at a recording time of 30 s. At each load point, a total of 30 values are recorded for the static values and averaged afterwards.
As a reference point, the shut-off valve on the pressure side is set so that a flow of 17.9 m3/h and a head of 6.6 m at a speed of 2500 rpm was achieved. To avoid turbulence in the pump, the down shut-off valve remained completely open. Additional measurement data were recorded at speeds of 1800 and 1000 rpm. This is the reference point for the following test runs:
  • First test run: This test is only for recording the process curve at this valve position. No motor current is recorded. A process curve shows the dependence of the pressure drop in the pipes on the flow and is usually a quadratic function. It is calculated with the help of the flow measured by the pump and the head measured by the two pressure sensors in the active strand. Thereby, the speed of the pump was varied in the range of 1000 to 2500 rpm. The process curve makes it possible to calculate back on the flow by measuring the head for later fault cases. This method was valid for heads over 2 m.
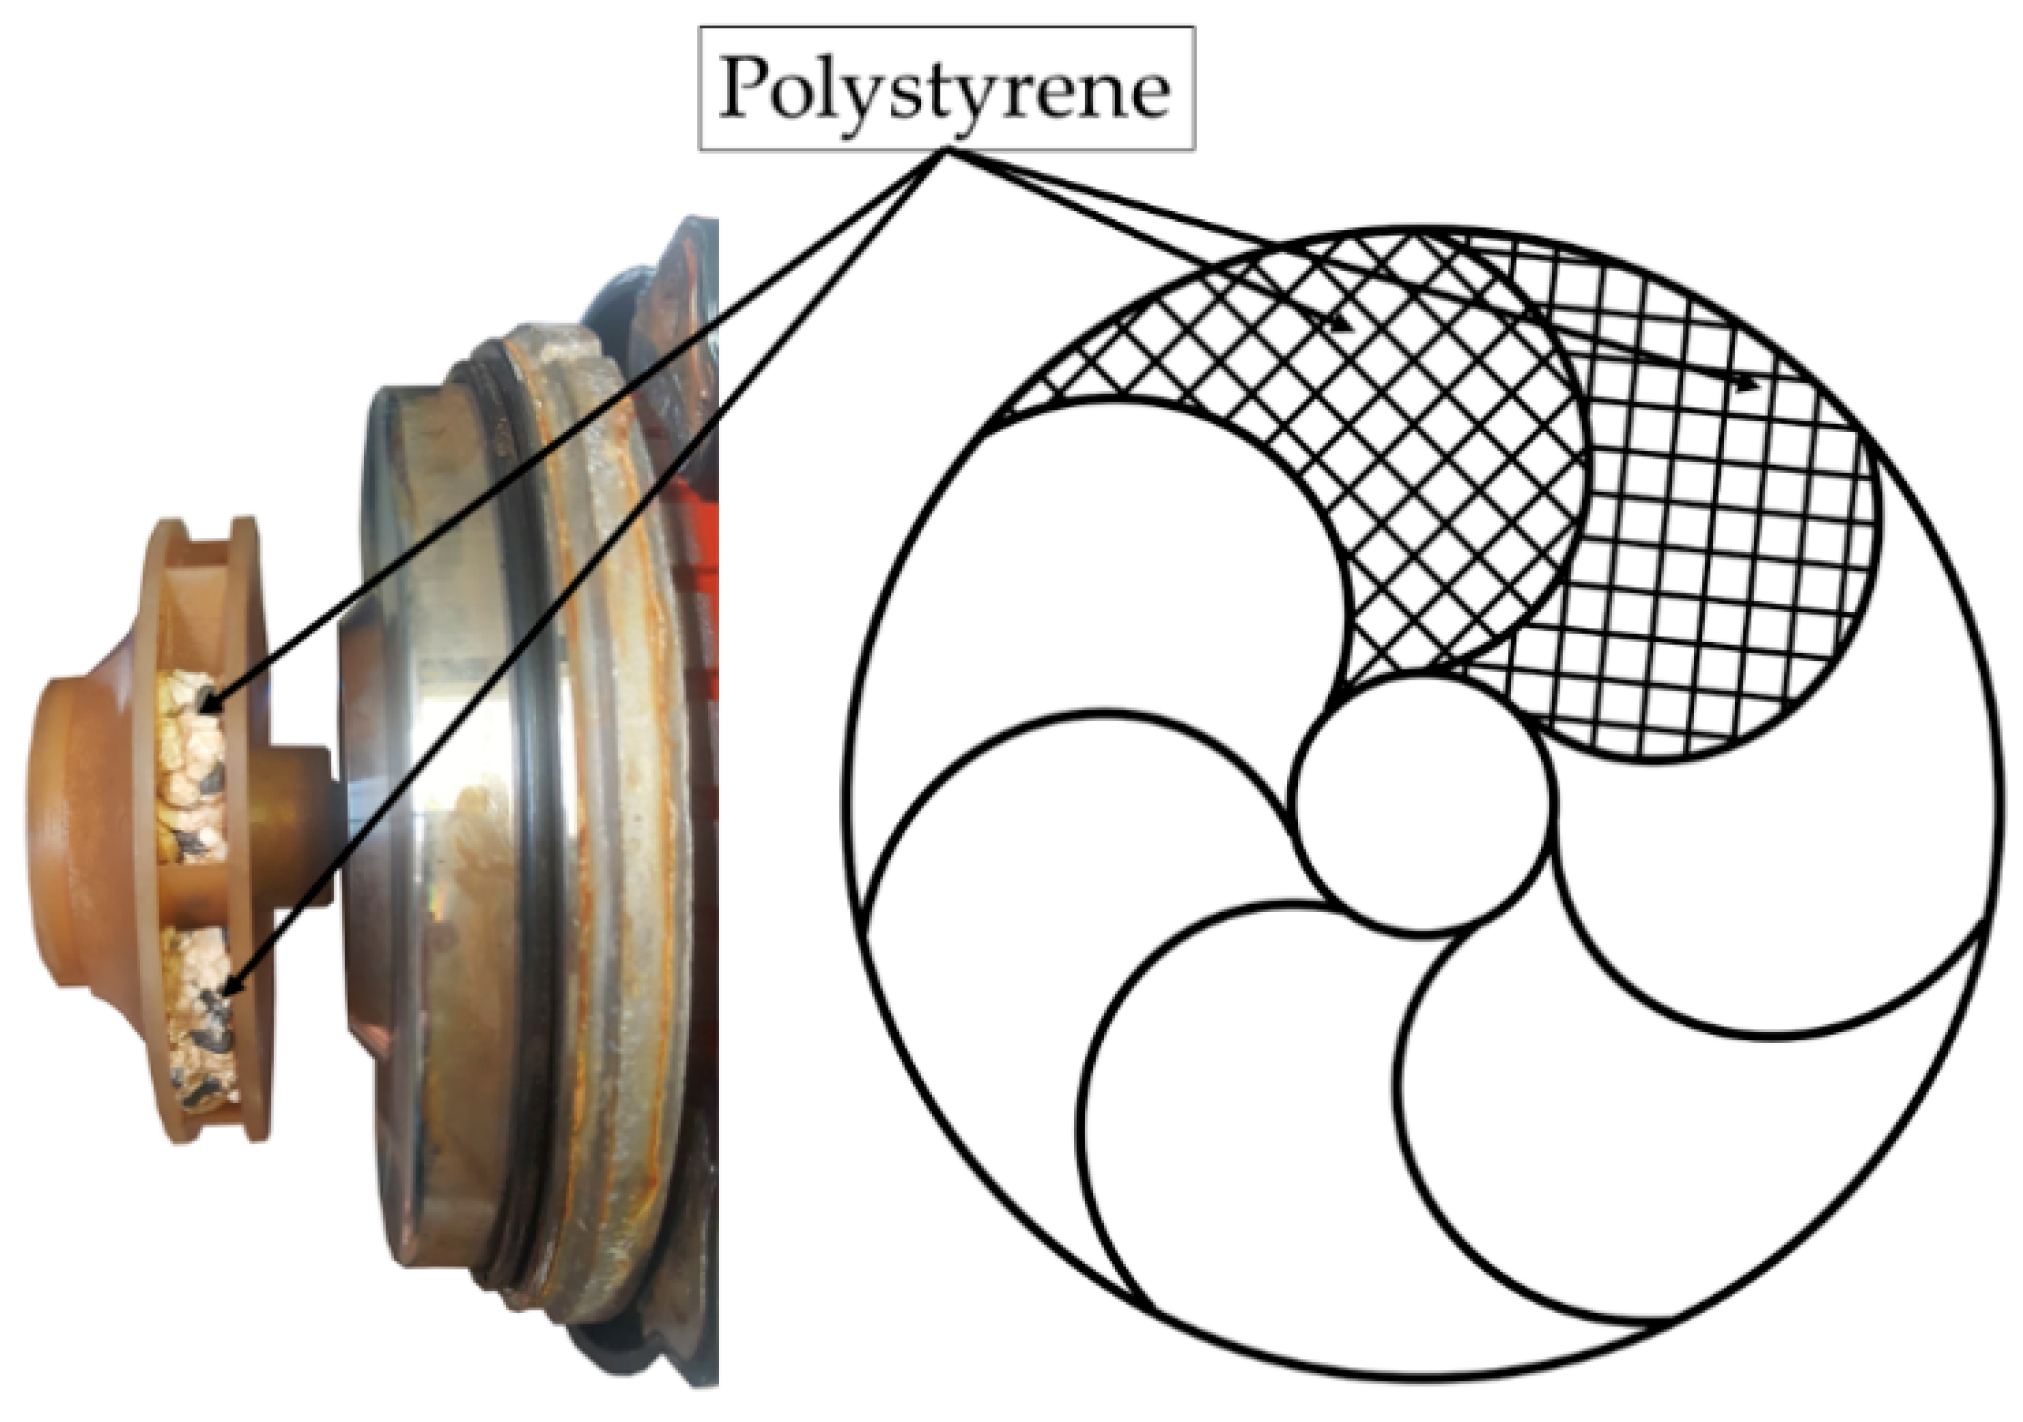
  • Second test run: As in the first test run the shut-off valve was left in a constant position. Now one impeller channel after the other is always clogged with polystyrene. In order not to make the measuring effort too great, only adjacent channels were clogged. First, one channel was clogged and the pump was measured, then two channels were clogged and the pump was measured etc., until sseven, and thus all, channels of the impeller are clogged. Figure 4 shows the implementation of the fault with two clogged impeller channels. For each clogging degree, all relevant data were recorded for the different speeds 2500, 1800 and 1000 rpm.
  • Third test run: in this test, only the healthy pump was measured. This test run was used to generate more reference points. The shut-off valve was adjusted so that the power consumption of the healthy pump corresponds to the power consumption of the individual fault conditions of the second test run. For each load point, all relevant data were recorded for the different speeds 2500, 1800 and 1000 rpm.

3. Results and Analysis

This section is divided into three parts. First, the results of the measurements are shown with respect to the static values. Particular focus is set on the influence of the faults on pump efficiency. In the second part, the healthy pump is examined with the help of the MCSA to obtain a reference for the fault variants. In the third part, the MCSA is then used for the fault case of a clogged impeller. The discussion of the results takes place in the respective sections.

3.1. Static Values in Healthy and Faulty Condition

First the static values are considered. Especially the influence of the faults on the efficiency of the pump is in focus. Table 1 summarizes the mean values of the measured values. All data, except the right column, were from the second test run (see Section 2.3). The flow was calculated using the process curve determined in the first test run. The right-hand column was from the third test run and applies to the healthy pump at the same electrical power consumption as in the case of a fault. This value was important for the interpretation of the results.
In a healthy condition, the pump consumed a power of 580 W and produced a hydraulic power of 321 W resulting in an overall efficiency of 55%. In a faulty condition, both electric power and hydraulic power decreased. However, the hydraulic power decreased faster than electric power. This results in the decreasing efficiency of the pump. The hydraulic power decreases in a similar ratio as the proportion of active channels. For example, in the case of three clogged channels (four of seven active channels) the hydraulic power decreased by 44% and the proportion of active channels is reduced by 43%. The head and the flow is decreased in dependence on the process curve. Two effects are responsible for efficiency reduction. First is the faulty and uneven operation of the impeller and second the higher losses of the pump unit resulting in lower efficiency. The second effect is a known behavior for pumps and motors under partial load [24]. To overcome this effect, the efficiencies of the healthy variant under the same load condition were shown in the right column. This makes it easier to estimate how much the pump efficiency is affected by the fault. It can be seen that the efficiency is always 9 to 15% lower than in a healthy condition.

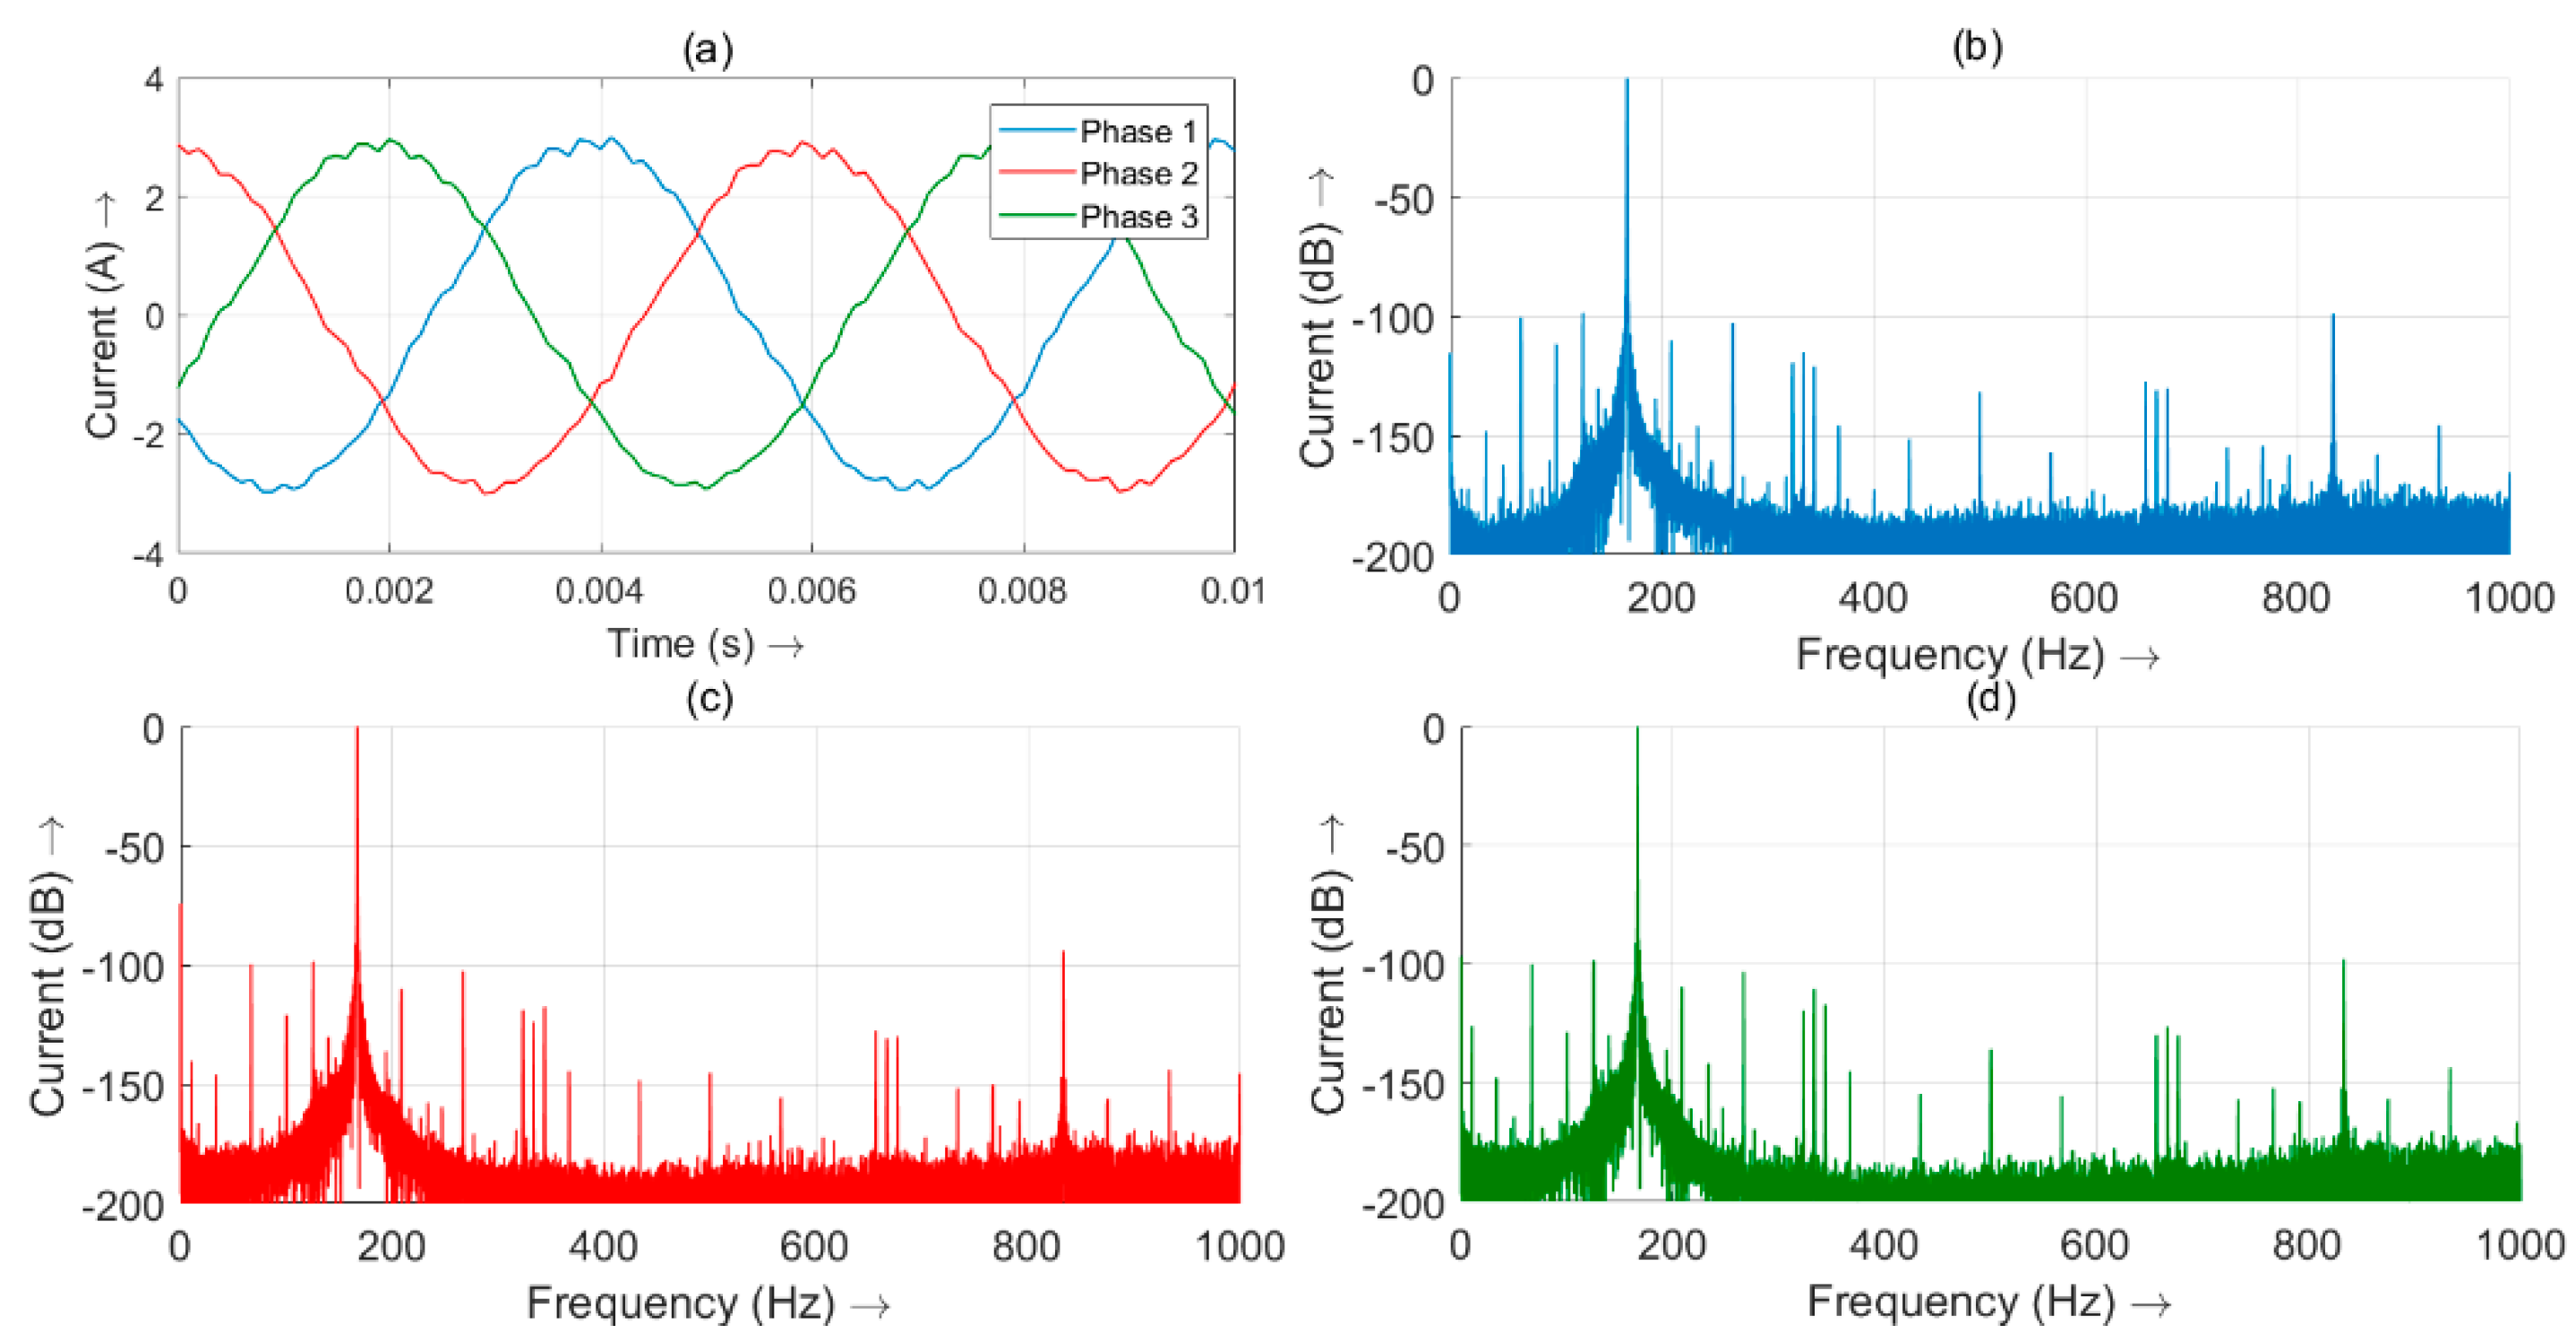
3.2. Motor Current Signature Analysis—Healthy Condition

In order to have a reference for the faulty variants first the measurement results of the pump in a healthy condition were considered. Figure 5 shows the time domain signal (a) of the motor current and the MCSA of the single phases (b–d). All phases were represented, since the individual phases can be affected differently highly by the influence of the BPF [22]. The amplitude of the signal was normalized to the maximum value and is displayed in dB.
In the time signal, it can already be seen that the current signal was afflicted with harmonics. The amplitude of the current consumption for this load was 2.9 A. With the help of MCSA, we can analyze which frequency these harmonics had. Since the rotor runs with a speed of 2500 rpm and the motor has four pole pairs, the fundamental component was at a frequency of 166.7 Hz. At this point is the highest peak in the frequency spectrum, normalized to 0 dB. Additional peaks were recognized at every integer multiple of the supply frequency and at several other locations. The peaks at 10 Hz and 100 Hz are caused by converter operation [17]. According to Equation (1) fBPF equals 458.4 Hz. Notice the MCSA fBPF did not have a characteristic in any motor phase. There can be two reasons why no peaks were visible on fBPF. First, that no vibrations were generated by the design of the radial impeller or second, that the amplitudes were so small that they were damped by the transfer behavior of the motor as a sensor. According to Equation (2) fr,pump equals 125.0 Hz and fr,pump+ equals 208.4 Hz. A peak can be seen at these points in all phases. At 125.0 Hz, a slightly higher peak (−98.5 dB) was observed than at 208.4 Hz (−109.9 dB). An explanation for the peaks at these points could be a slightly eccentric run of the rotor, caused by the plain bearings. Another finding is that the MCSA gives very similar results for all phases. This suggests that it is sufficient to analyze only one phase with the MCSA. This was also applied in the literature [10]. The MCSA of the healthy pump should always be used as a reference when considering fault cases.

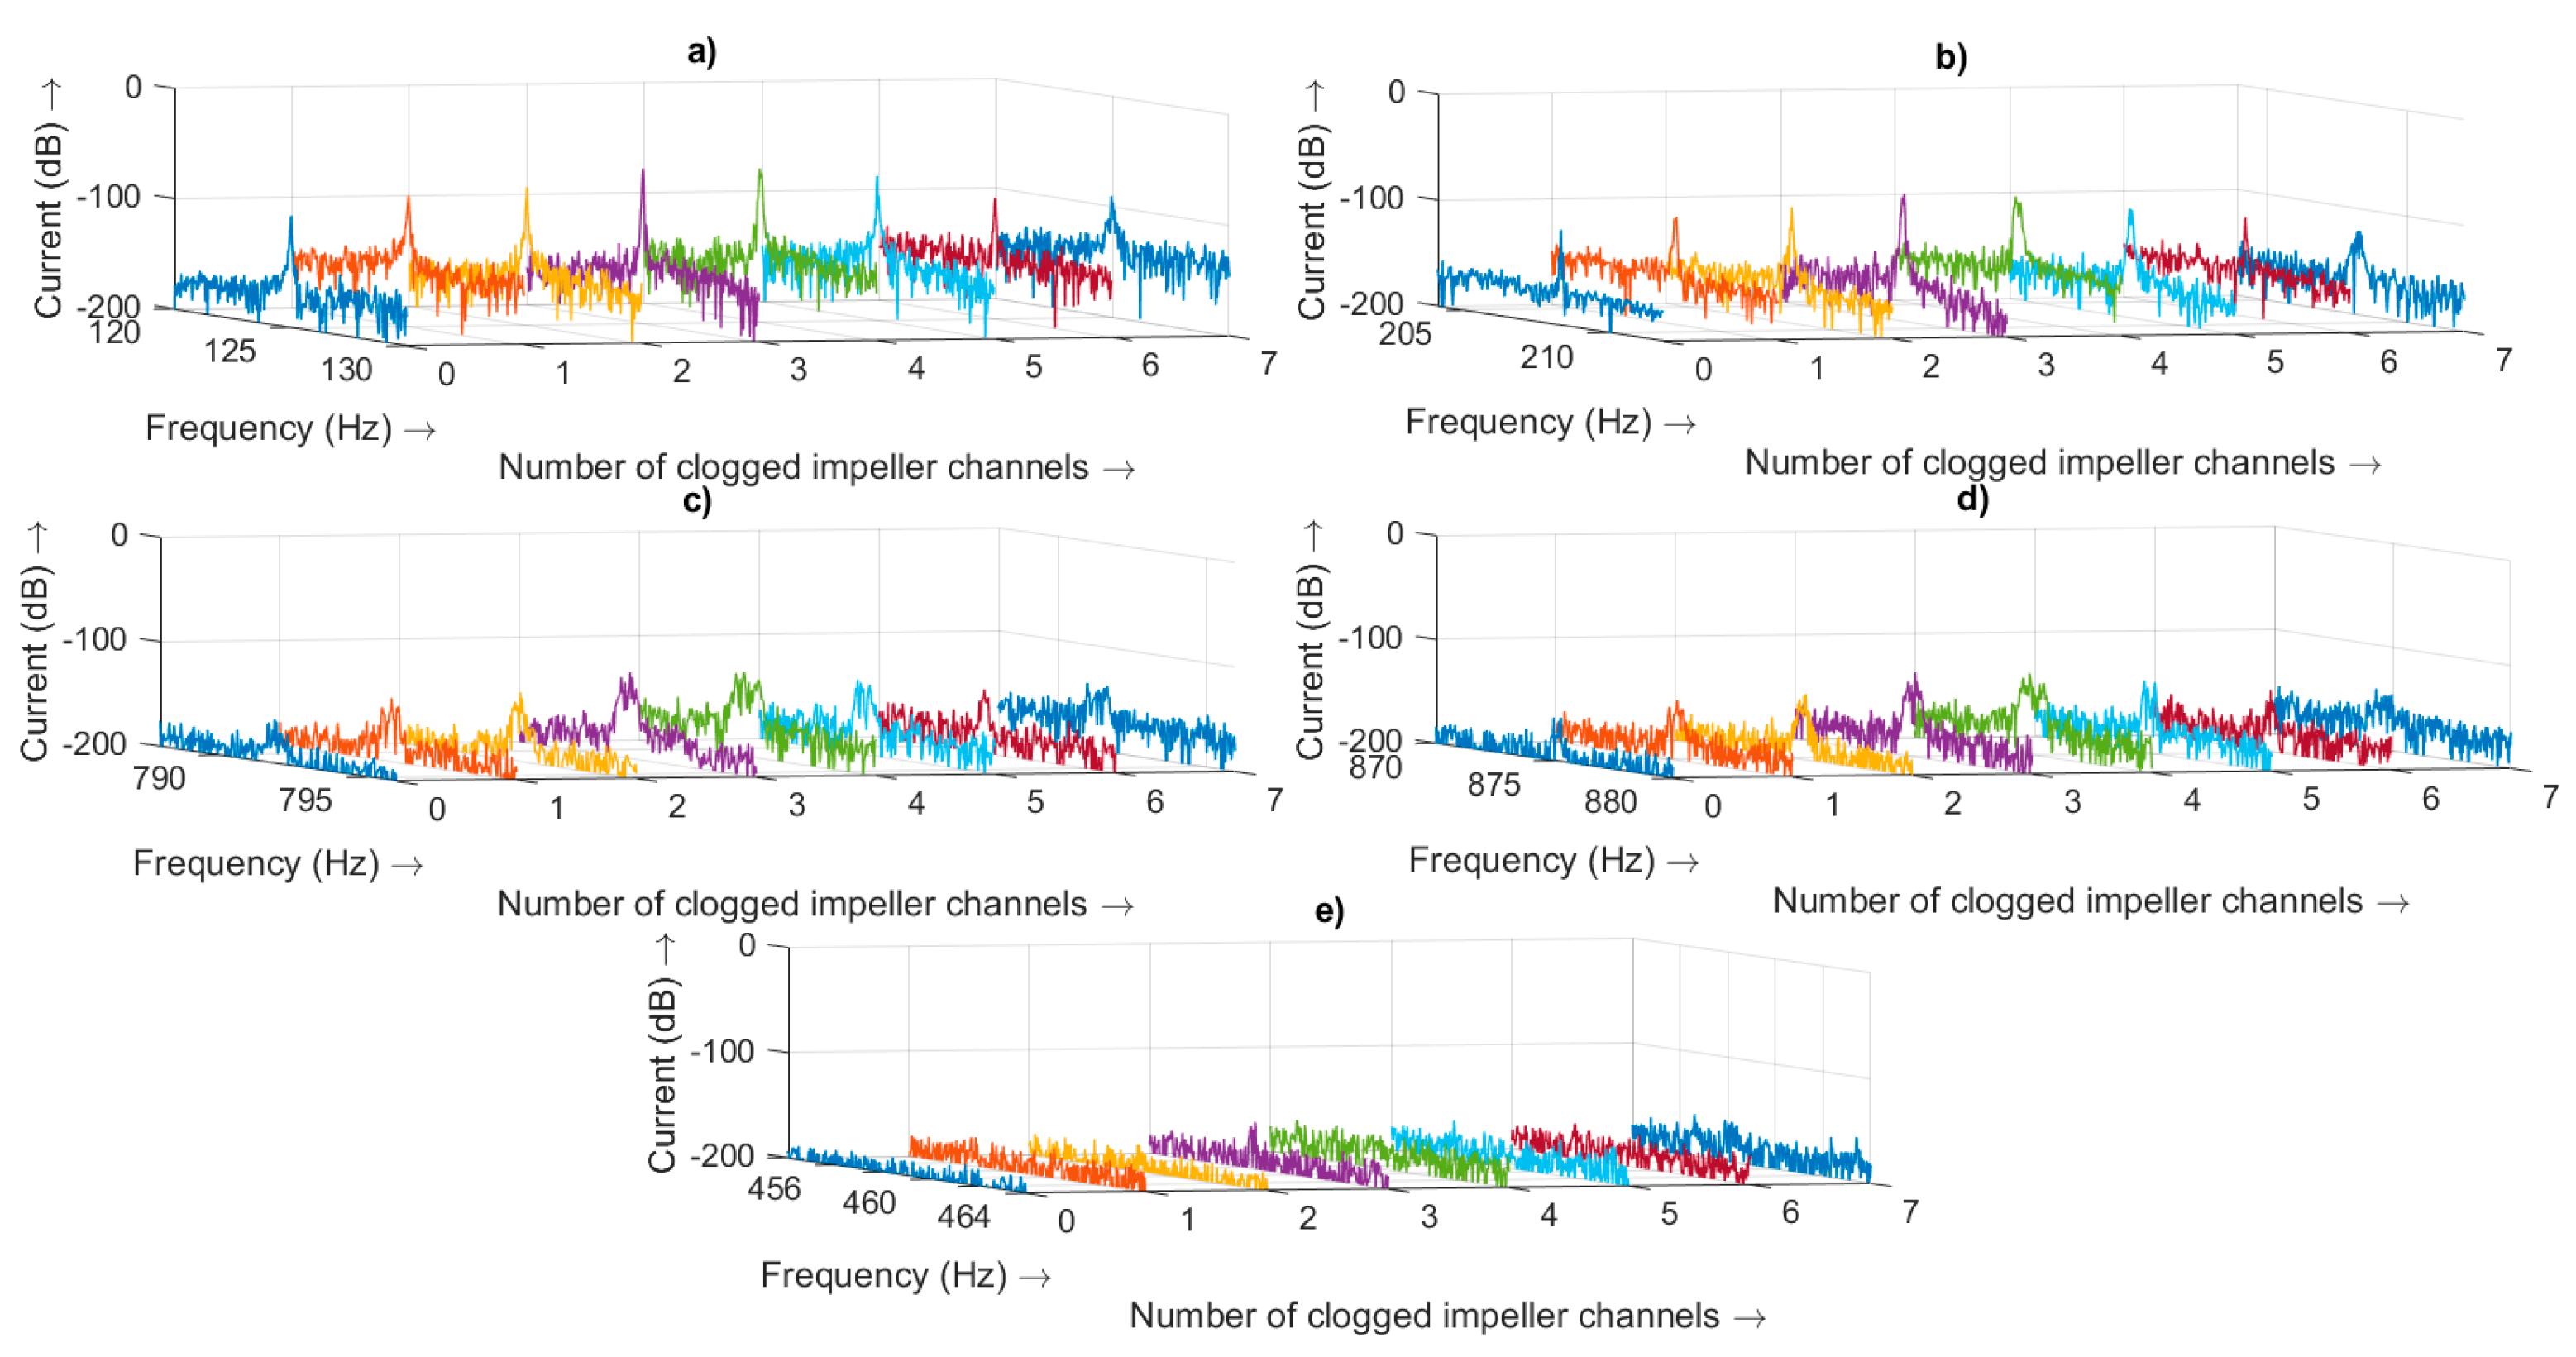
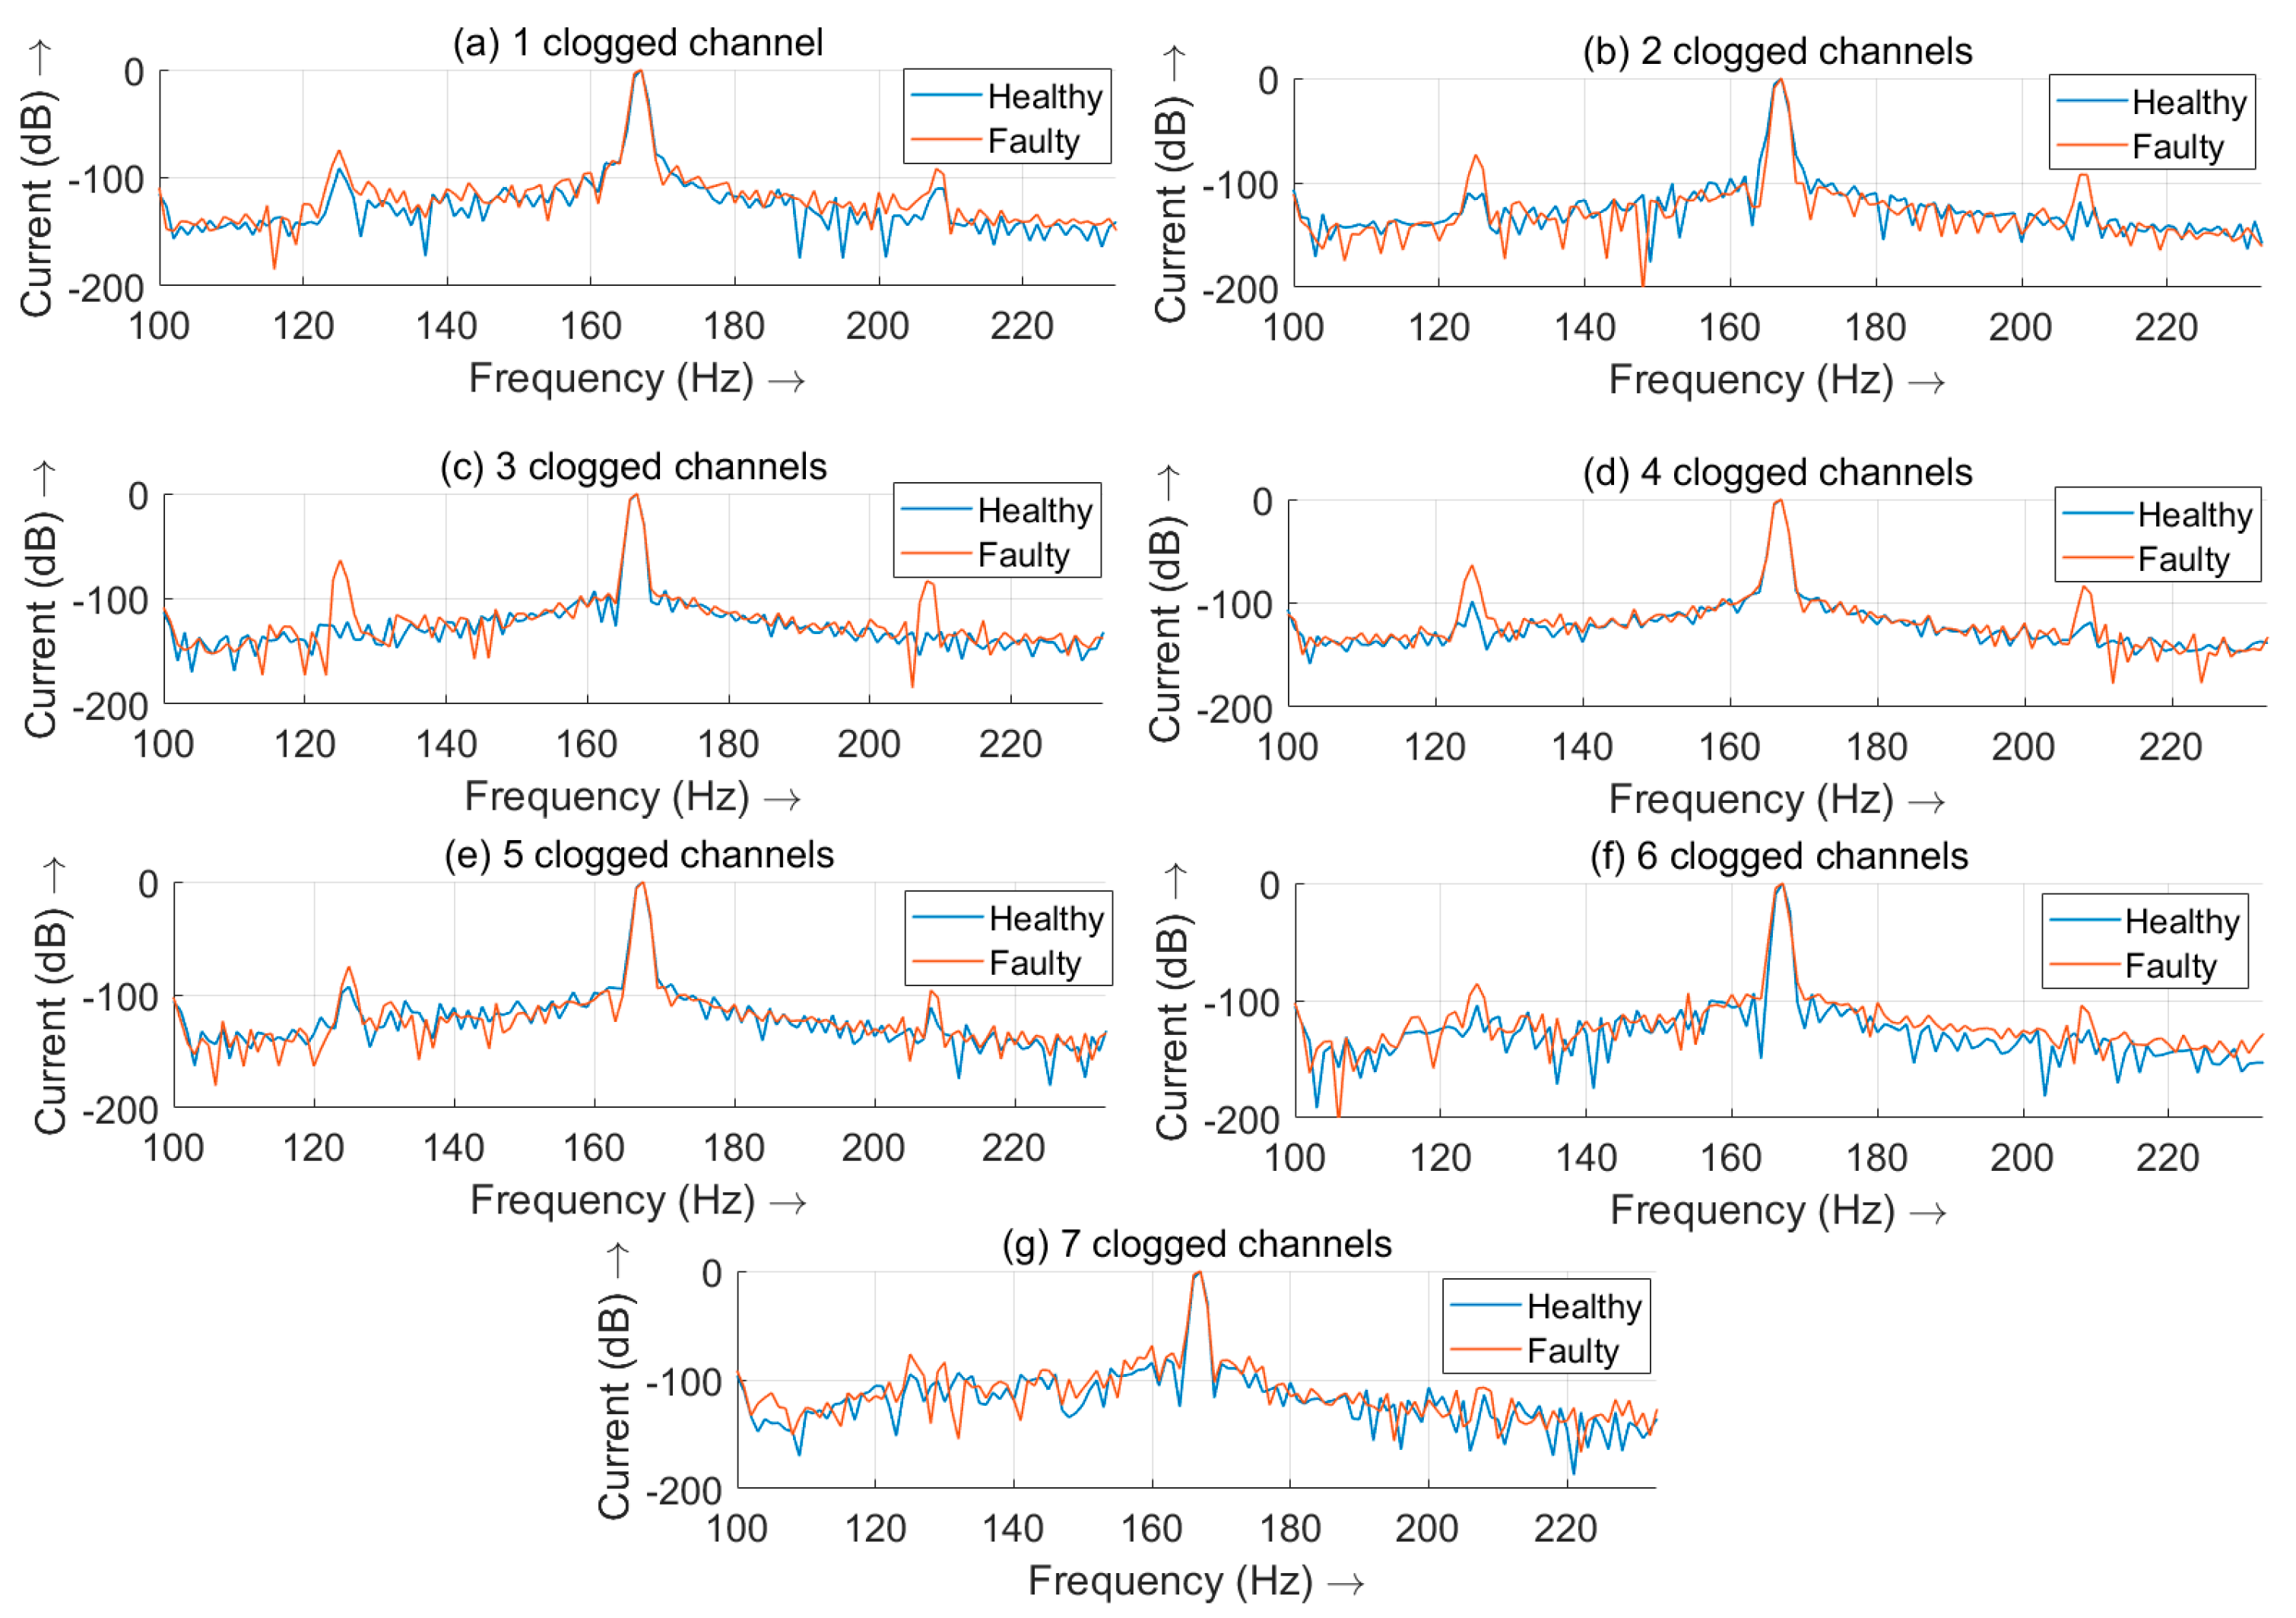
3.3. Motor Current Signature Analysis—Impeller Clogging

This section is divided into three sub-sections. First, the results of the second test run are shown. In the second part, the results of the fault cases are shown in comparison to the healthy variant with the same power consumption. Finally, the results are discussed and classified according to the current state of the art.

3.3.1. Constant Process Curve

In this section, the results of the MCSA for the fault cases are shown, whereby the position of the shut-off valve remained in constant position during the measurement of the fault cases (see Section 2.3, second test run). As a result, the power consumption of the pump decreased as the number of blockages increases (see Table 1). Special focus was given to the fault frequencies fr,pump and fBPF described in theory. Figure 6 shows the MCSA around these fault frequencies in a waterfall diagram. All measurement results from healthy to seven clogged channels are shown. In addition, the MCSA around the frequencies 791.9 and 875.3 Hz are shown. These frequencies were the sideband frequencies of the 5th harmonic.
Figure 6 shows that at the frequencies 125.0 Hz (a), 208.4 Hz (b), 791.9 Hz (c) and at 875.3 Hz (d) the amplitude increase with increasing clogging. A maximum was reached at three or four clogged channels. From then on the amplitudes decrease with an increasing number of clogged channels. At the frequency 125.0 Hz the amplitude of −98.5 dB in healthy condition increases to −59.6 dB (+38.9 dB) for 3 clogged channels and −61.3 dB for 4 clogged channels. With complete clogging, the amplitude dropped to −90.6 dB (+7.9 dB). The variant with one clogged channel (−81.6 dB) behaved similarly to the variant with six clogged channels (−90.7 dB) and the variant with two clogged channels (−75.1 dB) behaved like the variant with five clogged channels (−69.2 dB). Considering the frequency 208.4 Hz, the amplitude increased from −109.9 dB to −79.6 Hz (+30.3 dB) for three clogged channels and to −84.0 dB for four clogged channels and decreases to −120.4 dB (−10.5 dB) for complete clogging. At the frequency 791.9 Hz the amplitude increased from −157.9 dB to −117.8 dB (+40.1 dB) for three clogged channels, which was the biggest increase. At the frequency 875.3 Hz the amplitude increased from −157.7 dB to −118.8 dB (+38.9 dB). If the BPF component was considered it can be seen that only for three clogged channels, there was an increase in the peak. The absolute value for the peak for three clogged channels is −155.2 dB and thus lower than the peaks of the other fault frequencies.

3.3.2. Constant Power Consumption

As can be seen in Table 1, the power consumption of the pump decreases with increasing clogging. For this reason, the third test run was performed for the healthy pump (see Section 2.3). Here the power is adjusted by adjusting the shut-off valve to match the fault cases. This ensures that the results analyzed were not obtained by decreasing the power consumption. In addition, the following results allow a better comparison of faulty and healthy variants. For better visualization, the current signal is cut to 1 s and for windowing, the hamming window is used. The focus was on the two fault frequencies fr,pump. In Figure 7 the MCSA for the faulty variants and the corresponding healthy variant with the same power consumption (see Table 1) of the pump are shown.
If the MCSA of the healthy variant is considered first at a frequency of 125 Hz the amplitude first decreases with decreasing power consumption from −91.2 dB (a) to −110.2 dB (b) to −121.8 dB (c). If (c) is considered, no peak is noticeable at this point. However, from then the amplitude starts to increase again with increasing clogging. The amplitudes of the frequency 208.4 Hz have the same characteristic. These results show that the power consumption has a small influence on the peak characteristics at the fault frequencies fr,pump.
Now the faulty configurations are compared with the corresponding healthy ones. As the results of the second test run have already shown, the faults with three and four clogged channels show the most obvious characteristics. In any case, the amplitude at fr,pump is greater than the corresponding healthy variant. Table 2 gives an overview of how much the amplitude increases in comparison to the healthy variant. Additionally, the results for the speed of 1800 rpm and 1000 rpm entered. fr,pump was determined by Equation (2). At a speed of 2500 rpm, the increase is highest with three clogged channels, followed by four and two clogged channels. The remaining fault variants are more difficult to detect due to the lower increase. This trend can also be seen at a speed of 1800 rpm. Here the increase of the amplitudes is about the same at three and four clogged channels. At a rotational speed of 1000 rpm the results were no longer clear. At four clogged channels, even an amplitude decrease of −27.9 dB can be observed.

3.3.3. Discussion

It is shown that the faults have almost no influence on the component fBPF. This component is not suitable for detecting the fault impeller clogging. The same result is obtained with a similar application in [15]. A decrease of the amplitude at fBPF caused by impeller clogging, as described in [14], cannot be confirmed here. Whether fBPF in this application is suitable to detect the fault cavitation, see [16], is part of future work.
Based on [23], the hypothesis is that fr,pump can be influenced by the fault impeller clogging. Although, in [23] only the faults misalignment and unbalance are mentioned. This hypothesis is confirmed by the results. Especially with half-sided clogging, with three and four of seven clogged channels, there is an increase in amplitudes at the frequency fr,pump. Smaller faults show differences to the healthy variant. This is especially true for higher speeds, in this case greater or equal 1800 rpm. That the fault of clogging of the impeller causes an increase in the component fr,pump is new compared to the state of the art. Whether this is the same for other types of pump units is part of future work. In particular, it should be examined whether the components of the circulation pump, particularly the plain bearings used, have an influence on this result. In addition, there is an increase in amplitude at the frequencies 791.9 Hz and at 875.3 Hz, which are sidebands of the 5th harmonics ((5 ± 1/p)∙fs). This increase cannot be explained by Equation (1) or (2) and could argue for an adaptation of Equation (2) for the fault of clogging. It is also necessary to investigate how to distinguish between bearing faults and impeller clogging, as they affect the same frequency in the MCSA [17].

4. Conclusions

In this paper a concept for the investigation of faults in circulation pumps is presented and applied to the case of clogging of impeller channels. With the help of the test bench, the data supplied by the pump as well as the differential pressure of the pump can be recorded with the help of a data acquisition system. The measuring devices for recording the motor currents are suitable for collecting the data needed for the later application of the fault diagnosis algorithms. The test bench has been designed for life cycle tests. That this is possible with the test bench is part of future work.
As a fault, a clogged impeller was investigated. In order to have a reference, the healthy pump was measured at the same power consumption as in the respective fault cases. First, the influence of the fault on efficiency is considered. It is found that the efficiency of the pump is reduced by 9 to 15% compared to the healthy version at the same power consumption. Based on the literature research on pump fault detection [13,14,15,16,17,18,19,20,21,22], the hypothesis can be made that the amplitudes at the frequencies fr,pump and fBPF are influenced by the fault of the clogged impeller. The results show that the frequency fr,pump is mainly influenced when used as a circulation pump. The fault frequency fBPF is not affected. It can be seen that when three and four of seven channels are clogged, the greatest increase in amplitude occurs at the fault frequency fr,pump. The findings are especially true for higher speeds, in this case 1800 rpm and 2500 rpm. At a speed of 1000 rpm the results are not distinct. Furthermore, it is found that the sidebands are increased by the fifth harmonic due to the fault.
The results show that the implementation of online fault detection algorithms can have an added value for the pump operator. This is supported by the fact that efficiency decreases and the hydraulic power decrease. It is shown that at the frequencies fr,pump different amplitudes can occur with the healthy variant, depending on the load. This must be taken into account when implementing fault thresholds. One possibility would be the storing of load-dependent thresholds in the electronics of the pump.

Author Contributions

Conceptualization, J.A.A.-D., S.U., V.B. and T.S.; methodology, software, validation, formal analysis, V.B.; investigation, V.B. and T.S.; resources, S.U.; data curation, V.B.; writing—original draft preparation, V.B.; writing—review and editing, J.A.A.-D., S.U., T.S.; visualization, V.B. and T.S.; supervision and project administration, S.U. and J.A.A.-D.; funding acquisition, S.U. All authors have read and agreed to the published version of the manuscript.

Funding

This research was funded by the German ‘Federal Ministry for Economic Affairs an Energy’, grant number 03ET1613B.

Conflicts of Interest

The authors declare no conflict of interest.

References

  1. Thomas, S.; Barthel, C. Technology Procurement for very Energy Efficient Circulation Pumps; Final Report; Energy+ Pumps Project; Wuppertal Institut für Klima, Umwelt und Energie GmbH: Greifswald, Germany, 2009. [Google Scholar]
  2. Rasmussen, K.F.; Thorup, N. Permanent magnet motors find their way to circulator pumps. In Proceedings of the 3rd International Conference EEMODS’02 Energy Efficiency in Motor Driven Systems, Treviso, Italy, 18–20 September 2002. [Google Scholar]
  3. Vairamohan, B.; Rajagopalan, S.; Samotyj, M.; Ammi, A. New circulator pump design shows higher energy savings opportunity. In Proceedings of the Seventh International Conference EEMODS 11: Energy Efficiency in Motor Driven Systems, Alexandria, FL, USA, 12–14 September 2011; pp. 668–678. [Google Scholar]
  4. Eser, M.; Kasnakoglu, C.; Benli, B.B. Vector Control of PMSM in Circulation Pump Application and an Adaptive Approach for EEI Optimization. In Proceedings of the 2019 11th International Conference on Electrical and Electronics Engineering (ELECO), Bursa, Turkey, 28–30 November 2019; pp. 749–753. [Google Scholar]
  5. Eckl, M.; Wurm, F.; Liu, S.; Urschel, S.; Schullerer, J.; Schaab, J.; Kowalski, K. New control mode to decrease energy consumption of circulator pumps. In Proceedings of the 4th International Rotating Equipment Conference, Wiesbaden, Germany, 24–25 September 2019. [Google Scholar]
  6. Eckl, M.; Schullerer, J. Method for the Self-Diagnosis of the Mechanical and/or Hydraulic State of a Centrifugal Pump. WO2019141658A1. 25 July 2019. Available online: https://patents.google.com/patent/WO2019141658A1/en (accessed on 24 September 2020).
  7. Wilo-Stratos PICO. Installation and Operating Instructions. Available online: https://cms.media.wilo.com/dcidocpfinder/wilo108421/1270563/wilo108421.pdf (accessed on 24 September 2020).
  8. Grundfos MAGNA3. Installation and Operating Instructions. Available online: https://us.grundfos.com/content/dam/NAMREG/Literature/TechnicalLiterature/I&O-Magna3-Model-D.pdf (accessed on 24 September 2020).
  9. Herrera-Guachamin, J.; Antonino-Daviu, J. Laboratory experiments for the evaluation of the efficiency of induction motors operating under different electrical and mechanical faults. In Proceedings of the IECON 2019—45th Annual Conference of the IEEE Industrial Electronics Society, Lisbon, Portugal, 14–17 October 2019; pp. 6319–6322. [Google Scholar] [CrossRef]
  10. Thomson, W.T.; Gilmore, R.J. Motor current signature analysis to detect faults in induction motor drive—Fundamentals, data interpretation, and industrial case histories. In Proceedings of the Thirty-Second Turbomachinery Symposium, Huston, TX, USA, 11 September 2003. [Google Scholar]
  11. Choi, S.; Haque, M.S.; Tarek, M.T.B.; Mulpuri, V.; Duan, Y.; Das, S.; Garg, V.; Ionel, D.; Masrur, M.A.; Mirafzal, B.; et al. Fault diagnosis techniques for permanent magnet ac machine and drives—A review of current state of the art. IEEE Trans. Transp. Electrif. 2018, 4, 444–463. [Google Scholar] [CrossRef]
  12. Kostic-Perovic, D.; Arkan, M.; Unsworth, P. Induction motor fault detection by space vector angular fluctuation. In Proceedings of the Conference Record of the 2000 IEEE Industry Applications Conference. Thirty-Fifth IAS Annual Meeting and World Conference on Industrial Applications of Electrical Energy (Cat. No.00CH37129), Rome, Italy, 8–12 October 2000; IEEE: New York, NY, USA, 2000. [Google Scholar] [CrossRef]
  13. Irfan, M.; Glowacz, A. Design of a novel electric diagnostic technique for fault analysis of centrifugal pumps. Appl. Sci. 2019, 9, 5093. [Google Scholar] [CrossRef] [Green Version]
  14. Tiana, X.; Fenga, G.; Chenb, Z.; Albraika, A.; Guab, F.; Balla, A.D. The investigation of motor current signals from a centrifugal pump for fault diagnosis. In Proceedings of the 27th International Congress of Condition Monitoring and Diagnostic Engineering, Brisbane, Australia, 16–18 September 2014. [Google Scholar]
  15. Jahangiri, M.; Roknizadeh, S.A.S. Clogged impeller diagnosis in the centrifugal pump using the vibration and motor current analysis. J. Appl. Comput. Mech. 2018, 4, 310–317. [Google Scholar] [CrossRef]
  16. Stopa, M.M.; Filho, B.J.C.; Martinez, C.B. Incipient detection of cavitation phenomenon in centrifugal Pumps. IEEE Trans. Ind. Appl. 2014, 50, 120–126. [Google Scholar] [CrossRef]
  17. Becker, V.; Schwamm, T.; Urschel, S.; Antonino-Daviu, J.A. Detection of rotor and impeller faults in wet rotor pumps. In Proceedings of the 24th International Conference on Electrical Machines (ICEM), Gothenburg, Sweden, 23–26 August 2020. [Google Scholar]
  18. Choi, S.; Akin, B.; Kwak, S.; Toliyat, H.A. A compact error management algorithm to minimize false-alarm rate of motor/generator faults in (hybrid) electric vehicles. IEEE J. Emerg. Sel. Top. Power Electron. 2014, 2, 618–626. [Google Scholar] [CrossRef]
  19. Akin, B.; Choi, S.; Orguner, U.; Toliyat, H.A. A simple real-time fault signature monitoring tool for motor-drive-embedded fault diagnosis systems. IEEE Trans. Ind. Electron. 2011, 58, 1990–2001. [Google Scholar] [CrossRef]
  20. Choi, S.; Akin, B.; Rahimian, M.M.; Toliyat, H.A. Fault Diagnosis Implementation of Induction Machines based on Advanced Digital Signal Processing Techniques. In Proceedings of the 2009 Twenty-Fourth Annual IEEE Applied Power Electronics Conference and Exposition, Washington, DC, USA, 15–19 February 2009; pp. 957–963. [Google Scholar] [CrossRef]
  21. Rajagopalan, S.; le Roux, W.; Habetler, T.G.; Harley, R.G. Dynamic Eccentricity and Demagnetized Rotor Magnet Detection in Trapezoidal Flux (Brushless DC) Motors Operating Under Different Load Conditions. IEEE Trans. Power Electron. 2007, 22, 2061–2069. [Google Scholar] [CrossRef]
  22. Park, Y.; Jeong, M.; Lee, S.B.; Daviu, J.A.; Teska, M. Influence of Blade Pass Frequency Vibrations on MCSA-Based Rotor Fault Detection of Induction Motors. IEEE Trans. Ind. Appl. 2017, 53, 2049–2058. [Google Scholar] [CrossRef]
  23. Bonaldi, E.L.; da Silva, J.G.B.; Oliveira, L.L.; Lambert-Torres, G. Predictive maintenance by electrical signature analysis to induction motors. In Induction Motors—Modelling and Control, 1st ed.; InTech: Vienna, Austria, 2012. [Google Scholar]
  24. Gülich, J.F. Centrifugal Pumps, 3rd ed.; Springer: Heidelberg, Germany; Dordrecht, The Netherlands; London, UK; New York, NY, USA, 2014; ISBN 978-3-642-40113-8. [Google Scholar]
Figure 1. Picture of a circulation pump.
Applsci 10 07550 g001
Figure 2. Test bench for condition monitoring and life accelerated tests of circulation pumps.
Applsci 10 07550 g002
Figure 3. Setup for measuring the motor currents of a circulation pump.
Applsci 10 07550 g003
Figure 4. Implementation of the fault impeller clogging for the example of two clogged impeller channels.
Applsci 10 07550 g004
Figure 5. Signals of a healthy pump at a speed of 2500 rpm: (a) Time-domain signal of the motor currents 1, 2 and 3 (b) motor current signature analysis (MCSA) of Phase 1 (c) MCSA of Phase 2 (d) MCSA of Phase 3.
Applsci 10 07550 g005
Figure 6. MCSA of a pump with different number of clogged impeller channels at a speed of 2500 rpm: (a) around fr,pump = 125.0 Hz. (b) Around fr,pump+ = 208.4 Hz. (c) Around 791.9 Hz. (d) Around 875.3 Hz. (e) Around fBPF = 58.4 Hz.
Applsci 10 07550 g006
Figure 7. MCSA of a pump with a different number of clogged impeller channels at a speed of 2500 rpm and corresponding healthy variant with the same power consumption: (a–g) 1–7 clogged channels.
Applsci 10 07550 g007
Table 1. Values of healthy and faulty circulation pump (2500 rpm) for measurement at constant process curve.
Flow (m3/h)Head (m)Hydraulic Power (W)Proportion of Active Channels (%)Electric Power (W)Efficiency (%)Efficiency of Healthy Pump (Same Power) (%)
Healthy17.96.632110058055-
1 clogged channel16.65.7257865564655
2 clogged channels15.75.2222714944554
3 clogged channels14.54.6181574544051
4 clogged channels12.63.6123433963146
5 clogged channels11.02.781293432437
6 clogged channels--11.1--114333--135
7 clogged channels--10--10214--10
1 Too low head to calculate the flow with the help of the reference curve (see Section 2.3).
Table 2. Increase of amplitudes in case of an impeller clogging for different speeds and numbers of clogged channels.
1 Clogged Channel2 Clogged Channels3 Clogged Channels4 Clogged Channels5 Clogged Channels6 Clogged Channels7 Clogged Channels
n = 2500 rpm
fr,pump = 125.0 Hz+17.0 dB+36.81 dB+47.1 dB+35.0 dB+18.2 dB+18.3 dB+18.6 dB
fr,pump+ = 208.4 Hz+18.7 dB+29.0 dB+48.7 dB+35.1 dB+15.2 dB+20.8 dB+5.8 dB
n = 1800 rpm
fr,pump = 90.0 Hz+8.1 dB+30.5 dB+39.2 dB+42.2 dB+24.0 dB+7.1 dB+16.9 dB
fr,pump = 150.0 Hz+14.0 dB+29.1 dB+46.9 dB+36.6 dB+18.4 dB−26.1 dB+8.9 dB
n = 1000 rpm
fr,pump = 50.3 Hz−20.8 dB−1.3 dB+7.0 dB−27.9 dB−17.5 dB+18.4 dB+7.8 dB
fr,pump = 83.8 Hz+5.1 dB+9.0 dB+12.9 dB+6.2 dB+0.5 dB+20.6 dB+4.0 dB
Publisher’s Note: MDPI stays neutral with regard to jurisdictional claims in published maps and institutional affiliations.

