1. Introduction
Investigations on human motor tasks is a wide and interdisciplinary field of research with application in human factors, human-computer-interface, robotics, and biomechanics for rehabilitation, to mention a few. The accuracy of individuals in following the nominal trajectory aiming at reducing the distance between the actual position with the planned nominal one is of great interest in many fields. In a work environment, precision of a worker in reaching a target area for grasping or releasing an object, for manual assembly activities or in maintenance tasks, need to be assessed for optimizing manual task allocation. Measuring the accuracy in following a trajectory is crucial also in biomechanical applications to assess, for example, the effectiveness of the rehabilitation programs.
Modeling human motor tasks generally refers to classical studies most of them considering the well-known Fitts’ law [
1]. Some authors improved the findings of the Fitts’ experience by investigating its applicability in control theory [
2,
3,
4] or in estimating psychomotor movement delays [
5,
6] by computer modeling of the physical environment [
7] as well as by virtual reality devices [
8].
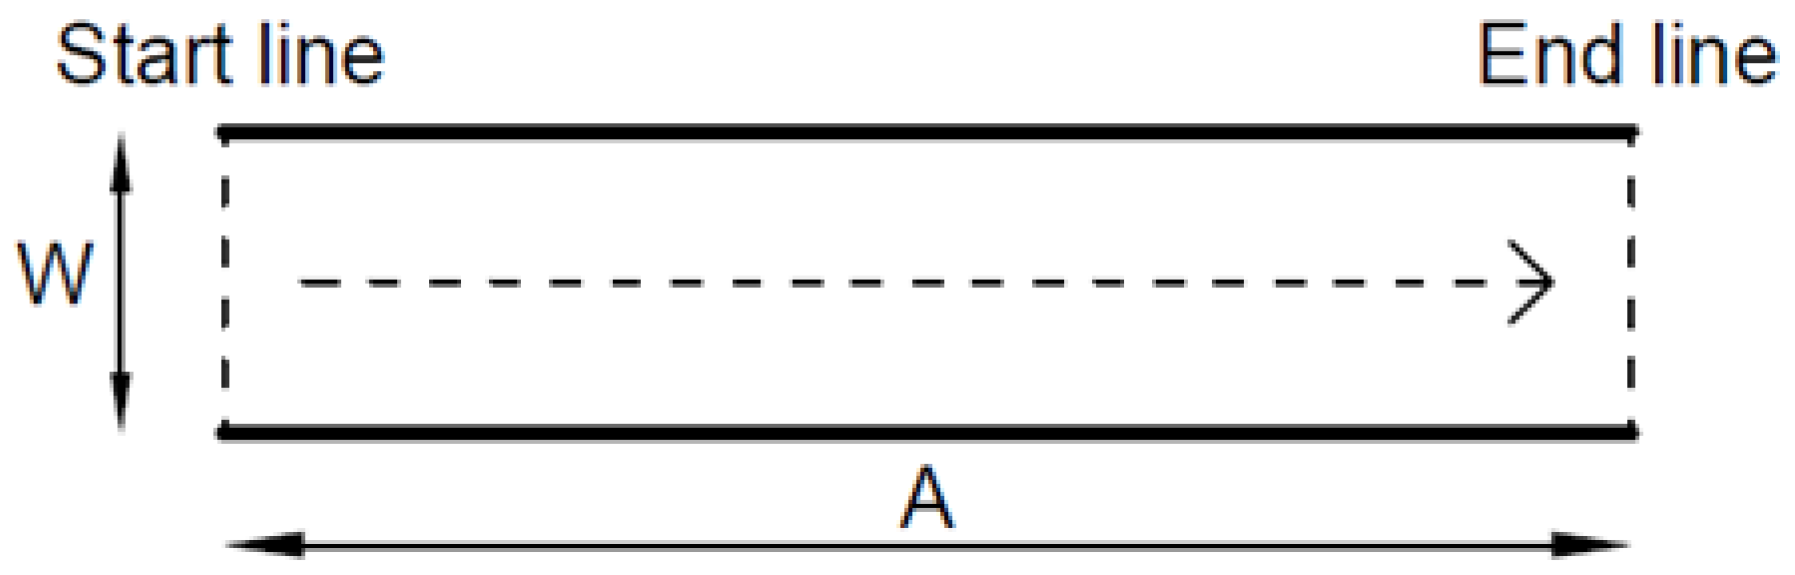
In the Fitts’ experience, the motor task of human subjects consisted of a reaching task of a target of width W from an initial starting point to a final one following a trajectory of length A: a short trajectory with a wide target width was significant of an easy reaching task; on the contrary, meeting low target width following a long trajectory was representative of a difficult task.
The basic idea of the Fitts’ law consists of expressing the movement time by the index of performance (IP), representing the amount of information processed in a unit time (bits/s), and the information content of the task (ID), characterizing the difficulty in the task execution (bit). Consistently, for modeling the movement time (MT) of a subject in a reaching motor task, the Fitts’ law was formulated as:
Many formulations of ID have been tested [
1,
9,
10]. Fitts suggested and proved by experiments that the ID in a reaching task of length A with target width W can be expressed by:
. Other studies suggested adjustments to the Fitts’ ID formulation by proposing
with c = 0.5;1 according to the experiments carried out. In [
10], a literature review of the best fitting of different ID formulations with experimental results is provided.
The Fitts’ law was derived by analogy with the Shannon theorem n° 17 [
11], theorized within the information-communication theory. The theorem expresses the effective information capacity C (bits/s) of a communication channel of bandwidth B (1/s) as:
where S is the signal power transmitted by the channel and perturbed by a white noise of power N; N represents the uncertainty induced in the transmission of the signal that limits the information capacity of the channel. In the analogy proposed by Fitts, the channel capacity C is associated with the movement time in a reaching motor task while the bandwidth B corresponds to the information processing rate and the power of the signal S represents the length of the trajectory followed. Finally, the noise N corresponds to the tolerance in getting the target in the motor task, i.e., the target’s amplitude. In a perfect analogy, the motor task ID of the Fitts’ experience would be expressed as:
. In [
12], it is stated that this perfect analogy in the ID calculation leads to a model that better fits empirical data.
In [
13], a general information-based formulation is proposed to evaluate the Index of Difficult (ID) of a general trajectory of curvilinear abscissa (s) in a two-dimensional plane; the trajectory is considered to be an infinite sequence of targets of width W(s), variable with abscissa ‘s’ that a subject has to meet along the trajectory, ‘t’. Under these hypotheses, it was proved a general formulation for the difficulty index:
The ID general formulation only depends on the geometry of the trajectory as well as on the geometry of the target width constraining the movement along the trajectory.
In studying psychomotor abilities of humans in performing actual ‘reaching tasks’, the subjects under test or humans in executing work or social activities (e.g., walking, upper limbs movements) can follow trajectories that generally differ from the nominal ‘geometric’ one: in some runs, a subject follows the trajectory while respecting accuracy constraints represented by the target width W(s) at each (s); in other runs, the subject does not meet the targets, in this way incurring in errors. At a given ‘s’ value, a measure of ‘accuracy’ is also a measure of uncertainty of the endpoint position. At each value of the abscissa ‘s’, the position of the endpoint follows a probability density function. Consistently, the effective target width (We) is defined in probabilistic term on the basis of the distribution of hits within the nominal target width (W), at each ‘s’ value. This leads to the evaluation of effective target width We(s) which stochastically bounds the actual trajectories followed by individuals. The issue of the effective target width ‘We’ is described in [
10], then developed by [
14,
15], and applied to two-dimensional tasks in [
16,
17].
Following the Fitts’ experience, in [
18] a ‘Speed-Accuracy’ tradeoff model is proposed. Here, accuracy of an individual in meeting a target width is put into linear relation with task speed execution. However, the model does not formally consider also the effects of task difficulty (ID) on the task execution accuracy, i.e., on the shape of the trajectory followed as well as on the width constraining the trajectory (Equation (3)). Consistently, the ‘speed-accuracy’ model available in the literature cannot be applicable in actual cases which differ from the Fitts’ experience: in actual cases, many and different trajectories with variable difficult index
ID have to be followed with a given accuracy.
In this paper, the authors propose a ‘Speed-ID-Accuracy’ model aiming at overcoming abovementioned limits: the accuracy of the endpoint position is put into relation with task speed execution for a general constrained-trajectory.
2. An Information-Based ‘Speed-ID-Accuracy’ Model for Motor Tasks Following a General Constrained-Trajectory
The accuracy of a subject in following a trajectory depends on her/his personal motor abilities, on task velocity as well as on the accuracy required by a given motor task.
In the Fitts’s experiments, healthy subjects were asked to move as fast as possible to acquire target width, W, at a distance, A, following a nominal rectilinear trajectory, with the highest possible accuracy. However, errors in meeting the target were observed. Fitts found what it is known by common experience: accuracy in acquiring a target was strictly related with velocity in the task execution. Close targets (short distance A) with big width (W) were acquired faster (low movement time MT) than small targets placed at higher distance.
The ‘Speed-Accuracy’ tradeoff model was proposed to capture the variability of the effective endpoint position expressed in terms of standard deviation, SD(x) that is put into linear relation with speed [
18]:
Despite the similarity with the Fitts’ law, Equation (4) is related to the stochasticity of the phenomenon: the higher the velocity of covering a trajectory is, the higher is the uncertainty of meeting the target. Equation (4) refers to the Fitts’ experience of a reaching task between an initial position and a final target of width W at distance A.
We propose to extend the ‘Speed-Accuracy’ tradeoff model (4) by considering the standard deviation of the endpoint position depending on both speed and ID as:
where v is the average speed (v = A/MT) of a subject in following a nominal trajectory ‘t’ while continuously meeting targets with variable width W(s) along the trajectory, and a, b, c, and
are the model parameters.
In [
10], a discussion of Fitts’s law experiments pointed out as the variability of the endpoint position follows a normal distribution meeting the nominal target width with an average error rate of 4%: in other words, individuals actually meet the target within an effective width We = W in 96% of hits observed. Consistently, the range of the standardized variable, z, of the unit-normal distribution was identified as: −2.066 < z < +2.066. In case of an error rate observed other than 4%, We is obtained as:
being z
e the standardized variable of the unit-normal distribution corresponding to the observed percentage error rate, err
e, other than 4%. Since the endpoint position follows a normal distribution, its standard deviation can be obtained as:
In the next sections, the model (5) along with relations (6) and (7) are applied to two different reaching tasks: the ‘Tunnel Traveling Task’ and the ‘Circular Traveling Task’ whose experimental data are available in [
19].
In case of the Tunnel Traveling Task (TTT), a rectilinear trajectory of length A and an infinite sequence of target of width W has to be met (see
Figure 1). The corresponding ID formulation was obtained in [
13] starting from Equation (3) as:
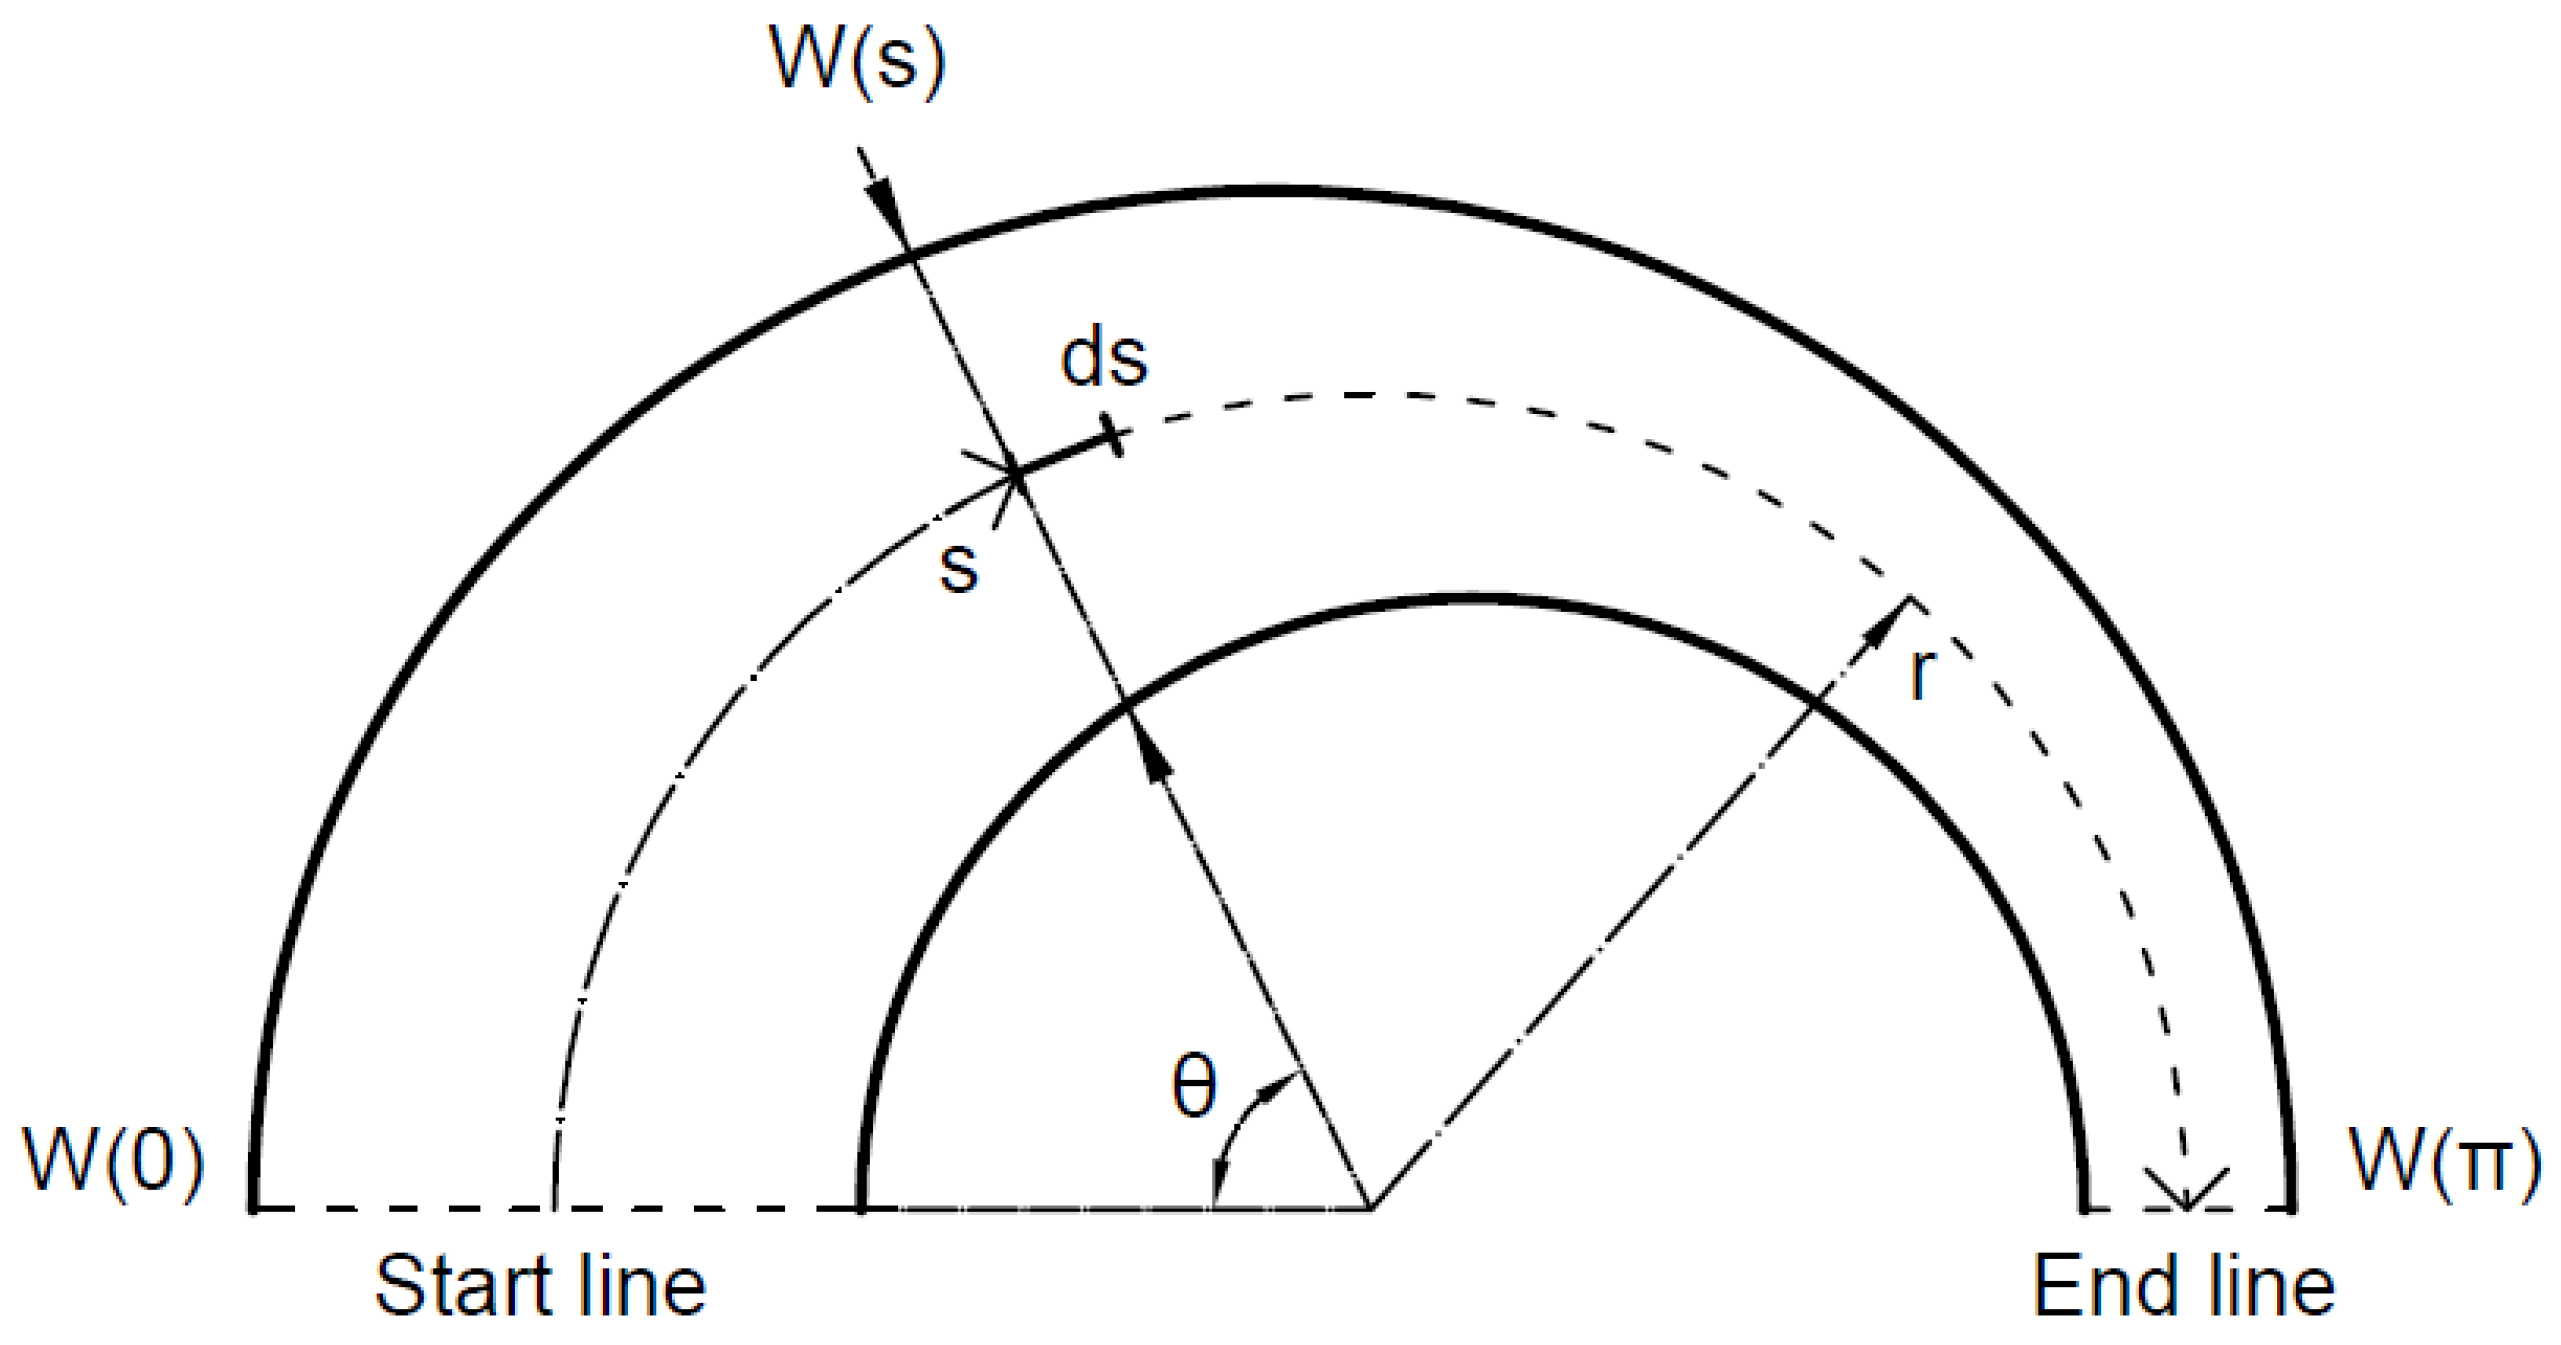
Following the same approach, in case of a semicircular trajectory reaching task the ID formulation has been obtained as follows.
The task is represented in
Figure 2 where a system of polar coordinates is considered.
It is assumed a target width decreasing with the curvilinear abscissa, s, according to the following equation:
where:
W(0) is the initial target width ()
k is a constant tuning the reduction of the target width with the polar angle,
r is the radius of the nominal trajectory constrained by variable target width, W(s), along the trajectory
Being:
by substituting Equations (9) and (10) in Equation (3), the index of difficulty of a circular trajectory of target width W(s) can be obtained as:
where
is the final polar angle of the trajectory. In case of a semicircular trajectory (
) with decreasing target width, the corresponding ID is obtained as:
Consistently, Equation (9) becomes:
Let’s assume
where f
rid is a non-dimensional term (>1) expressing the reduction factor of the target width between the initial and final target size. By combining Equations (13) and (14), the constant k is obtained as:
By substituting constant k (Equation (15)) in Equation (12), ID
semicirc is obtained. In case of constant target width (
) the ID
semicirc results:
3. ‘Speed-ID-Accuracy’ Model: Numerical Cases
In this section, starting from experimental data available in the scientific literature [
19], the ‘Speed-ID-Accuracy’ model (Equation (5)) has been applied to both Tunnel Traveling Task (TTT) and Circular Traveling Task (CTT). Experiments relate samples of individuals with different age in accomplishing differently sized TTT and CTT. Field data observed revealed no significant difference between differently aged individuals. Some of the TTT row data available in the quoted paper are summarized in
Table 1.
Starting from the success probability values in
Table 1, the corresponding error and z values are obtained for different A and W values. This allows determining the effective target width (We) by Equation (6) and the corresponding standard deviation values (SD
TTT(x)) by Equation (7). Traveling length (A) and movement time (MT) values observed provide the average speed of tasks’ execution. Finally, the corresponding ID values have been obtained by Equation (8).
By regressing SD
TTT(x) values on speed and ID values, the parameters of the ‘Speed-ID-Accuracy’ model (Equation (5)) have been obtained; they are shown in
Table 3.
As one can see, the model (Equation (5)) fits well data available in [
19] as witnessed by R
2 = 91.78% and
p-value = 0.001.
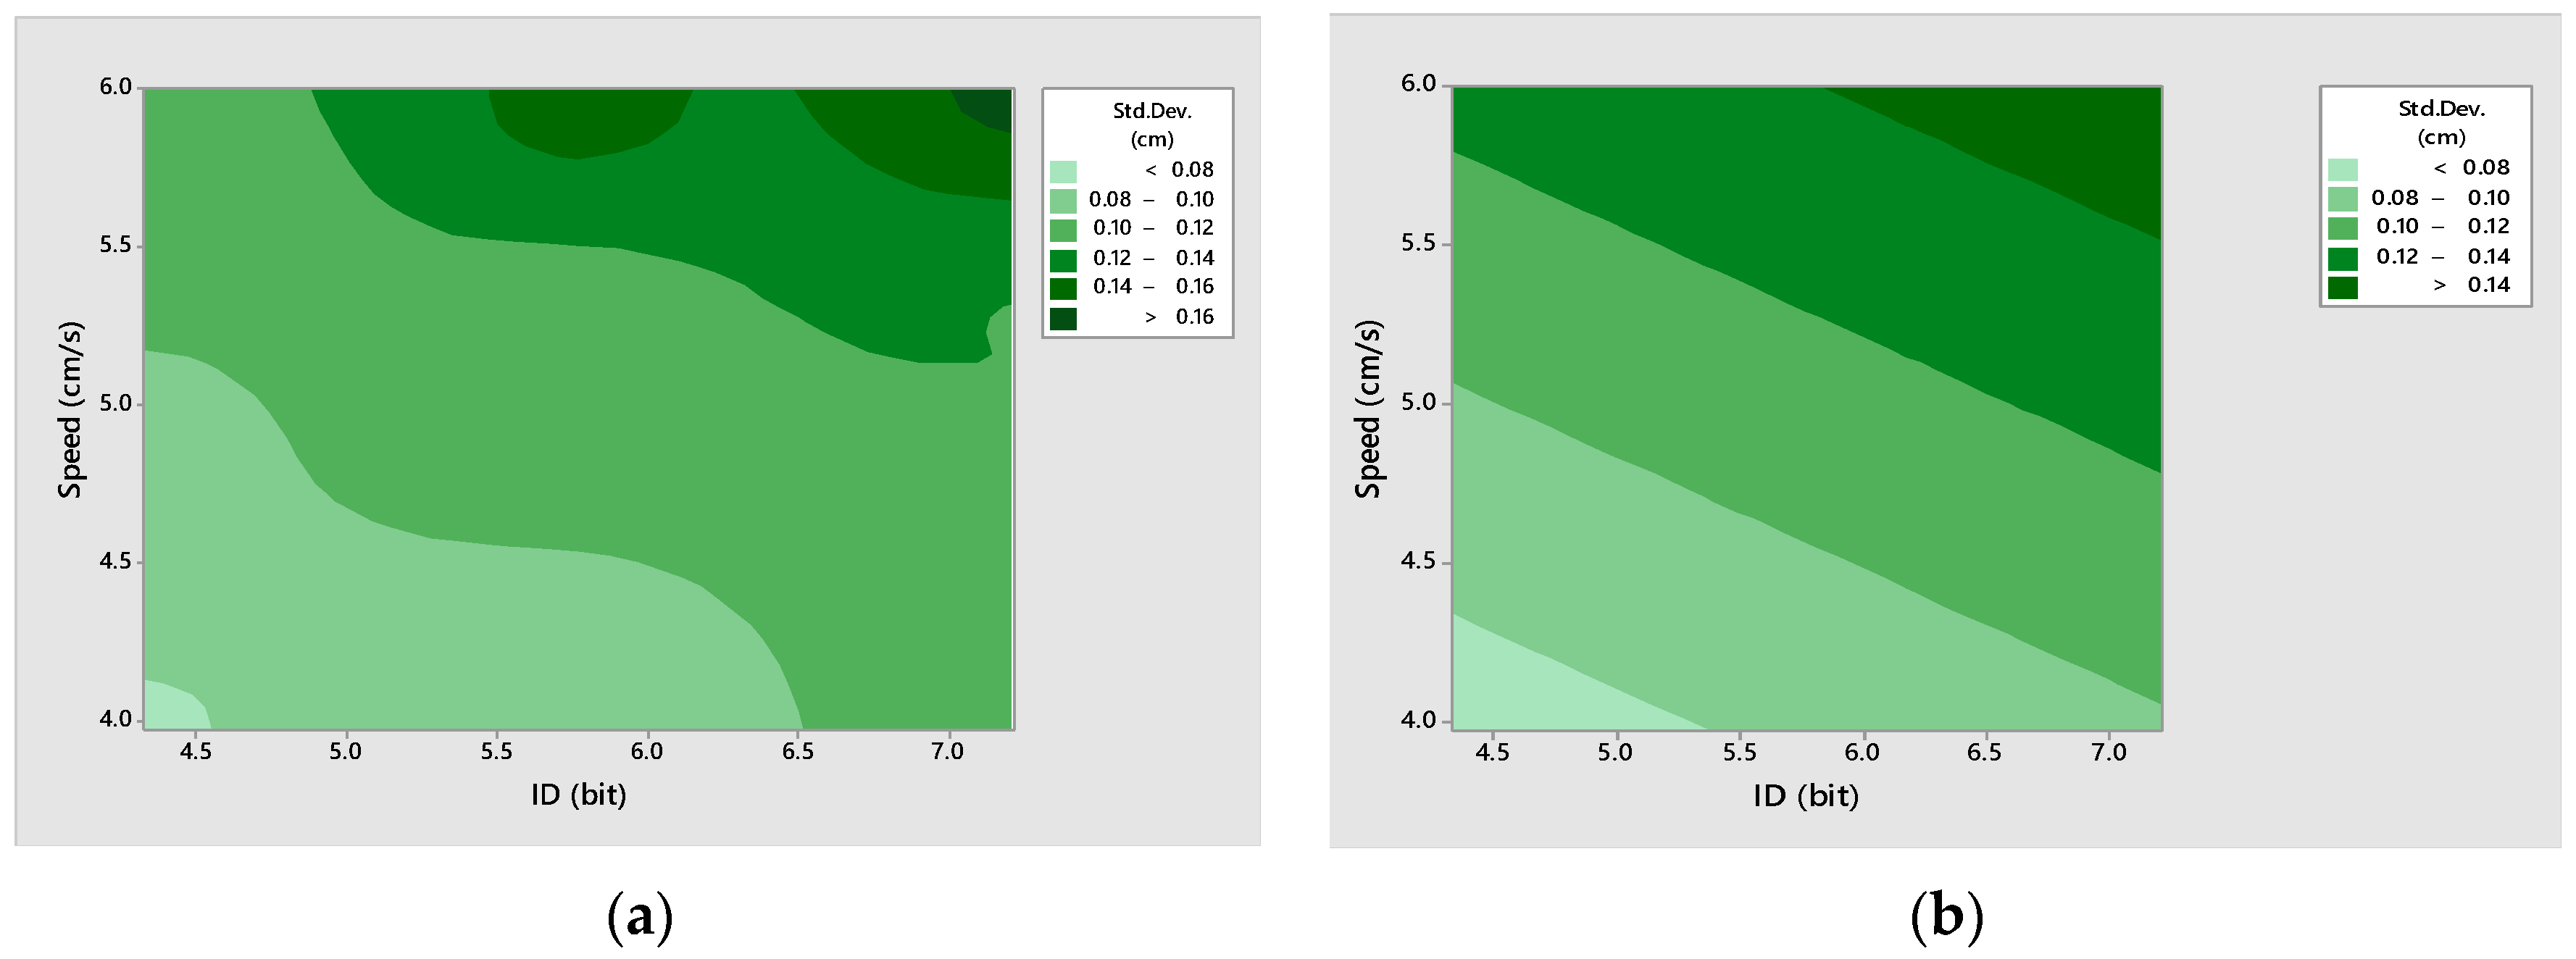
SD
TTT(x) values are plotted in
Figure 3a against task speed observed in experiments [
19] for different ID values evaluated by Equation (8); similarly, dependency of SD
TTT(x) on both task speed and ID values as calculated by the model (Equation (5)) is plotted in
Figure 3b.
It is worth nothing the significant dependency of SDTTT(x) on ID. Such a finding is due to the extension of the classical ‘Speed-Accuracy’ model by the model proposed. In fact, by neglecting the ID influence on SDTTT(x), the regression analysis on experimental data by Equation (4) (classical model) provides a less accurate goodness of fit, being R2 = 73.46% and p-value = 0.003.
Experimental data (
Table 1) allowed regressing task speed (v = A/MT) on A and W values as:
The regression parameters of Equation (9) are in
Table 4 as well as R
2 and
p-values witnessing the goodness of fit of the regression.
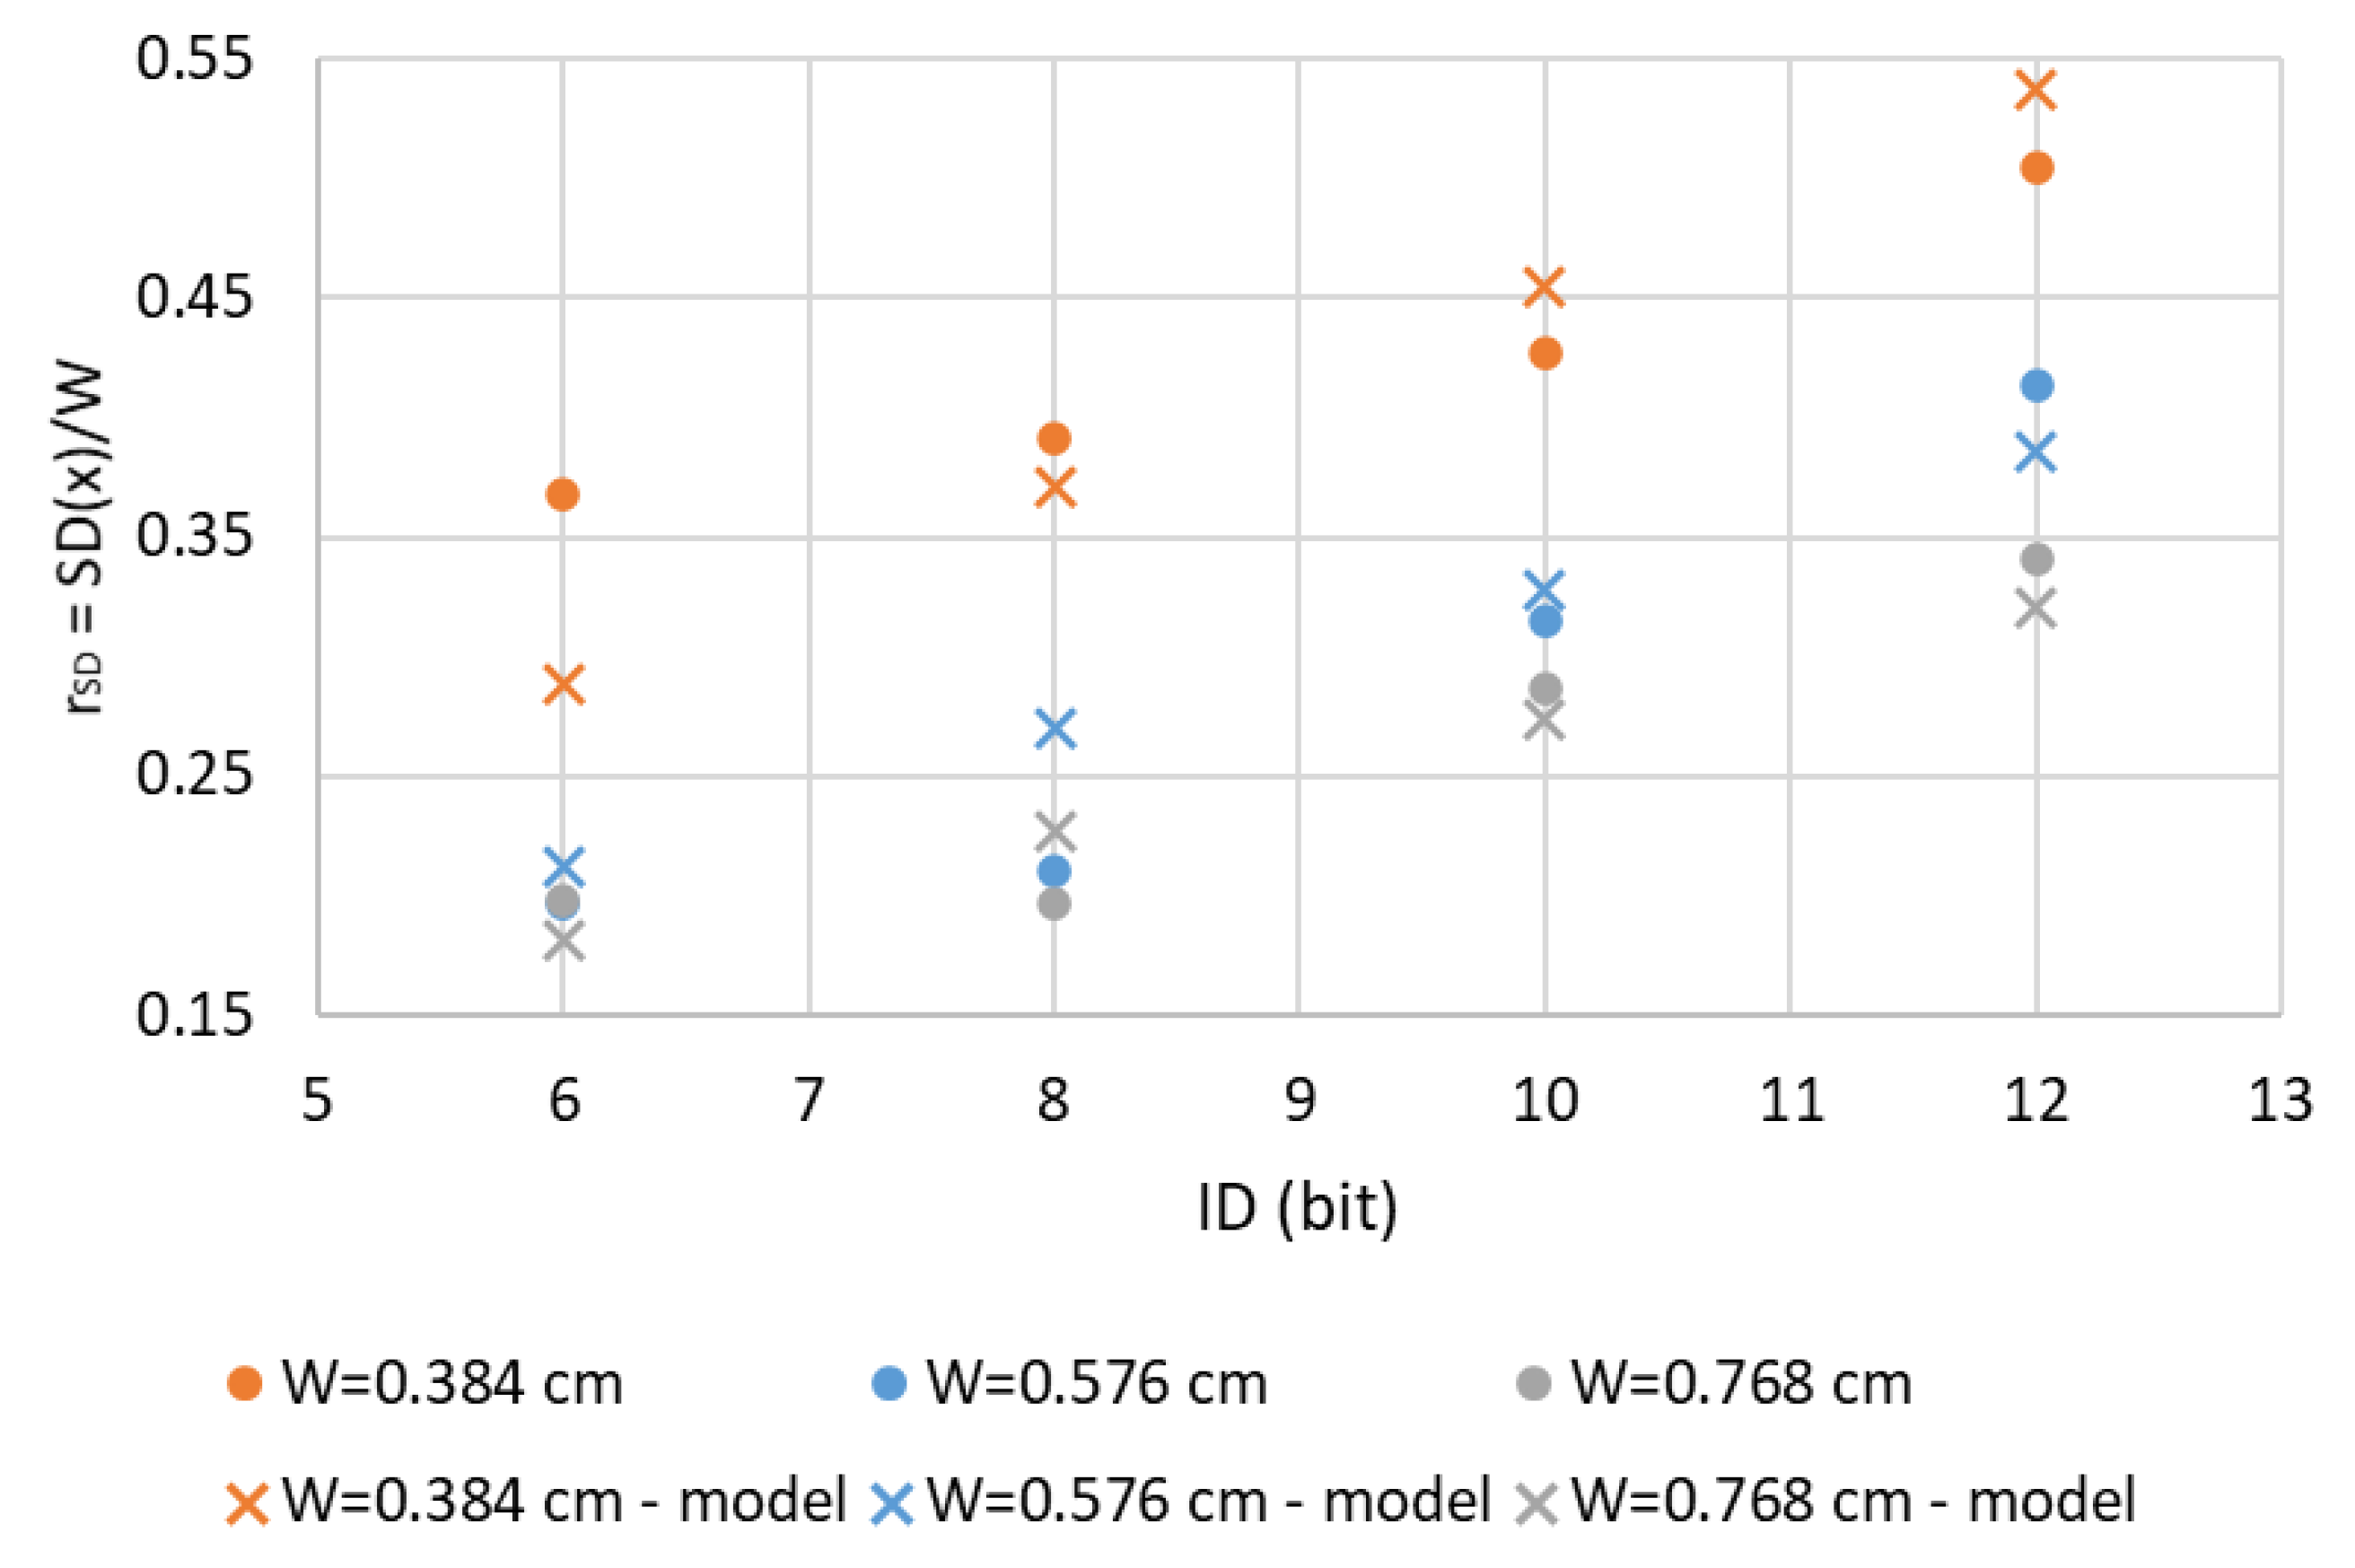
The ‘Speed-ID-Accuracy’ model (Equation (5)) has been tested for different ID and W values of the Tunnel Traveling Task. Results are in
Figure 4. Here, the accuracy of individuals is measured in relative terms, i.e., by the ratio (r
SD) between the standard deviation of the endpoint position (SD(x)) and the target width (W): a high r
SD value represents low relative accuracy of an individual in acquiring a given target. Curves in
Figure 4 are obtained by setting the same range for A (20–45 cm) at a given W value.
The ratio r
SD linearly increases with ID for a given W: less accuracy performance is consequence of higher trajectory lengths as ID increases with A. Moreover, r
SD decreases for higher W values at a given ID: higher accuracy can be obtained in meeting larger targets’ width following a trajectory of a given length. Furthermore, r
SD shows a higher sensitivity to ID for lower W values and same A range, as it can be observed in
Figure 4.
The ‘Speed-ID-Accuracy’ model (Equation (5)) has been applied also to a Circular Traveling Task (CTT) with constant target width along the trajectory.
The ID of a circumferential trajectory (CTT) with constant target width can be easily obtained by setting
in Equation (11):
In [
19], field data on movement time and success probability of reaching the target for different circle perimeters and constant target widths of CTTs are provided. By adopting the same approach followed for the Tunnel Traveling Task, the regression parameters of the ‘Speed-ID-Accuracy’ model (Equation (5)) as well as the regression parameters of the task speed vs. the circle perimeter (A) and target width (W) (Equation (17)) have been obtained. Results of the regression analyses are in
Table 5 and
Table 6, respectively.
As shown in
Table 5, the model (Equation (5)) well fits experimental data even if higher R
2 value could have been obtained in case of more available data. This is mainly due to the higher complexity of a CTT compared with TTT, causing a higher uncertainty in meeting the final target after a circular trajectory.
By applying the classical ’Speed-Accuracy’ model (Equation (4)) to the same data set in [
19], the goodness of regression significantly declines, being R
2 = 19.85 and
p-value = 0.147. As one can see, the usefulness of the proposed ‘Speed-ID-Accuracy’ model increases when reaching tasks have to follow more complex trajectories usually observed in actual cases.
A very good regression of speed values on
A and
W values is obtained (see
Table 6), thus confirming the linear dependency of the speed on the trajectory length (A) and the target width (W) (Equation (17)).
By substituting IDCTT (Equation (18)) and v (Equation (17)) in Equation (5), the ‘Speed-ID-Accuracy’ model for the circular trajectory is obtained.
In
Figure 5, the r
SD values obtained from experimental data [
19] are plotted against the ID of circle perimeter (ID
CTT) for different W values; in the same figure the corresponding r
SD values obtained by the model are plotted.
Both trends (model results and experimental data) show an increasing dependency of rSD on ID: less accuracy (higher rSD) is consequence of a higher task difficulty (i.e., higher lengths of trajectories at a given W). Furthermore, rSD decreases for higher W, at a given ID: higher accuracy can be obtained in reaching targets with higher width.
4. Discussion
The model proposed addresses the need for relating the accuracy in accomplishing tasks with not only the execution speed, but also with task complexity. The classical ‘Speed-Accuracy’ model tends to fail in regressing experimental data when task complexity increases as shown in the numerical cases.
The model proposed proved to be effective in capturing the accuracy in differently complex tasks: the higher task complexity, the more and reliable data are needed.
The model can be usefully applied in actual cases to assess whether the accuracy required in accomplishing a task of a given complexity in a given time window is consistent with individuals the task is assigned to. Conversely, the model can be applied also to assess the speed (time) limit in executing a task of a given complexity under accuracy constraint. The model proposed can be applied in different contexts. In a working environment, workers are required to execute motor tasks: here, workers’ hands (endpoints of interest) have to follow trajectories with complexity differing case by case. In such environments, the trade-off between accuracy, task speed execution, and task complexity is to be searched for.
A further field of the ‘Speed-ID-Accuracy’ model proposed is in biomechanics. For example, monitoring the knees’ trajectories (endpoints of interest) of individuals with or without lower limbs inabilities, can provide a deep understanding of rehabilitation programs. The monitoring of the accuracy of the endpoints requires the evaluation of the trajectory ID which in turn, affect the accuracy of the motor task execution by both healthy individuals and those with physical inabilities.
5. Conclusions and Further Research
The need for quantifying the accuracy of individuals in executing reaching motor tasks of different difficulty is a problem of relevant importance in different human activities. In work environment, operations’ tolerance needs to be consistent with human accuracy (e.g., human-robot interaction). In rehabilitation programs, individuals with disabilities are required to follow a nominal trajectory while minimizing the distance between actual and nominal positions so as to indirectly estimate the psychomotor abilities.
In this paper, the authors propose a ‘Speed-ID-Accuracy’ model extending previous studies on accuracy of individuals in executing simple motor tasks referred to the Fitts’ law. The model proposed extend the investigations toward two directions: firstly, it considers a general geometry of the trajectory which is constrained by continuously variable width of targets; furthermore, the accuracy of individuals in executing such a general motor task is considered to be dependent not only on task speed but also on the ID calculated for the assigned geometry of the motor task. A measure of accuracy is proposed; it is defined as the ratio between the standard deviation of the endpoint position and the final target width so as to take into account the precision of individuals in meeting target of different sizes.
The model proposed can be applied to a general case provided the geometry of the nominal trajectory (s = s(x)) and the shape of continuously variable target width (W = W(s)) as well as the related experimental data on average speed and on errors of individuals in acquiring the final target are given.
The model has been applied to two numerical cases concerning two different types of reaching motor tasks: the ‘Tunnel Traveling Task’ and the ‘Circular Traveling Tasks’. The model parameters have been obtained by regressing experimental data available in the literature. In both cases the model well fitted experimental data and revealed robust in appreciating the dependency of accuracy on task speed execution and ID values. The classical ’Speed-Accuracy’ model proved to be inaccurate in assessing the accuracy of more complex reaching motor tasks as it neglects the effect of task complexity.
To extend the model applicability, further research should be focused on experiments on differently aged and sexed individuals in executing predefined movements along trajectories of whatever geometry. Characterizing the accuracy along complex trajectory could reveal a resource- and time-consuming task. To overcome such a limit, the model proposed could be fed by experimental data captured by motion tracking systems in both labs and working environments.


