Abstract
With the climate change adding to the frequency and intensity of natural disasters, drought has devastated large areas of lands in South Korea. Still, the exact beginning and end of the drought is difficult to identify, and this impedes the development and implementation of disaster predictions. Although the drought phenomenon has been well-documented, predictions thereof are limited due to the non-linear and complex temporal fluctuations of the hydrologic factors. Hence, this study set up some reference points for disaster-prediction rainfall based on South Korea’s agricultural drought damage data, to help in drought relief. To set up the proposed reference points for disaster-prediction rainfall, we analyzed rainfall in light of the disaster-prevention relevance to agricultural droughts and the disaster reduction. As an analysis method, rainfall of municipality was calculated through Thiessen’s polygonal method, to apply rainfall weighting value for each rainfall observatory. In addition, the linear regression analysis was applied to suggest the calculation formula for setting the annual disaster reduction rainfall. The results of this study, standard of judgment point for disaster prevention of agricultural drought at the time of disaster management, were analyzed for rainfall for local governments and the whole country. Rather than using various drought indices that are currently developed, policy makers or public servant made suggestions based on rainfall that is most accessible and convenient for judging the timing of agricultural drought. As the disaster-prevention rainfall with agricultural droughts is expected to occur, we established the average annual rainfall of ≤1200 or 100 mm below the preceding year’s average annual rainfall. Moreover, as the disaster-reduction rainfall for agricultural droughts to end, we determined the average monthly rainfall of ≥150 mm.
1. Introduction
Unlike other natural disasters, such as floods, typhoons, earthquakes and tsunamis, droughts occur slowly, expansively and persistently for months or years. Droughts cause extensive damage, and their spatial scale or intensity is difficult to identify [1]. As part of the impact of global climate change, the rising temperature is projected to cause more frequent droughts, which will presumably last for years, exerting an enormous impact on agriculture and water resources. Recently, years-long droughts have been defined as mega-droughts in studies [2,3,4,5,6]. Furthermore, many researchers have developed methods of assessing and predicting droughts and analyzed their applicability, in view of diverse hydrologic factors, with the intent to minimize the damage from droughts.
Utilizing parameters such as rainfall data, drought indices, statistical methods and climate models, drought researchers have assessed and predicted droughts, as well as developed some quantitative disaster indices. Hydrologic drought indices such as PDSI (Palmer Drought Severity Index), SPI (Standardized Precipitation Index) and SPEI (Standardized Precipitation Evapotranspiration Index) are widely used to assess droughts and applied in research as the reference points for predicting and assessing short-term or prolonged droughts [7,8]. Neuro-Fuzzy, Log linear and ANN (Artificial Neural Network) methods of predicting droughts were used to analyze the drought indices and verify the accuracy thereof [9,10]. Moreover, to develop the methods of predicting and assessing droughts in relation to future climate, hydrologic factors from climate change models were used to calculate the drought indices by means of such analytical methods as MLP (Multi-Layer Perceptron), ANN, ANFIS (Adaptive Neuro-Fuzzy Inference System), SVM (Support Vector Machine), ARIMAX (Autoregressive Integrated Moving Average with Explanatory Variable) and SVR (Support Vector Regression) [11,12,13,14,15,16].
In North America, data from the Multi Model Ensemble Prediction and Global Precipitation Climatology Centre were used to calculate the SPI based on a 100 km grid for analytical drought predictions. In other regions, high-resolution drought-prediction models were developed and applied based on the SPI and SPEI [17,18]. In Virginia, a US state, long-term trends of droughts were calculated in PDSI to develop some reference points for a drought early warning system [19]. The drought-duration thresholds in relation to hydrologic shapes over varying periods were used as a parameter to predict droughts via the PDSI [20]. Although many previous studies calculated drought indices and assessed the accuracy thereof to predict droughts, no research has analyzed the extent of rainfall or set up applicable reference points by comparatively analyzing hydrologic factors associated with the actual droughts. In case of South Korea, drought occurs in the same region for three to four months, rather than long-term drought, as in the United States. Therefore, it is necessary to establish standards for disaster prediction and disaster prevention through drought damage analysis.
By applying the Time Series Analysis or ANA (Artificial Neural Network) to non-linear actual rainfall, some researchers predicted and analyzed droughts effectively. Based on the observed rainfall data, others applied the multiple linear regression analysis, PN (Percent of Normal Precipitation) and UM (Unified Model) to short-term droughts to develop prediction techniques and test their accuracy [21,22]. To predict prolonged droughts, many studies applied non-linear hydrologic data to the probabilistic analysis of ANN and ARIMA [23,24,25,26,27,28,29,30,31,32,33]. Some studies reported that SVR analysis proved to be more accurate than ANN when it comes to predicting a 12-month-long drought [34,35,36]. However, criteria for disaster management by using long-term damage data from past droughts have not been collected. In addition, it was only a study on disaster prediction, and studies on droughts were not conducted. Unlike previous studies that intended to develop some methods of predicting droughts and validate their accuracy, this study regarded droughts as a natural disaster and established some reference points for disaster management.
Others proposed a drought-prediction system, which analyzed and adjusted the uncertainties of probability distributions, using the Bayesian Network in relation to drought persistence [37,38]. An array of studies used actual rainfall data to propose highly accurate drought analysis methods and mostly focused on assessing their drought prediction results, without analyzing the end of droughts or setting up applicable reference points.
The parameters for drought predictions, diverse observational data including rainfall, evapotranspiration and underground water were collected and monitored to predict disasters. To manage hydrologic data, many governments run drought information and prediction/warning systems. Additionally, the reference points for drought-related prediction and decision making were established to help in developing drought indices for disaster managers and decision-makers [39]. Droughts are difficult to predict, and this warrants for the need to develop diverse prediction models and apply appropriate prediction methods in line with a range of reference points [40].
Despite previous studies on various droughts, the importance of disaster management for drought in Korea has been recognized since 2010. In Korea, drought is mostly short-term drought that occurs for three to four months before monsoon season, and large-scale damage has not occurred since 1994. Recently, the need for disaster management has emerged due to the continuous drought caused by climate change. However, the data of drought damage were only published in the year of the large-scale drought damage, but only brief damage contents were recorded. Thus, in this study, we intended to set up some reference points for rainfall in view of disaster prediction for drought relief based on South Korea’s agricultural drought damage. The final goal of the study is to set the criteria for disaster management, not to analyze the damage range of extreme drought or drought, in calculating the disaster prediction rainfall for agricultural drought. The research method is to analyze annual rainfall from 1965 to 2018 for 68 rainfall observation stations that have more than 30 years of rainfall observation data nationwide. In addition, in order to analyze the rainfall characteristics of the occurrence of damage to agricultural drought, the annual average rainfall based on the beginning of the drought damage and the monthly average rainfall in the months before and after the end of the drought damage were analyzed. Various methods of analysis for drought were proposed to analyze the drought with high accuracy or to evaluate the results of drought prediction. However, this study applied linear regression analysis to establish rainfall standard for disaster reduction of agricultural drought considering linear variation characteristics by year. This study aims to establish a rainfall standard that can predict the occurrence and termination of agricultural drought in Korea.
2. Materials and Methods
2.1. Damage from Agricultural Droughts
In this study, we analyzed the damage from agricultural droughts that occurred from 1965 to 2018, based on the data available from the local governments in South Korea. Drought in South Korea caused damage every 10 years, but there was a lot of interest in the frequent storm and flood damage. Systematic disaster management and drought damage data were established after the revision of “Enforcement Decree of Countermeasures against Natural Disasters Act” in June 2018. As for droughts prior to 2018, local governments keep only the damage data for understanding the status. Mostly, local governments collected the data on the periods when droughts occurred and the areas of damage. The damage data of agricultural drought were reported in 1995, 2001, 2009 and 2018, not only in the current year, but also in the past. In addition, from 2010 to 2018, the special report on climate change includes some of the damage data of agricultural drought [41,42,43,44,45,46,47,48,49,50,51,52,53]. Thus, in this study, we reviewed the damage caused by agricultural droughts based on the data available from 17 local governments in South Korea (Figure 1).
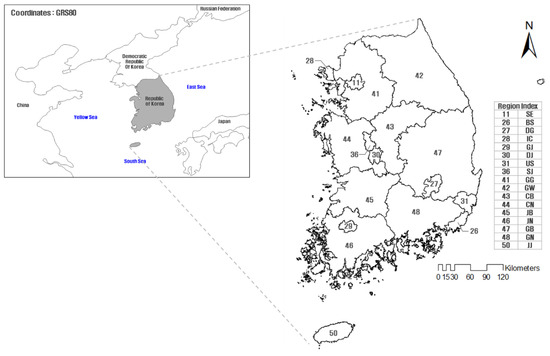
Figure 1.
Study area in South Korea.
South Korea has a total of 17 local governments, that is, 1 special city, 1 metropolitan autonomous city, 1 special self-governing province, 6 metropolitan cities and 8 provinces, as outlined in Table 1. South Korea comprises a land area of 106,285.8 km2 and has a total population of 51.850 million. The country’s special and metropolitan cities account for approximately 14% of its total land area and approximately 45.6% of its total population, while 54.4% of its population resides in the provinces, which take up approximately 86% of its total land area.

Table 1.
State of study area.
South Korea went through 22 agricultural drought events from 1965 to 2018, which caused damage to rice paddies and fields, where crops failed and wilted. Agricultural drought events caused damage to 1~12 municipalities apart from Ulsan Metropolitan City. Municipalities suffered damage from 1~16 agricultural droughts, excluding Ulsan, as shown in Figure 2. The special and metropolitan cities suffered damage from 0~2 agricultural droughts, while 7~16 devastating agricultural drought events occurred in 8 regional provinces. Eleven droughts, or more than 50% of 22 devastating drought events, occurred in regional provinces: Chungcheongbuk-do(11), Chungcheongnam-do(12), Jeollanam-do(13), Gyeongsangbuk-do(15) and Gyeongsangnam-do(16).
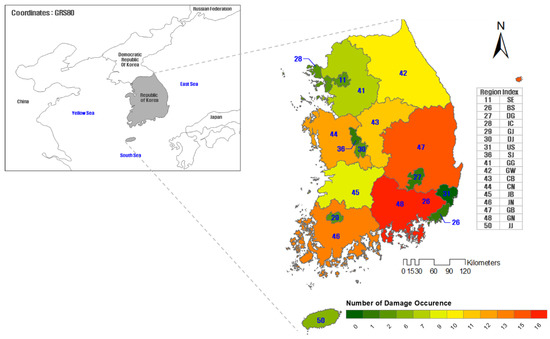
Figure 2.
Damage from agricultural droughts by municipality (1965–2018).
Agricultural droughts caused damage on a yearly basis from 1965 to 1982. Then, in 1994, 1995 and 2013~2018, the drought damage affected the agricultural sector. A total area of 1,993,874 ha suffered damage with crops failing and wilting, whilst a large-scale damage affected an area of 100,000 ha in 1967, 1968, 1982 and 1994 (Table 2). From 1965 to 1977, the beginning of the drought was June, and the end was September, the same period was recorded. The reason for this is that the records of past droughts remain only brief records, and the rough period of occurrence and damage area are presented in the 1995 drought record report. 108 regions were affected by the 22 agricultural drought events, where 4~5 regions on average were affected by agricultural droughts. Compared to special and metropolitan cities, Gyeongsangnam-do, Gyeongsangbuk-do, Chungcheongnam-do and Chungcheongbuk-do suffered the greatest damage from agricultural droughts.
Table 2.
Damage from agricultural droughts by year.
2.2. Local Rainfall Observatories and Rainfall Status
Not only South Korean local governments but also other multiple departments run approximately 68 rainfall observatories and retain rainfall DB (database). The Korean Meteorological Administration (KMA) operates rainfall observatories, where they keep over a three-decade observational data and provide diverse reference points for designing or planning disaster reduction initiatives. 68 rainfall observatories operated by the Korea Meteorological Administration have more than 30 years of proven observation data. Local rainfall observatories are shown in Figure 3.
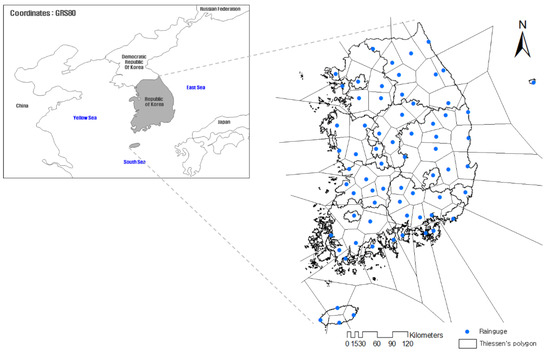
Figure 3.
Local rainfall observatories and Thiessen’s polygon.
Sixty-eight rainfall observatories are distributed throughout 17 municipalities of interest to this study. The KMA-led rainfall observatories collected the rainfall data, on a daily basis, from 1965 to 2018. The branch numbers and names of the 68 observatories are outlined in Appendix Table A1. Depending on the size of the municipalities, 1–19 rainfall observatories are in operation, where they calculate the rainfall weighted based on the area ratios of the Thiessen’s polygon, to get the average rainfall. The weight of the Thiessen’s polygon was calculated as the ratio of the area of rainfall observation stations to municipality in the land area. Appendix Table A2 shows the weight of each municipality by rainfall observation station.
From 1965 to 2018, the amount of rainfall in South Korea averaged 1271 mm (min 882 mm–max 1860 mm). The non-linear average annual rainfall curve repeatedly rises above and falls below the average with minimum and maximum rainfall recorded in 1988 and 2003, respectively (Figure 4). The average annual rainfall in South Korea has been increasing and decreasing over a period of about 5 years. The average annual rainfall is small, and about 1000 mm, and in most cases, about 1600 mm.
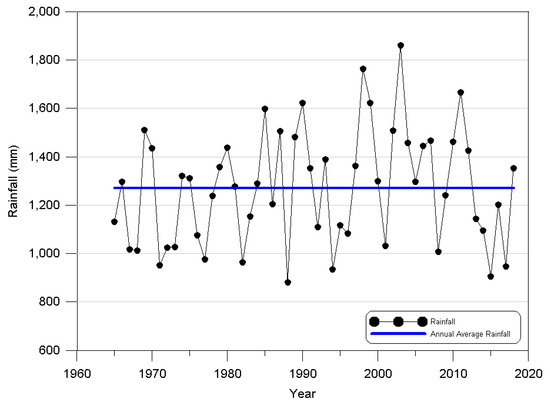
Figure 4.
Rainfall trend by year (1965–2018).
With the impact of North Pacific and Okhotsk sea air masses, monsoonal fronts are formed in South Korea from June to September, when 65% of the country’s total rainfall occurs (Table 3). Due to such rainfall patterns, the country’s October–March rainfall averaged 5% or less of its total annual rainfall. Therefore, the agricultural drought damage in South Korea occurs during the spring drought, from April to May, and during the fall drought, from October to November, based on the monsoon season.
Table 3.
Average monthly rainfall trends (1965–2018).
2.3. Setting Up Reference Points for Disaster-Prediction Rainfall Relevant to Agricultural Drought Damage
In this study, we examined the damage from agricultural droughts that occurred in South Korea, from 1965 to 2018. The period or the time of year when the drought damage occurred and the affected area are described under Section 2.1. A total of 22 agricultural drought events occurred from May to September (Figure 5). Due to the effects of monsoonal fronts, 65% of Korea’s average monthly rainfall is concentrated in June to September, on which agricultural drought season largely falls. The type of damage caused by agricultural drought has been repeated continuously for a certain period of time on an annual basis. Despite the monsoon lasting from June to September, the monsoonal season partially overlaps with the agricultural droughts. Therefore, short-term storm events fail to end the droughts, but above-average rainfall has the capacity to end the droughts. Thus, in this study, we attempted to set up the reference points for disaster-prevention rainfall relevant to the beginning of agricultural droughts and for disaster-reduction rainfall relevant to the end of droughts.
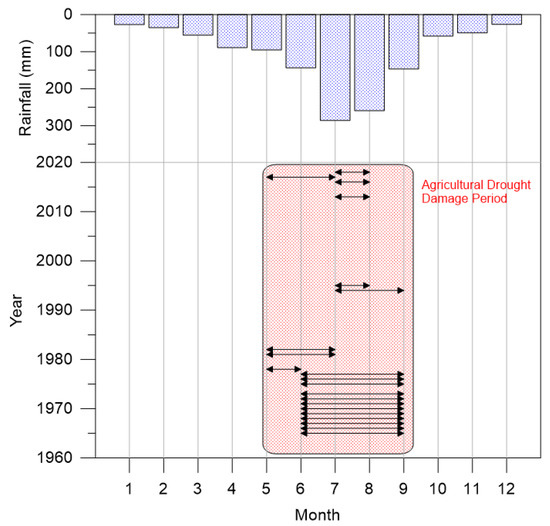
Figure 5.
Setting up drought disaster periods in view of damage from agricultural droughts.
South Korea’s agricultural drought occurs in the form of a 1-year-cycle short-term, rather than long-term, drought and ends in the course of the country’s monsoon season, lasting from June to September. In this study, we comparatively analyzed the past agricultural drought damage versus the average rainfall of drought-free years to set up the disaster-prevention rainfall for predicting the agricultural droughts. For the reference points for disaster-prevention rainfall, we analyzed the extent to which the rainfall in the preceding year fell short of the rainfall in the year prior to the occurrence of agricultural droughts. Agricultural droughts end in the course of the monsoon season as early as July or in September at the latest when a certain amount of rain falls.
To set up the reference points for disaster-reduction rainfall, we analyzed the average monthly rainfall for the months preceding and following the point of time when agricultural drought damage ended. Given agricultural droughts hardly end with a single rainfall event but above a certain amount of rainfall, we analyzed the average monthly rainfall for the months preceding and following the point of time when droughts ended. Thus, in this study, we took into account the past agricultural drought damage data, to set up the reference points of rainfall for predictable disaster prevention and reduction. We analyzed the rainfall to set up the reference points for disaster-prediction rainfall, as shown in Figure 6.
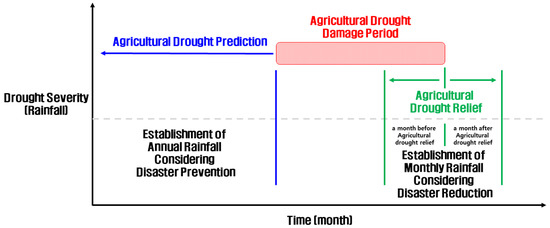
Figure 6.
Setting up rainfall for disaster prediction relevant to agricultural droughts.
2.4. Linear Regression Analysis
Linear regression is a linear approach to modeling the relationship between dependent variable and one or more independent variables . In linear regression, the relationships are modeled by using linear predictor functions whose unknown model parameters are estimated from the data. Such models are called linear models. Given a dataset of n statistical units, a linear regression model assumes that the relationship between the dependent variable and the p of repressors is linear. The model has the following form.
In the given equation, is the coefficient of each independent variable, and p is the number of parameters estimated by linear regression. means transpose, and means internality of and. Moreover, is an error term, an error variable, which is an unobserved random variable, and means an error between the dependent variable and the independent variable. This is called linear regression because it assumes that the dependent variable is in a linear function relationship to the independent variable. However, it is wrong to think that the graph of is a straight line and is a linear function of . For example, there is the following linear regression. Since is linear with respect to and , it can be said to be a linear regression even if the graph having the x- and y-axes is not linear. This expression is expressed in vector format, so it can be expressed as follows.
The meaning of each term in this equation is as follows.
3. Results
3.1. Setting Up Reference Points for Rainfall in View of Disaster Prevention Relevant to Agricultural Droughts
We set up the reference points for disaster-prevention rainfall relevant to agricultural droughts by comparatively analyzing the average rainfall with and without agricultural drought damage, respectively, by municipality and year. An integrated standard of disaster reduction rainfall was proposed by analyzing the difference in annual rainfall for municipalities. Based on the days when agricultural drought damage occurred from 1965 to 2018 in South Korea, we calculated the past average annual rainfall to derive the final average rainfall per municipality. For the years without agricultural drought damage, we calculated the average annual rainfall per municipality, to derive the final average rainfall. We analyzed the average rainfall, both with and without agricultural droughts, respectively, per municipality, as shown in Figure 7.
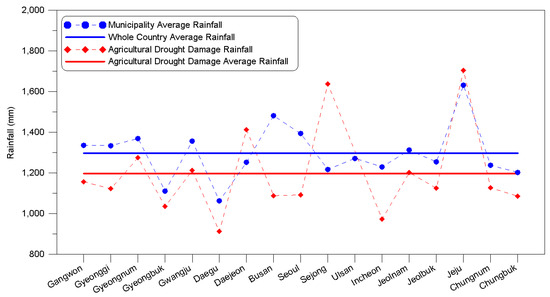
Figure 7.
Setting up rainfall for disaster prevention relevant to agricultural droughts by municipality.
Across the municipalities, agricultural drought damage occurred when the average annual rainfall was 1199 mm (min 913 mm~max 1704 mm). Agricultural drought damage did not occur when the average rainfall was 1297 mm (min 1063 mm~max 1631 mm). It was determined that the annual average rainfall of agricultural drought damage is about 100 mm less than the whole country’s average rainfall. We analyzed the average rainfall trend lines, both with and without agricultural droughts, respectively, in each municipality, as shown in Table 4. Based on the municipalities’ rainfall-trend lines, with drought damage and the average rainfall trend lines analyzed, the agricultural drought occurred in South Korea when the municipalities recorded nearly 100 mm below the average annual rainfall.
Table 4.
Analysis of disaster-prevention rainfall of municipality.
However, the average rainfall in Daejeon, Sejong and Jeju Island was smaller than the amount of rainfall in agricultural drought damage. Average rainfall for agricultural drought damage was calculated a year ago based on the time of drought occurrence. In Daejeon and Sejong, the reason why the amount of rainfall in agricultural drought damage was higher than the average annual rainfall was one and two times. The rainfall for drought damage in 2018 was 1548 mm in Daejeon and 1638 mm in Sejong, and many rainfalls occurred from July to December 2017. On Jeju Island, rainfall is relatively high because it is located on the coast: 1974 mm in 2013 and 1876mm in 2016, and the rainfall is the same in the previous year. Despite the occurrence of agricultural drought damage in the three regions, the annual rainfall for agricultural drought damage was high due to the occurrence of large rainfall in the previous year, and the average rainfall increased due to the less frequent occurrence of agricultural drought. However, in Daejeon, Sejong and Jeju Island, the frequency of agricultural droughts is low, and less than 3% of the total area of Korea is expected to have a small impact on the whole country.
For the whole country, the annual average rainfall and the amount of agricultural drought damage from 1965 to 2018 were analyzed for rainfall in the past year (Figure 8). For the years with agricultural drought damage, the average annual rainfall was 1166 mm (min 846 mm~max 1621 mm). For the years without agricultural drought damage, the average annual rainfall in whole country was 1271 mm (min 882 mm~max 1860 mm). Agricultural drought damage was observed to occur at a small rainfall of about 105 mm, based on the average annual rainfall.
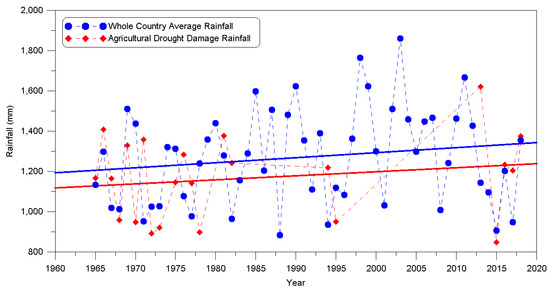
Figure 8.
Setting up rainfall for disaster prevention relevant to agricultural droughts by year.
The characteristics of rainfall were reviewed through a linear regression analysis of annual average rainfall in the whole country and rainfall in agricultural drought damage. The annual average rainfall estimation formula for whole country, calculated by using linear regression analysis, was , and the rainfall estimation formula for agricultural drought damage was analyzed as Here, is the year, is the annual average rainfall in the whole country and is the agricultural drought damage rainfall. Using the linear regression equation, annual rainfall and annual average annual rainfall of agricultural drought damage were analyzed (Table 5). In the whole country, the damage of the past agricultural drought occurred when the average annual rainfall was less than 97 mm. The average rainfall with agricultural drought damage was 1154 mm (min 1115 mm~max 1221 mm) per year, whilst the average annual rainfall was 1251 mm (min 1203 mm~max 1335 mm). The rainfall with drought damage in South Korea averaged 97 mm (min 88 mm~max 114 mm) per year.
Table 5.
Analysis of disaster-prevention rainfall by year, considering linear regression analysis.
In this section, for disaster prevention of agricultural drought, the average rainfall and the amount of agricultural drought damage occurred were analyzed for municipality and the whole country. The damage of agricultural drought in the municipality occurred when the annual rainfall was less than 1199 mm or less than the municipality annual average rainfall of 101 mm at the time of observation. In the whole country, the damage of agricultural drought occurred when the annual rainfall was 1154 mm or less at the time of observation, or 97 mm or less than average rainfall in the whole country. The annual rainfall amount of 1154 to 1199 mm, which is the cause of damage to agricultural drought, was analyzed for the whole country and municipality, and the average annual rainfall was analyzed to be 97 to 101 mm. In this study, the standard of judgment point for disaster prevention of agricultural drought at the time of disaster management was analyzed for rainfall for municipality and the whole country. Rather than using various drought indices that are currently developed, policy makers or public servant made suggestions based on rainfall that is most accessible and convenient for judging the timing of agricultural drought. Thus, in this study, we set up the annual rainfall of ≤1200 or 100 mm below the average annual rainfall for the preceding year as the reference rainfall for disaster prevention relevant to agricultural droughts.
3.2. Setting Up Rainfall in View of Disaster Reduction Relevant to Agricultural Droughts
South Korea has four seasons, and about 65% of annual average rainfall occurs in summer. Most agricultural droughts occur before the monsoon season in summer, and droughts are reduced based on this. Since the start or end of an agricultural drought cannot be accurately determined, we want to analyze the rainfall before and after a month based on the time when the drought ends in the past data. Rainfall for reduction disasters in agricultural drought was analyzed for local governments and the whole country average monthly rainfall before and after a month based on the end date of the past agricultural drought damage. It analyzes municipality and the whole country and calculates monthly rainfall for disaster reduction to propose an integrated standard.
The rainfall for disaster reduction of municipality was analyzed for total average rainfall of monthly rainfall about a month before and after the end of the agricultural drought damage (Figure 9). The average monthly rainfall for the month preceding the days when the agricultural drought damage ended by municipality was 164 mm (min 42 mm~max 311 mm). The average monthly rainfall for the month following the days when the damage ended was 140 mm (min 22 mm~max 239 mm). It was analyzed that the average rainfall before and after the month to disaster reduction of agricultural drought damage to all municipality is required.
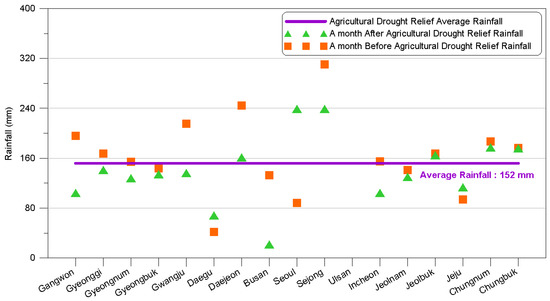
Figure 9.
Setting up rainfall for disaster reduction relevant to agricultural droughts by municipality.
Monthly rainfall was analyzed about a month before and after the end date of the agricultural drought damage, by year, to reduce disasters for the whole country (Figure 10). The average monthly rainfall for the month preceding the day when the agricultural drought damage ended was 166 mm (min 67 mm~max 447 mm) per year. The average monthly rainfall for the month following the day when the agricultural drought damage ended was 131 mm (min 20 mm~max 393 mm) per year.
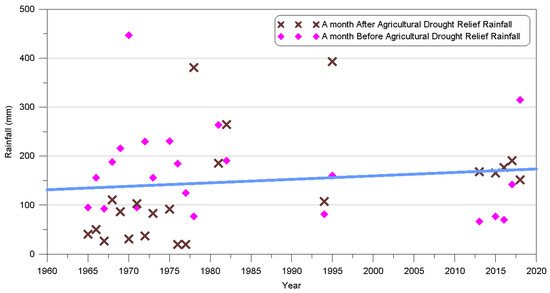
Figure 10.
Setting up rainfall for disaster reduction relevant to agricultural droughts by year.
Rainfall characteristics were reviewed through a linear regression analysis on the monthly average rainfall before and after a month for agricultural drought damage across the country. The monthly rainfall estimation equation for disaster reduction of agricultural drought damage in the whole country, using linear regression analysis, was determined to be . Here, Y is the year, and Radrr is the average monthly rainfall for disaster reduction of agricultural drought damage. Monthly rainfall for disaster reduction of agricultural drought damage, using linear regression, was analyzed (Table 6). The analysis of the disaster-reduction rainfall, using linear regression for ending the agricultural droughts by year, indicated that approximately 154 mm or more rainfall was required to end the agricultural droughts. The rainfall for ending the agricultural droughts averaged 154 mm (min 140 mm~max 178 mm).
Table 6.
Analysis of disaster-reduction rainfall by year considering linear regression analysis.
In this section, monthly rainfall in the month before and after the end of the agricultural drought was analyzed for municipality and the whole country for disaster reduction of agricultural drought. The monthly rainfall for solving agricultural drought by municipality was determined to be 152 mm as the average monthly rainfall for total municipality. The linear regression equation was calculated for monthly rainfall for the whole country to overcome agricultural drought, and 154 mm was determined based on past agricultural drought. In this study, the monthly rainfall was analyzed for municipality and the whole country, as a criterion for judging disaster reduction of agricultural drought at the time of disaster management. In South Korea, the agricultural drought ends within four months, due to monsoon season, but the timing of the end of the drought is unclear. Therefore, based on the end time of the agricultural drought, the monthly rainfall before and after a month was analyzed, and the policy manager proposed a criterion for determining when the agricultural drought would end. In this study, we intend to set the standard as the case where the monthly rainfall amount for disasters reduction in agricultural drought occurs more than 150 mm.
4. Discussion
In the past, previous studies on drought predicted and evaluated drought by using the drought index [17,18]. Moreover, Prediction of drought using drought index is widely used in many fields, and its applicability has been reviewed [9,10,51,52,53]. However, previous studies validated the analysis of droughts only with hydrologic parameters, hardly paying attention to the damage from droughts or quantitatively analyzing the rainfall leading to droughts, to propose the reference points for preventing disasters or ending droughts. In Korea, the drought prediction using the drought index is based on meteorological drought prediction using SPI6 only in the Korea Meteorological Administration among the various ministries. The Ministry of Environment, Ministry of Ministry of Agriculture, Food and Rural Affairs, and Ministry of the Interior and Safety, which manage drought, make drought prediction through observational data. The drought index is used as a reference for drought prediction. Therefore, this study analyzed rainfall of disasters prediction for in local governments across the country, not the drought index, for agricultural droughts in Korea. In disaster management, drought should first determine the presence or absence of drought occurrence, using observational data, and second, assess the depth of drought, using the drought index. In addition, when evaluating the depth of drought, it is necessary to prepare for drought by using a drought index suitable for each department’s characteristics.
We collected the cases of damage from agricultural droughts that had occurred in South Korea from 1965 to 2018 and analyzed the impacts of the damage from droughts by municipality and year. A total of 22 agricultural droughts devastated an area of 90,631 ha, causing crops to fail and wilt across 108 regions (min 5977 ha~max 470,423 ha). Furthermore, we analyzed the rainfall in each municipality, based on the data from 68 KMA-led rainfall observatories, and calculated the rainfall by applying the area ratios of the Thiessen’s polygon. In South Korea, the average annual rainfall from 1965 to 2018 was 1271 mm, with min 882 mm and max 1860 mm rainfall forming a non-linear curve repeatedly rising and falling. Moreover, South Korea’s monthly rainfall was characterized by monsoonal fronts built in summer with 65% of the country’s total annual rainfall concentrated in June to September. In this study, we focused on agricultural droughts, calculated the average rainfall leading to droughts by municipality and year, and established integrated reference points for disaster prevention. Furthermore, we calculated the average monthly rainfall for droughts to end by municipality and year, and established integrated reference points of rainfall for disaster reduction. The rainfall standard for disaster prediction that can judge agricultural drought in disaster management was established. The findings in this study involved the reference points based on the limited past damage from agricultural droughts, that is, the disaster-prevention and disaster-reduction rainfall based on average annual and monthly rainfall, respectively. In South Korea, agricultural droughts mostly occur from June to September and end within three to four months, as the country’s drought season overlaps with its monsoon season. However, due to the recent effects of climate change, damage to agricultural drought continues to occur, and not only the importance of drought, but also interest in mega drought is increasing. Despite the increase in agricultural drought damage, the past damage data for agricultural drought were presented with only fragmentary information, and the data were constructed based on various reports.
In this study, disaster reduction rainfall for agricultural drought was proposed. For future research, we will use SPI and SPEI to develop a disaster prediction drought index. We intend to use the drought index considering regional rainfall characteristics to calculate the damage standard of agricultural drought as a drought depth and to calculate an appropriate drought index for various durations. Through this study and future studies, we intend to establish an integrated standard for judging both standard and depth for disaster prediction of agricultural drought.
5. Conclusions
A drought is a natural disaster resulting from the decreasing rainfall attributable to long-term hydro-meteorological imbalance, affecting a range of areas including farming, living and some industries. Moreover, prolonged droughts cause water shortages, crop failure and depletion of reservoirs on a yearly or seasonal basis. In this study, we established integrated reference points of disaster-prediction rainfall for disaster prevention and reduction to help drought relief, based on South Korea’s agricultural droughts.
The rainfall criteria, considering the disaster prevention of agricultural drought, was compared to the annual rainfall amount of agricultural drought damage and the total annual rainfall of municipality by year for municipality and the whole country. The annual rainfall of agricultural drought damage was calculated by municipality to be higher than the national average. The annual rainfall of agricultural drought damage was analyzed to be 1199 mm for municipality and 1154 mm for the whole country. In addition, as a result of comparing with the annual average rainfall in the year when the agricultural drought damage occurred, it was observed that the difference in rainfall occurred 97 mm. Therefore, the rainfall considering the disaster prevention of agricultural drought was set to be less than about 1200 mm annual rainfall or about 100 mm less than the previous year, based on annual average rainfall.
Monthly rainfall in the month before and after the end of the drought was compared to the municipality and the whole country based on the rainfall considering the disaster reduction of agricultural drought damage. Municipality and the whole country of monthly rainfall to solve agricultural drought damage were analyzed similarly. Based on date of end of drought to solve the agricultural drought damage, the monthly rainfall was analyzed by municipality 152 mm and the whole country 154 mm. Therefore, the monthly rainfall for disaster reduction of agricultural drought was set to be more than about 150 mm.
In this study, we set up the reference points for disaster-prevention rainfall relevant to the occurrence of damage from agricultural droughts and disaster-reduction rainfall for droughts to end in South Korea. The present findings should be applicable to not all countries but those whose climatic impacts are comparable to South Korea’s or whose drought season lasts for less than a year. Moreover, the proposed reference points for disaster prediction relevant to agricultural droughts may be conducive to central and local governments’ decision making on disaster management.
Author Contributions
Conceptualization, Y.S. and M.P.; methodology, M.P.; validation, Y.S. and M.P.; formal analysis: Y.S.; resources, Y.S.; data curation, Y.S.; writing—original draft preparation, Y.S.; writing—review and editing, M.P.; visualization, Y.S.; supervision, M.P.; project administration, M.P. All authors have read and agreed to the published version of the manuscript.
Funding
This research was funded by the Korean Ministry of Interior and Safety, grant number 2019-MOIS31-010, and the APC was funded by the Korean Ministry of Interior and Safety.
Acknowledgments
This research was supported by a grant (2019-MOIS31-010) from the Fundamental Technology Development Program for Extreme Disaster Response, funded by Korean Ministry of Interior and Safety (MOIS).
Conflicts of Interest
The authors declare no conflict of interest.
Appendix A
Table A1.
Rainfall observatories.
Table A1.
Rainfall observatories.
| No. | Station Index | Station Name | No. | Station Index | Station Name | No. | Station Index | Station Name |
|---|---|---|---|---|---|---|---|---|
| 1 | 90 | Sokcho | 24 | 156 | Gwangju | 47 | 243 | Buan |
| 2 | 95 | Cheorwon | 25 | 159 | Busan | 48 | 244 | Imsil |
| 3 | 100 | Daegwallyeong | 26 | 162 | Tongyeong | 49 | 245 | Jeongeup |
| 4 | 101 | Chun Cheon | 27 | 165 | Mokpo | 50 | 247 | Namwon |
| 5 | 105 | Gangneung | 28 | 168 | Yeosu | 51 | 248 | Jangju |
| 6 | 108 | Seoul | 29 | 170 | Wando | 52 | 256 | Juam |
| 7 | 112 | Incheon | 30 | 184 | Jeju | 53 | 260 | Jangheung |
| 8 | 114 | Won-ju | 31 | 185 | Gosan | 54 | 261 | Goheung |
| 9 | 115 | Ulleungdo | 32 | 188 | Seongsan | 55 | 262 | Goheung |
| 10 | 119 | Suwon | 33 | 189 | Seogwipo | 56 | 271 | Bonghwa |
| 11 | 127 | Chungju | 34 | 192 | Jinju | 57 | 272 | Youngju |
| 12 | 129 | Seosan | 35 | 201 | Gangjwa | 58 | 273 | Mungyeong |
| 13 | 130 | Uljin | 36 | 202 | Yangpyeong | 59 | 277 | Yeongdeok |
| 14 | 131 | Cheongju | 37 | 203 | Icheon | 60 | 278 | Uiseong |
| 15 | 133 | Daejeon | 38 | 211 | Inje | 61 | 279 | Gumi |
| 16 | 135 | Chupungryeong | 39 | 212 | Hongcheon | 62 | 281 | Yeongcheon |
| 17 | 136 | Andong | 40 | 216 | Taebaek | 63 | 284 | Geochang |
| 18 | 138 | Pohang | 41 | 221 | Jecheon | 64 | 285 | Hapcheon |
| 19 | 140 | Gunsan | 42 | 226 | Boeun | 65 | 288 | Miryang |
| 20 | 143 | Daegu | 43 | 232 | Cheonan | 66 | 289 | Sancheong |
| 21 | 146 | Jeonju | 44 | 235 | Boryeong | 67 | 294 | Geoje |
| 22 | 152 | Ulsan | 45 | 236 | Buyeo | 68 | 295 | Namhae |
| 23 | 155 | Changwon | 46 | 238 | Geumsan |
Table A2.
Thiessen weight of rainfall observation stations for municipality.
Table A2.
Thiessen weight of rainfall observation stations for municipality.
| Region Index | Station Index | Thiessen Weight | Station Index | Thiessen Weight | Station Index | Thiessen Weight |
|---|---|---|---|---|---|---|
| GW | 90 | 0.04 | 95 | 0.06 | 100 | 0.16 |
| 101 | 0.10 | 105 | 0.06 | 114 | 0.09 | |
| 130 | 0.01 | 211 | 0.15 | 212 | 0.11 | |
| 216 | 0.14 | 221 | 0.08 | 271 | 0.01 | |
| GG | 95 | 0.19 | 101 | 0.04 | 108 | 0.15 |
| 112 | 0.02 | 114 | 0.01 | 119 | 0.18 | |
| 201 | 0.06 | 202 | 0.15 | 203 | 0.15 | |
| 212 | 0.01 | 232 | 0.04 | |||
| GN | 152 | 0.02 | 155 | 0.09 | 159 | 0.03 |
| 162 | 0.04 | 192 | 0.12 | 248 | 0.02 | |
| 279 | 0.10 | 284 | 0.11 | 285 | 0.12 | |
| 288 | 0.15 | 289 | 0.12 | 294 | 0.04 | |
| 295 | 0.05 | |||||
| GB | 130 | 0.04 | 135 | 0.10 | 136 | 0.08 |
| 138 | 0.08 | 143 | 0.07 | 152 | 0.03 | |
| 216 | 0.01 | 226 | 0.01 | 271 | 0.07 | |
| 272 | 0.06 | 273 | 0.09 | 277 | 0.09 | |
| 278 | 0.11 | 281 | 0.10 | 284 | 0.01 | |
| 285 | 0.02 | 288 | 0.02 | |||
| GJ | 156 | 1.00 | ||||
| DG | 143 | 0.93 | 285 | 0.07 | ||
| DJ | 133 | 0.95 | 238 | 0.05 | ||
| BS | 152 | 0.10 | 159 | 0.90 | ||
| SE | 108 | 1.00 | ||||
| SJ | 131 | 0.44 | 133 | 0.34 | 232 | 0.22 |
| US | 152 | 0.98 | 288 | 0.02 | ||
| IC | 112 | 0.55 | 201 | 0.45 | ||
| JN | 156 | 0.17 | 165 | 0.14 | 168 | 0.06 |
| 170 | 0.06 | 192 | 0.01 | 245 | 0.03 | |
| 247 | 0.05 | 256 | 0.17 | 260 | 0.13 | |
| 261 | 0.09 | 262 | 0.09 | 295 | 0.01 | |
| JB | 135 | 0.01 | 140 | 0.08 | 146 | 0.17 |
| 156 | 0.01 | 236 | 0.01 | 238 | 0.10 | |
| 243 | 0.10 | 244 | 0.09 | 245 | 0.16 | |
| 247 | 0.11 | 248 | 0.13 | 284 | 0.02 | |
| JJ | 184 | 0.30 | 185 | 0.19 | 188 | 0.26 |
| 189 | 0.25 | |||||
| CN | 129 | 0.29 | 131 | 0.01 | 133 | 0.05 |
| 140 | 0.04 | 232 | 0.20 | 235 | 0.14 | |
| 236 | 0.19 | 238 | 0.08 | |||
| CB | 114 | 0.01 | 127 | 0.26 | 131 | 0.17 |
| 133 | 0.02 | 135 | 0.08 | 203 | 0.04 | |
| 221 | 0.13 | 226 | 0.16 | 232 | 0.02 | |
| 238 | 0.05 | 272 | 0.04 | 273 | 0.03 |
References
- Mishra, A.K.; Singh, V.P. Drought modeling—A review. J. Hydrol. 2011, 403, 157–175. [Google Scholar] [CrossRef]
- Acuna-Soto, R.; Stahle, D.W.; Cleaveland, M.K.; Therrell, M.D. Megadrought and megadeath in 16th century Mexico. Emerg. Infect. Dis. 2002, 8, 360–362. [Google Scholar] [CrossRef] [PubMed]
- Woodhouse, C.A.; Overpeck, J.T. 2000 Years of Drought Variability in the Central United States. Bull. Am. Meteorol. Soc. 1998, 79, 2693–2714. [Google Scholar] [CrossRef]
- Buckley, B.M.; Anchukaitis, K.J.; Penny, D.; Fletcher, R.; Cook, E.R.; Sano, M.; Nam, L.C.; Wichienkeeo, A.; Minh, T.T.; Hong, T.M. Climate as a contributing factor in the demise of Angkor, Cambodia. Proc. Natl. Acad. Sci. USA 2010, 107, 6748. [Google Scholar] [CrossRef] [PubMed]
- Shanahan, T.M.; Overpeck, J.T.; Anchukaitis, K.J.; Beck, J.W.; Cole, J.E.; Dettman, D.L.; Peck, J.A.; Scholz, C.A.; King, J.W. Atlantic Forcing of Persistent Drought in West Africa. Science 2009, 324, 377. [Google Scholar] [CrossRef] [PubMed]
- Benson, L.; Petersen, K.; Stein, J. Anasazi (Pre-Columbian Native-American) Migrations During The Middle-12Th and Late-13th Centuries—Were they Drought Induced? Clim. Chang. 2007, 83, 187–213. [Google Scholar] [CrossRef]
- McKee, T.B. The Relationship of Drought Frequency and Duration of Time Scales. In Proceedings of the Eighth Conference on Applied Climatology, Anaheim, CA, USA, 12–17 January 1993; pp. 17–22. [Google Scholar]
- Vicente-Serrano, S.M.; Beguería, S.; López-Moreno, J.I. A Multiscalar Drought Index Sensitive to Global Warming: The Standardized Precipitation Evapotranspiration Index. J. Clim. 2010, 23, 1696–1718. [Google Scholar] [CrossRef]
- Paulo, A.A.; Ferreira, E.; Coelho, C.; Pereira, L.S. Drought class transition analysis through Markov and Loglinear models, an approach to early warning. Agric. Water Manag. 2005, 77, 59–81. [Google Scholar] [CrossRef]
- Bacanli, U.G.; Firat, M.; Dikbas, F. Adaptive Neuro-Fuzzy Inference System for drought forecasting. Stoch. Environ. Res. Risk Assess. 2009, 23, 1143–1154. [Google Scholar] [CrossRef]
- Yuan, X.; Wood, E.F.; Luo, L.; Pan, M. A first look at Climate Forecast System version 2 (CFSv2) for hydrological seasonal prediction. Geophys. Res. Lett. 2011, 38. [Google Scholar] [CrossRef]
- Cancelliere, A.; Mauro, G.D.; Bonaccorso, B.; Rossi, G. Drought forecasting using the Standardized Precipitation Index. Water Resour. Manag. 2007, 21, 801–819. [Google Scholar] [CrossRef]
- Jalalkamali, A.; Moradi, M.; Moradi, N. Application of several artificial intelligence models and ARIMAX model for forecasting drought using the Standardized Precipitation Index. Int. J. Environ. Sci. Technol. 2015, 12, 1201–1210. [Google Scholar] [CrossRef]
- Shirmohammadi, B.; Moradi, H.; Moosavi, V.; Semiromi, M.T.; Zeinali, A. Forecasting of meteorological drought using Wavelet-ANFIS hybrid model for different time steps (case study: Southeastern part of east Azerbaijan province, Iran). Nat. Hazards 2013, 69, 389–402. [Google Scholar] [CrossRef]
- Sharda, V.N.; Prasher, S.O.; Patel, R.M.; Ojasvi, P.R.; Prakash, C. Performance of Multivariate Adaptive Regression Splines (MARS) in predicting runoff in mid-Himalayan micro-watersheds with limited data/Performances de régressions par splines multiples et adaptives (MARS) pour la prévision d’écoulement au sein de micro-bassins versants Himalayens d’altitudes intermédiaires avec peu de données. Hydrol. Sci. J. 2008, 53, 1165–1175. [Google Scholar] [CrossRef]
- Santos, C.A.G.; Morais, B.S.; Silva, G.B.L. Drought forecast using an artificial neural network for three hydrological zones in San Francisco River basin, Brazil. IAHS Publ. 2009, 333, 302–312. [Google Scholar]
- Mo, K.C.; Lyon, B. Global Meteorological Drought Prediction Using the North American Multi-Model Ensemble. J. Hydrometeorol. 2015, 16, 1409–1424. [Google Scholar] [CrossRef]
- Rhee, J.; Im, J. Meteorological drought forecasting for ungauged areas based on machine learning: Using long-range climate forecast and remote sensing data. Agric. For. Meteorol. 2017, 237–238, 105–122. [Google Scholar] [CrossRef]
- Lohani, V.K.; Loganathan, G.V. An early warning system for drought management using the palmer drought index1. Jawra J. Am. Water Resour. Assoc. 1997, 33, 1375–1386. [Google Scholar] [CrossRef]
- Rao, A.R.; Padmanabhan, G. Analysis and modeling of Palmer’s drought index series. J. Hydrol. 1984, 68, 211–229. [Google Scholar] [CrossRef]
- Şen, Z. Critical drought analysis by second-order Markov chain. J. Hydrol. 1990, 120, 183–202. [Google Scholar] [CrossRef]
- Kim, T.-W.; Valdés, J.B. Nonlinear Model for Drought Forecasting Based on a Conjunction of Wavelet Transforms and Neural Networks. J. Hydrol. Eng. 2003, 8, 319–328. [Google Scholar] [CrossRef]
- Khalighi, S.; Chen, Q.; Ebrahimi, S.; Nazari, A.; Choubin, B. Long-term precipitation forecast for drought relief using atmospheric circulation factors: A study on the Maharloo Basin in Iran. Hydrol. Earth Syst. Sci. Discuss. 2013, 10, 13333–13361. [Google Scholar] [CrossRef]
- Mishra, A.K.; Desai, V.R. Drought forecasting using stochastic models. Stoch. Environ. Res. Risk Assess. 2005, 19, 326–339. [Google Scholar] [CrossRef]
- Mishra, A.K.; Desai, V.R. Drought forecasting using feed-forward recursive neural network. Ecol. Model. 2006, 198, 127–138. [Google Scholar] [CrossRef]
- Mishra, A.K.; Desai, V.R.; Singh, V.P. Drought Forecasting Using a Hybrid Stochastic and Neural Network Model. J. Hydrol. Eng. 2007, 12, 626–638. [Google Scholar] [CrossRef]
- Tian, M.; Wang, P.; Khan, J. Drought Forecasting with Vegetation Temperature Condition Index Using ARIMA Models in the Guanzhong Plain. Remote Sens. 2016, 8, 690. [Google Scholar] [CrossRef]
- Morid, S.; Smakhtin, V.; Bagherzadeh, K. Drought forecasting using artificial neural networks and time series of drought indices. Int. J. Climatol. 2007, 27, 2103–2111. [Google Scholar] [CrossRef]
- Barros, A.P.; Bowden, G.J. Toward long-lead operational forecasts of drought: An experimental study in the Murray-Darling River Basin. J. Hydrol. 2008, 357, 349–367. [Google Scholar] [CrossRef]
- Cutore, P.; Mauro, G.D.; Cancelliere, A. Forecasting Palmer Index Using Neural Networks and Climatic Indexes. J. Hydrol. Eng. 2009, 14, 588–595. [Google Scholar] [CrossRef]
- Karamouz, M.; Rasouli, K.; Nazif, S. Development of a Hybrid Index for Drought Prediction: Case Study. J. Hydrol. Eng. 2009, 14, 617–627. [Google Scholar] [CrossRef]
- Marj, A.F.; Meijerink, A.M.J. Agricultural drought forecasting using satellite images, climate indices and artificial neural network. Int. J. Remote Sens. 2011, 32, 9707–9719. [Google Scholar] [CrossRef]
- Mishra, S.S.; Nagarajan, R. Forecasting drought in Tel river basin using feed-forward recursive neural network. Int. Proc. Chem. Biol. Environ. Eng. (IPCBEE) 2012, 41, 122–126. [Google Scholar]
- Khan, M.S.; Coulibaly, P. Application of Support Vector Machine in Lake Water Level Prediction. J. Hydrol. Eng. 2006, 11, 199–205. [Google Scholar] [CrossRef]
- KiŞI, O.; ÇImen, M. Evapotranspiration modelling using support vector machines/Modélisation de l’évapotranspiration à l’aide de ‘support vector machines’. Hydrol. Sci. J. 2009, 54, 918–928. [Google Scholar] [CrossRef]
- ÇImen, M. Estimation of daily suspended sediments using support vector machines. Hydrol. Sci. J. 2008, 53, 656–666. [Google Scholar] [CrossRef]
- Madadgar, S.; Moradkhani, H. Spatio-temporal drought forecasting within Bayesian networks. J. Hydrol. 2014, 512, 134–146. [Google Scholar] [CrossRef]
- Chen, S.H.; Pollino, C.A. Good practice in Bayesian network modelling. Environ. Model. Softw. 2012, 37, 134–145. [Google Scholar] [CrossRef]
- Steinemann, A.C. Using Climate Forecasts for Drought Management. J. Appl. Meteorol. Climatol. 2006, 45, 1353–1361. [Google Scholar] [CrossRef]
- Almedeij, J. Long-term periodic drought modeling. Stoch. Environ. Res. Risk Assess. 2016, 30, 901–910. [Google Scholar] [CrossRef]
- Yun, Y.N. 1995 Drought Record Investigation Report, 1st ed.; Korea Institute of Civil Engineering and Building Technology: Goyang, Korea, 1995. [Google Scholar]
- Yun, Y.N. 2001 Drought Record investigation Report, 1st ed.; Korea Institute of Civil Engineering and Building Technology: Goyang, Korea, 2001. [Google Scholar]
- Central Disaster and Safety Countermeasures Headquarters. ‘08~‘09 Achievement Report on Drought Overcoming, 1st ed.; National Emergency Management Agency: Seoul, Korea, 2009.
- Ministry of the Interior and Safety; Ministry of Agriculture, Food and Rural Affairs; Ministry of Environment; Korea Meteorological Administration. 2018 National Drought Information Statistics Collection, 1st ed.; Related Administration Department Union: Seoul, Korea, 2018.
- Green Growth Korea. 2010 Abnormal Climate Special Report, 1st ed.; Korea Meteorological Administration: Seoul, Korea, 2010.
- Korea Meteorological Administration. 2011 Abnormal Climate Special Report, 1st ed.; Related Administration Department Union: Seoul, Korea, 2011. [Google Scholar]
- Korea Meteorological Administration. 2012 Abnormal Climate Special Report, 1st ed.; Related Administration Department Union: Seoul, Korea, 2012. [Google Scholar]
- Korea Meteorological Administration. 2013 Abnormal Climate Special Report, 1st ed.; Related Administration Department Union: Seoul, Korea, 2013. [Google Scholar]
- Korea Meteorological Administration. 2014 Abnormal Climate Special Report, 1st ed.; Related Administration Department Union: Seoul, Korea, 2014. [Google Scholar]
- Korea Meteorological Administration. 2015 Abnormal Climate Special Report, 1st ed.; Related Administration Department Union: Seoul, Korea, 2015. [Google Scholar]
- Korea Meteorological Administration. 2016 Abnormal Climate Special Report, 1st ed.; Related Administration Department Union: Seoul, Korea, 2016. [Google Scholar]
- Korea Meteorological Administration. 2017 Abnormal Climate Special Report, 1st ed.; Related Administration Department Union: Seoul, Korea, 2017. [Google Scholar]
- Korea Meteorological Administration. 2018 Abnormal Climate Special Report, 1st ed.; Related Administration Department Union: Seoul, Korea, 2018. [Google Scholar]


Publisher’s Note: MDPI stays neutral with regard to jurisdictional claims in published maps and institutional affiliations. |
© 2020 by the authors. Licensee MDPI, Basel, Switzerland. This article is an open access article distributed under the terms and conditions of the Creative Commons Attribution (CC BY) license (http://creativecommons.org/licenses/by/4.0/).