1. Introduction
For several decades, the characteristics of the corrugations found in insect wings have attracted considerable interest, because of their promising application to the design of micro air vehicles (MAVs). The contribution of the corrugation to wing stiffness is relatively well studied, and it has been concluded that wing corrugation contributes to spanwise bending stiffness with low mass, preventing wing fracture while allowing wing twist and wing camber formation [
1]. These advantages of the corrugated wing are considered to be applicable to the wings of insect-like flapping-wing micro air vehicles (FW-MAVs) [
2,
3,
4,
5,
6,
7,
8,
9,
10,
11,
12]. For FW-MAVs using the reciprocating motion of flapping wings, significant energy loss occurs during the acceleration and deceleration phases at the stroke reversals of the wings, due to inertial force. Therefore, for higher energy efficiency, the wing mass should be as light as possible. Meanwhile, the wing stiffness must be high enough to maintain the wing shape during flapping motion so that it can meet the desired aerodynamic performance requirement.
Another aspect of the wing corrugation that requires further investigation is the effect of wing corrugation on aerodynamic performance. Many experiments and numerical investigations have been carried out to identify the aerodynamic benefits of the corrugated wing. Their conclusions have differed. Some claimed that the wing corrugation was helpful for enhancing the aerodynamic performance of the wing [
13,
14,
15,
16], while others reported that the effect of wing corrugation on aerodynamic performance was insignificant [
17,
18,
19]. Rees [
16] tested a corrugated wing and another wing whose outer contour followed the envelope of the corrugated wing for different Reynolds numbers and aspect ratios [
16]. He found that the ratios between the quasi-lift coefficients and quasi-drag coefficients of the two wings with an aspect ratio of 1.12 were quite similar for different Reynolds numbers of (450 and 900). However, the ratio of the corrugated wing was higher than that of the envelope wing with an aspect ratio of 0.53. Okamoto et al. [
13] conducted wind-tunnel and free-flight tests for various wings. In the comparison of a thin flat plate and corrugated wing at the Reynolds number of around (1.1 to 1.5) × 10
4 at an angle of attack (AoA) in the range of (−6 to 20)°, they showed that the nose-down wing corrugation contributes to an increase in the lift coefficient (C
L) and gliding ratio (C
L/C
D). However, the result in the case of nose-up corrugation was obviously altered, and the lift coefficient and gliding ratio were significantly diminished, compared to those of a non-corrugated wing. Therefore, they claimed that the configuration of the leading edge plays an important role in aerodynamic performance, and the nose-down wing corrugation at the leading edge performs better than the nose-up wing corrugation.
Kesel [
14] performed experiments on various corrugated sectional profiles, following the cross-section of a dragonfly forewing at different locations, to examine the effect of the wing’s corrugation on the aerodynamic performance at an AoA in the range of (−25 to 40)°. Her results showed that aerodynamic performance in terms of lift coefficient and gliding ratio was slightly improved for the corrugated wing compared to that of the flat plate airfoils at the Reynolds number of (7880 and 10,000). However, due to the similar results of two corrugated wings, in which the orientations of the leading edges were in opposite directions, she concluded that the orientation of the leading edge did not affect the aerodynamic efficiency. This conclusion was in contrast to the finding by Okamoto et al. [
13].
Kesel’s experiment was verified by Kim et al. [
15], using two-dimensional numerical analysis with the same wing profiles. Kim et al. similarly concluded that the corrugation increases the performance of the wing within the entire range of AoA of (0 to 40)°. Since the largest increase in lift coefficient was found for the largest corrugation [
15], even though the orientation of the leading edge is upward, they claimed that the increase in lift coefficient was proportional to the scale of corrugation, regardless of the direction of corrugation. Moreover, their numerical analysis studied the generation of the leading-edge vortex (LEVs), trailing-edge vortex (TEVs), and the vortices in the valley formed by the corrugation. Based on the results for an AoA of 30°, they concluded that the increase in lift coefficient is due to the corrugation on the pressure side of the wing, while the contribution of corrugation to the increase in lift coefficient on the suction side is insignificant. Even though the size of the vortex on the suction side increases for a higher angle of attack, the intensity of the vortex is very small, due to the low velocity. Therefore, it is difficult to observe the effect of corrugation on the suction side.
The studies described above were conducted for gliding flight, in which the wings were stationary. From another point of view, Meng et al. [
17] investigated the effect of wing corrugation on the aerodynamic performance of a three-dimensional flapping wing. The corrugated wing was modeled by placing the corrugation on the flat plate, ensuring no camber appearance. Through the numerical analysis, they found that at typical mid-stroke angles of attack of (35 to 50)° in hovering, the average lift of corrugated wing reduced by less than 5%, and this reduction had almost no effect on the mean drag, compared to the rigid flat-plate. Du et al. [
18] also investigated the aerodynamic effects of wing deformation and corrugation of a three-dimensional model hoverfly wing on the aerodynamic performance at hovering condition. They found that the wing deformation contributed to a 9.7% increase in the lift, and the wing corrugation caused a 6.5% decrease in the lift. Thus, they concluded that the wing corrugation was mainly for structural rather than aerodynamic purposes. Au et al. [
19] investigated the effect of corrugation implemented in cambered wings on the aerodynamic performance of three-dimensional flapping wings of the KUBeetle [
12]. They numerically tested two types of corrugated wings: the Z wings have five triangle corrugations placed all over the wing chord, and F wings have non-corrugated areas near the leading and trailing edges. Different corrugation heights of (3 and 6)% of chord length were tested for each type of wing. For the Z wing, the lift and drag increased in the downstroke, compared to the non-corrugated wing. However, due to the reversal of the wing profiles in upstroke, the lift and drag were decreased. For the F wing group, the lift and drag were decreased slightly in both downstroke and upstroke. However, the aerodynamic performances of the F wing with a corrugation height of 3% of chord length were very close to those of the non-corrugated curved wing. Therefore, this particular wing was considered suitable to replace the current KUBeetle wing, due to the structural benefits of the corrugated wing. These consistent conclusions on the corrugated wing under three-dimensional flapping motion are mainly due to the fact that these flapping wings experience a high AoA, where the effect of wing corrugation is diminished.
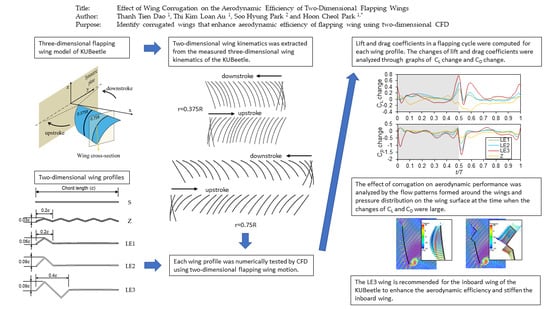
In this study, we aimed to search for particular wing corrugations that can enhance aerodynamic efficiency, even for high AoAs. We used the two-dimensional computational fluid dynamics (CFD) model instead of the three-dimensional model to initially assess the aerodynamic performance of various corrugated wings within a shorter time. A commercial software, ANSYS-Fluent, was used for the computation. Due to the different Reynolds numbers (caused by varying inflow speed and chord length from the root to tip) and angles of attack (due to passively twisted wings) along the wingspan, the aerodynamic efficiencies of wing sections at different spanwise locations can vary. Therefore, we investigated the effect of wing corrugations on the aerodynamic performance at two spanwise locations of
r = (0.375 and 0.75)
R. The aerodynamic efficiencies at the two spanwise locations can represent those of the inboard and outboard wing. The two-dimensional wing motion at the two spanwise locations were extracted from the measured three-dimensional wing kinematics of the KUBeetle [
20]. The results in terms of lift coefficient, drag coefficient, and gliding ratio were compared to those of the non-corrugated curved wing, to confirm the effect of the corrugation on aerodynamic performance.
3. Effect of Wing Corrugation on the Two-Dimensional Flapping Wing
The two-dimensional wing kinematics at
r = (0.375 and 0.75)
R, which are described in
Figure 2 and
Figure 3, were used to investigate the effect of wing corrugation on the aerodynamic performance of the two-dimensional flapping wing. The wing rotation angles at the trailing-edge (
θt) and AoA are related by the following equations:
where the AoAs in the translation stages of the wing at
r = (0.375 and 0.75)
R are around ((55 to 63)° and (37 to 47)°), respectively.
3.1. Computational Domain
Figure 6 shows the two-dimensional computational domain and grids used for the current study. A flapping wing is located at 20 times the chord from the far-field at the top (h
1) and at 25 times the chord from the far-field at the bottom (h
2). The far-field at the bottom is located farther, because the airflow tends to go downward. This height of the computational domain is larger than the length of the three-dimensional computational domain (~33
c) that is used in Phan et al. [
22]. The width of the computational domain (w) depends on the amplitude of wing stroke (A) at the two different spanwise locations, as shown in
Figure 3. Therefore, the width of the computational domain at
r = 0.375
R is around 4.3
c (which is larger than
A0.375 ~3.25
c in
Figure 3), while the width of the computational domain
r = 0.75
R is around 7.55
c (which is larger than
A0.75 ~6.5
c in
Figure 3). The symmetrical walls were set up to model the clap-and-fling effect placed at the ends of upstroke and downstroke, which happens when two wings become closer in the three-dimensional flapping motion.
The wing moves back and forth horizontally following the two-dimensional wing kinematics in the dynamic mesh area, in which three node elements were used with an element length of 0.03
c. Due to the significant change in flow speed in the area around the wing, the grids within 0.1
c from the wing surface are the finest. The first layer grid thickness near the wing is around 0.001
c (
by definition in [
23]). The near-wing grids move and deform together with the wing. Structured grids are used in the rest of the computational domain. The element size of the structured grids near the dynamic mesh area is around 0.04
c. The grids become coarser towards the far-field, with an expansion ratio of 1.1. The far-field pressure condition was applied for the far-field. We have investigated the effect of flow models in [
24]. The estimated mean thrust using the turbulent flow and laminar flow options were quite similar to the measured mean thrust. The time courses of thrust by the turbulent models of k-epsilon and k-omega and laminar flow option were also close to each other. Furthermore, the k-epsilon model provided a reasonably accurate solution within a shorter time than the k-omega model. Therefore, we chose the k-epsilon turbulent model in the present calculations. A time step size of 2 × 10
−5 s was used (0.04% of flapping period) to obtain converged solutions.
3.2. Effect of Corrugation at r = 0.375R
Figure 7a and
Figure 8a show the time courses of lift and drag coefficients for the five flapping wings at spanwise location of
r = 0.375
R, respectively.
Figure 7b and
Figure 8b compare the amount of changes in lift and drag coefficients of the four corrugated wings, respectively, compared to those of the S wing in a flapping cycle.
Table 1 summarizes the amount of changes in stroke and cycle averages of lift and drag coefficients and gliding ratios (C
L/C
D) of the four wings compared to those of the S wing. The gliding ratios (C
L/C
D) are the ratios between the average lift coefficients and average drag coefficients in each stroke and in one cycle.
Figure 7b shows that the lift coefficients of the three leading-edge corrugated wings are increased in a flapping cycle, while the lift coefficient of the Z wing is decreased, compared to that of the S wing. The lift coefficients of the LE1 and LE2 wings during the translational stage of downstroke (0.1
T <
t/T < 0.4
T) are slightly increased and almost the same during the translational stage of the upstroke (0.6
T <
t/T < 0.9
T). Meanwhile, the lift coefficient of the LE3 wing during the translational stage of downstroke is almost the same, compared to that of the S wing. However, during the translational stage of the upstroke, the lift coefficient of the LE3 wing is increased. In downstroke, the lift coefficient of the Z wing is close to that of the S wing, but in upstroke, it is significantly lower compared to that of the S wing.
In the rotation stage (
t/T = (0.5 − 0.6)), the lift coefficients of the three leading-edge corrugated wings are increased significantly, compared to that of the S wing. Among them, the increase in lift coefficient of the LE3 is the largest over this period, and the increase in lift coefficient of the LE1 wing, which has the lowest corrugation, is the smallest, as shown in
Figure 7b. Over the entire flapping cycle, the cycle average lift coefficients of the LE1, LE2, and LE3 wings are (1.5, 2.1, and 3.6)% higher than that of the S wing, respectively. In contrast, the average lift coefficient of the Z wing is 2.6% lower than that of the S wing, as shown in
Table 1.
For drag coefficient, it is evident in
Figure 8b that the drag coefficients of the four corrugated wings are mostly decreased over a flapping cycle, compared to those of the S wing. Due to the decrease, the cycle average drag coefficients of the four corrugated wings are decreased, as shown in
Table 1. Among the four corrugated wings, as shown in
Table 1, the decrease in the drag coefficient of the LE3 wing is the largest (−4.1%), while that of the LE1 wing is the smallest (−1.1%). As a result, the gliding ratio of the LE3 wing is the highest, at around 7.9% higher than that of the S wing. Meanwhile, the increases in the gliding ratios of the LE1 and LE2 are (2.7 and 4.3)%, respectively, compared to that of the S wing. Only the gliding ratio of the Z wing is reduced for 0.9%.
Figure 9 shows the flow fields and swirling strength, which is a vortex indicator for the strength of swirling motion, around the wing at
t = (0.5, 0.6, and 1.0)
T, where the changes in lift coefficients of the corrugated wings are large. In general, the flow fields and swirling strength wings in the trailing edge of the five wings are similar. At
t = (0.5 and 1.0)
T, which is the rotation state, the position of the wings is almost vertical, and the leading-edge vortex (LEV) disappears. This can explain the reduction in lift coefficient of all wings. However, the changes in lift coefficient of the four corrugated wings are significant at
t = (0.5 and 1.0)
T. The difference in lift coefficient can be explained by the pressures acting on the surface in the leading edge of each wing, which are discontinuous due to the triangular shape of the corrugation. At
t = (0.5 and 1.0)
T, the pressures acting on the surfaces of the S and Z wing are almost horizontal or slightly downward. However, due to the larger corrugation in the leading edge of the LE1, LE2, and LE3 wings, most of the pressures acting on the surfaces in the leading edges of these wings are oriented upward. Furthermore, the formation of the local vortex causes suction pressure on the upper surfaces of each edge in the corrugations. These explain the increase in lift coefficient of the three leading-edge corrugated wings, especially the LE3 wing. As can be seen at
t = 0.6
T, the formation of the LEVs can explain the high lift coefficient of all wings. The differences in lift and drag coefficients are due to the flow fields and swirling strength in the leading edges of each wing. The LEV formation of the Z wings is quite similar to that of the S wing. However, the LEVs of the three leading-edge wings are stronger, with higher velocities at the leading edge of those wings compared to that of the S wing, which may explain the increase in lift coefficient of the three corrugated wings at 0.6
T.
3.3. Effect of Corrugation at r = 0.75R
Figure 10 shows the time courses of lift coefficients of the five wings, and the amount of changes in lift coefficients of the four corrugated wings, compared to those of the S wing, respectively.
Figure 11 shows the time courses of drag coefficient and the amount of changes in the drag coefficients of corrugated wings, compared to those of the S wing.
Table 2 shows the amount of changes in stroke and cycle average of lift and drag coefficients and gliding ratios of the four wings, compared to those of the S wing.
Figure 10b shows that during the translational stage of downstroke (0.1
T <
t/T < 0.4
T), the lift coefficient of the LE3 wing is reduced significantly. Meanwhile, that of the Z wing is increased in the period of
t = (0.2 to 0.4)
T. As a result, the average lift coefficient of the LE3 wing during downstroke is reduced the most, by 7%, while that of the Z wing is increased by 2.1%, as shown in
Table 2. The amount of change in downstroke average lift coefficient of the LE2 and LE3 wings is (1.3 and −1.4)%, respectively, compared to that of the S wing, as shown in
Table 2.
For the upstroke, the lift coefficients of the three leading-edge corrugated wings are reduced significantly at
t = 0.6
T but are maintained in the period of
t = (0.7 to 1)
T. The lift coefficient of the Z wing is reduced significantly during almost the entire upstroke period. Due to the decrease, the upstroke average lift coefficients of the four corrugated wings are decreased, as shown in
Table 2. The decrease in the upstroke average lift coefficient of the Z wing is the most, by 12%. The decreases in the upstroke average lift coefficient of the LE1, LE2, and LE3 wings are (2.3, 5, and 5.3)%, respectively. Over a flapping cycle, the cycle average lift coefficients of the LE1 wing are reduced the least, by 0.4%. For the Z and LE2 wings, the reductions are (4.5 and 3.1)%, respectively. That of the LE3 is reduced the most, by 6.2%, as shown in
Table 2.
Table 2 shows that in a flapping cycle, the drag coefficients of the Z and LE3 wings are reduced by (3.2 and 3.9)%, respectively. The drag coefficient of the LE2 wing is slightly decreased, by 0.7%, compared to the drag coefficient of the S wing. The reduction in drag coefficient of the LE1 wing is negligible, at 0.1%. As a result, the gliding ratios of the LE2 and LE3 wings are reduced by 2.4%, while that of the Z wing is reduced by 1.4%. The gliding ratio of the LE1 is reduced the least, by 0.3%.
Figure 12 shows the flow fields and swirling strength around the wings at
t = (0.2 and 0.6)
T, where the change in lift coefficient is large. At
t = 0.2
T, the LEV formation of the Z wing is quite similar to that of the S wing. The LEVs of the S and Z wings are formed closer to the wing surface, compared to those of the leading-edge corrugated wings. This explains the reduction in lift coefficient of the leading-edge corrugated wings. At
t = 0.6
T, the vortex appears on the lower surface, as well as the upper surface of the leading-edge corrugated wings, which can be clearly seen in the LE2 and LE3 wings. Therefore, the pressure on the lower surface is reduced, resulting in reductions in lift coefficient of the leading-edge corrugated wings.
3.4. Discussion
The two-dimensional CFD analysis showed that at r = 0.375R, the wing corrugations placed on the entire wing do not help to improve the aerodynamic performance, which experiences relatively higher AoAs during the translational stage of (55–63)°. On the other hand, at r = 0.375R, the presence of the corrugation at the leading edge is beneficial in enhancing the lift coefficient and gliding ratio of the two-dimensional flapping wing. However, for the two-dimensional flapping wing at r = 0.75R, where the AoAs during the translational stages are relatively lower at (37–47)°, all corrugated wings have lower lift coefficients and gliding ratios, compared to those of the non-corrugated wing.
Furthermore, the effect of the size of the leading-edge corrugation was also examined. At r = 0.375R, the LE3 wing with the largest leading-edge corrugation performed the best among the leading-edge corrugated wings, with a 3.6% increase in lift coefficient and a 7.9% increase in gliding ratio, compared to those of the S wing. Meanwhile, the LE1, which has the smallest leading-edge corrugation, has the lowest performance among the three leading-edge corrugated wings, with a 1.5% increase in lift coefficient and a 2.7% increase in gliding ratio, compared to those of the S wing. However, at r = 0.75R, the wing with the largest corrugation (LE3) has the worse aerodynamic performance, with a 6.2% reduction in lift coefficient and a 2.4% reduction in gliding ratio, compared to those of the S wing. Meanwhile, the aerodynamic performance of the LE1 wing is almost the same as that of the S wing. This investigation shows that the corrugations in the leading edge of the wing are beneficial in enhancing the aerodynamic performance of the flapping wing that operates at relatively high angles of attack during the translational stages (at r = 0.375R). However, for the flapping wing that operates at relatively low angles of attack during the translational stages (at r = 0.75R), the corrugations are detrimental to the aerodynamic performance. Therefore, the wing with the large leading-edge wing corrugations is recommended only for the inboard wing, where, in the KUBeetle case, the AoA is high.
4. Concluding Remarks
In this work, the effects of wing corrugation on the aerodynamic performance were investigated to identify a proper wing corrugation to enhance the aerodynamic efficiency of the insect-like flapping-wing MAV called KUBeetle. A series of two-dimensional CFD analyses based on ANSYS-Fluent were performed for various wings. The computed time courses and cycle average lift and drag coefficients of the three leading-edge corrugated wings and the zigzag wing (Z) were compared with those of the non-corrugated smooth wing (S) at the spanwise locations of r = (0.375 and 0.75)R. The results indicate that the corrugations placed on the entire wing chord were not beneficial to enhance the aerodynamic performance at both spanwise locations at r = (0.375 and 0.75)R. For the three leading-edge corrugated wings, it was found that the leading-edge corrugation was beneficial in enhancing the lift coefficient and reducing the drag coefficient when the flapping wings operate at a relatively higher AoA, based on the two-dimensional wing kinematics at r = 0.375R. In particular, the LE3 wing with the largest corrugation had the highest lift coefficient (around 4% higher than that of the S wing) and the lowest drag coefficient (around 4% lower than that of the S wing). However, the aerodynamic performance of the corrugated wings was poorer than that of the S wing when they operate at relatively lower angles of attack, based on the wing kinematics at r = 0.75R (6% lower in lift coefficient of the LE3 wing, compared to that of the S wing). Therefore, the use of the leading-edge corrugated wing in the inboard wing is a good choice to improve aerodynamic efficiency, because the AoAs in the inboard wing of KUBeetle are relatively high (~60°). Note that the leading-edge corrugation can also be structurally beneficial, especially in the inboard wing, where bending stress is higher than that in the outboard wing.


