Abstract
Flood hazards affect the local economy and the livelihood of residents along the South-Central Coast of Vietnam. Understanding the factors influencing floods’ occurrence potentially contributes to establish mitigation responses to the hazards. This paper deals with an empirical study on applying a combination of the fuzzy analytic hierarchy process (AHP), the fuzzy technique for order of preference by similarity to ideal solution (TOPSIS), and a geographic information system (GIS) to assess flood hazards along the South-Central Coast of Vietnam. Data are collected from focus group discussions (FGDs) with five communal authorities; a questionnaire completed by eight hamlet heads in the Phuoc Thang commune (Binh Dinh province); and documents, reports, and thematic maps provided from official sources. A total of 12 maps of flood factors are prepared. The results show that terrain elevation, creek-bottom terrains, high tide-induced flooding area, and distance to water body are the main factors affecting flood hazards. The An Loi hamlet faces the highest risk for floods, followed by Lac Dien, Luong Binh, and Pho Dong. The map of flood hazards indicates the western part is assessed as low hazard, whereas the eastern part is a very high hazard area. The study findings show that the hybrid approach using GIS-based fuzzy AHP–TOPSIS allows connecting decision makers with the influencing factors of flooding. To mitigate floods, both the Vietnam national government and the Binh Dinh provincial government should integrate natural hazard mitigation into socio-economic development policies.
1. Introduction
Flood hazards are primary hazards associated with exposure to water [1]. Flooding areas have water logging or soil erosion [2]. Storms and climate change increase flood hazards [3]. Consequences of flooding are often severe and directly impact human life by the interruption of services and the destruction of infrastructure and health as a result of famine and disease [2]. Worldwide, flooding is currently responsible for economic loss: it is one of the most expensive natural hazards in the Americas, Europe, and Asia [4,5,6,7]. Mitigating the hazardous effects and managing comprehensive flood risks has become increasingly imperative [5,6,7,8].
Combining spatial analysis and mathematical models to assess flood hazards is internationally recognized. A geographical information system (GIS) has been used to map the flood-prone regions and to establish accurate flood hazard maps [8]. However, even when GIS displays the submerged regions, the latent impacts and origins of the floods are missing. A combination of GIS with the flood fatality hazard (FFH) or the flood damage hazard (FDH) provides flood characteristics on mortality caused by flood hazards [9]. An ordered weighted averaging-based GIS analysis has been used to assess flooding areas and to develop flood hazard maps [10]. A hybrid approach with a combination of GIS, remote sensing, and spatial Monte Carlo Analysis has been developed to calculate flood damage and loss of life risks [11]. The hydraulic–GIS combined model has been used to map flood hazards in urban areas [12]. An integrated approach using Hydrological Engineering Centre (HEC) models, GIS and remote sensing has been developed to generate maps of flood plain and flood hazard [13]. A commercial relational database management system has been linked with a GIS-based decision support system to analyze flood risks. Multiple-criteria decision-making (MCDM) has allowed defining optimal specifications for assessing the factors influencing the likelihood of floods [14]. The analytic hierarchy process (AHP) combined with GIS has been used to evaluate the flood hazard with natural and anthropogenic factors [15], and to map flood risks [16,17,18,19]. A fuzzy analytic hierarchy process (AHP) has assessed flood risk comprehensively [20]. The fuzzy technique for order of preference by similarity to ideal solution (TOPSIS) allowed for evaluating and ranking the substantial levels of associated natural disaster risks [21,22,23]. Each method has its own advantage of evaluating impact factors of the floods. The outcome has been questioned due to its robustness because the experts’ consultancies require to be weighted to provide more reliable results. Integrating Delphi fuzzy AHP–TOPSIS with GIS allowed for addressing the uncertainty of the weighting criteria and assessing the flood vulnerability with stream-based analysis [20]. The Delphi technique initially selected proper assessment criteria for a particular area, and GIS was used to show the spatial outcome of all criteria [23]. Fuzzy AHP–TOPSIS originally used fuzzy AHP for resolving the associate weights and used fuzzy TOPSIS for ranking the alternatives [24].
This study develops a hybrid approach using a combination of fuzzy AHP, fuzzy TOPSIS, and GIS to assess flood hazards along the South-Central Coast of Vietnam based on both natural and anthropogenic factors. The region covers eight coastal provinces (Da Nang, Quang Nam, Quang Ngai, Binh Dinh, Phu Yen, Khanh Hoa, Ninh Thuan, and Binh Thuan), with a total area of 44.54 thousand square kilometers, and a population of 9.4 million people. The area hosts most important coastal cities including Danang (the city under the central government, acting as the economic center of the region), Hoi An (the city with the UNESCO World Heritage Old Quarter), and Nha Trang and Phan Thiet (prominent tourist destinations with many resorts). The South-Central Coast is affected by tropical storms, floods, droughts, and saline intrusions. In November 2009, the storm Mirinae killed and injured 261 people, and damaged about 231.8 million $US infrastructure over four provinces (Binh Dinh, Phu Yen, Khanh Hoa, and Quang Ngai) [25]. In 2016, there were five floods along the Kon River [26]. From 30 October to 10 November 2019, two tropical storms affected the provinces of Binh Dinh and Phu Yen [27]. To come up with empirical solutions to mitigate the negative impacts of flood hazards, both natural and anthropogenic factors affecting the likelihood of floods should be understood. Changes in land use and land cover are considered the most important cause of the increasing floods [28]. Low-elevation areas are more often submerged than higher regions [29]. Other main drivers of flood hazard include stream density, soil properties, and channel slope [30]. Among the impacts of global climate change, storms and rising tides are the main issues causing floods along coastal regions [3,30].
2. Methodology
2.1. Study Area
The selected area of Phuoc Thang is a coastal commune of the Tuy Phuoc district (Binh Dinh province, South-Central Coast of Vietnam), which consists of eight hamlets (Khuong Binh, Pho Dong, Duong Thanh, Luong Binh, Tu Cung, An Loi, Lac Dien, and Thanh Quang). Phuoc Thang is located at the right bank of the Dai An River, which is a part of the lower Kon River, the largest river basin in the Binh Dinh province (Figure 1). The commune covers 14.23 square kilometers, and hosts a total population of 11,326 people (2019). The economy of the commune limited the livelihoods of the local residents who rely on rice. Farmers produce two rice crops a year: spring rice (from December to April) and summer–autumn rice (from May to September) [31]. Because floods occur merely from October to November, they are the most impacting on spring rice.
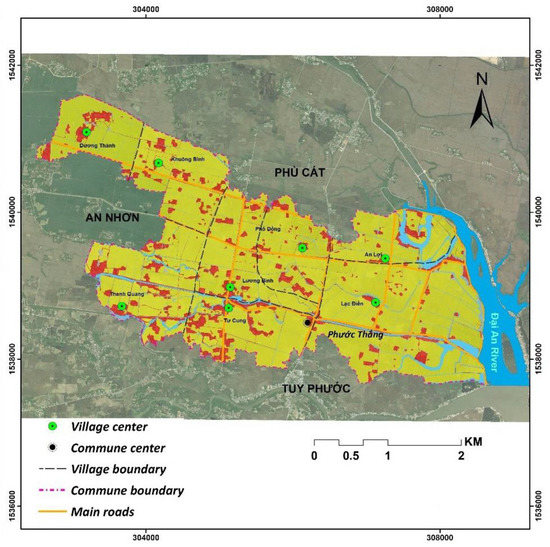
Figure 1.
The location of Phuoc Thang commune in the Tuy Phuoc district (Binh Dinh, Vietnam).
In the Kon River basin, the Tuy Phuoc district is often most damaged by floods. Floods associated with tropical storms cause yearly damage to the local economy. Floods show characteristic features—high intensity, rapid propagation rate, and floodwaters rise and fall—within a short period of time. Floods occur in four periods of the year: (i) floods during May and June are small, mainly occurring in the river beds; (ii) floods in the period from August to September are single peak floods, at a larger scale, with less amplitude, while the amount of water in the rivers is limited; (ii) floods from October to November show the largest scale, and cause most of the damage; and (iv) floods in December to January are small, and cause small losses. A series of major floods occurred along the Kon River in 1987, 1999, 2009, 2013, and 2016. Floods on the Ha Thanh River in November 2009 and along the Kon River in November 2013 are listed as historic floods. The November 2013 flood caused the most serious damage: it inundated 24,281 households (which is 51.7% of total households in the basin) and 11,011.4 hectares of agricultural land (accounting for 40.7% of the total flooded area in the basin). The total damage is estimated at 5.9 million $US, in which most of the losses are for agriculture (2.3 million $US), the irrigation system (1.31 million $US), housing (1.26 million $US), and transportation infrastructure (0.67 million $US). The Phuoc Thang commune suffers most from floods in the Tuy Phuoc district. On average, from two to three floods occur each year with a depth of 1–3 m, for up to 2 weeks. Floods are a major threat to the local economy and to the lives of residents. In the December 2016 flood, three people were killed, two people were injured, 81 houses collapsed, 1850 houses were flooded, and 350 houses were isolated. During the floods, schools, clinics, embankments, and transportation were seriously damaged. The total monetary damage of this flood was estimated at 0.23 million $US [32].
2.2. A Multi-Criteria Decision-Making (MCDM) Using Fuzzy AHP and Fuzzy TOPSIS
2.2.1. Fuzzy Analytic Hierarchy Process
Suppose that a committee of decision makers (DMt, t = 1, …, l) is responsible for assessing n interventions , based on criteria (Cj, j = 1, …, m). Assessing interventions is based on each criterion, while the weights of the criteria are represented as linguistic variables and presented in the form of triangular fuzzy numbers [33,34,35].
The calculated process of the fuzzy AHP method is summarized as follows [33].
Step 1. Calculate the value of fuzzy synthetic extent with respect to the value i
where:
Step 2. Calculate the probability to compare the relation between two fuzzy numbers
where:
Step 3. Calculate the probability of relation for a fuzzy number to be greater than other fuzzy numbers
Step 4. Calculate vector W’
where:
2.2.2. Fuzzy TOPSIS
Step 1. Determine the decision makers’ (DMs’) ratings for each criterion
Set i = 1, …, n, j = 1, …, m, t = 1, …, l, as the appropriate rating defined for alternatives Ai, by decision makers Dt, for each criterion Cj. The average value of the rating, can be calculated as:
where:
Step 2. Normalize the average value of the decision makers for each criterion
To ensure compatibility between values and units of ratings and weights, these values need to be normalized into comparable ranges. Suppose is the average value of alternative Ai for criterion Cj. The normalized value can be calculated as:
where:
Step 3. Determine the normalized rating–weight value
The normalized rating–weight value Gi is calculated by multiplying the weight values of the criteria by the rating value of the solutions as:
Step 4. Calculate values and
The fuzzy positive ideal solution (FPIS,) and fuzzy negative ideal solution (FNIS,) are calculated as:
Distance of each alternative from and is calculated as:
where: is the shortest distance of the alternative and is the longest distance of the alternative
Step 5. Calculate the closeness coefficient
The closeness coefficients (CCi) used to determine the ranking order of the alternatives are calculated as:
The higher a coefficient, the closer that alternative is to the positive ideal solution (PIS) and the further that alternative is from the negative ideal solution (NIS). From these closeness coefficients, the best alternative among the given ones is determined.
Following the fuzzy TOPSIS, the sensitivity analysis is conducted to determine the impact of different conditions of selected criteria (Cj) and decision makers (DMt) and on ranking alternatives (Ai).
Figure 2 shows the relationships between a general goal, 10 selected criteria (Ci, i = 1...10), and 8 studied alternatives (Aj, j = 1…8). The general goal is determining factors affecting the likelihood of flood hazards. Criteria consist of slope (C1), terrain elevation (C2), creek-bottom terrain (C3), soil type (C4), stream density (C5), drainage channel density (C6), distance to water body (C7), high tide-induced flooding area (C8), land use and land cover (C9), and water storage by transportation corridors (C10). These criteria define “vulnerability” in flood studies. The selection of the criteria is based on the quality and quantity of the available information. Alternatives reflect eight hamlets of the Phuoc Son commune including Khuong Binh (A1), Pho Dong (A2), Duong Thanh (A3), Luong Binh (A4), Tu Cung (A5), An Loi (A6), Lac Dien (A7), and Thanh Quang (A8).
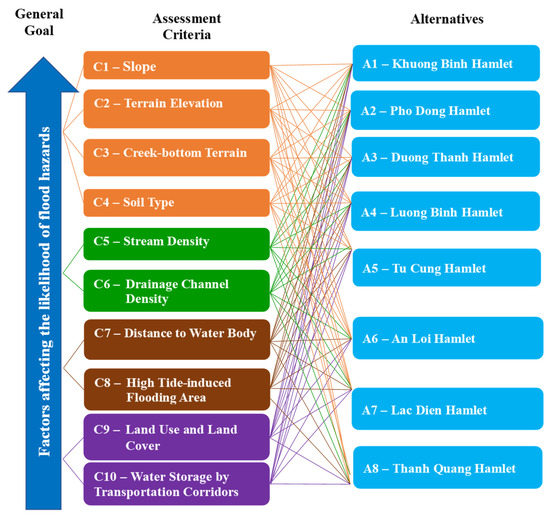
Figure 2.
Factors affecting the likelihood of flood hazards.
2.2.3. Combining AHP–TOPSIS with a Geographic Information System (GIS)
An appropriate methodology for flood risk assessment uses aggregated values of inputs corresponding to their weights. The combination of MCDM and GIS showed its advantages in hazard risk assessment [36,37]. The hybrid approach using fuzzy AHP–TOPSIS originally demonstrates a logically and systematically quantitative framework to initially indicate critical issues, thereafter, assigning associated relative priorities to these issues, selecting the best compromised alternatives, and lastly establishing communication towards general acceptance. The fuzzy AHP, fuzzy TOPSIS, and GIS are integrated into the geographical fuzzy decision making. The fuzzy AHP is used to calculate the weights of selected criteria based on expert opinions as shown in a structured questionnaire. The fuzzy TOPSIS is applied to rank the flood hazardous risks of the alternatives using the weights of the criteria. GIS is used to conduct the Map Algebra procedure with the Spatial Analyst module of ArcGIS software and to map flood hazard factors and flood hazards.
Figure 3 shows the logical framework of the flood risk assessment based on this approach. The first step is determining the criteria. This study uses 10 criteria, representing the terminology “vulnerability” in flood studies in the selected areas (Figure 2). The method of fuzzy AHP combined with fuzzy TOPSIS estimates the weights of the aforementioned criteria, and allows one to prioritize alternative sites based on the intensity of flood hazards. ArcGIS is the final step to aggregate the analyzed outcome of the fuzzy AHP–TOPSIS in a map.
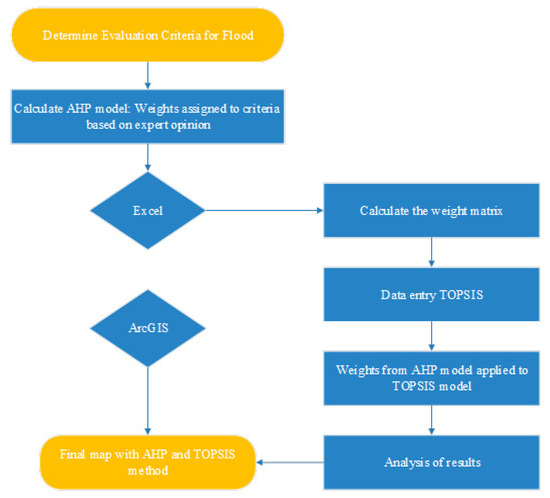
Figure 3.
Logical framework of the study. AHP—analytic hierarchy process, TOPSIS—technique for order of preference by similarity to ideal solution.
2.3. Data Collection
Data were collected during four field trips in October and November 2018, and January and March 2019. These periods were selected because floods are the most severe from October to November, and the spring rice is the most impacted by floods. Flooded areas were detected (Figure 4). Four focus group discussions (FGDs) were organized during the field trips with the involvement of the research team and five local authorities to determine flood hazard factors. After FGDs, 10 factors were selected and are included in a questionnaire sent to the committee members.

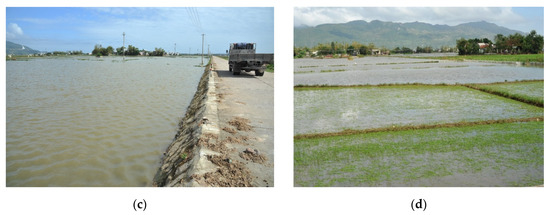
Figure 4.
Flooding sites detected during field trips: (a) Floods cover the national road along the Phuoc Thang commune (October 2018); (b) Floods cover build-up areas in the Phuoc Thang commune (November 2018); (c) Flooded rice fields in the Thanh Quang hamlet (January 2019); (d) Flooded rice fields in the Pho Dong hamlet (January 2019) (photos by the first author Nguyen, H.X., 2018–2019).
Maps of flood hazard factors were established with a resolution of 30 × 30 m. Maps of slopes and terrain elevation were generated by the ArcGIS software using a Digital Elevation Model (DEM) supported by the Ministry of Natural Resources and Environment (MONRE) Vietnam in 2019. Maps of the creek-bottom terrain, high tide-induced flooding areas, and water storage by transportation corridors are based on the information collected during field trips. A map of the soil types was extracted from the soil map of Tuy Phuoc district at a scale of 1/50,000 supported by the Ministry of Agriculture and Rural Development (MARD) Vietnam in 2019. Maps of stream density, drainage channel density, and distance to water body were realized using the ArcGIS software and based on a water surface map of the Tuy Phuoc district at a scale of 1/50,000 provided by MONRE in 2019. A map of land use and land cover was obtained from MONRE in 2019 (Figure 5).
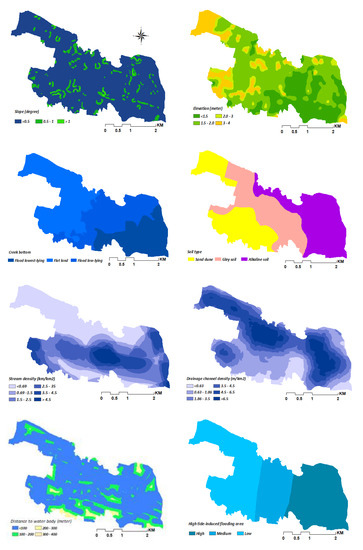
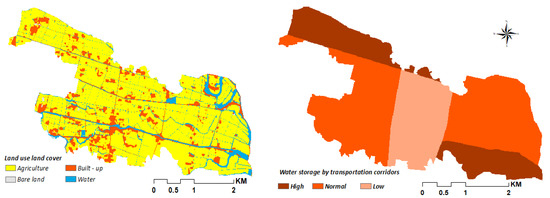
Figure 5.
Maps of flood hazard factors for the Phuoc Thang commune.
Data for weighting criteria and prioritizing alternative sites in the Phuoc Thang commune were collected using a questionnaire with the committee of decision makers (DMs), including five village heads, who have lived for a long time in the local villages and are knowledgeable about various issues related to the local flood hazards. The questionnaire consists of three parts: (i) selecting factors affecting the likelihood of flood hazards and flood levels locally with ”yes–no” questions, and then explaining the selections (Table 1); (ii) comparing 10 criteria by scoring the information of the respondents on the AHP’s comparison matrix; and (iii) selecting alternatives using a Likert’s 5-scale of agreement (1 = strongly disagree; 2 = disagree; 3 = undecided; 4 = agree; 5 = strongly agree). Respondents took approximately 30 min to complete the questionnaire.

Table 1.
The assessment of the heads of hamlets on flood hazards in the Phuoc Thang commune.
3. Results
3.1. Weights of Criteria
After determining the criteria assessing the factors that affect the likelihood of flooding (Figure 4), the committee members were invited to make a comparative pairwise assessment of the importance of the criteria. Based on the assessment scale and the selected factors, the committee members made a specific assessment and compared the pairs of criteria. The average assessment results of the comparison of criteria and comparison of pairs of criteria were calculated using the average results of the committee members. The respondents decide the level of flood hazard risks for the selected studied area. Table 2 shows the criteria weights calculated using fuzzy AHP with linguistic variables.
Table 2.
Linguistic variables and fuzzy numbers.
Table 3 shows the most important criterion was C2 compared to others based on the evaluation of 5 decision matrices on 10 criteria. Criterion C2 (terrain elevation) is considered ”very strongly important” (VSI) to “extremely important” (EXI) compared to C1 (slope), C3 (creek-bottom terrain), C4 (soil type), C6 (drainage channel density), C7 (distance to water body), C8 (high tide-induced flooding area), and C10 (water storage by transportation corridors) for five decision matrices (DM1–5). Criterion C3 (creek-bottom terrain) was assessed “very strongly important” to “extremely important” compared to C1 (slope), C4 (soil type), C5 (stream density), C6 (drainage channel density), C7 (distance to water body), and C8 (high tide-induced flooding) for the decision matrices DM2–5. Criterion C4 (soil type) was assessed “very strongly important” compared to C1 (slope) for the decision matrices DM3 and DM5. Criterion C5 (stream density) was assessed “very strongly important” to “extremely important” compared to C1 (slope) and C5 (stream density) for the decision matrices DM1 and DM3. Criterion C6 (drainage channel density) was assessed “very strongly important” to “extremely important” compared to C1 (slope) for the decision matrices DM1–3 and DM5. Criterion C7 (distance to water body) was assessed “very strong important” to “extremely important” compared to C1 (slope), C4 (soil type), C5 (stream density), and C6 (drainage channel density) for the decision matrices DM1, DM3, and DM4. Criterion C8 (high tide-induced flooding) was assessed “very strongly important” compared to C1 (slope), C5 (stream density), C6 (drainage channel density), and C7 (distance to water body) for the decision matrices DM1–3. Criteria C9 (high tide-induced flooding) and C10 (water storage by transportation corridors) were assessed “very strongly important” to “extremely important” compared to C1 (slope) for the decision matrices DM4 and DM5.
Table 3.
Evaluation of decision matrices.
Table 4 shows the weights of 10 criteria resulting from the fuzzy AHP analysis. Four criteria show weight values over 0.1: terrain elevation (wC2 = 0.123, rank first), creek-bottom terrain (wC3 = 0.118, rank second), high tide-induced flooding area (wC8 = 0.106, rank third), and distance to water body (wC7 = 0.103, rank fourth). The weight of criterion C2 is the highest, which corresponds with the most important role of the terrain elevation among the factors affecting the likelihood of flooding locally. On the contrary, the weights of criteria C1 and C9 are lowest, which points to the less important roles of slope and land use and land cover contributing to the flood hazard risks in a plain area.
Table 4.
Results of the weight of criteria conducted by fuzzy AHP.
3.2. Ranking the Alternatives
Table 5 shows the results of the ideal solutions and the closeness coefficients for decision making alternatives. The ideal solution entails the best possible values of the criteria, whereas the negative ideal solution consists of all the worst possible values of the criteria. The negative ideal solution (d−) indicates that An Loi (A6), Lac Dien (A7), Luong Binh (A4), and Pho Dong (A2) have the highest scores (the values vary from 0.5641 to 0.6680); whereas they get lowest scores for separation from the positive ideal solution (d+) (values ranges 9.3614 and 9.4685). Since the worst alternative sites are farthest from the ideal solution and the closest to the negative ideal solution, it is necessary to pay more attention to flood hazards in these alternatives. According to the value of the closeness coefficient, the An Loi hamlet ranks as the highest priority for flood hazard (CC(A6) = 0.0666), followed by Lac Dien (CC(A7) = 0.0597), and Luong Binh (CC(A4) = 0.0584). These are areas where priority should be given to flood prevention. In contrast, Khuong Binh (CC(A1) = 0.0525), Thanh Quang (CC(A8) = 0.0518), and Duong Thanh (CC(A3) = 0.0500) are less likely to face floods than the other hamlets.
Table 5.
The distance values and the final rankings.
3.3. Sensitivity Analysis
Results of a sensitivity analysis show the impact of different conditions on ranking alternatives (hamlets). Nine scenarios were conducted in connection with 10 selected criteria and 5 decision makers (DMs). Scenarios S1–3 deal with different groups of decision criteria based on their characteristics (the land-induced criteria (C1: slope; C2: terrain elevation; C3: creek-bottom terrain; C4: soil type), the water-induced criteria (C5: stream density; C6: drainage channel density; C7: distance to water body), and the anthropogenic-induced criteria (C8: high tide-induced flooding area; C9: land use land cover; C10: water storage by transportation corridors)) corresponding to all five decision makers. Scenarios S4–8 deal with all 10 criteria corresponding to all five decision makers. Table 6 and Figure 6 shows that fuzzy TOPSIS is more sensitive to the changes of land-induced criteria and the committee of decision makers in different scenarios. The second scenario using slope, terrain elevation, creek-bottom terrain, and soil type reflects a small variation between alternatives A4 (the Luong Binh hamlet) and A7 (the Lac Dien hamlet) compared to the current case. On the contrary, the differences in the ranking alternatives are very much when using the remaining criteria (water-induced and anthropogenic-induced criteria, C5–10) or not using the assessments of all the decision makers. The alternative A6 ranks first in all scenarios which indicates that the An Loi hamlet is consistent with the variation of selected decision criteria and decision makers. Alternatives A2 (Pho Dong), A4 (Luong Binh), and A7 (Lac Dien) change ranking positions, but are always in the group assessed as having the most hazardous flood risk in all scenarios.
Table 6.
Results of sensitivity analysis for different scenarios.
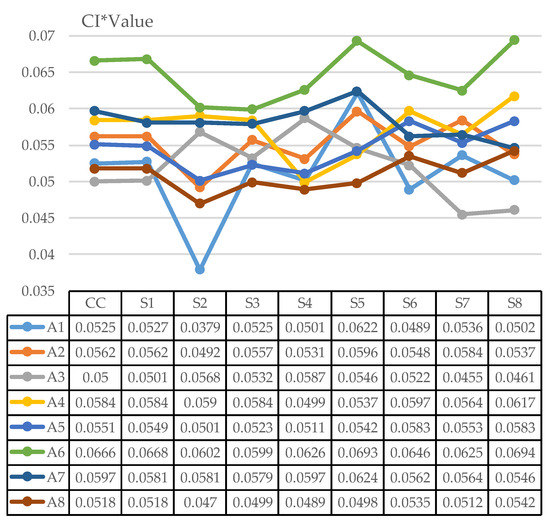
Figure 6.
Results of sensitivity analysis for fuzzy TOPSIS method (where: CI is Consistency Index; CC is current case; S1–8 are scenarios 1–8; A1–8 are alternatives 1–8).
3.4. Zoning Flood Hazardous Areas
The weighting of the factors conducted from fuzzy AHP was the basis to assess the likelihood of flood hazards (FHs) in the hamlets of the Phuoc Thang commune by the formula:
FH = 0.088 × C1 + 0.123 × C2 + 0.118 × C3 + 0.090 × C4 + 0.098 × C5 + 0.097 × C6 + 0.103 × C7 + 0.106 × C8 + 0.085 × C9 + 0.092 × C10
The map of the likelihood of flood hazards shows that four regions obtain four levels of flood hazard risk: the most hazardous area is located close to the Dai An River, which is the lower part of the Kon River (Figure 7). The map with the geographic distribution of the flood hazards shows the consequences of the inclined direction of the terrain from west to east: the western part is assessed as low hazard, whereas the eastern part is a very high hazard area. The zoning results reflect the final ranking of the alternatives: most of the land surface of hamlets An Loi (A6), Lac Dien (A7), Luong Binh (A4), and Pho Dong (A2) are located in the most hazardous areas. Most of the land in Tu Cung (A5) and Khuong Binh (A1) is located in the high hazard areas. Most of the land of Thanh Quang hamlet (A8) is found in the medium hazard areas. Most of the land of the Duong Thanh hamlet (A3) is located in the low hazard areas.
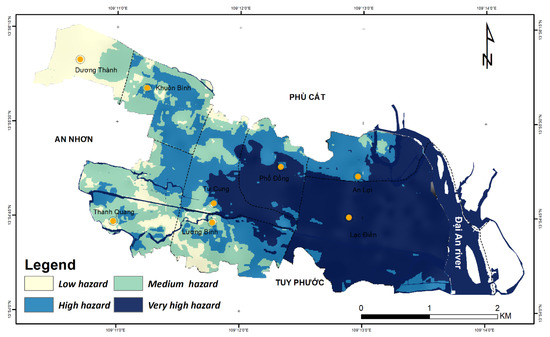
Figure 7.
Map of the flood hazards zoning in the Phuoc Thang commune.
4. Conclusions and Discussion
This paper applied a geographical fuzzy decision making methodology to identify the high-risk areas of flood risks in terms of multiple potential factors and experts’ opinions. An integrated fuzzy AHP–TOPSIS and GIS allowed connecting decision makers with the factors influencing the floods. The systematic and logical approach allowed dealing with complicated multi-stakeholder and multi-criteria decision issues by site-specific weighting of the factors that affect the likelihood of floods. The model determines the normalized rating weight value, and the distance from the alternatives to the positive and negative ideal points. Determining the intensity of the influencing factors and the different sites in which the affected hamlets are at risk is vitally important.
The findings of this study provide evidence on the direct impacts of increasingly devastating floods and suggest the required policies for the development of adaptation and prevention measures for the local populations. Three critical problems in flood hazard assessment were considered in this study: drivers of flood hazards [38], affected areas [39], and zoning flood hazardous areas [40]. A hybrid approach using a GIS-based fuzzy AHP–TOPSIS was developed to solve these problems.
- Results of the fuzzy AHP show that terrain elevation and creek-bottom terrain are the most important drivers, followed by stream density, drainage channel density, water storage, soil type, slope, and land use or land cover. The topography of the studied areas is most important: the closer to the main river, the lower the terrain. Water flows from higher to lower elevations and, therefore, the terrain influences the surface overflow and the penetration. Flat regions at lower elevation potentially submerge faster than higher regions. Land use and land cover is least impacted. Most of the communal areas are agricultural land or built-up sites; therefore, their functions are not affected.
- Results of the fuzzy TOPSIS show that the hamlets of An Loi, Lac Dien, Luong Binh, and Pho Dong are the worst alternative sites. Because they are nearest to the negative ideal solution, it is necessary to pay more attention to flood hazards in these alternatives.
- Results of a sensitivity analysis show that the most important role of land-induced criteria such as slope, terrain elevation, creek-bottom terrain, and soil type, is in estimating spatial distributions of flood hazard risks. This finding implies that for the Phuoc Thang commune, particularly, and other coastal plains, generally, removing one or a few water-induced (stream density, drainage channel density, and distance to water body) and anthropogenic-induced (high tide-induced flooding area, land use land cover, and water storage by transportation corridors) factors would not significantly affect the final risk distributions of the flood hazards.
- Results of zoning flood hazardous areas based on the GIS show that hamlets near the Dai An River are flood-prone. The An Loi and Lac Dien hamlets either share their flat terrain or position close to the Dai An River, which determines their exposure to floods.
In this study, the results of modeling are well explained using both available spatial and nonspatial data, such as field trip studies, FGDs with the involvement of local authorities, semi-structural questionnaires completed by village heads, thematic maps, documents, and official reports provided from official sources. Drivers challenging floods along the coast of Phuoc Thang, located in the lower Kon River basin, should be considered at a regional scale and include tropical storms, regional land use land cover change, and urbanization. The Kon River basin is affected by tropical storms which cause rains and floods. During the storms, the intensity of the rain is very high [25,26,27,31]. Regional land use and land cover changes also contribute to local floods. As a result of over-exploitation, the natural forests decrease sharply, while the planted forest area increases rapidly [31]. Natural forests have been replaced by monoculture forests such as Acacia spp. and Eucalyptus with a 5–7-year forest business cycle. When plantation forests are cut, the bare land is left, and the water holding capacity is limited, which increases the flood risk downstream. Urbanization, transport development, and population growth affect the drainage and flooding over the basin. The lower part of the Kon River is intensely urbanized with the expansion of urban areas among Quy Nhon, An Nhon, and Tuy Phuoc. This reduces the water storage capacity and limits the drainage during floods. Industrial zones of Phu Tai, Nhon Hoa, and Nhon Binh and resettlement areas of Bac Ha Thanh, An Phu Thinh, and Dai Phu Gia limit partially the flood flow of the Kon River. Large development areas such as the SOS Children’s Village, the Quang Trung University, the Binh Dinh College, and especially the National Highway 19 C involve terrain leveling; bridges and culverts along the National Highway 1A have been narrowed, which affects natural water drainage [25,32]. The system of reservoirs and dams contributes to the extended flooded areas in a short period of time. Flood discharge by hydroelectricity installations and irrigation reservoirs also affect flooding downstream [32].
In addition, a poor local economy limits investment in flood mitigation. The economy of Phuoc Thang commune is driven by rice production (1850 hectares of rice with a total rice yield of about 13,000 tons per year). Phuoc Thang has a low average yearly income per person (about 950 $US) [31]. In 2018, the commune counted 317 poor households [31]. This makes the commune fully dependent on the state budget for natural disaster response and prevention. Next to financial limitations, restrictions exist on diversifying industries and income for the community. The livelihoods of the locals depend on agricultural production. This results in low and varying incomes. Agricultural and commercial services are very limited. Therefore, increasing income, improving living standards, and strengthening flood resilience enhance the capacity of the community.
5. Policy Implications
The results indicate that the fuzzy AHP–TOPSIS is a promising methodology to make accurate and reliable predictions of flood hazards. The integrated fuzzy AHP–TOPSIS and GIS are also suggested to assess the flood hazards in areas with a lack of data. These results will benefit engineers, flooding analysts, policymakers, local authorities, and locals providing guidance of flood hazard assessments, which directly helps to define actions to prevent floods in the regions. Flood warning systems, provisional flood defenses, protection of valuable assets, and mobilization of emergency services should be developed to mitigate the impacts of flood hazards. The methodology improves flood hazard assessment in similar coastal regions as well as allows for the establishment of rescue plans which alleviate casualties and loss of assets.
To mitigate floods in the study area, both the national government of Vietnam and the provincial government in Binh Dinh should integrate natural hazard mitigation in socio-economic development policies. The main lines of these policies should entail:
- An institutional framework for integrated regional and local flood management. Improving the management capacity of emergency responses to floods and proactively coping with long-term flood risks of economic sectors allows minimizing flood effects and the damage they cause, develops sustainable production in the industry along the value chain, and strengthens regional integration to flood responses and mitigation by the river basin. Medium- and long-term priorities on flood risks for agriculture and drinking water supply should be identified for each locality in the Kon River basin.
- Strengthen flood forecast and warning capacity. The national government of Vietnam has invested in construction and transfer of material and technical facilities; human resources; forecasts in flood warnings; meteorological and hydro-meteorological observation stations; automatic rain gauges measuring the rainfall; and radar weather stations in Quy Nhon and Pleiku. Establishing flood observation stations at key points and places where monitoring stations are currently lacking to enhance the collection of real-time flood information is necessary. When floods occur, the Provincial Commanding Committee of Natural Disaster Prevention and Control, Search and Rescue directs the provincial radio and television channels and other information channels to implement an emergency response and communication plan, promptly conveying flood and storm forecasts and warning bulletins to localities and households in areas at risk of flooding.
- The irrigation system should allow for the response to flood hazards. The reinforcement, maintenance, and protection of dykes, dams, irrigation works, and canals in rice fields should be strengthened before flooding periods. Small- and medium-sized reservoirs, rivers, and sea dike systems should be built. Irrigation management and exploitation units regularly monitor and inventory water sources, formulate economical irrigation plans, take initiatives on implementing economic irrigation solutions, and have water distribution plans to ensure water supply for essential needs such as daily life, husbandry, and high-value crops.
- Complete regional industrial and sectoral planning. The spatial organization of industry, services, agriculture, forestry, and fisheries of the basin and localities should follow the principles of natural disaster adaptation and mitigation.
- Strengthen the management and protection of critical forests and watershed forests. An efficient solution for flood hazard mitigation for the lower Kon River, generally, and for the studied Phuoc Thang commune, particularly, is to protect and develop forests. Strengthen the supervision on afforestation, ensure the proper implementation of the afforestation plan, develop large timber forests, and increase the value of forest timber. Increase the watershed forests as they are a major factor limiting the amount of water and reduce the flood intensity and flooding levels in the lower Kon River.
Author Contributions
Conceptualization, H.X.N., A.T.N. (An Thinh Nguyen), and L.H.; Data curation, A.T.N. (Anh Tu Ngo); Formal analysis, V.T.P., T.D.N., and T.K.N.; Investigation, V.T.P., T.D.N., and D.T.D.; Methodology, A.T.N. (An Thinh Nguyen), V.T.D., and D.C.D.; Project administration, H.X.N.; Resources, D.T.D.; Software, V.T.P. and T.K.N.; Validation, A.T.N. (An Thinh Nguyen) and A.T.N. (Anh Tu Ngo); Visualization, V.T.P. and A.T.N. (Anh Tuan Nguyen); Writing—original draft, H.X.N., A.T.N. (An Thinh Nguyen), A.T.N. (Anh Tuan Nguyen), and L.H.; Writing—review & editing, H.X.N., A.T.N. (An Thinh Nguyen), and L.H. All authors have read and agreed to the published version of the manuscript.
Funding
This research was funded by the Vietnam national project code TN18/T11.
Acknowledgments
The authors would like to thank village heads and communal authorities who were most collaborative in completing the questionnaire and in providing discussion opportunities.
Conflicts of Interest
The authors declare no conflict of interest.
References
- Nelson, S.A. Natural Disasters, Department of Earth & Environmental Sciences. In Flood Hazards, Prediction & Human Intervention; Tulane University: New Orleans, LA, USA, 2015; pp. 1–10. [Google Scholar]
- De Moel, H.; Aerts, J.C.J.H. Effect of uncertainty in land use, damage models and inundation depth on flood damage estimates. Nat. Hazards 2011, 58, 407–425. [Google Scholar] [CrossRef]
- Liu, J.; Wang, X.; Zhang, B.; Li, J.; Zhang, J.; Liu, X. Storm flood risk zoning in the typical regions of Asia using GIS technology. Nat. Hazards 2017, 87, 1691–1707. [Google Scholar] [CrossRef]
- Birkland, T.A.; Burby, R.J.; Conrad, D.; Cortner, H.; Michener, W.K. River ecology and flood hazard mitigation. Nat. Hazards Rev. 2003, 4, 46–54. [Google Scholar] [CrossRef]
- Alvarado-Aguilar, D.; Jiménez, J.A.; Nicholls, R.J. Flood hazard and damage assessment in the Ebro Delta (NW Mediterranean) to relative sea level rise. Nat. Hazards 2012, 62, 1301–1321. [Google Scholar] [CrossRef]
- Scawthorn, C.; Blais, N.; Seligson, H.; Tate, E.; Mifflin, E.; Thomas, W.; Murphy, J.; Jones, C. HAZUS-MH flood loss estimation methodology. I: Overview and flood hazard characterization. Nat. Hazards Rev. 2006, 7, 60–71. [Google Scholar] [CrossRef]
- Tingsanchali, T.; Karim, M.F. Flood hazard and risk analysis in the southwest region of Bangladesh. Hydrol. Process. 2005, 19, 2055–2069. [Google Scholar] [CrossRef]
- Islam, M.M.; Sado, K. Flood hazard assessment in Bangladesh using NOAA AVHRR data with geographical information system. Hydrol. Process. 2000, 14, 605–620. [Google Scholar] [CrossRef]
- De Bruijn, K.M.; Klijn, F.; Pas, B.; Slager, C.T.J. Flood fatality hazard and flood damage hazard: Combining multiple hazard characteristics into meaningful maps for spatial planning. Nat. Hazards Earth Syst. Sci. 2015, 15, 1297–1309. [Google Scholar] [CrossRef]
- Vanolya, N.M.; Jelokhani-Niaraki, M. The use of subjective–objective weights in GIS-based multi-criteria decision analysis for flood hazard assessment: A case study in Mazandaran, Iran. GeoJournal 2019. [Google Scholar] [CrossRef]
- Qi, H.; Qi, P.; Altinakar, M.S. GIS-based spatial Monte Carlo analysis for integrated flood management with two dimensional flood simulation. Water Resour. Manag. 2013, 27, 3631–3645. [Google Scholar] [CrossRef]
- Feng, B.; Wang, J.; Zhang, Y.; Hall, B.; Zeng, C. Urban flood hazard mapping using a hydraulic-GIS combined model. Nat. Hazards 2020, 100, 1089–1104. [Google Scholar] [CrossRef]
- Zope, P.E.; Eldho, T.I.; Jothiprakash, V. Hydrological impacts of land use–land cover change and detention basins on urban flood hazard: A case study of Poisar River basin, Mumbai, India. Nat. Hazards 2017, 87, 1267–1283. [Google Scholar] [CrossRef]
- Zerger, A.; Wealands, S. Beyond Modelling: Linking models with GIS for flood risk management. Nat. Hazards 2004, 33, 191–208. [Google Scholar] [CrossRef]
- Stefanidis, S.; Stathis, D. Assessment of flood hazard based on natural and anthropogenic factors using analytic hierarchy process (AHP). Nat. Hazards 2013, 68, 569–585. [Google Scholar] [CrossRef]
- Chakraborty, S.; Mukhopadhyay, S. Assessing flood risk using analytical hierarchy process (AHP) and geographical information system (GIS): Application in Coochbehar district of West Bengal, India. Nat. Hazards 2019, 99, 247–274. [Google Scholar] [CrossRef]
- Das, S. Geographic Information System and AHP-based flood hazard zonation of Vaitarna basin, Maharashtra, India. Arab. J. Geosci. 2018, 11, 576. [Google Scholar] [CrossRef]
- Luu, C.; Von Meding, J.; Kanjanabootra, S. Assessing flood hazard using flood marks and analytic hierarchy process approach: A case study for the 2013 flood event in Quang Nam, Vietnam. Nat. Hazards 2018, 90, 1031–1050. [Google Scholar] [CrossRef]
- Chen, Y.R.; Yeh, C.H.; Yu, B. Integrated application of the analytic hierarchy process and the geographic information system for flood risk assessment and flood plain management in Taiwan. Nat. Hazards 2011, 59, 1261–1276. [Google Scholar] [CrossRef]
- Zou, Q.; Zhou, J.; Zhou, C.; Song, L.; Guo, J. Comprehensive flood risk assessment based on set pair analysis-variable fuzzy sets model and fuzzy AHP. Stoch. Environ. Res. Risk Assess. 2013, 27, 525–546. [Google Scholar] [CrossRef]
- Kim, T.H.; Kim, B.; Han, K.Y. Application of fuzzy TOPSIS to flood hazard mapping for levee failure. Water 2019, 11, 592. [Google Scholar] [CrossRef]
- Jozi, S.A.; Shafiee, M.; MoradiMajd, N.; Saffarian, S. An integrated Shannon’s Entropy-TOPSIS methodology for environmental risk assessment of Helleh protected area in Iran. Environ. Monit. Assess. 2012, 184, 6913–6922. [Google Scholar] [CrossRef] [PubMed]
- Lee, G.; Jun, K.S.; Chung, E.S. Integrated multi-criteria flood vulnerability approach using fuzzy TOPSIS and Delphi technique. Nat. Hazards Earth Syst. Sci. 2013, 13, 1293. [Google Scholar] [CrossRef]
- Torfi, F.; Farahani, R.Z.; Rezapour, S. Fuzzy AHP to determine the relative weights of evaluation criteria and Fuzzy TOPSIS to rank the alternatives. Appl. Soft Comput. 2010, 10, 520–528. [Google Scholar] [CrossRef]
- DiGregorio, M. Learning from Typhoon Mirinae: Urbanization and climate change in Quy Nhon City, Vietnam; Institute for Social and Environmental Transition-Vietnam: Hanoi, Vietnam, 2013. [Google Scholar]
- BDMH (Binh Dinh Meteorological and Hydrological Stations). Final report on meteorology and hydrology in Binh Dinh in 2016. Off. Rep. Binh DinhVietnam 2017, 1–38. (In Vietnamese) [Google Scholar]
- BDMH (Binh Dinh Meteorological and Hydrological Stations). Quick report on storms and floods in 2019. Off. Rep. Binh DinhVietnam 2020, 1–9. (In Vietnamese) [Google Scholar]
- Ho, L.T.K.; Umitsu, M.; Yamaguchi, Y. Flood hazard mapping by satellite images and SRTM DEM in the Vu Gia–Thu Bon alluvial plain, Central Vietnam. Int. Arch. Photogramm. Remote Sens. Spat. Inf. Sci. 2010, 38, 275–280. [Google Scholar]
- Kalantari, Z.; Nickman, A.; Lyon, S.W.; Olofsson, B.; Folkeson, L. A method for mapping flood hazard along roads. Environ. Manag. 2014, 133, 69–77. [Google Scholar] [CrossRef]
- Nerantzis, K.; Kougias, I.; Patsialis, T. Assessment of flood hazard areas at a regional scale using an index-based approach and Analytical Hierarchy Process: Application in Rhodope–Evros region, Greece. Sci. Total Environ. 2015, 538, 555–563. [Google Scholar]
- Tuy Phuoc GSO. Socio-economic statistics for Tuy Phuoc district, Binh Dinh province in 2019. Off. Rep. Binh DinhVietnam 2019, 1–25. (In Vietnamese) [Google Scholar]
- BBNDPCSR (Binh Dinh Provincial Commanding Committee of Natural Disaster Prevention and Control, Search and Rescue). Quick Report No. 403 in 19/12/2016. Off. Rep. Binh DinhVietnam 2017, 1–7. (In Vietnamese) [Google Scholar]
- Zadeh, L.A. The concept of a linguistic variable and its application to approximate reasoning-II. Inf. Sci. 1975, 8, 301–357. [Google Scholar] [CrossRef]
- Rao, R.V. Decision Making in the Manufacturing Environment: Using Graph Theory and Fuzzy Multiple Attribute Decision Making Methods; Springer Series in Advanced Manufacturing; Springer: London, UK, 2007; Volume 2, p. 294. [Google Scholar]
- Saaty, T.L. Decision making with the Analytic Hierarchy Process. Serv. Sci. 2008, 1, 83–98. [Google Scholar] [CrossRef]
- Nyimbili, P.H.; Erden, T.; Karaman, H. Integration of GIS, AHP and TOPSIS for earthquake hazard analysis. Nat. Hazards 2018, 92, 1523–1546. [Google Scholar] [CrossRef]
- Rokhsari1, S.; Sadeghi-Niaraki, A. Urban network risk assessment based on data fusion concept using Fuzzy-AHP, TOPSIS and VIKOR in GIS Environment. Iran. J. Oper. Res. 2015, 73–86. [Google Scholar]
- Yang, X.L.; Ding, J.H.; Hou, H. Application of a triangular fuzzy AHP approach for flood risk evaluation and response measures analysis. Nat. Hazards 2013, 68, 657–674. [Google Scholar] [CrossRef]
- Xiao, Y.; Yi, S.; Tang, Z. Integrated flood hazard assessment based on spatial ordered weighted averaging method considering spatial heterogeneity of risk preference. Sci. Total Environ. 2017, 599, 1034–1046. [Google Scholar] [CrossRef]
- Rahmati, O.; Zeinivand, H.; Besharat, M. Flood hazard zoning in Yasooj region, Iran, using GIS and multi-criteria decision analysis. Geomat. Nat. Hazards Risk 2016, 7, 1000–1017. [Google Scholar] [CrossRef]
Publisher’s Note: MDPI stays neutral with regard to jurisdictional claims in published maps and institutional affiliations. |
© 2020 by the authors. Licensee MDPI, Basel, Switzerland. This article is an open access article distributed under the terms and conditions of the Creative Commons Attribution (CC BY) license (http://creativecommons.org/licenses/by/4.0/).