Article

OCT Analysis in Patients with Relapsing-Remitting Multiple Sclerosis during Fingolimod Therapy: 2-Year Longitudinal Retrospective Study

1
Clinic, Multidisciplinary Department of Medical, Surgical and Dental Sciences, University of Campania L. Vanvitelli, 80131 Naples, Italy
2
Department of Advanced Medical and Surgical Sciences, University of Campania, 80131 Naples, Italy
*
Author to whom correspondence should be addressed.
Share first authorship.
Appl. Sci. 2020, 10(20), 7085; https://doi.org/10.3390/app10207085
Submission received: 20 August 2020 / Revised: 7 October 2020 / Accepted: 8 October 2020 / Published: 12 October 2020
(This article belongs to the Special Issue Optical Coherence Tomography: From OCT-A to All Latest Advances)

Abstract

:
Many studies have demonstrated the usefulness of some optical coherence tomography (OCT) parameters, like total macular volume (TMV) and retinal nerve fiber layer thickness (RNFL-T), for monitoring patients with multiple sclerosis (MS). However, there are no real-world, long-term studies on patients with relapsing-remitting MS (RR-MS) treated with fingolimod. Therefore, the purpose of this study was to describe retinal changes associated with fingolimod therapy during a two-year follow-up while considering previous episodes of optic neuritis (ON). Patients diagnosed with RR-MS and treated with fingolimod (46 in total) underwent a two-year follow-up. Based on previous ON history, we identified 16 ON+ and 30 ON− patients. The ophthalmological evaluations, including visual field (VF) examination and OCT, were performed at a baseline at 3–6, 12 and 24 months to evaluate the progression rate for each parameter. When analyzing the whole sample, OCT showed no cases of macular edema. Instead, we observed a significant reduction rate in the central retinal thickness (CRT) (p < 0.001), TMV (p < 0.001) and RNFL (p < 0.05). Moreover, we observed a significant difference in the progression rate between ON+ and ON− patients, relative to the VF and RNFL (p < 0.05) examinations. OCT highlighted a significant progression rate of retinal damage in MS patients despite fingolimod therapy, especially in MS ON+ patients.

1. Introduction

Multiple sclerosis (MS) is a chronic inflammatory, demyelinating and degenerative disease of the central nervous system which mostly affects females, with an age of onset between 20 and 45 years. MS shows an extremely variable clinical and temporal evolution [1,2]. The visual disturbances that MS patients frequently experience include visual acuity (VA) reduction, altered contrast sensitivity, visual field (VF) abnormalities, dyschromatopsia and diplopia. A frequent acute neuro-ophthalmological manifestation of the disease is represented by the optic neuritis (ON) that occurs in ~20% of MS patients as a first clinical manifestation and in more than 60% of cases during the course of the disease [3,4,5,6].
The etiology of MS is still largely unknown; however, a key pathogenic aspect is represented by the peripheral activation and proliferation of autoimmune myelin-targeted lymphocytes [7,8].
Currently, many disease-modifying therapies have been approved for the treatment of MS [9,10]. Among them, fingolimod, the first oral drug, was approved in 2010 after showing positive results in two phase III randomized clinical trials conducted on relapsing-remitting MS (RR-MS) patients [11,12]. Fingolimod is a pro-drug that, after phosphorylation, acts as a modulator of the sphingosine1-phosphate receptor by reducing the exit of lymphocytes from lymphoid tissues and consequent self-aggression into the central nervous system [13,14].
A rare ocular side effect related to fingolimod is macular edema (ME), which is detectable through optical coherence tomography (OCT) with an incidence of 0.3–1.2% [15,16,17,18].
OCT is a non-invasive imaging technique that uses low-coherence light to acquire micrometer-resolution, two-dimensional and three-dimensional images of ocular structures. OCT has now become indispensable in clinical practice, being particularly useful in monitoring both the progress of MS and therapy, allowing for the early identification of anatomical alterations, clearly visible after the introduction of the high-resolution spectral domain (SD) technique, and even more visible if OCT is combined with other retinal imaging techniques [19,20,21,22].
To date, many clinical studies have demonstrated the usefulness of assessing, by OCT, the retinal nerve fiber layer thickness (RNFL-T) and the total macular volume (TMV) in patients with MS, considering the reduction of these parameters as biomarkers of disease progression [18,23,24,25,26,27]. Instead, in RR-MS patients treated with fingolimod, there are no long-term studies that analyze macular and RNFL changes and assess the effect of these retinal changes on VA, low-contrast letter acuity (LCLA) and VF. Therefore, the purpose of this work was to describe the long-term anatomical and functional retinal changes observed in RR-MS patients which started on fingolimod and were followed for two years, also taking into account the effect of previous ON.

2. Methods

Consecutive RR-MS patients, which started fingolimod at 0.5 mg/day, underwent a two-year follow up, including neurological and ophthalmological assessments at the MS Center of the I Division of Neurology and the eye clinic of the University of Campania Luigi Vanvitelli. The study adhered to the tenets of the Declaration of Helsinki.
Patients had to have a diagnosis of RR-MS [28] and no relapses or steroid treatment within the month prior to baseline and follow-up assessments. Clinical disability was evaluated with the expanded disability status scale (EDSS) [29].
Systemic exclusion criteria were taking steroids during the follow-up and diabetes for possible retinal complications. Ophthalmological exclusion criteria were cataracts and any ocular opacities that interfere with VA, glaucoma, ocular hypertension, age-related macular degeneration, diabetic retinopathy, uveitis, high myopia with macular complications, vitreoretinal interface disorders, retinal vascular occlusions, hereditary retinopathies, ocular interventions within the last 6 months and any previous episodes of inflammation or damage of the optic nerve due to diseases other than MS.
In order to prevent bias, particularly of the patients’ attrition, patients were not excluded because of missing time points, and the missing data were addressed as described below. We included all the patients with a baseline assessment from September 2013 to March 2018. No formal sample size computation was performed.
The entire cohort was also divided on the basis of the previous history of ON, and we identified 16 patients with ON histories (ON+) and 30 patients without ON histories (ON−). Among the NO+ patients, those with episodes of ON, occurring both in the 6 months prior to enrollment and during the study, were excluded.

3. Eye Examination

The ophthalmological examination included the following tests: best-corrected VA (BCVA), LCLA, slit-lamp biomicroscopy, Goldmann tonometry, VF and SD-OCT. In both groups, all ophthalmological tests were performed at baseline, 3–6 months, 12 months and 24 months.
BCVA was measured according to the Early Treatment Diabetic Retinopathy Study (ETDRS) chart at 2 m, which was converted to a logarithm of the minimum angle of resolution (logMar) for statistical analysis [30].
LCLA was investigated using low-contrast Sloan letter chart (Precision Vision). The contrast levels used in this paper were 5%, 2.5% and 1.25% like in previous MS trials [31,32].
The VF examination was performed with a computerized, automatic static perimeter with the Humphrey Field Analyzer (HFAII; Swedish Interactive Thresholding Algorithm (SITA) standard; Carl Zeiss Meditec Inc., Dublin, CA, USA). The Full Threshold strategy that examines a 30° field of view on 76 points (test SITA standard 30–2) was used [33,34].
The central retinal thickness (CRT), TMV, peripapillary RNFL-T (pRNFL-T), neuroretinal rim thickness (NRR-T) and RNFL 4 quadrants thickness were evaluated by SD-OCT (Cirrus HD-OCT 4000; Carl Zeiss Meditec, Inc, Dublin, Ireland, CA). This commercial SD-OCT uses a superluminescent diode with a wavelength of 840 nm as an optical source. It has a scanning speed of 27,000 A-scans per second, an A-scan depth of 2.0 mm (in the tissue), an axial resolution of 5 μm and a transverse resolution of 15 μm (in the tissue). Macular scans were obtained with the macular cube 512 × 128 mode. For the optic nerve analysis, we instead used the optic disc cube 200 × 200 mode. The value of each parameter was automatically calculated by the SD-OCT machine and automatically compared to reference values from an age- and sex-matched population included in the software.

4. Statistical Analysis
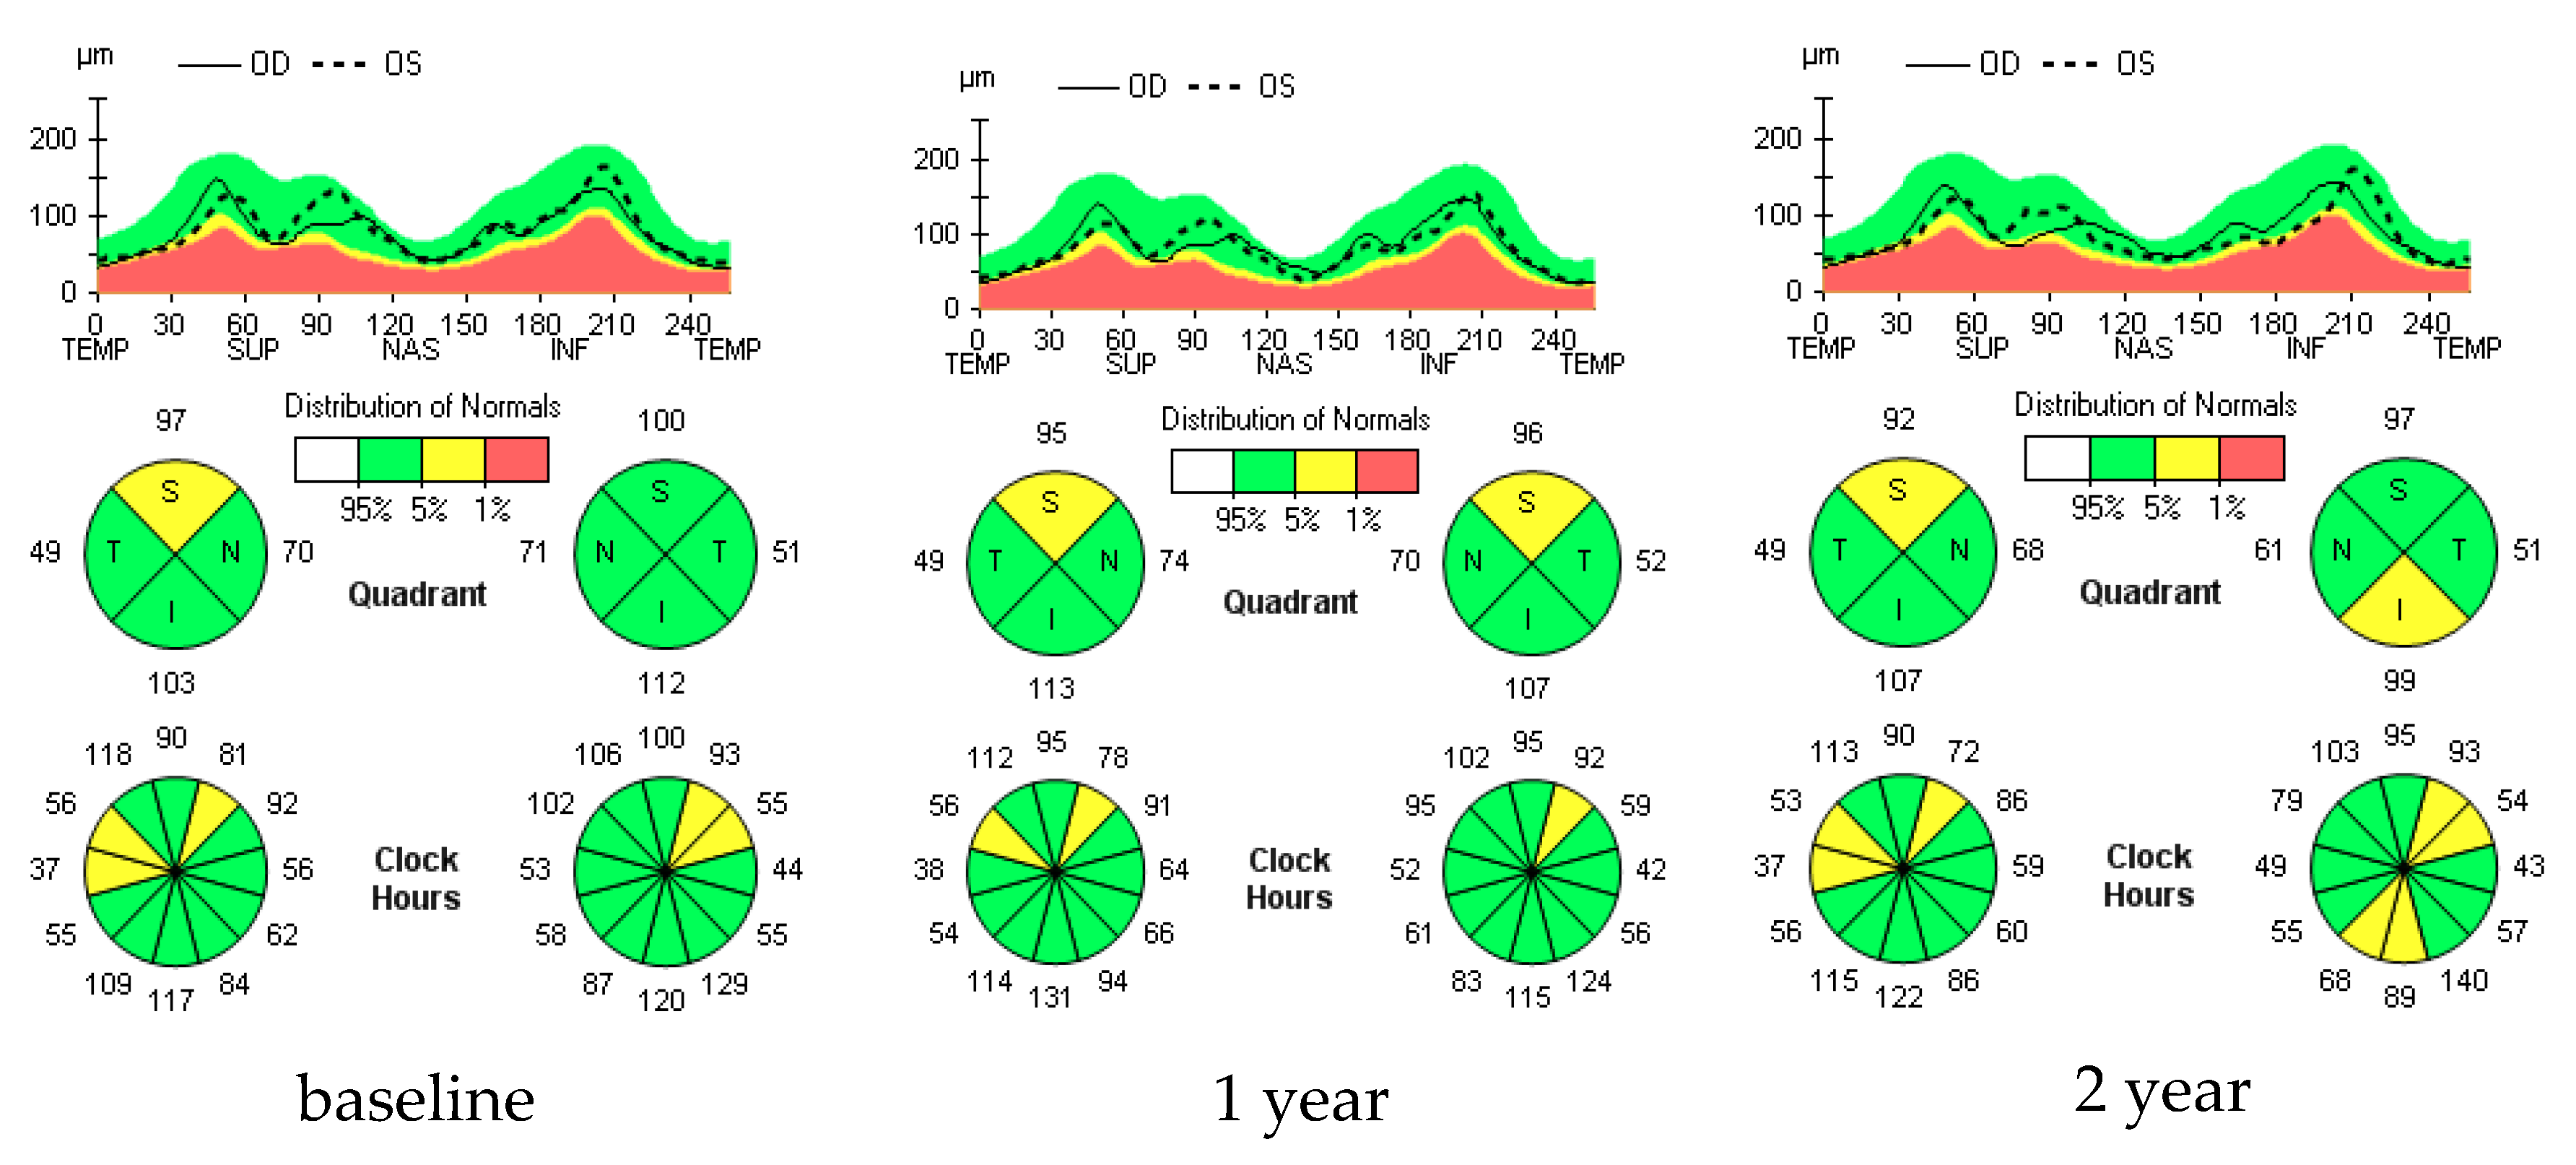
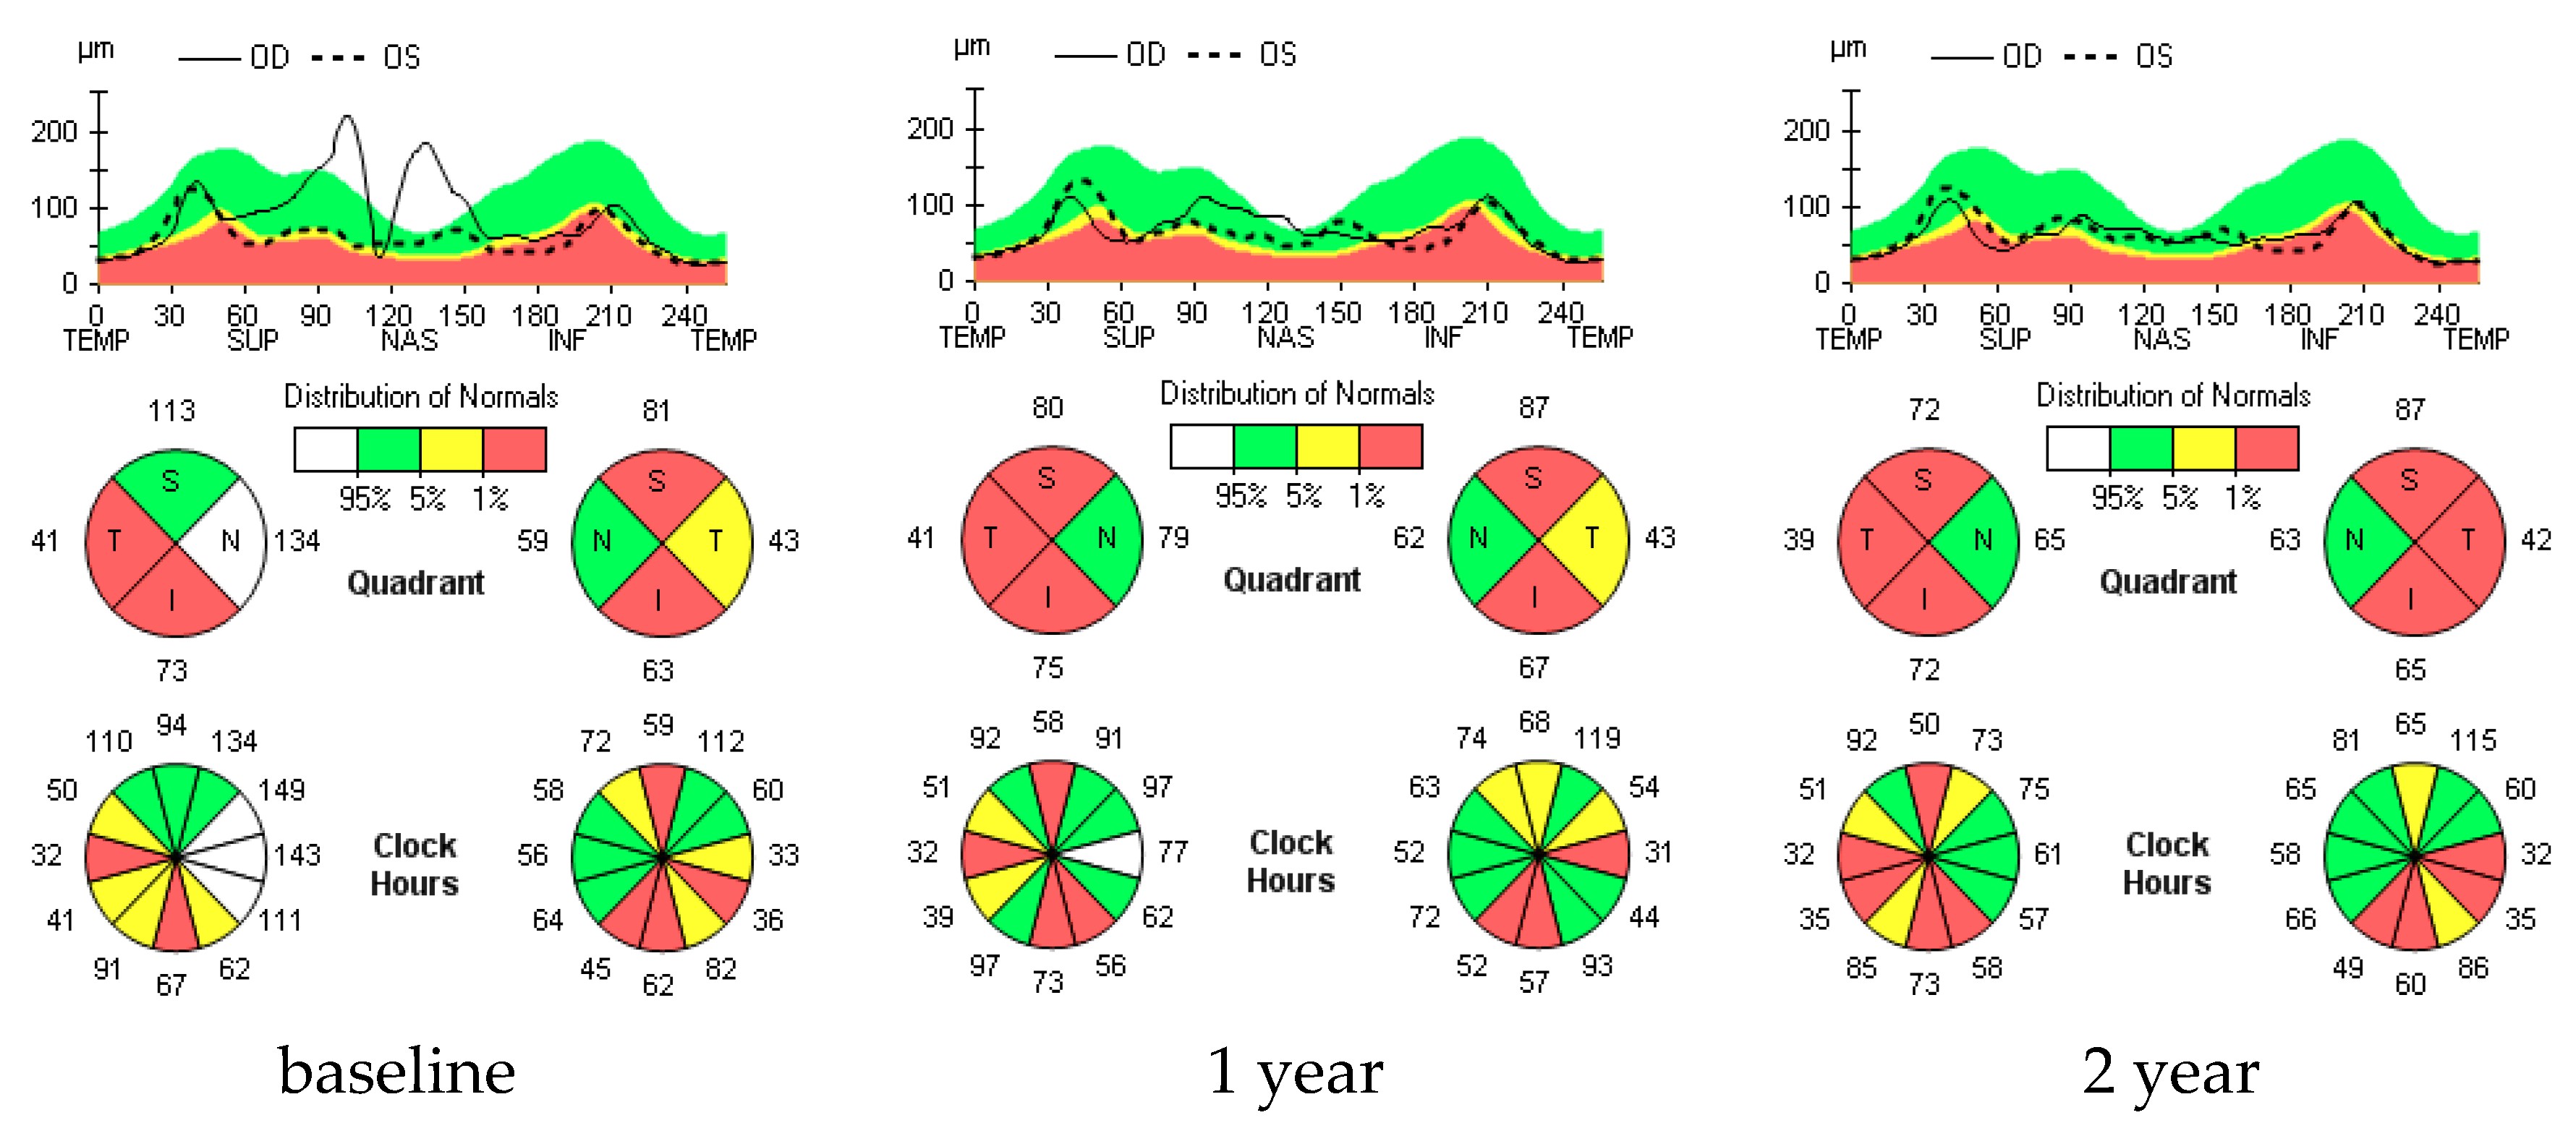
Continuous variables are reported as mean ± standard error of the mean and categorical variables are reported as count (frequency). Repeated-measure regression, estimated by a generalized estimating equations (GEE), was fitted on the longitudinal data to estimate the mean rate of change per year of follow-up for each of the parameters, both in the whole cohort and in the two ON+ and ON− subgroups, comparing them. GEE were adopted since this method can deal with inter-eye correlation, correlation between repeated measurement over the follow-up and missing data of some visits (i.e., 24-month visit were not performed for 10 patients).
p Values < 0.05 were considered statistically significant. Statistical analysis was performed by IBM SPSS Statistics Version 21.0.0.0.

5. Results

Forty-six patients (27 females, 19 males, mean age of 36.9 ± 1.8 years, range 22–69) with average disease durations of 7.2 ± 0.9 years were included in this study.
The baseline ophthalmological characteristics of the whole sample are reported in Table 1, while baseline OCT parameters are summarized in Table 2.
Longitudinal analysis did not show statistically significant progression of the EDSS (average annual rate: −0.14 ± 0.1; p = 0.157). No patients progressed from RR-MS to secondary progressive MS or had relapses, including ON, during the follow-up.
VA parameters did not show significant progression during the follow-up. In fact, the BCVA (expressed in logMar) showed an annual rate of −0.02 ± 0.01, which indicates an improvement in 1 ETDRS letter, which is not clinically significant. The 5% LCLA did not have a significant average annual progression rate (+2.33 ± 1.23 letters). However, the 2.5% LCLA and 1.25% LCLA showed slight improvements, though not clinically significant, with an average annual rate of +3.48 ± 0.45 letters and +0.52 ± 1 letters, respectively.
In the entire cohort, for the visual field–mean deviation (VF–MD), the progression rate per year was −0.14 ± 0.17 dB, which was not statistically significant (p = 0.433).
The OCT assessment did not show cases of ME related to fingolimod therapy. However, by analyzing the macular parameters in the whole cohort, we observed a statistically significant reduction in CRT, with an average annual rate of −1.81 ± 0.41 µm (p < 0.001), and in TMV, with an average annual rate of −0.1 ± 0.01 mm3 (p < 0.001). Furthermore, there was a statistically significant reduction in pRNFL-T, with an average rate of −3.3 ± 0.51 µm/year (p < 0.001). Finally, the average RNFL 4 quadrants thickness in each sector also significantly decreased (p < 0.05) over the follow-up, compared to the baseline. The average annual progression rates of the selected OCT parameters are summarized in Table 3.
Moreover, we analyzed the annual progression rates in the two subgroups, and we observed that the ON+ patients showed, for most OCT parameters, a statistically faster progression rate during the follow-up, compared with ON− patients (p < 0.05) (Figure 1 and Figure 2) (Table 4).
In particular, we found more evident differences in relation to the pRNFL-T, which decreased at a mean rate of −3.5 ± 0.55 µm/year in ON+ patients (p = 0.001), while in ON− patients the change was not statistically significant, being −0.54 ± 1.39 µm/year (p = 0.696). Similarly, as summarized in Table 4, we observed a significant reduction in RNFL-T in the superior and inferior quadrants of approximately 3 µm/year in ON+ patients (p < 0.001), while the changes during the follow-up were not statistically significant in ON− patients (p = 0.339; p = 0.431, respectively). Finally, the ON+ patients showed statistically significant progression in the average annual rate of the NRR-T of −36.59 ± 2.74 µm (p < 0.001), compared with the ON− patients, who instead showed a reduction rate that was not statistically significant of −3.26 ± 8.44 µm/year (p = 0.699) (Table 4).
Regarding the EDSS and visual parameters, we did not find significant differences between the two subgroups. Instead, relative to the VF–MD, ON+ patients showed a significant reduction of −0.58 ± 0.24 dB/year, whereas the ON− patients showed a significant increase of +0.35 ± 0.08 dB/year, and the difference between the two groups was statistically significant (p < 0.001).

6. Discussion

In this two-year longitudinal retrospective study, we assessed the changes of retinal morphology through a multimodal approach, including OCT, BCVA, LCLA and VF, in 46 RR-MS patients treated with fingolimod. Fingolimod phase two and three randomized clinical trials reported dose-dependent and time-dependent risks (with higher risk within the first 3–4 months) of the development of ME, ranging from 0.3% to 1.2% [11,12]. Fingolimod-associated ME has also been observed to be more frequent in the case of coexistence with systemic pathologies such as diabetes or inflammatory ocular pathologies (e.g., uveitis) [35].
The present study has a longer follow-up compared to previous reported real-world studies, but similar to the latter, it reports no cases of ME [16,36].
Regarding the BCVA in the whole sample, in accordance with previous studies [15,36], we observed a stability and an improvement rate that was not clinically significant, being less than 10 ETDRS letters (2 lines) on average, which is considered the cutoff for this test.
According to previous studies, we observed a stability and a non-clinical improvement in the entire cohort, relative to the LCLA and VF–MD.
In our study, the OCT assessment was not only focused on ME screening, but also on the variation of both macular (CRT and TMV) and optic nerve fiber parameters (pRNFL-T, NRR-T and RNFL-T 4 quadrants), analyzing their progression rates during the 2-year follow-up. Finally, we also assessed the differences in annual progression rates between ON+ and ON− patients.
The TMV and CRT have also been analyzed in some previous real-life studies conducted on patients with RR-MS and on therapy with fingolimod. In one of these papers, with a study conducted on 23 patients, Fruschelli et al. did not identify statistically significant changes in terms of TMV or CRT, both during the study and at the end of the 12-month follow-up, regardless of the presence of previous ON [32]. In our study, considering the whole sample, we recorded a statistically significant reduction rate of both the CRT and TMV during the follow-up. By comparing the progression rate between the two subgroups considered, we did not detect significant differences in relation to the CRT and the TMV during the 2-year follow-up. However, we observed an average thinning rate of the CRT and the TMV, which was more accentuated in ON+ patients than in ON− patients. This assumes that, although in therapy, these patients are subject to a more rapid deterioration of macular cell populations.
Furthermore, regarding optic disk parameters, there is only one short-term study (with a 5-month follow-up) conducted in RR-MS patients treated with fingolimod that showed a stability of RNFL parameters during the follow-up [15]. Contrariwise, when analyzing our longer follow-up data, we observed a statistically significant reduction rate of all RNFL parameters. Moreover, our data demonstrate an annual thinning rate of the pRNFL that was more pronounced in ON+ patients. The greatest difference was relative to the NRR-T. This difference was probably determined by the existence of a possible phenotype related more closely to eye damage, which was already evident before the start of therapy.
Furthermore, when comparing our data on the RNFL annual progression rate with other studies on patients with RR-MS and undergoing therapy other than fingolimod, there are not many studies. Among these, one of the most significant, in terms of the number of patients and duration of the follow-up, highlighted a higher rate of RNFL thinning in ON+ patients, as reported in our results. However, unlike our data, ON− patients presented statistically significant annual change rates [36].
Therefore, for the first time in the literature, in a cohort of RR-MS patients treated with fingolimod, we observed that the previous history of ON was associated with a faster progression of RNFL parameters, suggesting a greater risk of axonal loss.
However, more studies are needed, as this study has some limitations like a relatively small sample size and the lack of an age-matched group of normal-sighted subjects to compare the progression of the parameters.

7. Conclusions

This long-term study, unlike previous real-life studies, showed significant progression rates of retinal and optic disc damage, detectable through OCT, in MS patients treated with fingolimod during a two-year follow-up. These retinal changes were more pronounced in MS ON+ patients, probably due to the existence of a more severe disease pattern characterized by previous episodes of ON and, consequently, greater ocular involvement.
Finally, this study underlined the usefulness of OCT in monitoring MS patients, especially ON+ patients, allowing for early detection of retinal damage.

Author Contributions

Conceptualization: S.R., C.G., A.G., P.M., G.T. and F.S.; data curation: F.M., R.C. and A.d.; formal analysis: P.M.; investigation: S.R., C.G., A.G., F.M., R.C. and A.d.; project administration: S.R., A.G., G.T. and F.S.; supervision: S.R., C.G., A.G., P.M. and F.S.; writing—original draft: C.G., A.G., F.M., R.C. and A.d. All authors have read and agreed to the published version of the manuscript.

Funding

No funding supported our study.

Conflicts of Interest

The authors declare that they have no conflict of interest.

References

  1. Faguy, K. Multiple Sclerosis: An Update. Radiol. Technol. 2016, 87, 529–550. [Google Scholar] [PubMed]
  2. Lemus, H.N.; Warrington, A.E.; Rodriguez, M. Multiple Sclerosis: Mechanisms of Disease and Strategies for Myelin and Axonal Repair. Neurol. Clin. 2018, 36, 1–11. [Google Scholar] [CrossRef] [PubMed]
  3. Graves, J.; Balcer, L.J. Eye disorders in patients with multiple sclerosis: Natural history and management. Clin. Ophthalmol. 2010, 4, 1409–1422. [Google Scholar] [PubMed] [Green Version]
  4. Balcer, L.J.; Frohman, E.M. Evaluating loss of visual function in multiple sclerosis as measured by low-contrast letter acuity. Neurology 2010, 74 (Suppl. 3), S16–S23. [Google Scholar] [CrossRef]
  5. Villoslada, P.; Cuneo, A.; Gelfand, J.; Hauser, S.L.; Green, A. Color vision is strongly associated with retinal thinning in multiple sclerosis. Mult. Scler. J. 2012, 18, 991–999. [Google Scholar] [CrossRef]
  6. Nakajima, H.; Hosokawa, T.; Sugino, M.; Kimura, F.; Sugasawa, J.; Hanafusa, T.; Toshiyuki, T. Visual field defects of optic neuritis in neuromyelitis optica compared with multiple sclerosis. BMC Neurol. 2010, 10, 45. [Google Scholar] [CrossRef] [Green Version]
  7. Gharibi, T.; Babaloo, Z.; Hosseini, A.; Marofi, F.; Ebrahimi-Kalan, A.; Jahandideh, S.; Baradaran, B. The Role of B Cells in the Immunopathogenesis of Multiple Sclerosis. Immunology 2020. [Google Scholar] [CrossRef]
  8. Almuslehi, M.S.M.; Sen, M.K.; Shortland, P.J.; Mahns, D.A.; Coorssen, J.R. CD8 T-cell Recruitment Into the Central Nervous System of Cuprizone-Fed Mice: Relevance to Modeling the Etiology of Multiple Sclerosis. Front Cell Neurosci. 2020, 14, 43. [Google Scholar] [CrossRef]
  9. Sorensen, P.S.; Fox, R.J.; Comi, G. The window of opportunity for treatment of progressive multiple sclerosis. Curr. Opin. Neurol. 2020. [Google Scholar] [CrossRef]
  10. Hart, F.M.; Bainbridge, J. Current and emerging treatment of multiple sclerosis. Am. J. Manag. Care 2016, 22 (Suppl. 6), s159–s170. [Google Scholar]
  11. Kappos, L.; Radue, E.W.; O’Connor, P.; Polman, C.; Hohlfeld, R.; Calabresi, P.; Selmaj, K.; Agoropoulou, C.; Leyk, M.; ZhangAuberson, L.; et al. A placebo-controlled trial of oral fingolimod in relapsing multiple sclerosis. N. Engl. J. Med. 2010, 362, 387–401. [Google Scholar] [CrossRef] [PubMed] [Green Version]
  12. Cohen, J.A.; Barkhof, F.; Comi, G.; Hartung, H.P.; Khatri, B.O.; Montalban, X.; Pelletier, J.; Capra, R.; Gallo, P.; Izquierdo, G.; et al. Oral fingolimod or intramuscular interferon for relapsing multiple sclerosis. N. Engl. J. Med. 2010, 362, 402–415. [Google Scholar] [CrossRef] [PubMed]
  13. Urbano, M.; Guerrero, M.; Rosen, H.; Roberts, E. Modulators of the spingosine 1-phosphate receptor 1. Bioorg. Med. Chem. Lett. 2013, 23, 6377–6389. [Google Scholar] [CrossRef] [PubMed] [Green Version]
  14. Cohan, S.; Lucassen, E.; Smoot, K.; Brink, J.; Chen, C. Sphingosine-1-Phosphate: Its Pharmacological Regulation and the Treatment of Multiple Sclerosis: A Review Article. Biomedicines 2020, 8, 227. [Google Scholar] [CrossRef]
  15. Nolan, R.; Gelfand, J.M.; Green, A.J. Fingolimod treatment in multiple sclerosis leads to increased macular volume. Neurology 2013, 80, 139–144. [Google Scholar] [CrossRef] [PubMed] [Green Version]
  16. Nørgaard, T.L.; Andersen, C.U.; Hilt, C.; Andersen, C.U. Macular oedema and changes in macular thickness in multiple sclerosis patients treated with fingolimod. Basic Clin. Pharmacol. Toxicol. 2019. [Google Scholar] [CrossRef]
  17. Dinkin, M.; Paul, F. Higher macular volume in patients with MS receiving fingolimod. Positive outcome or side effect? Neurology 2013, 80, 128–129. [Google Scholar] [CrossRef]
  18. Martinez-Lapiscina, E.H.; Arnow, S.; Wilson, J.A.; Saidha, S.; Preiningerova, J.L.; Oberwahrenbrock, T.; Brandt, A.U.; Pablo, L.E.; Guerrieri, S.; Gonzalez, I.; et al. IMSVISUAL consortium. l. Retinal thickness measured with optical coherence tomography and risk of disability worsening in multiple sclerosis: A cohort study. Lancet Neurol. 2016, 15, 574–584. [Google Scholar] [CrossRef] [Green Version]
  19. Huang, D.; Swanson, E.A.; Lin, C.P.; Schuman, J.S.; Stinson, W.G.; Chang, W.; Hee, M.R.; Flotte, T.; Gregory, K.; Puliafito, C.A.; et al. Optical coherence tomography. Science 1991, 254, 1178–1181. [Google Scholar] [CrossRef] [Green Version]
  20. Drexler, M.L.; Kumar, A.; Kamali, T.; Unterhuber, A.; Leitgeb, R.A. Optical coherence tomography today: Speed, contrast, and multimodality. J. Biomed. Opt. 2014, 19, 071412. [Google Scholar] [CrossRef]
  21. Podoleanu, A.G.; Rosen, R.B. Combinations of techniques in imaging the retina with high resolution. Prog. Retin. Eye Res. 2008, 27, 464–499. [Google Scholar] [CrossRef]
  22. Cogliati, A.; Canavesi, C.; Hayes, A.; Tankam, P.; Duma, V.F.; Santhanam, A.; Thompson, K.P.; Rolland, J.P. MEMS-based handheld scanning probe with pre-shaped input signals for distortion-free images in Gabor-Domain Optical Coherence Microscopy. Opt. Express 2016, 24, 13365–13374. [Google Scholar] [CrossRef] [PubMed]
  23. Petzold, A.; Balcer, L.J.; Calabresi, P.A.; Costello, F.; Frohman, T.C.; Frohman, E.M.; Martinez-Lapiscina, E.H.; Green, A.J.; Kardon, R.; Outteryck, O.; et al. ERN-EYE IMSVISUAL. Retinal layer segmentation in multiple sclerosis: A systematic review and meta-analysis. Lancet Neurol. 2017, 16, 797–812. [Google Scholar] [CrossRef]
  24. Britze, J.; Pihl-Jensen, G.; Frederiksen, J.L. Retinal ganglion cell analysis in multiple sclerosis and optic neuritis: A systematic review and meta-analysis. J. Neurol. 2017, 264, 1837–1853. [Google Scholar] [CrossRef] [PubMed]
  25. Cennamo, G.; Romano, M.R.; Vecchio, E.C.; Minervino, C.; Della Guardia, C.; Velotti, N.; Carotenuto, A.; Montella, S.; Orefice, G.; Cennamo, G. Anatomical and functional retinal changes in multiple sclerosis. Eye 2016, 30, 456–462. [Google Scholar] [CrossRef] [Green Version]
  26. Alonso, R.; Gonzalez-Moron, D.; Garcea, O. Optical coherence tomography as a biomarker of neurodegeneration in multiple sclerosis: A review. Mult. Scler. Relat. Disord. 2018, 22, 77–82. [Google Scholar] [CrossRef]
  27. Eslami, F.; Ghiasian, M.; Khanlarzade, E.; Moradi, E. Retinal Nerve Fiber Layer Thickness and Total Macular Volume in Multiple Sclerosis Subtypes and Their Relationship with Severity of Disease, a Cross-Sectional Study. Eye Brain 2020, 12, 15–23. [Google Scholar] [CrossRef]
  28. Polman, C.H.; Reingold, S.C.; Banwell, B.; Clanet, M.; Cohen, J.A.; Filippi, M.; Fujihara, K.; Havrdova, E.; Hutchinson, M.; Kappos, L.; et al. Diagnostic criteria for multiple sclerosis: 2010 revisions to the McDonald criteria. Ann. Neurol. 2011, 69, 292–302. [Google Scholar] [CrossRef] [Green Version]
  29. Kurtzke, J.F. Rating neurologic impairment in multiple sclerosis: An expanded disability scale (EDSS). Neurology 1983, 33, 1444–1452. [Google Scholar] [CrossRef] [Green Version]
  30. Kaiser, P.K. Prospective evaluation of visual acuity assessment: A comparison of snellen versus ETDRS charts in clinical practice. Trans. Am. Ophthalmol. Soc. 2009, 107, 311–324. [Google Scholar]
  31. Balcer, L.J.; Galetta, S.L.; Calabresi, P.A.; Confavreux, C.; Giovannoni, G.; Havrdova, E.; Hutchinson, M.; Kappos, L.; Lublin, F.D.; Miller, D.H.; et al. Natalizumab reduces visual loss in patients with relapsing multiple sclerosis. Neurology 2007, 68, 1299–1304. [Google Scholar] [CrossRef] [PubMed]
  32. Balcer, L.J.; Galetta, S.L.; Polman, C.H.; Eggenberger, E.; Calabresi, P.A.; Zhang, A.; Scanlon, J.V.; Hyde, R. Low-contrast acuity measures visual improvement in phase 3 trial of natalizumab in relapsing MS. J. Neurol. Sci. 2012, 318, 119–124. [Google Scholar] [CrossRef] [PubMed]
  33. Keltner, J.L.; Johnson, C.A.; Spurr, J.O.; Beck, R.W. Optic Neuritis Study Group. Baseline Visual Field Profile of Optic Neuritis: The Experience of the Optic Neuritis Treatment Trial. Arch. Ophthalmol. 1993, 111, 231–234. [Google Scholar] [CrossRef] [PubMed]
  34. Lauren, R.; Hepworth, F.J. Rowe Programme choice for perimetry in neurological conditions (PoPiN): A systematic review of perimetry options and patterns of visual field loss. BMC Ophthalmol. 2018, 18, 241. [Google Scholar] [CrossRef]
  35. Zarbin, M.A.; Jampol, L.M.; Jager, R.D.; Reder, A.T.; Francis, G.; Collins, W.; Tang, D.; Zhang, X. Ophthalmic evaluations in clinical studies of fingolimod (FTY720) in multiple sclerosis. Ophthalmology 2013, 120, 1432–1439. [Google Scholar] [CrossRef]
  36. Fruschelli, M.; Capozzoli, M.; Gelmi, M.C.; Masi, G.; Annunziata, P. Longitudinal quantitative assessment of macula during therapy with fingolimod in relapsing-remitting multiple sclerosis. Int. Ophthalmol. 2019, 39, 777–781. [Google Scholar] [CrossRef]
  37. Garcia-Martin, E.; Ara, J.R.; Martin, J.; Almarcegui, C.; Dolz, I.; Vilades, E.; Gil-Arribas, L.; Fernandez, F.J.; Polo, V.; Larrosa, J.M.; et al. Retinal and Optic Nerve Degeneration in Patients with Multiple Sclerosis Followed up for 5 Years. Ophthalmology 2017, 124, 688–696. [Google Scholar] [CrossRef] [Green Version]
Figure 1. RNFL longitudinal analysis in a selected multiple sclerosis (MS) ON− patient. Figure 1 shows no significant changes in retinal nerve fiber layer thickness (RNFL-T) at various time points in a selected MS ON− patient. In fact, in the colorimetric maps related to the RNFL-T in the peripapillary quadrants (S = superior; N = nasal; I = inferior; T = temporal), performed both 1 year and 2 years after the study baseline, a shift towards warmer colors (e.g., red), which is indicative of a significant thinning of the RNFL, is not observed.
Applsci 10 07085 g001
Figure 2. RNFL longitudinal analysis in a selected MS ON+ patient. Figure 2 shows progressive and significant RNFL thinning during the follow-up in a selected MS ON+ patient. In fact, in the right eye colorimetric map, a significant thinning of the RNFL in the superior peripapillary quadrant is observed, as indicated by the color change toward red, which is appreciable both 1 year and 2 years after the baseline. Similarly, in the left eye, the RNFL-T significantly decreases (turns red) in the temporal peripapillary quadrant at 2 years.
Applsci 10 07085 g002
Table 1. Ocular findings in relapsing-remitting multiple sclerosis (RR-MS) patients at baseline.
ParameterMean (SEM)
BCVA (logMar)0.18 (0.02)
LCLA 5% (letters)37.36 (1.24)
LCLA 2.5% (letters)26.85 (1.47)
LCLA 1.25% (letters)15.14 (1.47)
VF-MD (dB)−4.37 (0.6)
RR-MS = relapsing-remitting multiple sclerosis; BCVA = best-corrected visual acuity; LCLA = low-contrast letter acuity; VF–MD = visual field–mean deviation; SEM = standard error of the mean; dB = decibels.
Table 2. Optical coherence tomography (OCT) parameters in RR-MS patients at baseline.
ParameterMean (SEM)
TMV (mm3)9.84 (0.07)
CRT (μm)254.44 (2.5)
pRNFL-T (μm)118.65 (3.27)
Superior quadrant (μm)106.55 (2.14)
Nasal quadrant (μm)66.01 (1.52)
Inferior quadrant (μm)109.84 (2.35)
Temporal quadrant (μm)54.69 (1.47)
NRR-T (μm)432.4 (17.78)
OCT = optical coherence tomography; TMV = total macular volume; CRT = central retinal thickness; pRNFL-T = peripapillary retinal nerve fiber layer thickness; NRR-T = neuroretinal rim thickness; μm = micrometers; mm3 = cubic millimeters.
Table 3. Longitudinal analysis of the OCT parameters in RR-MS patients.
ParameterAverage Annual Rate (SEM)p-Value
TMV (mm3)−0.1 (0.01)<0.001
CRT (μm)−1.81 (0.41)<0.001
pRNFL-T (μm)−3.3 (0.51)<0.001
Superior quadrant (μm)−2.67 (0.37)<0.001
Nasal quadrant (μm)−1.19 (0.36)0.001
Inferior quadrant (μm)−2.31 (0.39)<0.001
Temporal quadrant (μm)−0.78 (0.28)0.005
NRR-T (μm)−12.79 (5.57)0.021
Values in bold indicate significant change (p values < 0.05).
Table 4. Annual change rates of the OCT parameters in optic neuritis (ON)− and ON+ patients.
ParameterON− PatientsON+ PatientsON+ vs. ON−
Annual Rate (SEM)p-ValueAnnual Rate (SEM)p-Valuep-Value
TMV (mm3)−0.05 (0.04)0.231−0.1 (0.01)<0.0010.145
CRT (μm)−0.8 (0.57)0.162−2.41 (0.63)<0.0010.06
pRNFL-T (μm)−0.54 (1.39)0.696−3.5 (0.55)<0.0010.049
Superior quadrant (μm)−0.66 (0.69)0.339−3.21 (0.28)<0.0010.001
Nasal quadrant (μm)−1.33 (0.77)0.084−1.15 (0.42)0.0070.835
Inferior quadrant (μm)−0.54 (0.68)0.431−3.01 (0.47)<0.0010.003
Temporal quadrant (μm)0.23 (0.72)0.753−0.9 (0.34)0.0080.158
NRR-T (μm)−3.26 (8.44)0.699−36.59 (2.74)<0.001<0.001
Values in bold indicate significant difference (p values < 0.05). ON+ = patients with previous history of optic neuritis; ON− = patients without previous history of optic neuritis.

