Article

Entropic Ranks: A Methodology for Enhanced, Threshold-Free, Information-Rich Data Partition and Interpretation

by
Hector-Xavier de Lastic
1,2,
Irene Liampa
2,3,
Alexandros G. Georgakilas
1,
Michalis Zervakis
3 and
Aristotelis Chatziioannou
4,5,*
1
DNA Damage Laboratory, Physics Department, School of Applied Mathematical and Physical Sciences, National Technical University of Athens, 15780 Athens, Greece
2
Institute of Chemical Biology, National Hellenic Research Foundation, 11635 Athens, Greece
3
Digital Image and Signal Processing Laboratory (DISPLAY), School of Electrical and Computer Engineering, Technical University of Crete, 73100 Chania, Greece
4
e-NIOS PC, 17671 Kallithea-Athens, Greece
5
Center of Systems Biology, Biomedical Research Foundation of the Academy of Athens (BRFAA), 11527 Athens, Greece
*
Author to whom correspondence should be addressed.
Appl. Sci. 2020, 10(20), 7077; https://doi.org/10.3390/app10207077
Submission received: 5 August 2020 / Revised: 1 October 2020 / Accepted: 8 October 2020 / Published: 12 October 2020
(This article belongs to the Special Issue Big Data Analytics for Cancer Research and Precision Medicine)

Abstract

:

Featured Application

The generic applicability of the entropy-empowered rank product (RP) calculation score supports the utilization of this non-parametric, threshold-free methodology in different kinds of data. This is not restricted only in meta-analysis of different data sets, but could serve as a key methodology for data integration of different sources of information, in the quest for highly automated, systemic big data biological interpretation.

Abstract

Background: Here, we propose a threshold-free selection method for the identification of differentially expressed features based on robust, non-parametric statistics, ensuring independence from the statistical distribution properties and broad applicability. Such methods could adapt to different initial data distributions, contrary to statistical techniques, based on fixed thresholds. This work aims to propose a methodology, which automates and standardizes the statistical selection, through the utilization of established measures like that of entropy, already used in information retrieval from large biomedical datasets, thus departing from classical fixed-threshold based methods, relying in arbitrary p-value and fold change values as selection criteria, whose efficacy also depends on degree of conformity to parametric distributions,. Methods: Our work extends the rank product (RP) methodology with a neutral selection method of high information-extraction capacity. We introduce the calculation of the RP entropy of the distribution, to isolate the features of interest by their contribution to its information content. Goal is a methodology of threshold-free identification of the differentially expressed features, which are highly informative about the phenomenon under study. Conclusions: Applying the proposed method on microarray (transcriptomic and DNA methylation) and RNAseq count data of varying sizes and noise presence, we observe robust convergence for the different parameterizations to stable cutoff points. Functional analysis through BioInfoMiner and EnrichR was used to evaluate the information potency of the resulting feature lists. Overall, the derived functional terms provide a systemic description highly compatible with the results of traditional statistical hypothesis testing techniques. The methodology behaves consistently across different data types. The feature lists are compact and rich in information, indicating phenotypic aspects specific to the tissue and biological phenomenon investigated. Selection by information content measures efficiently addresses problems, emerging from arbitrary thresh-holding, thus facilitating the full automation of the analysis.

1. Introduction

Data analysis of high-throughput technologies (microarrays, next generation sequencing) commonly predicates on the adoption of arbitrary p-value and fold change thresholds to define the reliability and relevance of a set of features, in order to partition the initial distribution into two sets. The first set S is further investigated for its phenotypic relevance, whereas the other is exempted from further analysis, considered to be the baseline distribution with noise, either biological (coexisting, causally unrelated processes) or technical [1]. This approach as a selection philosophy is currently being debated. Specifically, regarding p-value thresh-holding, critics raise the issues of incomplete information, misrepresentation, misinterpretation and bias [2,3], whereas for fold change thresh-holding, the issues cited include the adoption of arbitrary thresholds [4], consequently the potential of strong bias [5], with no theoretical underpinning for the threshold values. Ideally, selection thresholds should take into account the form of data distributions, the presence of confounders, and the complexity of phenomenon under investigation. Most of the approaches used also hinge on the conformity of data distribution to a priori distributions, requiring extensive data preparation and careful application of differential behavior identification methods to ensure it [6]. Prioritizing the identification of the information content and using it to extract and identify meaningful results, rather than trying to assess it as a post-analysis process was the main motivation for our approach.

1.1. From Rank Products to Entropic Ranks

The rank product method partially addresses these issues through a frequentist approach, by measuring the consistency of behavior across the sample groups, using the fold change (FC) criterion. When testing for up-regulation, the Rank Product R P g u p of a gene g) is calculated as:
R P g u p = i = 1 k ( r i , g u p N i )
where N i is the total number of features and r i , g u p (for single-colour transcriptomics) is the rank of gene g in the decreasing-FC-ordered list of genes in the ith pair of control vs. case samples (i.e., r u p = 1 for a gene consistently more overexpressed than any other in all cases vs. all control samples). Similarly calculated is the R P g d o w n , over the increasing-FC-ordered lists. The percentage of false positive (pfp) value for each rank product (RP) score is estimated through a permutation-based procedure outlined in the initial publication of the method [4].
The initial Rank Product implementation in Bioinformatics, whilst addressing a number of the aforementioned issues, retains arbitrariness by trimming the final list either by a calculated pfp/p-value thresh-holding or by directly choosing the number of genes. Moreover, it tends to behave over-optimistically with increasing data dimensionality, as shown in recent works [7] (see also “Supplementary Material 1—Method”).
Our work aims to measure the information content of the RP distribution, implement a data-driven, non-parametric partitioning, provide a workflow for high-throughput data analysis and unbiased information extraction (Figure 1), and generalize the approach to various data types. We introduce the calculation of entropy over a transformation of the RP distribution, followed by a clustering procedure in order to identify the most consistent cutoff point successfully separating information-rich features from noise-dominated ones, without human intervention. The methodology operates upon the non-parametric RP distribution, relegating pfp and the p-value (which may be calculated empirically or parametrically) to quality indicators of the analysis instead of decision criteria. Consequently, it allows for improvement of the pfp calculation methods and adoption of new approaches [7,8], ensuring result reproducibility and comparability as long as the RP calculation process itself remains unchanged.

1.2. Entropy in Biostatistics

The utilization of entropy in bioinformatics has been tentative, for the most part, leading to specific implementations instead of producing consistent classes of methodologies, governed by standard practices. Nevertheless, we identify three main categories of such implementations:
Firstly, the usage of entropy as a measure for the optimization of classification techniques. In most implementations, this is achieved prior to the classification, through dimensionality reduction approaches driven by the evaluation of entropy in order to reduce feature redundancy [9,10,11]. However, there is a recently introduced approach [12], in which entropy is used to directly weight and rank fractional Fourier transform coefficients, upon which further clustering approach is based.
Secondly, the evaluation of entropy as a main component of the decision process. Various approaches include patient stratification [13], inferring regulatory networks using transfer entropy [14] and identification of periodical biological processes in time series data [15]. However, there exists an approach more closely based on Shannon entropy and conceptually closer to our work than others, which attempts to identify differential expression in RNA count data [16].
Lastly, a unique implementation utilizes entropy evaluation upon the variability of genome regions [17] in order to evaluate their information content in contrast to uniformity, a contrast we also use during the partitioning of the rank product distribution in the proposed methodology.

2. Methods

2.1. Rank Product Requirements

Rank product methodology is applied upon four basic premises [4] considered valid in high-throughput signal distributions:
  • S << N (N: the full set of features);
  • Independence of measurements between replicate arrays;
  • The intensity of each feature over the range of samples is largely homoscedastic;
  • The majority of non-zero fold changes between the sample groups are independent of each other.

2.2. The Segmentation Problem

Our working hypothesis is a direct corollary of the ordered RP distribution being an ordered set; namely, that the first n elements of the RP distribution correspond to features of high information content in respect to the phenomenon under scrutiny, and subsequent ones are to be excluded from further analysis. Our partitioning process is functionally identical to a threshold-driven usage of rank products, using optimal pfp thresholds, chosen individually for each experiment (see Table 1 and “Supplementary material 1—Method”). The generalized approach we aim to create should automatically adapt to each experiment, consistently separating signal from noise while eschewing the bias introduced by thresh-holding approaches.

2.3. Partitioning the RP Distribution

The RP score distribution (i.e., for upregulated features) is an ordered set, beginning with a steep ascent, converging to a linear distribution for features following the null hypothesis and finally diverging again for the last few features (i.e., downregulated) (see “Supplementary material 1—Method”). The set of features most significant in describing the phenomenon investigated consists of the first n elements of that distribution, necessarily encompassing at least part of the steep ascent of RP scores. Conversely, the linear part of the distribution corresponds to stochastically behaving features, which should be excluded. Moreover, the RP score distribution carries information regarding each feature’s consistency of behavior across replicates and is rigidly determined by the structure and form of the original data, deflecting external computational bias (in contrast to pfp calculation). Consequently, n will be robustly determined by partitioning the RP distribution.

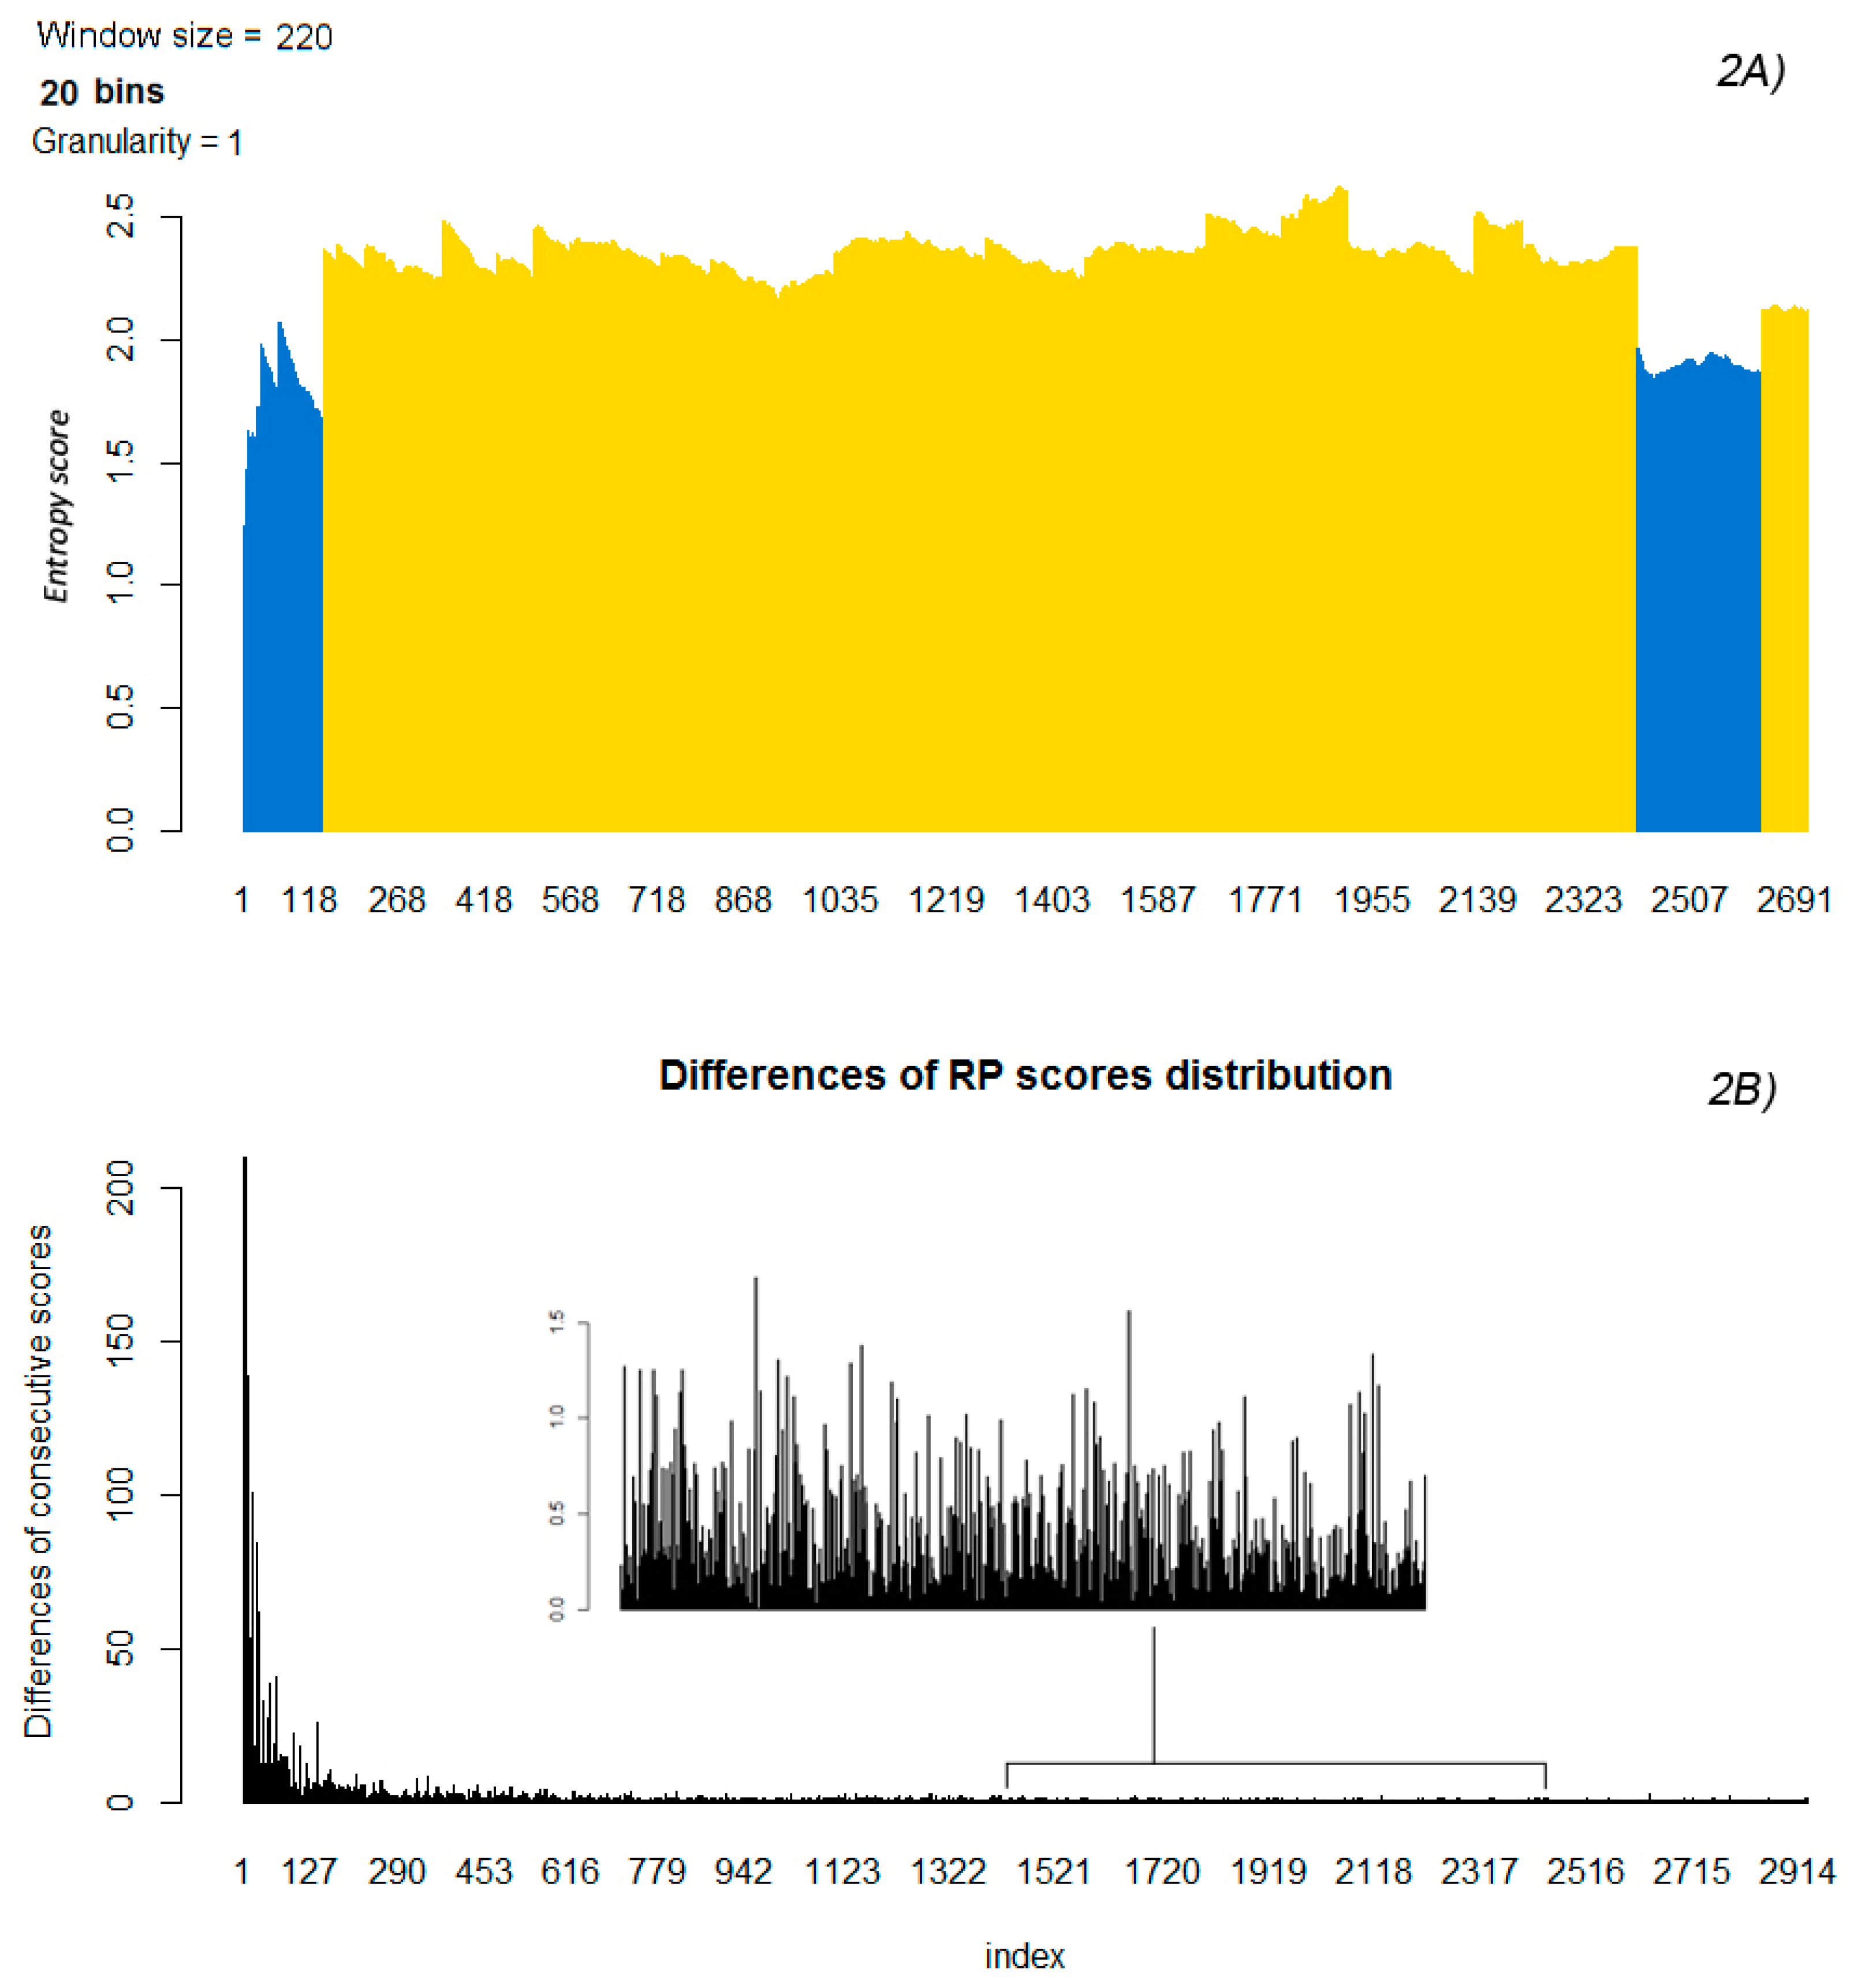
2.4. Differences of Consecutive RP Scores and Entropy

Given that the RP distribution is ordered, we can calculate the distribution of the differences between consecutive terms ( R P i + 1 u p R P i u p ,   i [ 1 ,   N 1 ] when testing for upregulation), shown in Figure 2B, which is more intuitive to understand than the initial RP distribution and proves more apt for the partitioning process described below. The initial ascent, at least partly overlapping with any significant differentially behaving features, is represented by a descending distribution of RP differences. Features following the null hypothesis (undifferentiated behavior) are expected to achieve ranks at random, resulting in a set of mostly undifferentiated RP scores [18]. An extreme case of this behavior was observed on applying rank sums (which has a sparser set of values) on the GSE12288 data set (see “Supplementary Material 1—Method”, Part 3), where lengthy areas of genes adhering to the null hypothesis resulted in equal rank sum scores. In less extreme cases, undifferentiated rank product (or sum) scores result in non-zero differences between these consecutive, “null-hypothesis-abiding” terms of the ordered set, stochastically oscillating around values near zero.
Given that RP scores reward systematic behavior of features across samples (and thus convey information on it), these two distinct patterns can be considered to represent the difference between systematic behavior, attributable to differentiated processes (evident in the steep descent of RP differences), and noise-dominated behavior following the null rank product hypothesis (evident in stochastically oscillating RP differences). On this basis, we aim to utilize the calculation of entropy to partition this distribution into an initial, low-entropy and information-rich area and a high-entropy, information-poor subsequent area. The former will be considered to be the set S, containing n features. The latter will be considered the set of features with a low signal-to-noise ratio, excluded from further analysis.

2.5. Partitioning the Entropy Distribution

Using a sliding window over the distribution of differences, we calculate the entropy of values within each instance of the sliding window in nats, using the Shannon entropy:
H = k = 1 p θ k ln ( θ k )
as modified by a Dirichlet-multinomial regularization resulting in:
H ^ B a y e s = k = 1 p θ ^ k B a y e s ln ( θ ^ k B a y e s )
where θ ^ k B a y e s = y k + a k n + A ,   A = k = 1 p a k and a k = 1 , as per the Bayes–Laplace uniform prior, reflecting our prior knowledge for the bin counts used during discretization [19], with each bin having an equal a priori chance of accommodating a result. Figure 2A shows the resulting entropy score distribution for the GSE60767 gene expression data set. The initial, low-entropy area represents S. Subsequently, entropy rises sharply and oscillates around higher values, due to (small in absolute value, as seen in Figure 2B) stochastic oscillations of the RP differences. This pattern holds across different parameters of the sliding window and bin count, as well as across different data types, with consistency analogous to that of the RP distribution’s overall shape.
We note that there may be numerous low-entropy areas over the entropy distribution. The RP distribution is an ordered set, with ordering corresponding to decreasingly statistically significant and consistent differential behavior under the fold change criterion. Thus, our hypothesis is that the very first low-entropy area corresponds to features with consistently differentiated behavior between the two populations, hence more strongly tied to the phenomenon under study compared to subsequent areas. Contrarily, the high-entropy areas (including any local minima of entropy, resulting from random oscillations in low-signal areas as seen in the right part of the distribution) correspond to features associated with the rank products null hypothesis (achieving ranks with a uniform probability distribution [18]), thus not informative on the phenomenon. Consequently, we now need to consistently identify the first low-entropy area in an unsupervised manner. This segmentation should be achieved while eschewing the need for user-defined arbitrary thresholds, thus avoiding the re-introduction of bias inherent in thresh-holding approaches. The finely detailed structure of the entropy distribution prohibits stable convergence of change-point algorithms, which would be the first approach to partitioning ordered distributions. They exhibit high variation of performance, wholly reliant on the specifics of the sliding window and bin count. This class of algorithms also fails to converge reliably regarding the RP distribution. For all the above, see also “Supplementary Material 1—Method”.

2.6. K-means Clustering to Calculate n
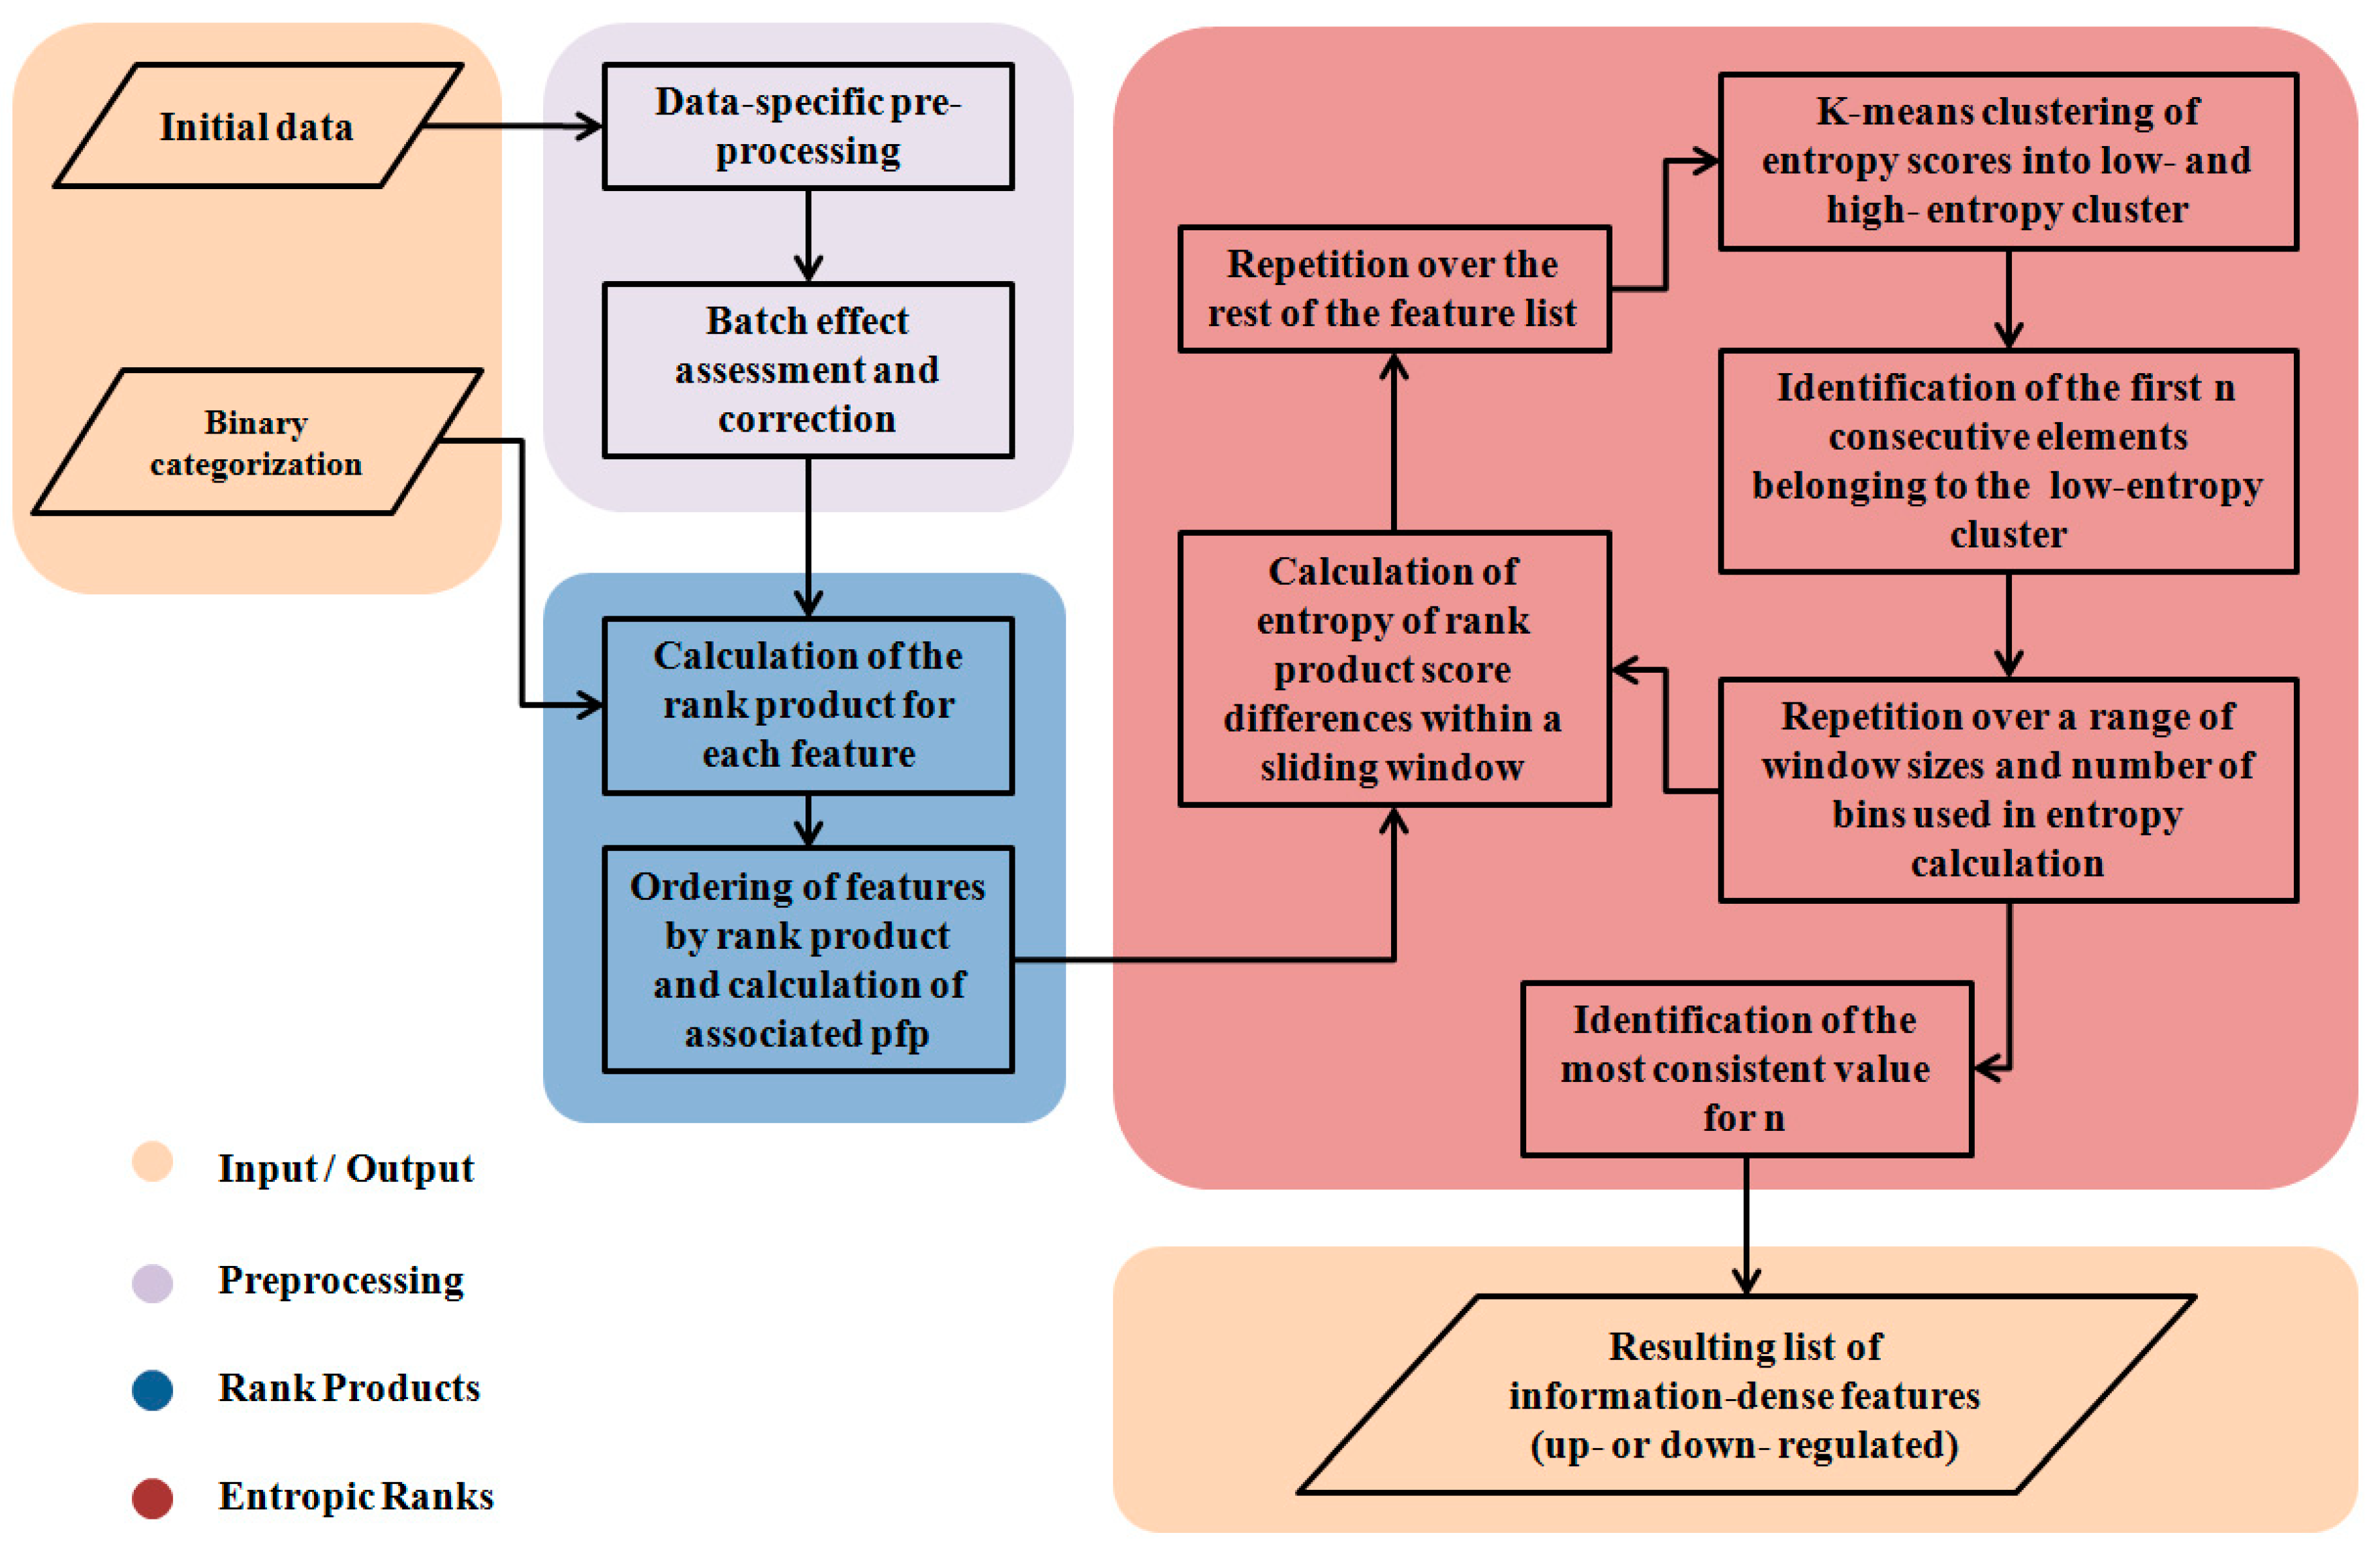
To reliably overcome the partitioning problem of the RP distribution, we evaluated the performance of a selection of clustering methodologies, aiming to categorize the entropy values into a high-entropy and a low-entropy cluster. Maximum consistency against outliers and incidental complexity was exhibited by the K-means algorithm. Direct corollary of our hypotheses so far is that if the low-entropy cluster starts at the beginning of the RP score list (which is an ordered set), then there is at least a single, highly informative, differentially behaving feature. If so, n will be defined as the number of features preceding the first element of the high-entropy cluster (Figure 2A, leftmost blue area). The rationale is that the first high-entropy value will correspond to the first sliding window containing no information-rich (in terms of behavioral pattern relevant to the comparison performed) features. Due to the ordering of the RP distribution, all features following a rejection are to be rejected as well. This procedure proves highly resistant to perturbations concerning the specifics of the sliding window and the number of bins used in entropy calculation. Reiterating this procedure over a range of window sizes and bin counts yields a small set of suggested values for n, one of which exhibits prominent consistency. This will mark the cutoff defining the set of highly informative features, forgoing the need for external thresholds (to pfp or even entropy values), thereby decoupling the selection process from calculated statistical scores, relegating their use to post-selection result assessment.

2.7. Implementation

The development, actualization, testing, and verification through analyses were all performed in R v3.4.1, using open source R packages from Bioconductor in RStudio and usegalaxy.eu, in order to ensure transparency and reproducibility. Full citation of the packages is offered in “Supplementary Material 1—Method”.
In the interests of reproducibility and platform independence afforded by a dockerized implementation, the dockerfile for the tool is hosted at: https://github.com/Hector-Xavier/Entropic_Ranks_docker.

3. Results

3.1. Evaluation Criteria

A threshold-free, adaptive, generalized selection process, like the one proposed, should be evaluated according to the following criteria: (a) specificity of the selected features in terms of biological relevance, (b) sensitivity to weak biological signals, (c) performance on data sets of varying noise content, and (d) its generality in terms of reliable performance across different types of experiments. To test against these criteria, we selected and analyzed a range of published, publicly accessible data sets, each tied to one or more of the aforementioned criteria. The chosen data sets (Table 2) and workflows used during analysis are presented more fully in “Supplementary Material 2—Data Sets”. Biological relevance of the results was assessed with Gene Set Enrichment Analysis [20] tools EnrichR [21,22] and BioInfoMiner [23].
As an additional measure of verification, we compared its performance with the rank products and rank sums, both in their original form [4] and their recent implementation [7], as well as with the implementation of our entropic analysis upon the Rank Sum statistic (referred to as “entropic sums”). Moreover, SRP127667 was also tested for differential expression using EdgeR to verify the baseline biological relevance of results under a standard methodology since the application of rank statistics on RNAseq count data is novel. Overall, our approach exhibited consistent behavior on real as well as simulated data. Functional analysis of the derived feature lists showed that entropic ranks provides increased specificity at a concise list size, supporting the argument of efficient rejection of noise-dominated features. In short, entropic ranks lists produced highly relevant functional term lists in all cases, whereas other methodologies (rank products, “entropic sums”, hypothesis testing, etc.) show variable performance according to experiment setup and thresh-holding values, ranging from comparable performance to lack of results. Discussion of the implementations and summaries of results is found in “Supplementary Material 1—Method”. Discussion of the data sets and results of all methods applied on them are presented in “Supplementary Material 2—Data Sets”. All files, tables and plots created are contained in “Supplementary Material 3—Output”.
This approach was adopted due to the fact that standard methodologies of comparison, such as list overlap, are inappropriate for two specific reasons. Firstly, they allow the assessment of interchangeability of two methods given similar thresh-holding choices, whereas entropic ranks were created to be a threshold-independent feature selection process. Secondly, statistical testing methodologies evaluate the value distributions in each population, whereas our approach is driven by patterned behavior, thus preferring genes with higher fold changes as a byproduct of its function, instead of its main focus.

3.2. Simulated Data

In order to assess performance on simulated data with known truth values, as is standard practice, we elected a simulated RNAseq count table data set with spiked values [24]. It has been created using a random number generator for the express purpose of benchmarking differential expression methodologies and consists of 10 samples, 5 “cases” and 5 “controls”. Out of the 12,500 features, 1250 known features have spiked values.
Our method highlights features in a manner different than usual statistical testing: instead of relying on statistical value thresh-holding, it trims the resulting lists according to the identification of pockets of organized and consistent behavior among the features investigated. Consequently, direct comparison to approaches such as t-testing can be difficult, especially on simulated data tailored to fit hypothesis testing. Simulated data sets created with random number generators exhibit none of the underlying biological constraints present in real data. Moreover, the differentially expressed features in biological systems tend to be organized in consistent networks.
These differences lead us to expect that our method, which detects patterns of expression instead of statistical distributions, will underperform compared to hypothesis testing approaches in a simulated, spiked value data set. Even more importantly, our method aims to assess the information content of features’ behavior across populations. Simulated data created using random number generators by definition exhibit highly stochastic behavior in the absence of biological constraints, which are difficult to model. Assessment of such a data set, in terms of information content should be expected to return few findings, if any, as there are no consistent patterns to be detected. Moreover, removal of the spiked values should reduce the findings even further, possibly eliminating them altogether.
Indeed, entropic ranks underperformed in the identification of the spiked features as compared to limma on the simulated data, as can be seen in “Supplemetary Data 3—Output”. Testing the null hypothesis by removing the spiked values reduced performance even further, leading to the identification of 23 differentially expressed features by entropic ranks compared to a single differentially expressed feature returned by limma. However, investigation of these 23 differentially “false positives” showed that they represented rows for which the random number engine had failed to create properly uniform distributions across samples. Instead, these features were highly differentially expressed (15-fold or more) between populations, usually with a single outlying value in one of the two populations. Both under the null hypothesis and when using the full data, entropic ranks was more robust than rank products and “entropic sums” against false positive results. Its robustness was comparable with rank sums, which has convergence issues with high data dimensionality (see “Supplementary Material 1—Method”, Part 5).
This level of sensitivity to patterned behavior and robustness against false positive discoveries should be considered features of the method. Moreover, the plots created by entropic ranks during entropy calculation show very high entropy near the beginning of the distribution, and tend to oscillate around lower values further on. This pattern shows an initial low-entropy cluster behaving similar to the noise-dominated areas than we see in real data sets. Such behavior could help the experimenter identify poorly structured data sets.

3.3. Series GSE12288

The set provides microarray gene expression data of leukocytes from 110 patients with Duke coronary artery disease (CAD index > 23) and 112 control subjects (CADi = 0) [25]. It is provided as a studied data set of a known pathology upon which the baseline specificity of the method can be assessed. Moreover, we can compare our method to a mainstream analysis workflow by comparing our results to the list of 160 genes identified in the original publication as significantly (rho > 0.2, p < 0.0027) correlated with the CAD index.
A comparison of cardiovascular diseases associated with the gene lists identified in the original publication and through our methodology using the Comparative Toxicogenomics Database (CTD) [26] set analyzer is presented in Table 3. The gene lists do not overlap, with the exception of a single gene, CDC42, which has been shown to function as an anti-hypertrophic molecular switch in the heart [27,28]. BioInfoMiner was used to map the list onto the human phenotype [29] and MGI Mammalian [30,31] ontologies, highlighting a number of inflammatory response terms and T-cell activation processes, associated with abnormalities of the hematopoietic system. Mapping our list onto the Reactome ontology [32,33] through BioInfoMiner highlights a Selenocysteine synthesis process, which has been shown to have antioxidant effects [34]. EnrichR mapped the resulting gene list onto dbGaP [35], ranking “hypertension” as the top term by combined score. At the same time, the sampled tissue was clearly identified through Jensen TISSUES [36], ARCHS4 TISSUES [37] and Human Gene Atlas [38] as “blood”, “peripheral blood” and “whole blood”, respectively. When we mapped the 160-gene list from the original publication using BioInfoMiner, it returned relevant results, especially in the human phenotype and MGI Mammalian ontologies, but it failed to achieve both the breadth and specificity of the results returned by the list generated using our approach (see “Supplementary Data 3—Output”, under GSE12288 for the full results).

3.4. Series GSE69486

In order to assess the specificity even when the input signals are weak due to technical or biological (phenotype associated) reasons, we used a data set containing microarray gene expression data of fibroblast cells from 10 samples of patients with bipolar disease and two control samples. A way to assess specificity is the capability of the resulting differentially expressed list to identify the cell population. Sensitivity is evaluated if functional analysis of the gene list identified ontological terms associated with the neurological pathologies underlying bipolar condition (as was the hypothesis of the original study).
EnrichR successfully identified the cell population as “Fibroblast” through ARCHS4. Achilles fitness decrease [39] highlighted “GB1-central nervous system” as the most significant term by rank-based. More phenotype-specific results were achieved through BioInfoMiner-mediated mapping of the list onto MGI Mammalian, which is densely described. This mapping includes a distinct branch of terms related to nervous system abnormalities. Of note is the presence of MMP3 in the highly connected gene list produced by BioInfoMiner, as it has been shown to be tied to bipolar disease [40]. Moreover, Reactome highlighted the term for “synthesis of prostaglandins (PG) and thromboxanes (TX)”, which have been tied to bipolar disease [41] and are used as markers in relevant pharmacological research [42].

3.5. Series GSE60767

Chosen to assess performance in data of high noise content and to assess the sensitivity of the proposed method, this data set contains microarray gene expression data from 312 leukocyte samples of healthy adult males from the highly polluted industrial region of Ostrava and 154 healthy male control samples from Prague [43]. The study aimed to investigate differential gene expression induced by chronic exposure to elevated pollution levels. Due to the weakness of the biological signal and the need to address a significant batch effect induced by beadchip performance, standardized t-testing identified no statistically significant (p-value < 0.05) differentially expressed genes within each of the three sampling seasons, even with very low long fold change (lfc) thresholds (< 0.1).
Our methodology was able to identify genes with differential behavior in regards to the city of origin in all three sampling seasons, as seen in Table 1. Mapping the resulting gene lists through EnrichR consistently identified the “diabetes melitus, type 2” through OMIM disease and OMIM expanded [44], a connection supported by past research [45]. Bioinfominer mapping of the gene lists onto Gene Ontology [46,47] and MGI Mammalian ontologies highlights terms characteristic of a response to increased levels of particulate matter and associated pollutants. There are generalized inflammation indicators which have been tied to cardiovascular syndromes and lung cancer [48], as well as terms relating to the development of the nervous system, which can be attributed to the toxic metal load of particulate matter particles [49].

3.6. Series GSE42861

This methlation microarray data set was selected in order to test the performance and specificity of the proposed method on DNA methylation data profiles of a known pathology [50,51]. This will also allow evaluation of the generality of the proposed method, given that DNA methylation platforms contain many more probes, have different distribution of values (M-values) and are also greatly influenced by blood cell population perturbations between samples. The study explores the methylation profiles of peripheral blood leukocytes from patients with rheumatoid arthritis compared to healthy controls. We opted to apply our methodology onto the subpopulation of the data set consisting of samples taken from 50 to 60 years old men and women who had never been smokers, in order to reduce potential confounders. Out of the 44 samples thus selected, 20 were of patients with rheumatoid arthritis and 24 were control samples.
Using EnrichR, Jensen DISEASES identified rheumatoid arthritis as the most significant term by rank based ranking. Of particular note is the presence of allograft rejection terms at the top of the lists of both KEGG 2016 [52] and WikiPathways 2016 [53], pointing to the triggering of the same basic mechanisms in the course of the disease. BioInfoMiner mapping of the list onto Gene Ontology, Human Phenotype, MGI Mammalian and Reactome provides highly overlapping results. There is an overarching inflammatory response with terms specific to T-cell activation. Gene Ontology highlights the “telomere maintenance” (Figure 3) term, which has been an area of active study as to its implication in autoimmune syndromes [54,55,56]. Furthermore, in the Human Phenotype ontology, highlighted terms include autoimmunity and rheumatoid arthritis. Lastly, the highly connected genes identified through BioInfoMiner for these four ontologies have a strong presence of the major histocompatibility complex family (HLA-C, HLA-DRB1, HLA-DQB1, HLA-DQA1, HLA-DRB1), a finding in agreement with one of the studies citing the data set [51]. Even with a reduced sample number, the proposed method extracted a biological signal highly relevant to the phenotype and in line with the findings of the original study for the full data set.

3.7. Series SRP127667

In order to further test the generality of the proposed method, we applied it on RNAseq count table data, which follow different distributions than gene expression and methylation data. The application of rank statistics on RNAseq count data is novel within the Bioinformatics field. Nevertheless, in the field of Astrophysics RPs have been successfully used in pipelines performing occultation [57] and gravitational wave [58] event verification. These “discovery enumeration” phenomena are Poisson point processes, similar to the discovery-based formation of RNAseq count tables from RNA reads. Given that the requirements of RP hold for the count tables except for the independence of variance (which has been shown to affect statistical threshold selection [59], which we do not perform), we extend the verification testing of our non-parametric methodology to RNAseq data, aiming to assess the specificity of the method, despite the biological and computational problems generated by RNAseq data as opposed to transcriptomics. Additional analysis of our data using EdgeR verified the relevance of entropic ranks results. We compared the gene counts obtained from RNA sequencing of cardiac myocytes from 10 adult patients with terminal heart failure to three control samples from the BioProject study SRP127667.
EnrichR was used to map the differentially expressed genes to Panther 2016 [60], Jensen DISEASES and Reactome. Panther 2016 highlighted as the first term by combined ranking the Wnt signaling pathway, which has been implicated in cardiovascular syndromes [61]. Jensen DISEASES terms ranked first by combined score were “hypertension”, “coronary artery disease” and “cerebrovascular disease”. Reactome highlighted as the second term by combined ranking the Ca2+ pathway. Using BioInfoMiner to map the list onto Gene Ontology and Human Phenotype ontology showed terms related to thrombosis abnormalities, tyrosine phosphorylation of Stat3 protein, and the regulation of body fluid levels through the urinary system—the last of which is a known regulator mechanism of blood pressure (Figure 4). Lastly, the highly connected genes identified through BioInfoMiner are specifically associated with pharmaceuticals prescribed for cardiovascular conditions.

4. Conclusions

We present and evaluate a methodology, which extends the rank products method to create a generalized framework for threshold-independent selection of differentially expressed features, according to the information content of their behavior.
The biological interpretation of the functional analysis performed on each data set supports the capability of our method to separate information-rich data from noise, eschewing the limitations and plights of fold change and p-value thresh-holding approaches, which are inherent in statistical testing approaches such as t-testing. Fold change and pfp are computed, but are relegated to quality indicators for the evaluation of the experiments and subsequent analysis instead of being used as decision criteria.
The analytic workflow we apply, exploits solely the elementary preprocessing, normalization and signal correction bioinformatic techniques, to ensure reproducibility of results and transparency of the comparative evaluation. No further processing steps, aiming to force values to conform to a specific kind of distribution were used, alluding to the generalized character of the proposed method, as well as the case of its introduction for broader data analytic scenarios.
Further comparison between the results of enrichment analysis following entropic ranks and rank products, as well as other methodologies (detailed in “Supplementary Material 2—Data Sets”) shows that the identification of differentially expressed features by the proposed method provides highly specific information with respect to the experiment. Manual assessment often suggests higher specificity of results both when compared to larger and smaller lists, as well as when lists overlap (as in comparisons with rank products/rank sums results) and when containing different sets of features, as a result of using different families of methodologies (e.g., hypothesis testing performed in our lab or the results of the initial publication of a data set).

Features of Entropic Ranks

In summary, the proposed method extends the rank product methodology by incorporating the measurement of information content as an integral part of the analysis and interpretation. Firstly, the selection of significant genes is based on the distribution of all genes over the entire populations, rather than evaluating each gene independently. Information-poor data, such as simulated data sets [24] with a very low signal-to-noise ratio exhibit a starkly different entropy distribution, without a defined, initial, low-entropy area followed by stably high entropy area with minimal oscillations (see “Supplementary Material 2—Data Sets” and “Supplementary Material 3—Output”). Secondly, the methodology is applicable to a broad array of selection problems and data types, as long as they conform to basic assumptions made by the rank products methodology. Thirdly, it departs from the adoption of arbitrary or empirical statistical thresholds, exploring the information density of the distribution and cherry picking clusters of high information content, through rigorous entropic analysis. Fourthly, the automation of the partition process is possible, allowing for unsupervised and unbiased analytical processes to be applied. The fifth feature is the ability to freely adjust the analytic granularity (by changing the sliding window step) to more refined or coarser inspection, enabling solutions of varying computational cost and level of convergence. Lastly, another advantage of this method is the potential for integration of data from different sources or dissection levels into the same analysis, as long as they can be transformed to similar, ranked value distributions.

Supplementary Materials

The following are available online at https://www.mdpi.com/2076-3417/10/20/7077/s1: “Supplementary Material 1—Method.pdf”, “Supplementary Material 2—Data Sets.pdf”, “Supplementary Material 3—Output.7z”. The following is available at http://doi.org/10.5281/zenodo.4028882: “Supplementary Material 3—Output.7z”.

Author Contributions

Conceptualization, A.C.; methodology, H.-X.d.L. and I.L.; software, H.-X.d.L.; validation, I.L. and H.-X.d.L.; writing—original draft preparation, H-X.d.L. and I.L.; writing—review and editing, A.G.G., M.Z. and A.C.; supervision, A.C., A.G.G. and M.Z. All authors have read and agreed to the published version of the manuscript.

Funding

Irene Liampa’s PhD thesis is supported by a scholarship from the State Scholarship Foundation in Greece (IKY) (Operational Program “Human Resources Development—Education and Lifelong Learning” Partnership Agreement (PA) 2014–2020). We acknowledge support of this work by the project “ELIXIR-GR: Hellenic Research Infrastructure for the Management and Analysis of Data from the Biological Sciences” (MIS 5002780) which is implemented under the action “Reinforcement of the Research and Innovation Infrastructure”, funded by the Operational Program “Competitiveness, Entrepreneurship and Innovation” (NSRF 2014–2020) and co-financed by Greece and the European Union (European Regional Development Fund).

Acknowledgments

Aristotelis Chatziioannou is co-founder of e-NIOS PC.

Conflicts of Interest

The authors declare no conflict of interest.

References

  1. Tsimring, L.S. Noise in Biology. Rep. Prog. Phys. 2014, 77, 026601. [Google Scholar] [CrossRef] [PubMed]
  2. Leek, J.; McShane, B.B.; Gelman, A.; Colquhoun, D.; Nuijten, M.B.; Goodman, S. Five ways to fix statistics. Nature 2017, 551, 557–559. [Google Scholar] [CrossRef] [PubMed]
  3. Chawla, D.S. ‘One-size-fits-all’ threshold for P values under fire. Nature 2017. [Google Scholar] [CrossRef]
  4. Breitling, R.; Armengaud, P.; Amtmann, A.; Herzyk, P. Rank products: A simple, yet powerful, new method to detect differentially regulated genes in replicated microarray experiments. FEBS Lett. 2004, 573, 83–92. [Google Scholar] [CrossRef] [PubMed]
  5. Dalman, M.R.; Deeter, A.; Nimishakavi, G.; Duan, Z. Fold change and p-value cutoffs significantly alter microarray interpretations. BMC Bioinform. 2012, 13. [Google Scholar] [CrossRef] [PubMed] [Green Version]
  6. Federico, A.; Serra, A.; Kieu Ha, M.; Kohonen, P.; Choi, J.-S.; Liampa, I.; Nymark, P.; Sanabria, N.; Cattelani, L.; Fratello, M.; et al. Transcriptomics in Toxicogenomics, Part II: Preprocessing and Differential Expression Analysis for High Quality Data. Nanomaterials 2020, 10, 903. [Google Scholar] [CrossRef]
  7. Del Carratore, F.; Jankevics, A.; Eisinga, R.; Heskes, T.; Hong, F.; Breitling, R. RankProd 2.0: A refactored bioconductor package for detecting differentially expressed features in molecular profiling datasets. Bioinformatics 2017, 33, 2774–2775. [Google Scholar] [CrossRef] [Green Version]
  8. Yang, T.Y. A Simple Rank Product Approach for Analyzing Two Classes. Bioinform. Biol. Insights 2015, 9. [Google Scholar] [CrossRef] [Green Version]
  9. Liu, X.; Krishnan, A.; Mondry, A. An Entropy-based gene selection method for cancer classification using microarray data. BMC Bioinform. 2005, 6, 76. [Google Scholar] [CrossRef] [Green Version]
  10. Wang, Y.; Yan, H. Entropy based sub-dimensional evaluation and selection method for DNA microarray data classification. Bioinformation 2008, 3, 124–129. [Google Scholar] [CrossRef]
  11. Furlanello, C.; Serafini, M.; Merler, S.; Jurman, G. Entropy-based gene ranking without selection bias for the predictive classification of microarray data. BMC Bioinform. 2003, 4, 54. [Google Scholar] [CrossRef] [PubMed] [Green Version]
  12. Guo, Z.; Xin, Y.; Zhao, Y. Cancer classification using entropy analysis in fractional Fourier domain of gene expression profile. Biotechnol. Biotechnol. Equip. 2018, 32, 1042–1046. [Google Scholar] [CrossRef] [Green Version]
  13. Liu, H.; Zhao, R.; Fang, H.; Cheng, F.; Fu, Y.; Liu, Y. Entropy-based consensus clustering for patient stratification. Bioinformatics 2017, 33, 2691–2698. [Google Scholar] [CrossRef] [PubMed]
  14. Tung, T.Q.; Ryu, T.; Lee, K.H.; Lee, D. Inferring Gene Regulatory Networks from Microarray Time Series Data Using Transfer Entropy. Twent. IEEE Int. Symp. Comput. Based Med Syst. 2007. [Google Scholar] [CrossRef]
  15. Langmead, C.; Mcclung, C.; Donald, B. A maximum entropy algorithm for rhythmic analysis of genome-wide expression patterns. Proc. IEEE Comput. Soc. Bioinform. Conf. 2002. [Google Scholar] [CrossRef]
  16. Zambelli, F.; Mastropasqua, F.; Picardi, E.; D’Erchia, A.M.; Pesole, G.; Pavesi, G. RNentropy: An entropy-based tool for the detection of significant variation of gene expression across multiple RNA-Seq experiments. Nucleic Acids Res. 2018, 46. [Google Scholar] [CrossRef] [Green Version]
  17. Batista, M.V.; Ferreira, T.A.; Freitas, A.C.; Balbino, V.Q. An entropy-based approach for the identification of phylogenetically informative genomic regions of Papillomavirus. Infect. Genet. Evol. 2011, 11, 2026–2033. [Google Scholar] [CrossRef] [Green Version]
  18. Eisinga, R.; Breitling, R.; Heskes, T. The exact probability distribution of the rank product statistics for replicated experiments. FEBS Lett. 2013, 587, 677–682. [Google Scholar] [CrossRef]
  19. Hausser, J.; Strimmer, K. Entropy inference and the James-Stein estimator, with application to nonlinear gene association networks. J. Mach. Learn. 2009, 10, 1469–1484. [Google Scholar] [CrossRef]
  20. Subramanian, A.; Tamayo, P.; Mootha, V.K.; Mukherjee, S.; Ebert, B.L.; Gillette, M.A.; Paulovich, A.; Pomeroy, S.L.; Golub, T.R.; Lander, E.S.; et al. Gene set enrichment analysis: A knowledge-based approach for interpreting genome-wide expression profiles. Proc. Natl. Acad. Sci. USA 2005, 102, 15545–15550. [Google Scholar] [CrossRef] [Green Version]
  21. Chen, E.Y.; Tan, C.M.; Kou, Y.; Duan, Q.; Wang, Z.; Meirelles, G.; Koplev, S.; Jenkins, S.L.; Jagodnik, K.M.; Lachmann, A.; et al. Enrichr: Interactive and collaborative HTML5 gene list enrichment analysis tool. BMC Bioinform. 2013, 14, 128. [Google Scholar] [CrossRef] [PubMed] [Green Version]
  22. Kuleshov, M.V.; Jones, M.R.; Rouillard, A.D.; Fernandez, N.F.; Duan, Q.; Wang, Z.; Koplev, S.; Jenkins, S.L.; Jagodnik, K.M.; Lachmann, A.; et al. Enrichr: A comprehensive gene set enrichment analysis web server 2016 update. Nucleic Acids Res. 2016, 44. [Google Scholar] [CrossRef] [PubMed] [Green Version]
  23. Koutsandreas, T.; Binenbaum, I.; Pilalis, E.; Valavanis, I.; Papadodima, O.; Chatziioannou, A. Analyzing and visualizing genomic complexity for the derivation of the emergent molecular networks. Int. J. Monit. Surveill. Technol. 2016, 4, 30–49. [Google Scholar] [CrossRef] [Green Version]
  24. UZH, Robinson Statistical Bioinformatics Group. Available online: http://imlspenticton.uzh.ch/robinson_lab/benchmark_collection/ (accessed on 1 December 2018).
  25. Sinnaeve, P.R.; Donahue, M.P.; Grass, P.; Seo, D.; Vonderscher, J.; Chibout, S.-D.; Kraus, W.E.; Sketch, M., Jr.; Nelson, C.; Ginsburg, G.S.; et al. Gene expression patterns in peripheral blood correlate with the extent of coronary artery disease. PLoS ONE 2009, 4. [Google Scholar] [CrossRef] [PubMed]
  26. Davis, A.P.; Grondin, C.J.; Johnson, R.J.; Sciaky, D.; King, B.L.; Mcmorran, R.; Wiegers, J.; Wiegers, T.C.; Mattingly, C.J. The Comparative Toxicogenomics Database: Update 2017. Nucleic Acids Res. 2016, 45. [Google Scholar] [CrossRef] [Green Version]
  27. Maillet, M.; Lynch, J.M.; Sanna, B.; York, A.J.; Zheng, Y.; Molkentin, J.D. Cdc42 is an antihypertrophic molecular switch in the mouse heart. J. Clin. Investig. 2009, 119, 3079–3088. [Google Scholar] [CrossRef] [PubMed] [Green Version]
  28. Gu, R.; Zheng, D.; Bai, J.; Xie, J.; Dai, Q.; Xu, B. Altered melusin pathways involved in cardiac remodeling following acute myocardial infarction. Cardiovasc. Pathol. 2012, 21, 105–111. [Google Scholar] [CrossRef]
  29. Köhler, S.; Vasilevsky, N.; Engelstad, M.; Foster, E.; McMurry, J.; Ayme, S.; Baynam, G.; Bello, S.M.; Boerkoel, C.F.; Boycott, K.M.; et al. The Human Phenotype Ontology in 2017. Nucl. Acids Res. 2017, 45. [Google Scholar] [CrossRef]
  30. Blake, J.A.; Eppig, J.T.; Kadin, J.A.; Richardson, J.E.; Smith, C.L.; Bult, C.J. Mouse Genome Database (MGD)-2017: Community knowledge resource for the laboratory mouse. Nucleic Acids Res. 2016, 45. [Google Scholar] [CrossRef]
  31. Ringwald, M. The Mouse Gene Expression Database (GXD). Nucleic Acids Res. 2001, 29, 98–101. [Google Scholar] [CrossRef] [Green Version]
  32. Croft, D.; Mundo, A.F.; Haw, R.; Milacic, M.; Weiser, J.; Wu, G.; Caudy, M.; Garapati, P.; Gillespie, M.; Kamdar, M.R.; et al. The Reactome pathway knowledgebase. Nucleic Acids Res. 2013, 42. [Google Scholar] [CrossRef] [PubMed]
  33. Fabregat, A.; Jupe, S.; Matthews, L.; Sidiropoulos, K.; Gillespie, M.; Garapati, P.; Robin, H.; Bijay, J.; Florian, K.; Bruce, M.; et al. The Reactome Pathway Knowledgebase. Nucleic Acids Res. 2017, 46. [Google Scholar] [CrossRef]
  34. Suh, N.; Lee, E. Antioxidant effects of selenocysteine on replicative senescence in human adipose-derived mesenchymal stem cells. BMB Rep. 2017, 50, 572. [Google Scholar] [CrossRef] [PubMed]
  35. DbGaP/Database of Genotypes and Phenotypes National Center for Biotechnology Information. National Library of Medicine (NCBI/NLM). Available online: https://www.ncbi.nlm.nih.gov/gap (accessed on 21 March 2019).
  36. Santos, A.; Tsafou, K.; Stolte, C.; Pletscher-Frankild, S.; O’Donoghue, S.I.; Jensen, L.J. Comprehensive comparison of large-scale tissue expression datasets. Peer J. 2015. [Google Scholar] [CrossRef]
  37. Lachmann, A.; Torre, D.; Keenan, A.B.; Jagodnik, K.M.; Lee, H.J.; Silverstein, M.C.; Wang, L.; Maayan, A. Massive Mining of Publicly Available RNA-seq Data from Human and Mouse. Nat. Commun 2017, 9, 1366. [Google Scholar] [CrossRef] [PubMed] [Green Version]
  38. Su, A.I.; Wiltshire, T.; Batalov, S.; Lapp, H.; Ching, K.A.; Block, D.; Zhang, J.; Soden, R.; Hayakawa, M.; Kreiman, G.; et al. A gene atlas of the mouse and human protein-encoding transcriptomes. Proc. Natl. Acad. Sci. USA 2004, 101, 6062–6067. [Google Scholar] [CrossRef] [Green Version]
  39. Cowley, G.S.; Weir, B.A.; Vazquez, F.; Tamayo, P.; Scott, J.A.; Rusin, S.; East-Seletsky, A.; Ali, L.D.; Gerath, W.F.; Pantel, S.E.; et al. Parallel genome-scale loss of function screens in 216 cancer cell lines for the identification of context-specific genetic dependencies. Sci. Data 2014, 1. [Google Scholar] [CrossRef]
  40. Kucukali, C.I.; Aydin, M.; Ozkok, E.; Bilge, E.; Orhan, N.; Zengin, A.; Kara, I. Do schizophrenia and bipolar disorders share a common disease susceptibility variant at the MMP3 gene? Prog. Neuro Psychopharmacol. Biol. Psychiatry 2009, 33, 557–561. [Google Scholar] [CrossRef]
  41. Gurvich, A.; Begemann, M.; Dahm, L.; Sargin, D.; Miskowiak, K.; Ehrenreich, H. A role for prostaglandins in rapid cycling suggested by episode-specific gene expression shifts in peripheral blood mononuclear cells: A preliminary report. Bipolar Disor. 2014, 16, 881–888. [Google Scholar] [CrossRef]
  42. Savitz, J.B.; Teague, T.K.; Misaki, M.; Macaluso, M.; Wurfel, B.E.; Meyer, M.; Drevets, D.; Yates, W.; Gleason, O.; Drevets, W.C.; et al. Treatment of bipolar depression with minocycline and/or aspirin: An adaptive, 2x2 double-blind, randomized, placebo-controlled, phase IIA clinical trial. Transl. Psychiatry 2018, 8. [Google Scholar] [CrossRef] [Green Version]
  43. Rossner, P.; Tulupova, E.; Rossnerova, A.; Libalova, H.; Honkova, K.; Gmuender, H.; Pastorkova, A.; Svecova, V.; Topinka, J.; Sram, R.J. Reduced gene expression levels after chronic exposure to high concentrations of air pollutants. Mutat. Res. Fundam. Mol. Mech. Mutagen. 2015, 780, 60–70. [Google Scholar] [CrossRef] [PubMed]
  44. Online Mendelian Inheritance in Man, OMIM (TM). McKusick-Nathans Institute of Genetic Medicine, Johns Hopkins University (Baltimore, MD) and National Center for Biotechnology Information, National Library of Medicine (Bethesda, MD). Available online: http://www.ncbi.nlm.nih.gov/omim/ (accessed on 21 March 2019).
  45. Rajagopalan, S.; Brook, R.D. Air pollution and type 2 diabetes: Mechanistic insights. Diabetes 2012, 61, 3037–3045. [Google Scholar] [CrossRef] [Green Version]
  46. Ashburner, M.; Ball, C.A.; Blake, J.A.; Botstein, D.; Butler, H.; Cherry, J.M.; Davis, A.P.; Dolinski, K.; Dwight, S.S.; Eppig, J.T.; et al. Gene Ontology: Tool for the unification of biology. Nat. Genet. 2000, 25, 25–29. [Google Scholar] [CrossRef] [Green Version]
  47. Expansion of the Gene Ontology knowledgebase and resources. Nucleic Acids Res. 2016, 45. [CrossRef] [Green Version]
  48. Iii, C.A. Lung Cancer, Cardiopulmonary Mortality, and Long-term Exposure to Fine Particulate Air Pollution. JAMA 2002, 287, 1132. [Google Scholar] [CrossRef] [Green Version]
  49. Huiming, L.; Xin, Q.; Qin’geng, W. Heavy Metals in Atmospheric Particulate Matter: A Comprehensive Understanding Is Needed for Monitoring and Risk Mitigation. Am. Chem. Soc. 2013, 47, 13210–13211. [Google Scholar] [CrossRef]
  50. Liu, Y.; Aryee, M.J.; Padyukov, L.; Fallin, M.D.; Hesselberg, E.; Runarsson, A.; Reinius, L.; Acevedo, N.; Taub, M.; Ronninger, M.; et al. Epigenome-wide association data implicate DNA methylation as an intermediary of genetic risk in rheumatoid arthritis. Nat. Biotechnol. 2013, 31, 142–147. [Google Scholar] [CrossRef] [PubMed]
  51. Kular, L.; Liu, Y.; Ruhrmann, S.; Zheleznyakova, G.; Marabita, F.; Gomez-Cabrero, D.; James, T.; Ewing, E.; Lindén, M.; Górnikiewicz, B.; et al. DNA methylation as a mediator of HLA-DRB1*15:01 and a protective variant in multiple sclerosis. Nat. Commun. 2018, 9, 1–15. [Google Scholar] [CrossRef]
  52. Kanehisa, M.; Goto, S. KEGG: Kyoto encyclopedia of genes and genomes. Nucleic Acids Res. 2000, 28, 27–30. [Google Scholar] [CrossRef] [PubMed]
  53. Slenter, D.N.; Kutmon, M.; Hanspers, K.; Riutta, A.; Windsor, J.; Nunes, N.; Mélius, J.; Cirillo, E.; Coort, S.L.; Digles, D.; et al. WikiPathways: A multifaceted pathway database bridging metabolomics to other omics research. Nucleic Acids Res. 2017, 46. [Google Scholar] [CrossRef]
  54. Hohensinner, P.J.; Goronzy, J.J.; Weyand, C.M. Telomere dysfunction, autoimmunity and aging. Aging Dis. 2011, 2, 524. [Google Scholar] [PubMed]
  55. Hohensinner, P.J.; Goronzy, J.J.; Weyand, C.M. Targets of immune regeneration in rheumatoid arthritis. Mayo Clin. Proc. 2014, 89, 563–575. [Google Scholar] [CrossRef] [PubMed] [Green Version]
  56. Georgin-Lavialle, S.; Aouba, A.; Mouthon, L.; Londono-Vallejo, J.A.; Lepelletier, Y.; Gabet, A.S.; Hermine, O. The telomere/telomerase system in autoimmune and systemic immune-mediated diseases. Autoimmun. Rev. 2010, 9, 646–651. [Google Scholar] [CrossRef] [PubMed]
  57. Lehner, M.J.; Coehlo, N.K.; Zhang, Z.; Bianco, F.B.; Wang, J.; Rice, J.A.; Protopapas, P.; Alcock, C.; Axelrod, T.; Byun, Y.-I.; et al. The TAOS Project: Statistical Analysis of Multi-Telescope Time Series Data. Publ. Astron. Soc. Pac. 2010, 122, 959–975. [Google Scholar] [CrossRef] [Green Version]
  58. Aasi, J.; Abbott, B.P.; Abbott, R.; Abbott, T.D.; Abernathy, M.R.; Acernese, F.; Ackley, K.; Adams, C.; Adams, T.; Addesso, P.; et al. First low frequency all-sky search for continuous gravitational wave signals. Phys. Rev. D. 2016, 93, 042007. [Google Scholar] [CrossRef] [Green Version]
  59. Breitling, R.; Herzyk, P. Rank-Based Methods As A Non-Parametric Alternative Of The T-Statistic For The Analysis Of Biological Microarray Data. J. Bioinform. Comput. Biol. 2005, 3, 1171–1189. [Google Scholar] [CrossRef]
  60. Thomas, P.D.; Campbell, M.J.; Kejariwal, A.; Mi, H.; Karlak, B.; Daverman, R.; Diemer, K.; Muruganujan, A.; Narechania, A. PANTHER: A library of protein families and subfamilies indexed by function. Genome Res. 2003, 13, 2129–2141. [Google Scholar] [CrossRef] [Green Version]
  61. Hermans, K.C.; Blankesteijn, W.M. Wnt Signaling in Cardiac Disease. Compr. Physiol. 2015, 5, 1183–1209. [Google Scholar] [CrossRef]
Figure 1. Entropic ranks workflow. Entropic ranks builds upon the rank products methodology and assesses its results in terms of the progression of Shannon entropy over a sliding window.
Applsci 10 07077 g001
Figure 2. (A) Characteristic entropy distribution for GSE60767 data, winter 2009, upregulated. Parameters used were: window size 220, 20 bins for discretization and advancement of the sliding window gene-by-gene. The initial, low-entropy set is clearly defined (initial blue-colored area). The low-entropy area near the end is attributed to a single difference value oscillation, lowering the entropy of the 220 windows containing it. (B) The corresponding distribution of consecutive RP score differences. The initial, signal-dominated area always overlaps with genes selected by the original rank products. The latter, noise-dominated area represents features to be excluded.
Applsci 10 07077 g002
Figure 3. GSE42861: differentially methylated genes mapped onto Gene Ontology using BioInfoMiner.
Applsci 10 07077 g003
Figure 4. SRP127667: differentially expressed genes mapped onto Gene Ontology using BioInfoMiner.
Applsci 10 07077 g004
Table 1. Number of differentially expressed features identified in the initial study compared with entropic rank results. The last column notes the maximum p-value calculated through rank products for these features. The number of features shows no correlation with sample size and the number identified in the initial research.
GEO AccessionTypeOriginal Publication SEntropic Ranks SRP Maximum p-Value
GSE12288Differentially expressed16018 *<0.0001
86 **<0.0001
GSE69486Upregulated1271350.0027
Downregulated330890.0083
GSE60767 [winter 2009]Upregulated029<0.0001
Downregulated053<0.0001
GSE60767 [summer 2009]Upregulated033<0.0001
Downregulated026<0.0001
GSE60767 [winter 2010]Upregulated034<0.0001
Downregulated041<0.0001
GSE42861UpregulatedNA24<0.0001
DownregulatedNA98<0.0001
SRP127667UpregulatedNA32<0.0001
DownregulatedNA37<0.0001
*: upregulated, **: downregulated.
Table 2. GEO data sets used for verification.
GEO AccessionOrganismType of SamplesArraySamplesCasesControls
GSE12288H. sapiensTotal RNA from leukocytes in peripheral bloodAffymetrix Human Genome U133A Array222110112
GSE69486H. sapiensTotal RNA from fibroblasts from skin biopsiesIllumina HumanHT-12 V4.0 Expression Beadchip12102
GSE60767H. sapiensTotal RNA was extracted from leukocytesIllumina HumanHT-12 V3.0 Expression Beadchip466312154
GSE42861H. sapiensDNA from blood leukocytesIllumina HumanMethylation450 BeadChip442024
SRP127667H. sapiensDNA from sorted cardiac myocyte nucleiIllumina HiSeq 250013103
Table 3. GSE12288: Results of the comparison of differentially expressed genes identified by the initial study and entropic ranks with cardiovascular diseases through CTD.
Disease NameDisease IDDisease CategoriesCorrected p-Value for Original AnalysisCorrected p-Value for Entropic Ranks
StrokeMESH:D020521Cardiovascular disease|nervous system disease0.004080.00504
Infarction, Middle Cerebral ArteryMESH:D020244Cardiovascular disease|nervous system disease5.88 × 10−60.00712
Cardiovascular DiseasesMESH:D002318Cardiovascular disease-0.01264
Cerebral Arterial DiseasesMESH:D002539Cardiovascular disease|nervous system disease-0.01484
Cerebral InfarctionMESH:D002544Cardiovascular disease|nervous system disease-0.01484
Intracranial Arterial DiseasesMESH:D020765Cardiovascular disease|nervous system disease-0.01829
Vascular DiseasesMESH:D014652Cardiovascular disease1.23 × 10−40.01950

