Article

Effective Feature Selection Method for Deep Learning-Based Automatic Modulation Classification Scheme Using Higher-Order Statistics †

School of Electronic Engineering, Soongsil University, Seoul 06978, Korea
*
Author to whom correspondence should be addressed.
This paper is an extended version of the conference paper presented in the 1st International Conference on Artificial Intelligence in Information and Communication (ICAIIC 2019), Okinawa, Japan, 11–13 February 2019.
Appl. Sci. 2020, 10(2), 588; https://doi.org/10.3390/app10020588
Submission received: 30 June 2019 / Revised: 3 January 2020 / Accepted: 8 January 2020 / Published: 13 January 2020

Abstract

:
Recently, in order to satisfy the requirements of commercial communication systems and military communication systems, automatic modulation classification (AMC) schemes have been considered. As a result, various artificial intelligence algorithms such as a deep neural network (DNN), a convolutional neural network (CNN), and a recurrent neural network (RNN) have been studied to improve the AMC performance. However, since the AMC process should be operated in real time, the computational complexity must be considered low enough. Furthermore, there is a lack of research to consider the complexity of the AMC process using the data-mining method. In this paper, we propose a correlation coefficient-based effective feature selection method that can maintain the classification performance while reducing the computational complexity of the AMC process. The proposed method calculates the correlation coefficients of second, fourth, and sixth-order cumulants with the proposed formula and selects an effective feature according to the calculated values. In the proposed method, the deep learning-based AMC method is used to measure and compare the classification performance. From the simulation results, it is indicated that the AMC performance of the proposed method is superior to the conventional methods even though it uses a small number of features.

1. Introduction

In an effort to improve the transmission efficiency of satellite communication and mobile communication systems, the systems should consider adaptive changing parameters such as a modulation scheme, a transmission rate and a carrier frequency according to a channel state [1,2]. As part of this study, in order to effectively classify the modulation scheme, an automatic modulation classification (AMC) method has been widely studied [3,4]. Generally, the receiver can estimate the modulation scheme of the transmitted signal in the commercial system. However, since the communication parameters of the enemy cannot be accurately estimated in military communications, the research has been oriented to estimate the communication parameters by using only the received signals [5]. Thus, in order to improve the jamming performance against the enemy communication system, various research works have been undertaken to classify the modulation scheme by the AMC method [6]. The techniques for the AMC can be roughly classified into two types. The first type maximizes the likelihood function based on the statistical model from the received signal. However, this method has poor performance due to the error that occurs when there is a change in the channel characteristics in the real environment. Moreover, considering different models, the computation of the algorithm becomes very complicated and the calculation effort becomes large [7]. The second type uses the machine-learning technique. This method uses training data to train machine learning models to classify modulation type. Assuming that the training data is similar to the actual data, it can demonstrate good performance even though the computational complexity is lower than the likelihood method. Therefore, in order to classify the modulation type quickly and accurately, the machine-learning algorithm is mainly used. The AMC scheme based on machine learning consists of a feature extraction step that extracts features from the received signal and a signal classification step that classifies the modulation type.
There are various techniques such as a deep neural network (DNN) [8], a convolutional neural network (CNN) [9] and a recurrent neural network (RNN) [10] for the AMC that have been studied. The CNN algorithm is a method that shows excellent performance in image processing. The research has been carried out to classify the signals by using the constellation images of the received signals as the features and to classify the signals by imaging the statistical characteristics [9]. The RNN algorithm is an excellent method for analyzing time-series data but requires algorithmic complexity and high calculation effort compared to performance [10]. On the other hand, the DNN algorithm can learn complex structures from various data and shows good performance for various machine-learning problems in recent years. The features frequently used in the AMC technique based on machine learning use the higher-order statistic cumulant and signal size, frequency, phase dispersion, and wavelet coefficient [11,12]. Therefore, in this paper, the cumulant is used as a feature for the AMC and as input data of the DNN algorithm. Various research works have focused on machine-learning methods, rather than analyzing features used as input data. Therefore, in this paper, we use only the features that greatly affect the classification performance through the proposed algorithm to reduce the computational complexity and to identify the received signal quickly while using the basic DNN structure algorithm. In reference [13], we have confirmed the difference of signal classification performance according to the features used as input data in the DNN algorithm and confirmed the features with high and low importance. Based on this, an effective feature selection method using a correlation coefficient is exploited to obtain the representative values and to verify the classification performance [14]. The proposed method is more effective than the conventional method, which uses mutual information and correlation coefficients in selecting five features [15,16]. In this paper, we compare the performance of the proposed method using only the correlation coefficient in various environments, the conventional method using mutual information and correlation coefficients, and three methods using only mutual information. In addition, we confirmed the performance of the proposed method with the addition of four kinds of sixth-order cumulants with large variability in the low signal-to-noise ratio (SNR) environment besides the second and fourth-order cumulant. In order to evaluate the proposed method, the representative value was selected from various cumulants by using each method and two kinds of the simulation were conducted. In the first simulation, in order to find the effective features values, we ranked the cumulants based on the calculation from each method. Then, we sequentially measured the classification performance by excluding the feature values one by one. In the second set of simulations, in order to measure the classification performance according to the group, the cumulants were divided into three groups (top, middle, and bottom) based on the ranking obtained from the efficient features extraction method. The following is a summary of how each group is divided.
  • Top group: the five highest important representative values of each method.
  • Middle group: the five medium important representative values of each method.
  • Bottom group: the five lowest important representative values of each method.
The cumulants in each group were used as the input data of the DNN algorithm to measure the classification performance. The three AMC environments that use the features of each group as input values were implemented and the superiority of the proposed method was confirmed according to the group performance.
The rest of the paper is organized as follows. In Section 2, we explain the features and data analysis method. In Section 3, we introduce the proposed method and the conventional method. In Section 4 we describe the DNN structure used in this paper and present the simulation results. Finally, Section 5 provides the conclusions of the paper.

2. Data Analysis Techniques

2.1. Cumulant

The cumulant is one of the typical statistical features used in the hierarchical AMC scheme [17]. In this paper, the higher-order cumulants for baseband received signal samples r n generated in the additive white Gaussian noise (AWGN) channel are extracted as representative features and used as the inputs to the DNN algorithm. Since the proposed method exploits the correlation characteristics, we consider the high-order cumulants as the feature values. Table 1 summarizes the expressions for the second-, fourth- and sixth-order cumulants [16,18] used in this paper.
Here, C x y is the ( x + y )-th order cumulant and M x y E [ r n x y r * n ) y , is the x + y -th order moment of the received signal r n . Table 2 summarizes the theoretical absolute value according to the modulation types; BPSK (binary phase shift keying), QPSK (quadrature phase shift keying), 8-PSK, 16-QAM (quadrature amplitude modulation).

2.2. Correlation

In this paper, we use the correlation method which is one of data analysis methods to select the effective feature. Correlation refers to the similarity between data, so features with a high correlation coefficient between feature values are relatively inefficient in the AMC processes. The Pearson correlation for the variables X ,   Y is [19]:
cor X , Y =   C X , Y σ X σ Y ,
where C X , Y is the covariance of the variables X and Y . Thus, (1) can be expressed as:
cor X , Y =   i = 1 k x i x ¯ y i y ¯ σ X σ Y ,
where σ X and σ Y are the standard deviations of X and Y . From this correlation coefficient, information on other data can be obtained through one data. The proposed method uses correlation as a data analysis method to select effective features [19].

2.3. Mutual Information Quantity

When classifying a signal using the DNN algorithm, the input data should be selected to include as much information as possible. The mutual information quantity is one of the methods used in measuring the information of arbitrary variables used for this purpose [15]. When the modulation scheme information used in the transmitter is represented by c , mutual information values for the i -th feature and the module c are defined as:
I x i ; c =   P x i , c log P x i , c P x i P c d x i d c ,
where P x i , c is the joint probability distribution of x i and c . The high mutual information value can be useful for the AMC because the features contains a lot of information about the module c [15].

3. Proposed Effective Feature Selection Method

3.1. Conventional Effective Feature Selection Based on Mutual Information and Correlation

The conventional method based on mutual information and correlation performs preprocessing before using it for input data. This is to reduce the computational complexity of the algorithm and maintain the identification performance. The conventional mutual information and correlation method for extracting an efficient feature is expressed as [15]:
m a x x j X S m 01 I x j ; c 1 m 1 x i S m 1 I x j ; x i ,
where I x j ; c denotes the mutual information value between the feature value and the corresponding module, S m denotes a set of selected feature values up to m runs, and X denotes a set of all feature values. A representative value according to each feature can be obtained from (4) and a feature having a large representative value is the most efficient feature. Table 3 shows the representative values of the second-, fourth-, and sixth-order cumulants of the conventional method [15]. As can be observed from the table, the conventional method indicates that the most effective feature is C 60 and the most ineffective feature is C 21 in the 10 dB SNR environment.

3.2. Conventional Effective Feature Selection Based on Mutual Information

The conventional mutual information method is used among the data analysis methods and the effective feature is selected from the information between the digital signals and the feature [20]. The mutual information quantities are expressed as
E C V I i =   i M I r j , t i j ,
where r j denotes the j -th received signal and t i j denotes the i -th characteristic value of the j -th received signal. If the amount of mutual information between the received signal and a specific feature is high, the features is valuable on the AMC process because it contains more information regarding the received signal. Therefore, the features having the largest representative value obtained from (5) can be considered an effective feature that greatly affects the AMC performance. Table 4 shows the representative values obtained from (5) of the mutual information method [20]. As shown in the table, mutual information method identifies C 62 as the most effective feature and C 21 as the most ineffective feature in the 10 dB SNR environment.

3.3. Proposed Effective Feature Selection Based on Correlation Coefficient

The optimal selection of the input data determines the optimal group of feature by comparing all combinations of feature. However, it is difficult to perform because it requires a large amount of computation. Therefore, in this paper, in order to reduce the computational complexity of the AMC and to maintain the classification performance, we proposed an effective feature method with a large influence on the classification performance based on the analysis of the correlation coefficient. Thus, the effect of each feature on the classification performance should be numerically expressed as a representative value. The proposed method is expressed as:
E C V i =   j = 1 M k = 1 k j M c o r x i k , x i j ,
where M is the number of features, x i j is the j -th feature of the i -th modulation type, and cor x i k , x i j is the correlation coefficient between the two features. In this manner, one representative value can be obtained according to each characteristic. A characteristic with a large representative value has a little influence on the AMC performance. On the other hand, a feature with a small representative value has a strong influence on the classification performance and becomes the effective feature required for the AMC. As shown in Table 5, the proposed method indicates that the most effective feature is C 40 and the most ineffective feature is C 21 in the SNR 10 dB environment. As shown in Table 3, Table 4 and Table 5 the effective feature for each method is different, and the performance of each method is verified through two sets of simulations.
In the AMC structure of this paper, the modulated signals to be classified are generated in the AWGN channel, and the cumulants are extracted for each signal. The extracted cumulants are represented by one representative value through the proposed method as shown in Equation (6). In order to reduce the computational complexity of the algorithm and to classify the modulation type quickly, it extracts the top feature and classifies the modulation type after learning by using it as input data to the DNN algorithm. The proposed AMC structure is shown in Figure 1.

4. Simulation Results

4.1. Deep Neural Network (DNN) Structure and Simulation Environments

In this paper, five types of digital communication signals BPSK, QPSK, 8-PSK, 16-QAM, and 64-QAM are considered. Additionally, the nine characteristic values consisting of the second, fourth and sixth-order cumulant are used. The structure of the DNN algorithm consists of an input layer with nine feature in a fully connected layer structure, a hidden layer consisting of three layers, 40 nodes, 20 nodes, and 10 nodes, and finally an output layer for classifying signals. In the hidden layer, the Rectified Linear Unit (ReLU) function [21] is used and in the last output layer, each modulation type is classified by Softmax [22]. Table 6 shows the nonlinear activation functions considered in this paper. Since the Softmax function can produce the output in terms of probability, we can calculate the accuracy for each classified signal. The DNN structure for the first set of simulations is shown in Figure 2.
In both sets of simulations, we trained the DNN algorithm several times for hyperparameter optimization. Since the DNN is a very complex structure, it is difficult to find the optimal weighting coefficients in one calculation. Therefore, in this paper we set up the hyperparameters and trained the DNN algorithms through the following standard procedures. In the first step, we adjusted the hyperparameters and trained the DNN using the backpropagation algorithm based on the gradient descent, and applied the batch normalization to prevent the overfitting during the training. Next, the validation errors were counted and the training was stopped to prevent overfitting when the validation error started to increase. Also, when the validation errors did not decrease anymore, we continued to train by cutting the learning rate in half. We utilized 20% of the input data for the validation.
In order to train the above DNN structure, the epoch was set to 200, batch size to 64, and a total of 50,000 units of data (10,000 digital modulation symbols by each of 5 modulation schemes considered) were generated in various SNR environments. Then, 9 features ( C 20 ,   C 21 ,   C 40 ,   C 41 ,   C 42 ,   C 60 ,   C 61 ,   C 62 ,   C 63 ) were considered for each digital modulation symbol, yielding 450,000 features used as the input data. In other words, the number of training data units is 450,000, and that of the test and the validation data is 90,000 each, which is 20% of the training data. The parameters of the first DNN obtained through the above process are summarized in Table 7.

4.2. Simulation Result

In this paper, we propose an efficient feature extraction method to reduce training time while maintaining AMC performance. In order to evaluate the proposed method, the representative value was selected from various cumulants by using each method and two sets of simulations were conducted. In the first simulation, in order to find the effective feature values, we ranked the cumulants based on the calculation from each method. Then, we measured the classification performance sequentially by excluding the feature values one by one. The structure of DNN is the same environment except for the input layer. Table 8 summaries the classification performance according to elimination of each feature.
In the 10 dB SNR environment, the most essential or effective feature is C 40 and the most unnecessary or ineffective feature is C 21 . In the case of the proposed method, these features C 40 and C 21 are identified precisely. On the other hand, the mutual information method identified C 62 as the most essential feature and C 21 as the most unnecessary feature. In the case of the conventional method, the most effective feature was extracted as C 60 and the most unnecessary feature was extracted as C 21 . In the proposed method, the most effective feature and the most unnecessary feature were accurately identified in the 10 dB SNR environment, while the other two methods accurately identified the unnecessary feature but failed to extract the most effective feature. In other words, the proposed method shows superior performance in extracting effective features compared to the conventional methods. Table 9 shows the difference in the classification performance when all the features are used and when the effective features are excluded by each method. If a method shows the highest value for a given SNR value in the table, that method is the best in correctly identifying the effective features.
In [14], only the second and the fourth-order cumulants are considered, and the variation of characteristic values is small even in low SNR environments. Therefore, there was little variation in efficiency ranking in a low SNR environment. However, in this paper, it can be seen that the order of efficiency fluctuates significantly in a low SNR environment due to the sixth-order cumulant with high variability. In this manner, when the feature with a large variability is used, the ranking of the efficiency value of each feature can be changed according to each SNR. However, since the performance is also changed to a similar trend, it becomes suitable even in environments using the feature with high volatility. The proposed method shows higher performance not only when using the second- and fourth-order cumulants but also when using the sixth-order cumulant.
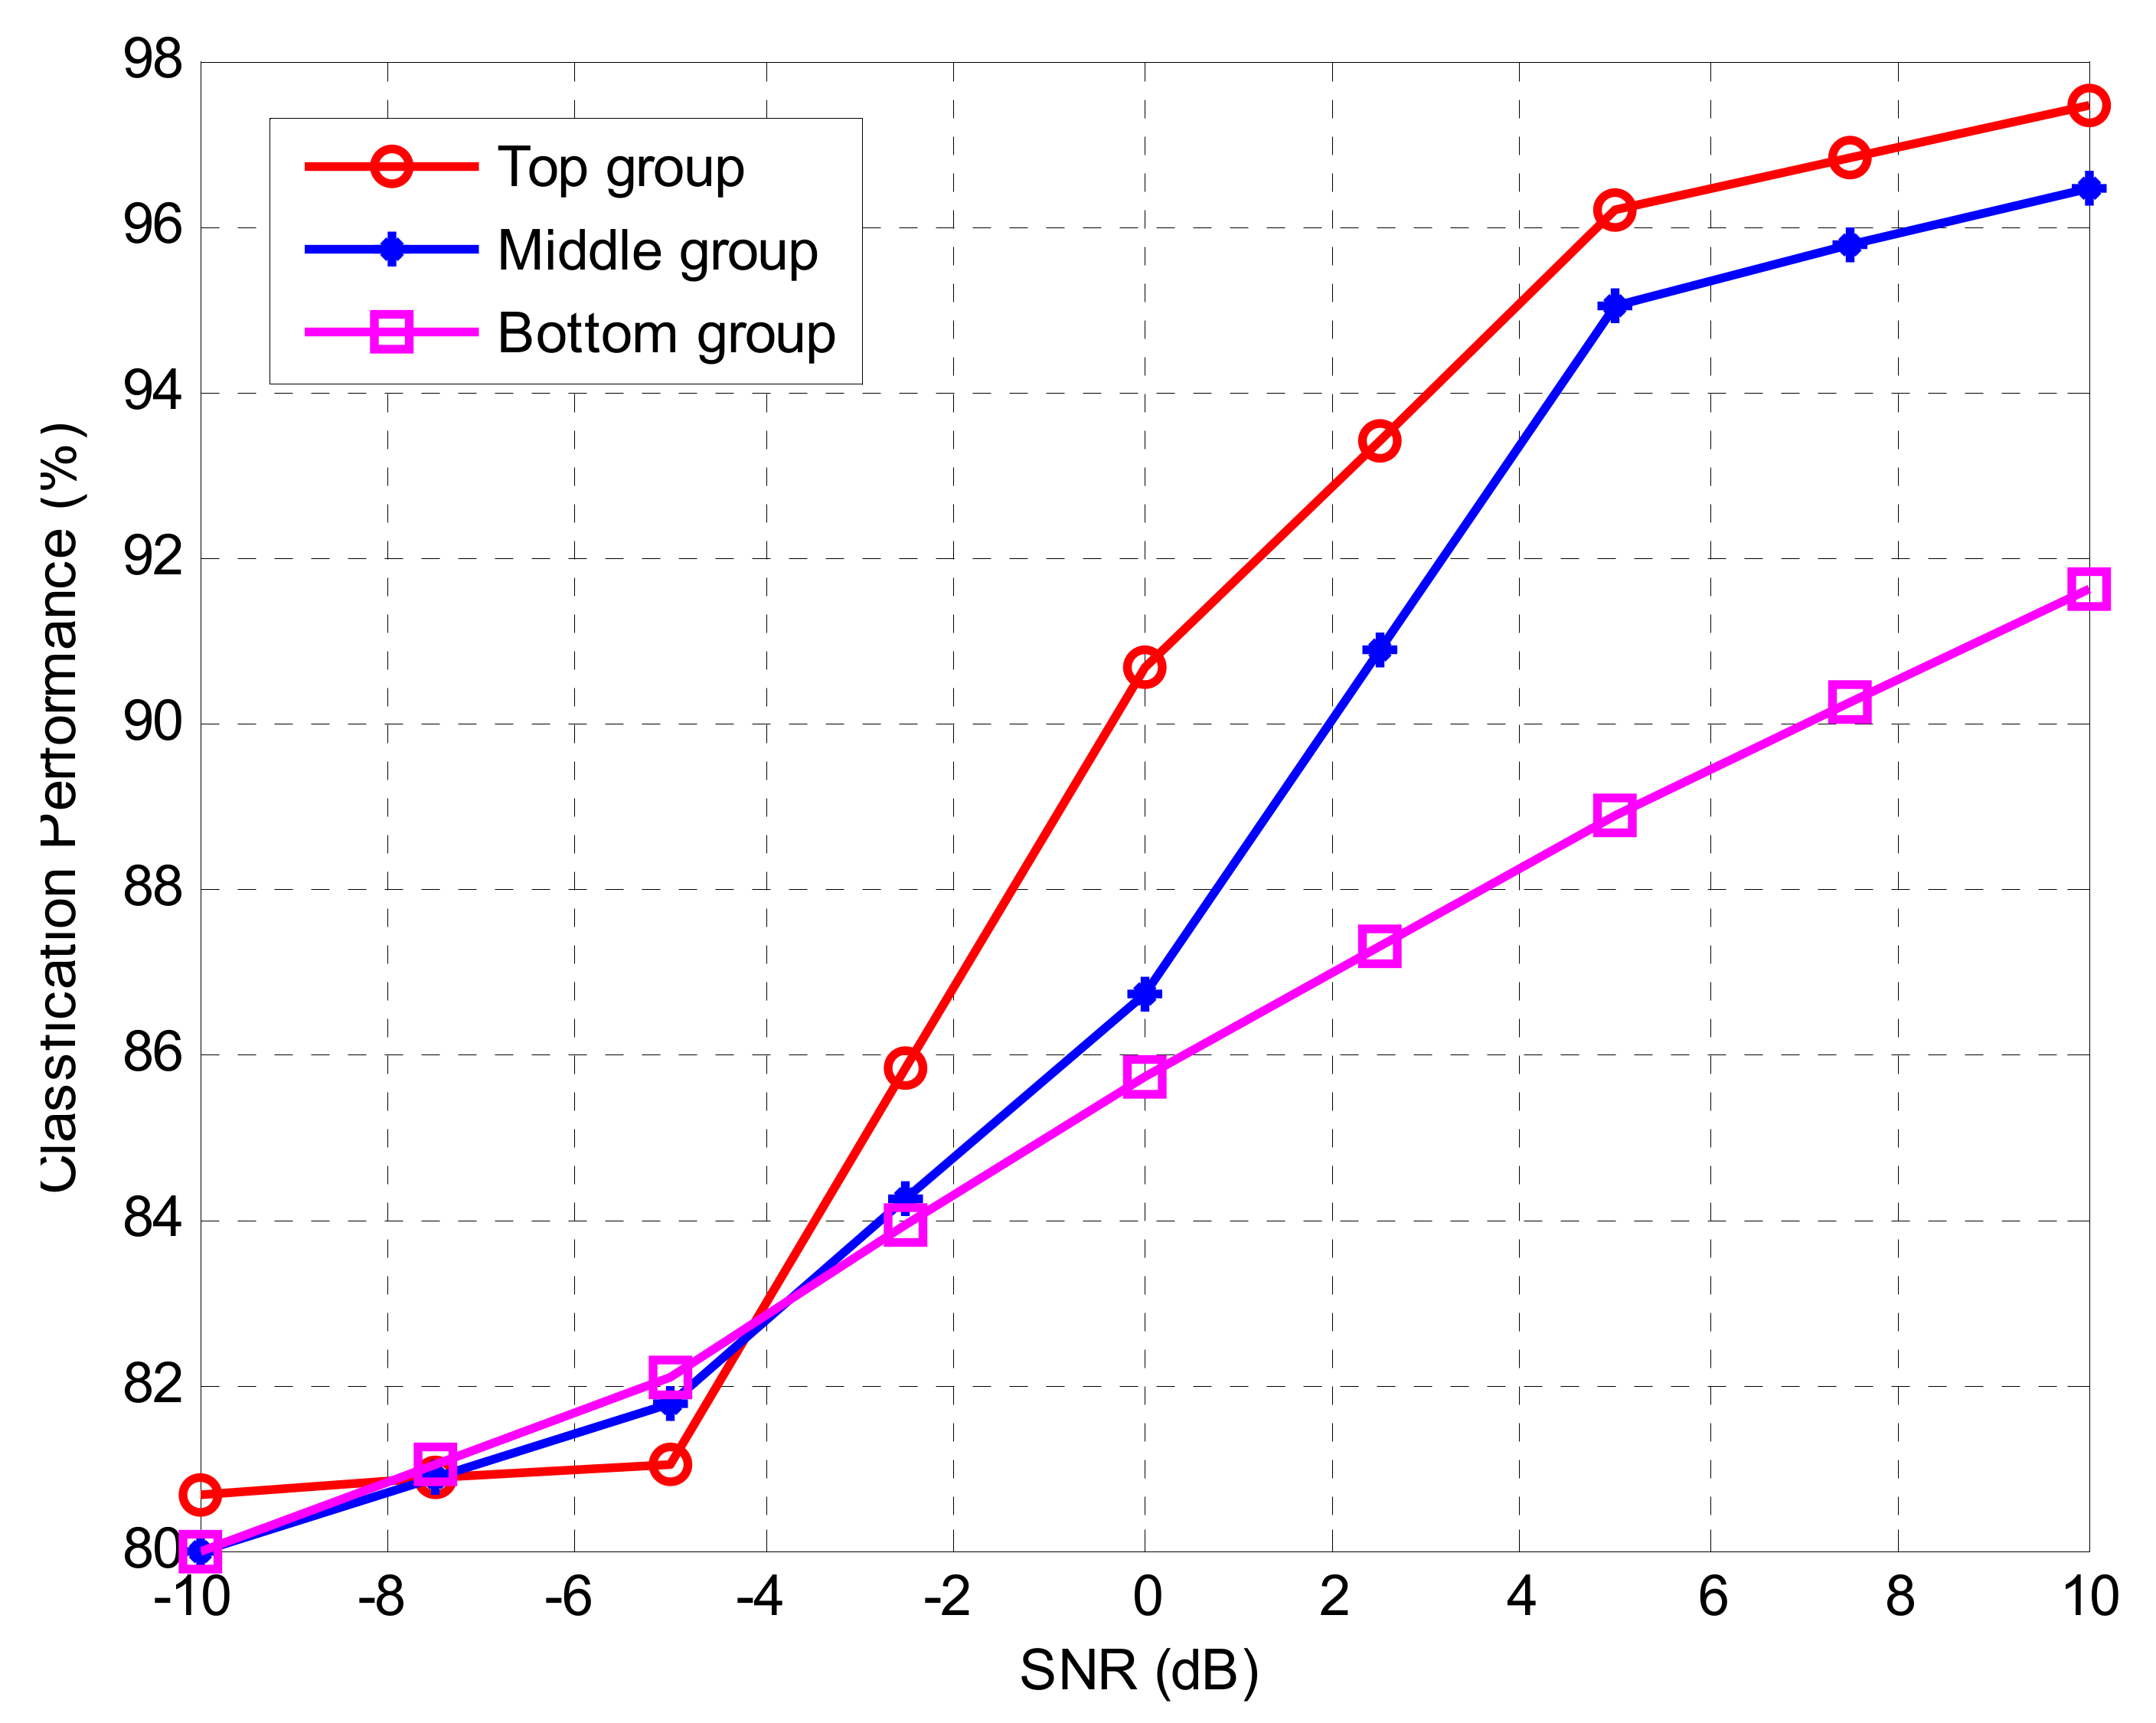
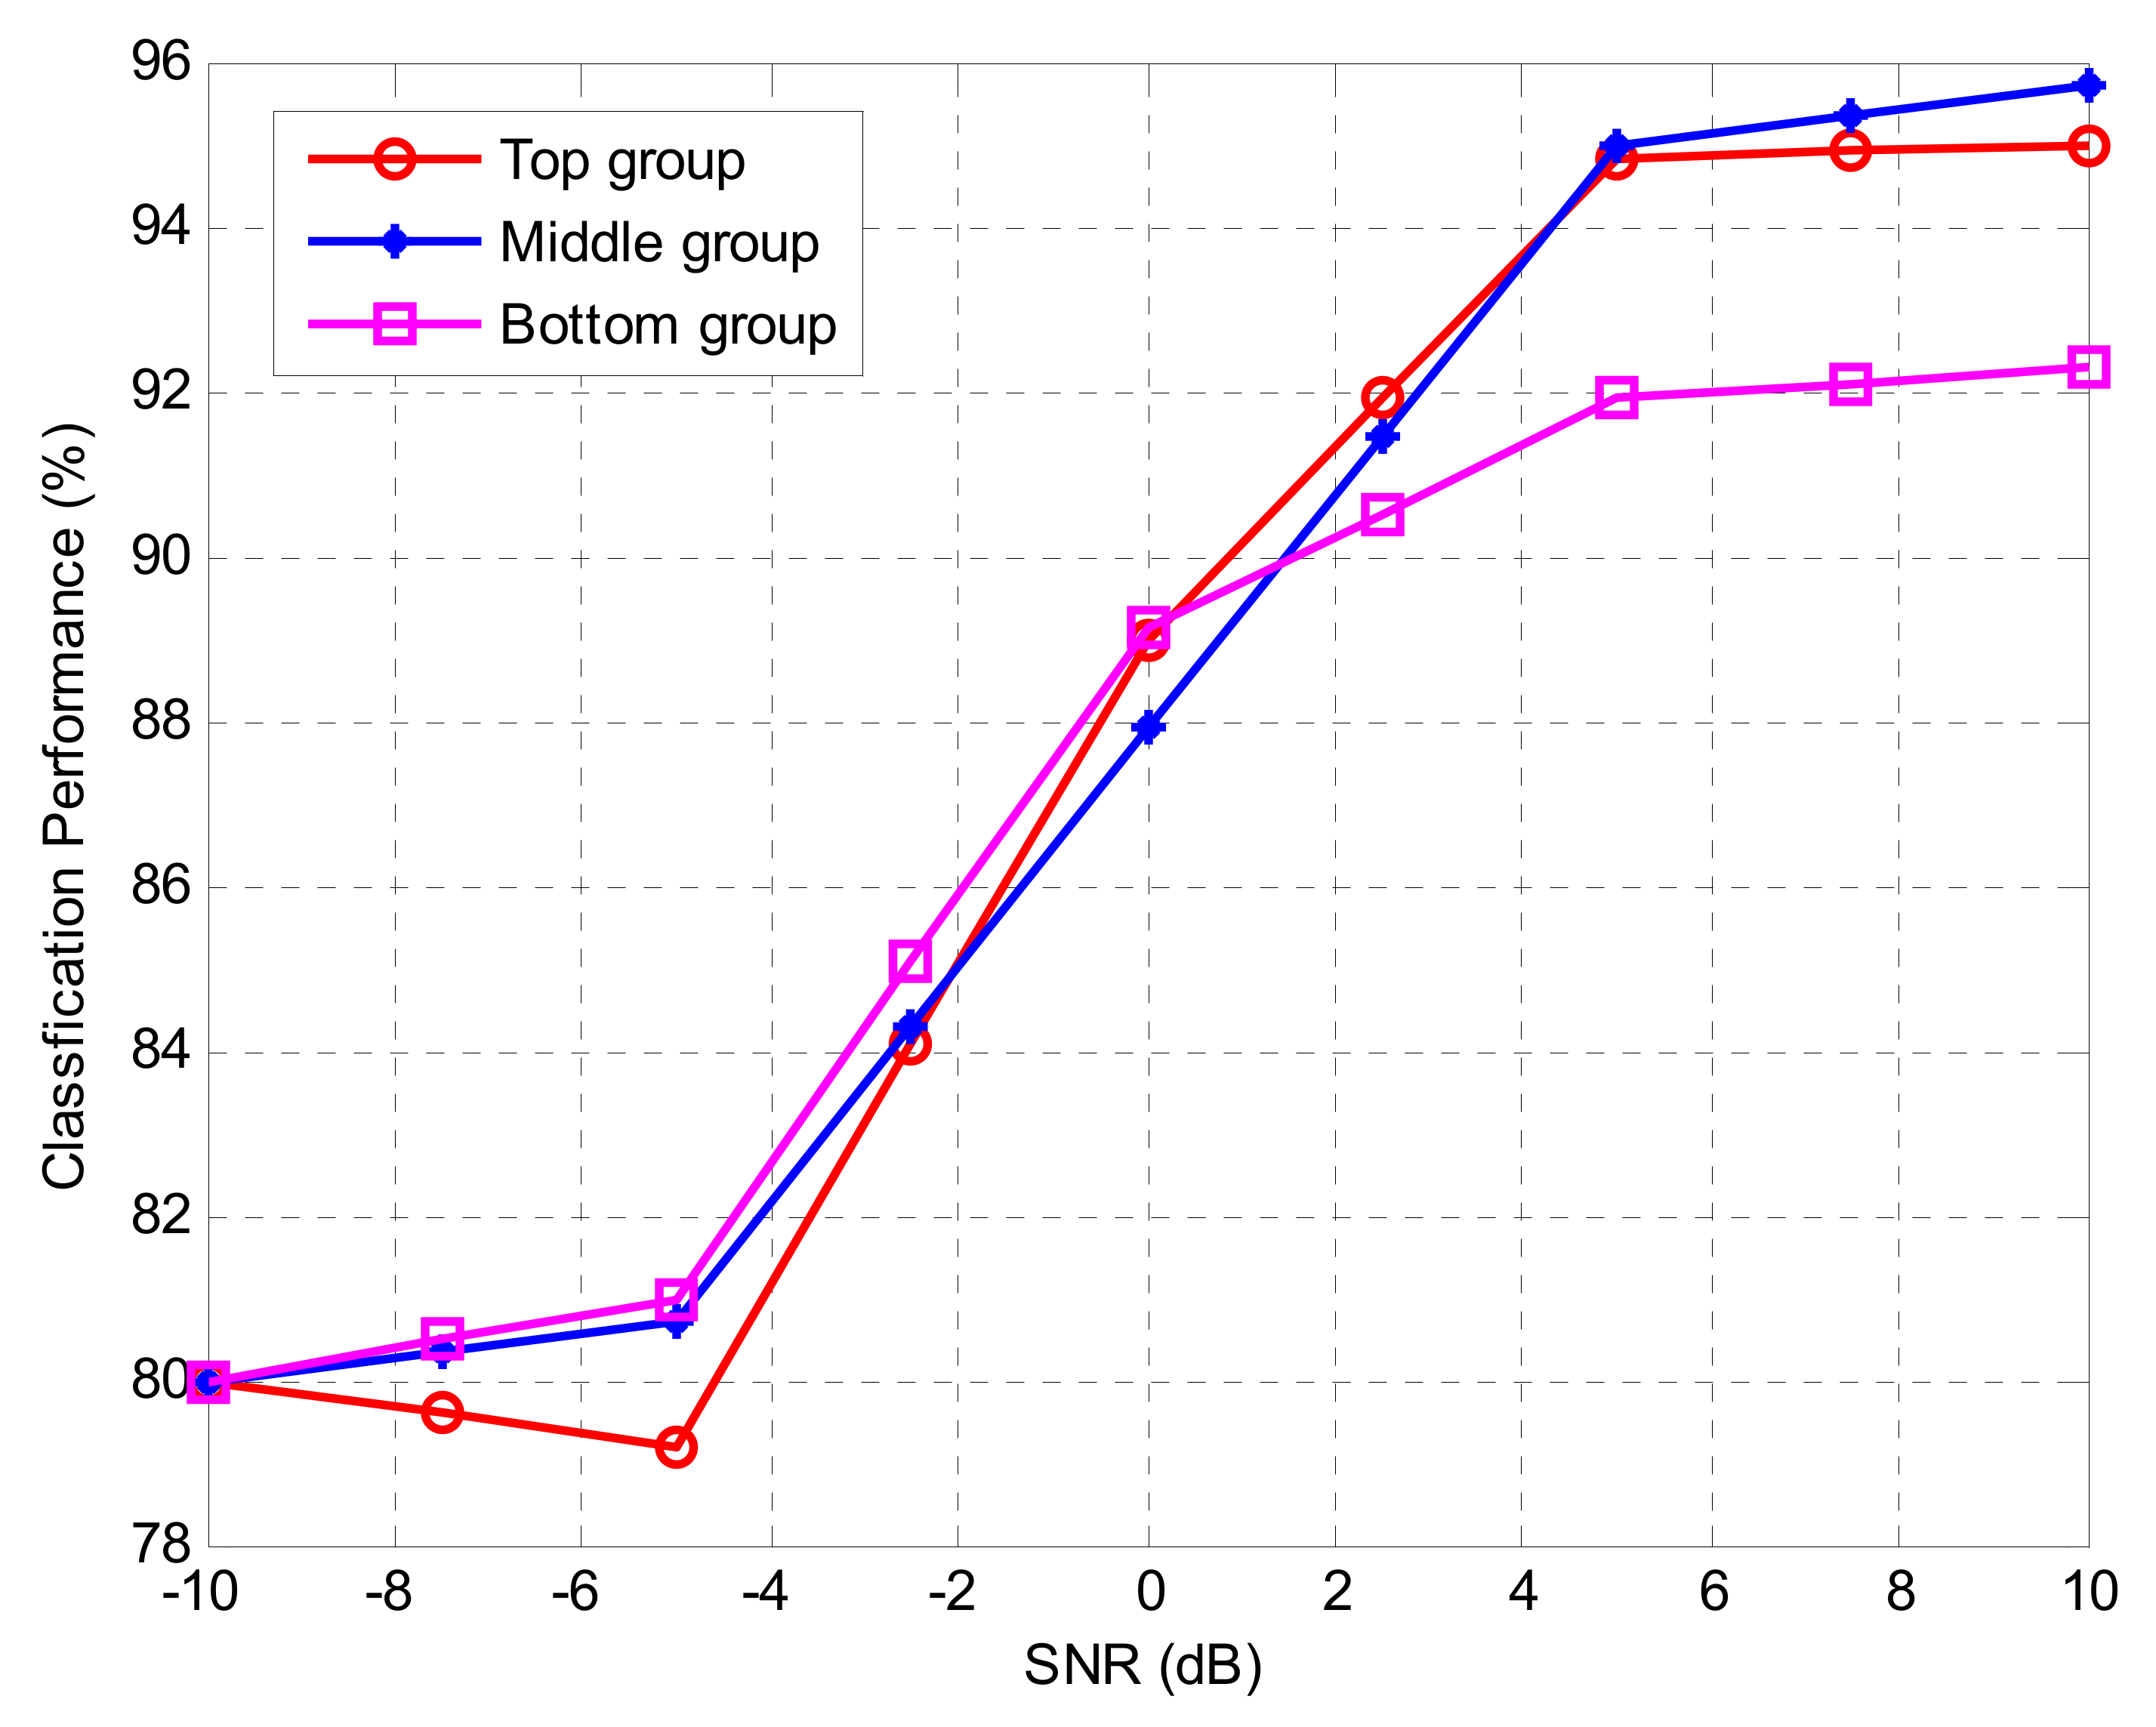
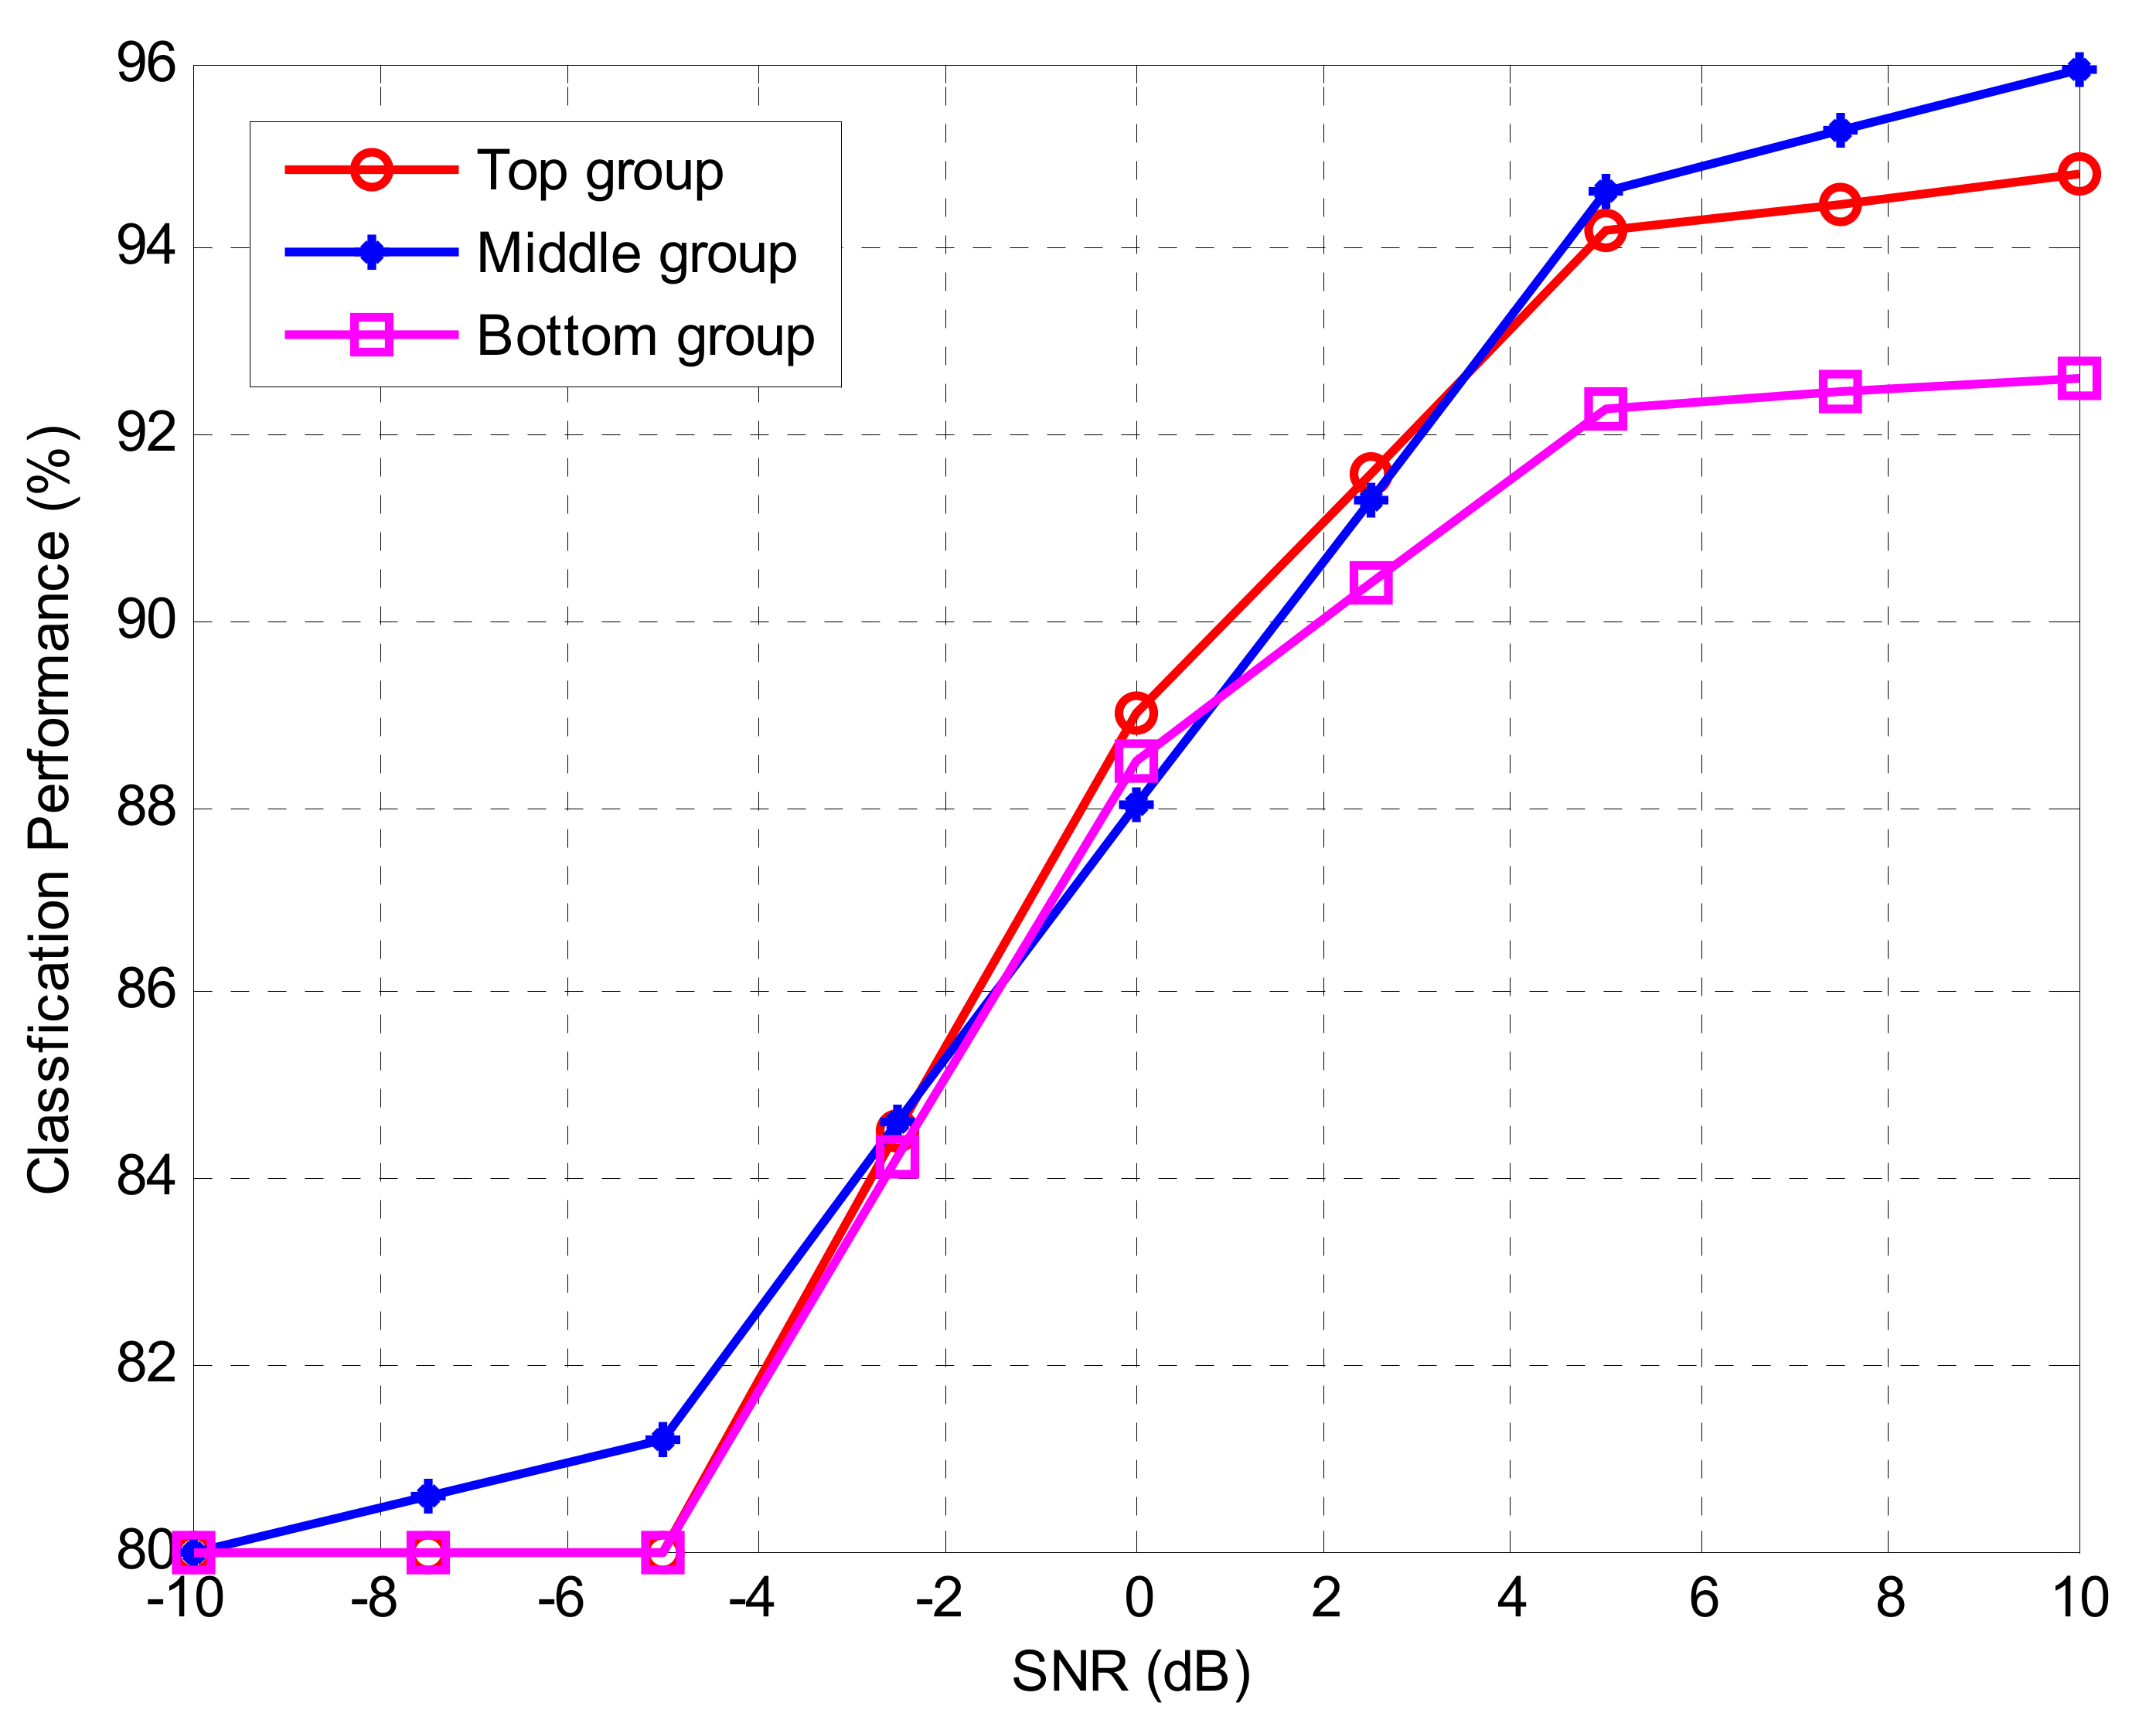
In the second set of simulations, in order to measure the classification performance according to the group, the cumulants were divided into three groups (top, middle, and bottom) based on the ranking obtained from the efficient feature-extraction method. The cumulants in each group were used as the inputs to the DNN algorithm to measure the classification performance. The parameters of the second DNN are summarized in Table 10.
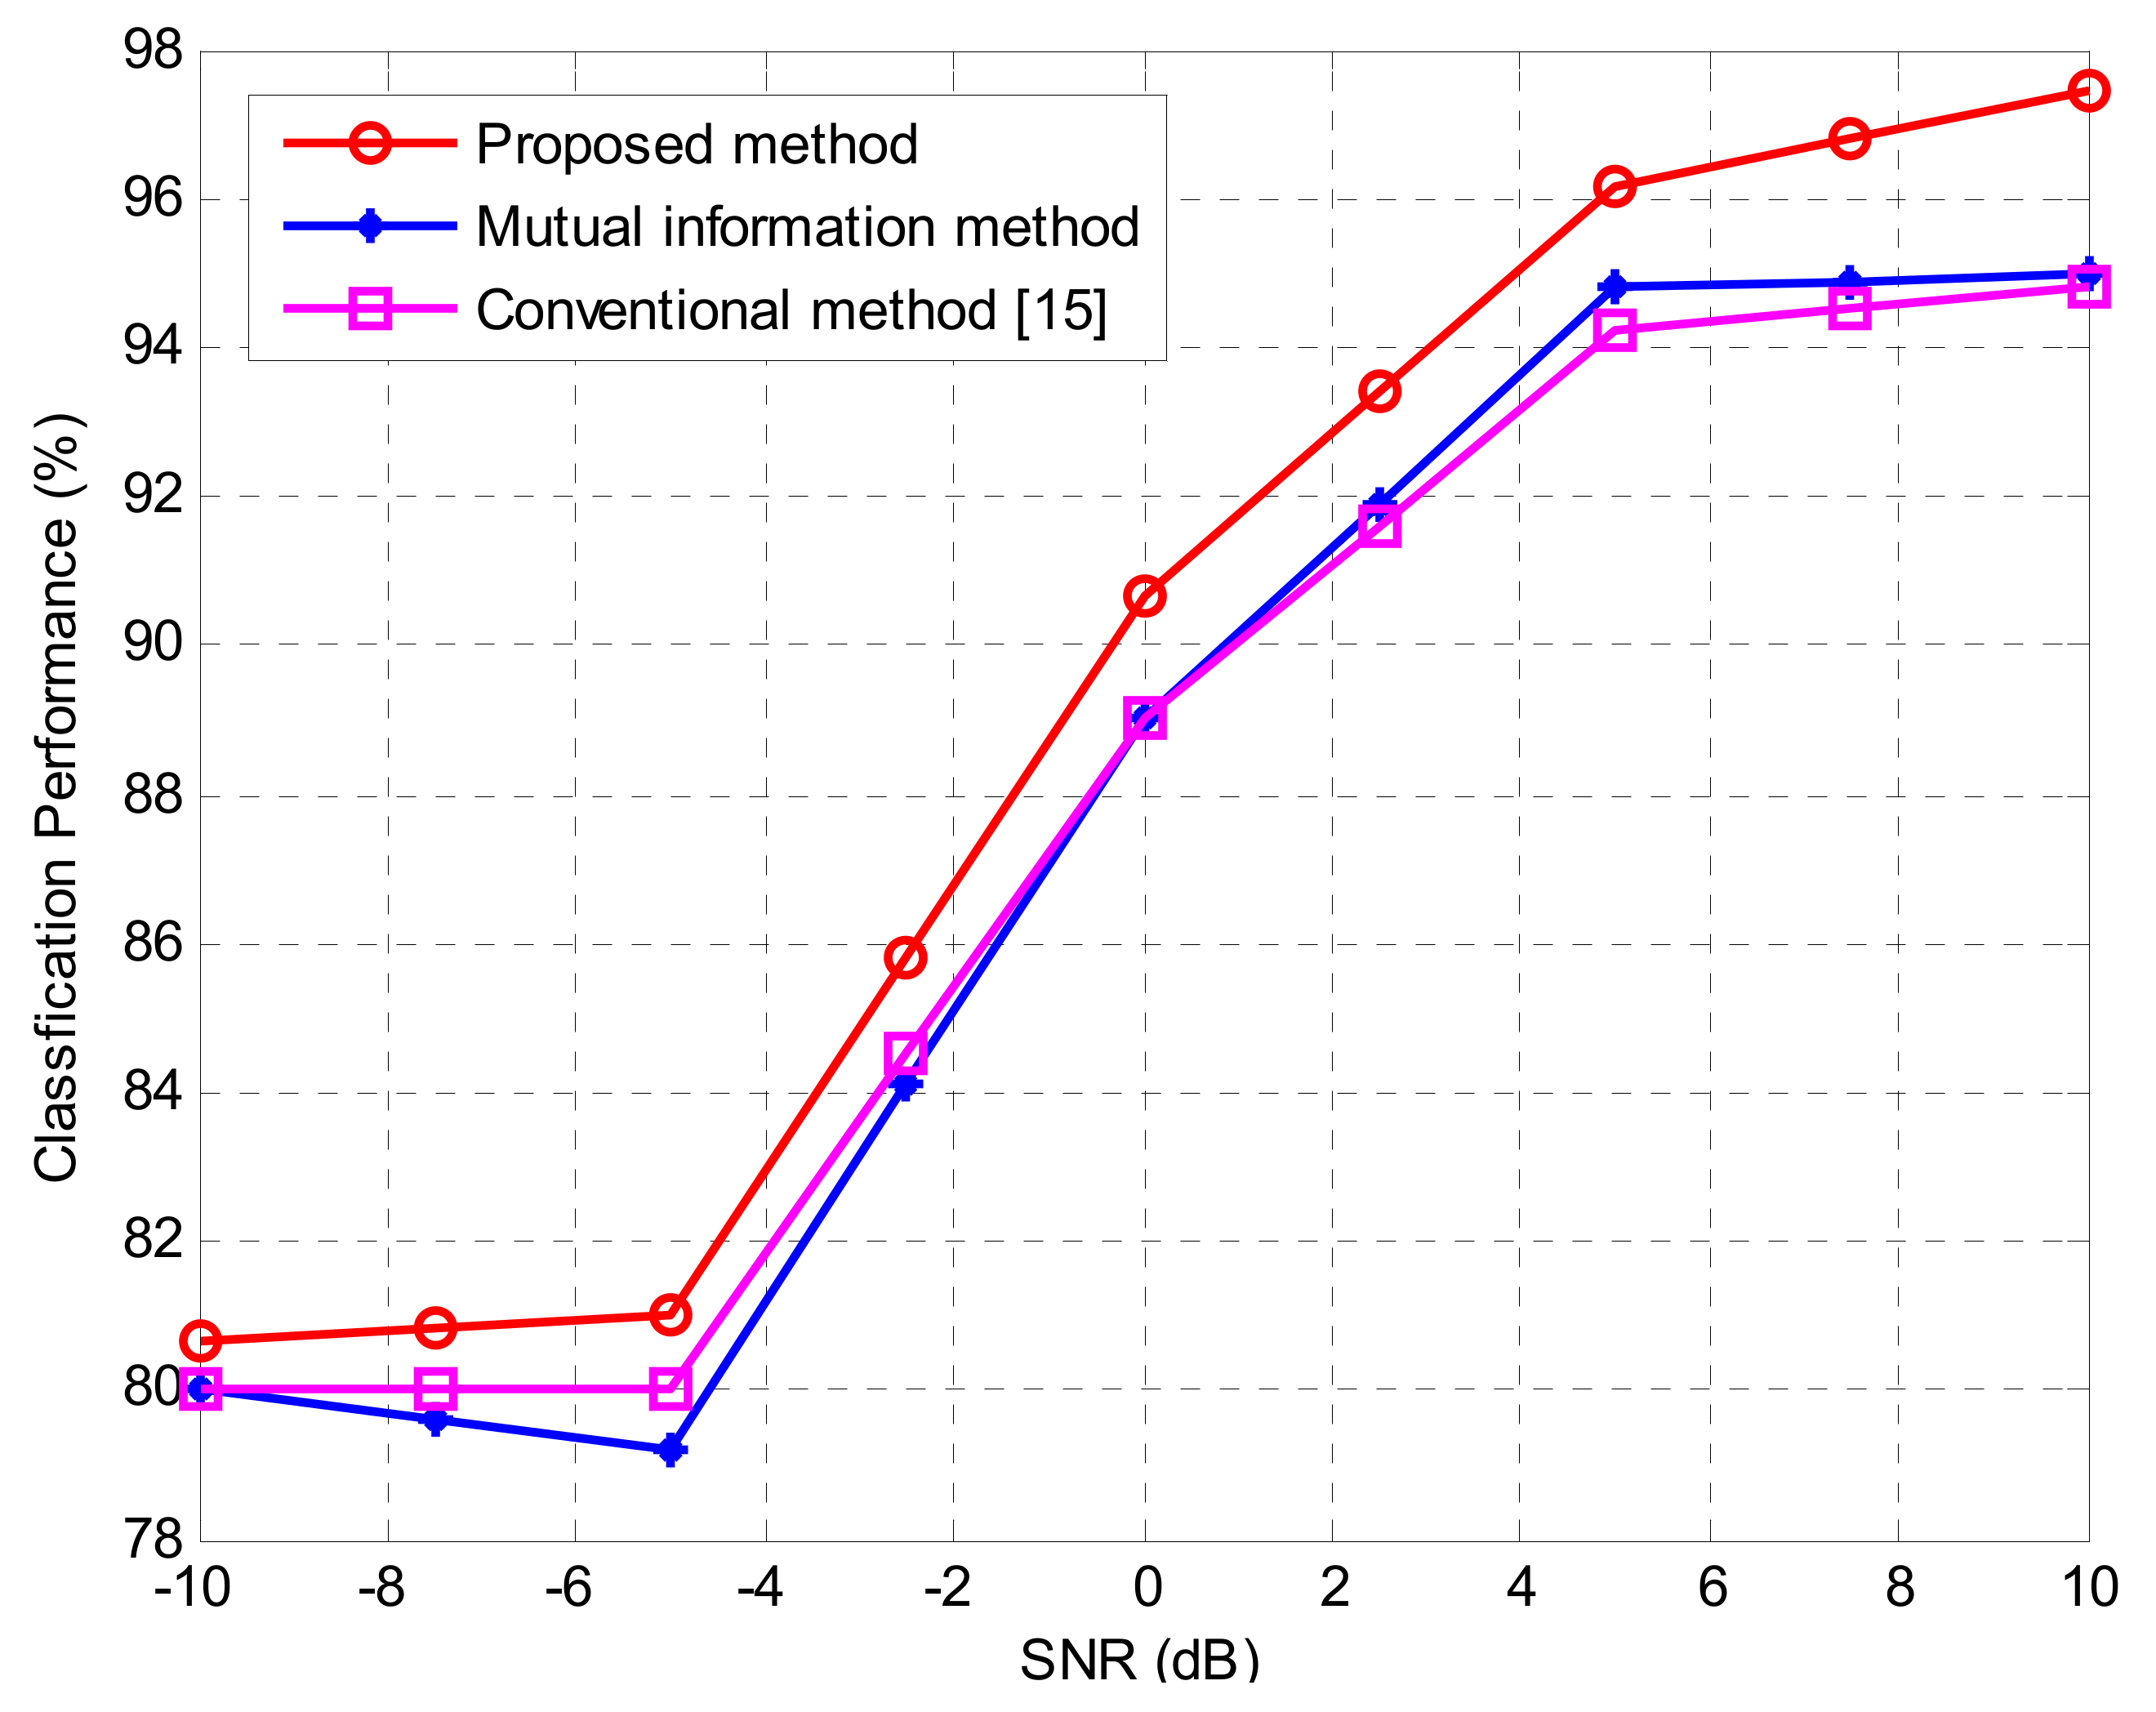
Figure 3 and Table 11 shows the simulation results of the proposed method and Figure 4 and Figure 5 show the results of the conventional method. Table 12, Table 13 and Table 14 represent the features used for each group. In Figure 3, Figure 4 and Figure 5, the desirable result is that the best classification performance is achieved when the top group is used as the input data, while the worst classification performance is achieved when the bottom group is used as the input data. In this respect, the conventional methods are unsatisfactory since the top group cannot always obtain the best performance in all SNR ranges. However, the proposed method shows a stable and the best performance over a wide SNR range of −2 dB to 10 dB. Even if the same amount of data is exploited, there is a large difference in performance depending on the features used. Also, even in the low SNR environment, the performance of the top group is better than that of the bottom group in the high SNR environment. Therefore, we conclude that the proposed method is very effective at extracting the useful feature group. Figure 6 shows the classification performance when only the features of the top group of each method is used as the input data. This figure also highlights that the proposed method shows superior performance in all SNR environments. Therefore, we conclude that the proposed method is very effective at extracting the input data group. Figure 6 shows the classification performance when only the features of the top group of each method are used as the input data. where the proposed method shows superior performance in all SNR environments.

5. Conclusions

Recently, the DNN-based AMC scheme has been studied as a method to improve jamming performance. However, research on the features used as the input data is insufficient and most studies aim at improving the calculation and the performance of the algorithm. In this paper, we propose an efficient feature-extraction method for the DNN-based AMC, we analyze feature used as input data, and we select an effective feature through the proposed method. From the results, it can be established that even if the same amount of data is used, the difference in classification rate performance according to each feature is large and the task of extracting efficient features is important. The optimal activity of selecting input data will be to find the optimal feature group by comparing the performance according to the combination of all the features. However, this is a difficult method to actually perform because it requires a large amount of calculation. Therefore, it is necessary to analyze features such as conventional techniques and proposed methods that use mutual information and correlation between data. It is expected that the AMC with high classification performance can be realized with a small computation effort by extracting the efficient feature values using the proposed method. Thus, we conclude that the proposed method can be considered a method to improve the performance of the AMC for military communication systems, AMC-based jamming systems, and the automatic coding and modulation for commercial wireless communication systems.

Author Contributions

S.H.L. contributed to this work in experiment planning, experiment measurements, data analysis and manuscript preparation. K.-Y.K. manuscript preparation, data analysis. Y.S. contributed in experiment planning, data analysis, manuscript preparation. All authors have read and agreed to the published version of the manuscript.

Funding

This research was supported by the MSIT (Ministry of Science and ICT), Korea, under the ITRC (Information Technology Research Center) support program (IITP-2019-2018-0-01424) supervised by the IITP (Institute for Information and communications Technology Promotion).

Conflicts of Interest

The authors declare no conflict of interest.

References

  1. Karrs, K.; Kuzdeba, S.; Petersen, J. Modulation Recognition Using Hierarchical Deep Neural Networks. In Proceedings of the 2017 IEEE International Symposium on Dynamic Spectrum Access Networks (DySPAN), Piscataway, NJ, USA, 6–9 March 2017. [Google Scholar]
  2. Dobre, O.A.; Abdi, A.; Bar-Ness, Y.; Su, W. Blind Modulation Classification: A Concept Whose Time Has Come. In Proceedings of the Sarnoff Symposium on Advances in Wired and Wireless Communication, Princeton, NJ, USA, 18–19 April 2005; pp. 223–228. [Google Scholar]
  3. Swami, A.; Sadler, B.M. Hierarchical Digital Modulation Classification Using Cumulants. IEEE Trans. Commun. 2000, 48, 416–429. [Google Scholar] [CrossRef]
  4. Hazza, A.; Shoaib, M.; Alshebeili, S.A.; Fahad, A. An Overview of Feature-Based Methods for Digital Modulation Classification. In Proceedings of the 1st International Conference on Communications, Signal Processing, and Their Applications ICCSPA 2013, Sharjah, UAE, 12–14 February 2013; pp. 1–6. [Google Scholar]
  5. Lee, J.H.; Kim, J.K.; Kim, B.D.; Yoon, D.W.; Choi, J.W. Robust Automatic Modulation Classification Technique for Fading Channels Via Deep Neural Network. Entropy 2017, 19, 454. [Google Scholar]
  6. Amuru, S.; Buehrer, M. Optimal Jamming Against Digital Modulation. IEEE Trans. Inf. Forensics Secur. 2015, 10, 2212–2224. [Google Scholar] [CrossRef]
  7. Wei, W.; Mendel, J.M. Maximum-Likelihood Classification for Digital Amplitude-Phase Modulations. IEEE Trans. Commun. 2010, 48, 189–193. [Google Scholar] [CrossRef]
  8. Ali, A.; Yangyu, F. Automatic Modulation Classification Using Deep Learning Based on Sparse Autoencoders with Nonnegativity Constraints. IEEE Signal Process. Lett. 2017, 24, 1626–1630. [Google Scholar] [CrossRef]
  9. Zhang, M.; Diao, M.; Guo, L. Convolutional Neural Networks for Automatic Cognitive Radio Waveform Recognition. IEEE Access 2017, 5, 11074–11082. [Google Scholar] [CrossRef]
  10. Hong, D.; Zhang, Z.; Xu, X. Automatic Modulation Classification Using Recurrent Neural Networks. In Proceedings of the 3rd IEEE International Conference on Computer and Communications (ICCC), Chengdu, China, 13–16 December 2017; pp. 695–700. [Google Scholar]
  11. An, N.; Li, B.; Huang, M. Modulation Classification of Higher Order MQAM Signals Using Mixed-Order Moments and Fisher Criterion. In Proceedings of the 2nd International Conference on Computer and Automation Engineering (ICCAE), Singapore, 26–28 February 2010; pp. 150–153. [Google Scholar]
  12. Huang, F.Q.; Zhong, Z.M.; Xu, Y.T.; Ren, G.C. Modulation Recognition of Symbol Shaped Digital Signals. In Proceedings of the 2008 International Conference on Communications, Circuits and Systems, Xiamen, China, 25–27 May 2008; pp. 328–332. [Google Scholar]
  13. Lee, S.H.; Kim, K.Y.; Kim, T.H.; Shin, Y. Analysis on Classification Accuracy by Data Filtering in DNN-Based Automatic Signal Classification. In Proceedings of the KICS Summer Conference 2018, Jeju, Korean, 20–22 June 2018; pp. 692–693. [Google Scholar]
  14. Lee, S.H.; Kim, K.Y.; Kim, J.H.; Shin, Y. Effective Feature-Based Automatic Modulation Classification Method Using DNN Algorithm. In Proceedings of the International Conference on Artificial Intelligence in Information and Communication (ICAIIC), Okinawa, Japan, 11–12 February 2019; pp. 557–559. [Google Scholar]
  15. Peng, H.; Long, F.; Ding, C. Feature Election Based on Mutual Information: Criteria of Maxdependency, Max-Relevance, and Min-Redundancy. IEEE Trans. Pattern. Anal. Mach. Intel. 2006, 27, 1226–1238. [Google Scholar] [CrossRef] [PubMed]
  16. Peng, S.L.; Jiang, H.; Wang, H.; Alwageed, H.; Yao, Y.D. Modulation Classification Using Convolutional Neural Network Based Deep Learning Model. In Proceedings of the 26th Wireless and Optical Communication Conference (WOCC), Newark, NJ, USA, 7–8 April 2017; pp. 1–5. [Google Scholar]
  17. Orlic, V.D.; Dukic, M.L. Automatic Modulation Classification: Sixth-Order Cumulant Features as a Solution for Real-World Challenges. In Proceedings of the 20th Telecommunications Forum (TELFOR), Belgrade, Serbia, 20–22 November 2012; pp. 392–399. [Google Scholar]
  18. Chang, D.C.; Shin, P.K. Cumulants-Based Modulation Classification Technique in Multipath Fading Channels. IET Commun. 2015, 9, 828–835. [Google Scholar] [CrossRef]
  19. Sheugh, L.; Alizadeh, S.H. A Note on Pearson Correlation Coefficient as a Metric of Similarity in Recommender System. In Proceedings of the 2015 AI & Robotics (IRANOPEN), Qazvin, Iran, 12 April 2015. [Google Scholar]
  20. Ebihara, T.; Taoka, H.; Miki, N.; Sawahashi, M. Performance of Outer-Loop Control for AMC Based on Mutual Information in MIMO-OFDM Downlink. In Proceedings of the 2012 IEEE 75th Vehicular Technology Conference (VTC Spring), Yokohama, Japan, 6–9 May 2012; pp. 990–995. [Google Scholar]
  21. Zhan, C.; Woodland, P.C. Parameterised Sigmoid and ReLU Hidden Activation Functions for DNN Acoustic Modelling. In Proceedings of the INTERSPEECH 2015, Dresden, Germany, 6–10 September 2015; pp. 3224–3228. [Google Scholar]
  22. Loffe, S.; Szegedy, C. Batch Normalization: Accelerating Deep Network Training by Reducing Internal Covariate Shift. arXiv 2015, arXiv:1502.03167v3. [Google Scholar]
Figure 1. The AMC structure of the proposed scheme.
Applsci 10 00588 g001
Figure 2. DNN structure for the first set of simulations.
Applsci 10 00588 g002
Figure 3. Classification performance of each group obtained by the proposed method. The top group achieves the best classification performance while the bottom group achieves the worse performance, which shows the validity of the proposed method.
Applsci 10 00588 g003
Figure 4. Classification performance of each group obtained by the mutual information method. The bottom group achieves the best classification performance while the top group achieves the worse performance, which.
Applsci 10 00588 g004
Figure 5. Classification performance of each group obtained by the conventional method.
Applsci 10 00588 g005
Figure 6. Classification performance when only the features of the top group of each method are used as the input data.
Applsci 10 00588 g006
Table 1. The expressions for various cumulants.
Higher-Order CumulantExpression
Second-Order Cumulant C 20 M 20
C 21 M 21
Fourth-Order Cumulant C 40 | M 40 3 M 20 2 |
C 41 M 41 3 M 20 M 21
C 42 M 42   M 20 2 2 M 21 2
Sixth-Order Cumulants C 60 M 60 15 M 20 M 40 + 30 M 20 3
C 61 | M 61 10 M 20 M 41 5 M 21 M 40 + 30 M 21 M 20 2
C 62 M 62 6 M 20 M 42 8 M 21 M 41   M 22 M 40 + 6 M 20 2 M 22 + 24 M 21 2 M 20
C 63 M 63 9 M 21 M 42 + 12 M 21 3 3 M 20 M 42 3 M 22 M 41 + 18 M 20 M 21 M 22
Table 2. The theoretical absolute values of cumulants.
BPSKQPSK8-PSK16-QAM64-QAM
C 20 10000
C 21 11111
C 40 2100.680.62
C 41 20000
C 42 2110.680.62
C 60 160000
C 61 16402.081.79
C 62 160000
C 63 16442.081.79
Table 3. Effective correlation values of each cumulant in various signal-to-noise ratio (SNR) environments for the conventional method. High values indicate strong influence on the classification performance, meaning that the associated cumulants are more effective features for AMC systems.
SNR−10 dB−5 dB0 dB5 dB10 dB
C 20 8.928.868.598.298.08
C 21 6.087.236.355.564.98
C 40 9.118.988.618.117.68
C 41 9.058.938.638.318.09
C 42 9.138.928.187.446.94
C 60 9.049.028.858.498.20
C 61 8.878.888.387.757.39
C 62 9.028.918.638.318.15
C 63 9.078.938.297.517.01
Table 4. Effective correlation values of each cumulant in various SNR environments for the mutual information. High values indicate strong influence on the classification performance, meaning that the associated cumulants are more effective features for automatic modulation classification (AMC) systems.
SNR−10 dB−5 dB0 dB5 dB10 dB
C 20 8.938.918.758.608.50
C 21 6.137.346.585.955.43
C 40 9.139.068.728.307.98
C 41 9.089.018.848.618.55
C 42 9.128.948.417.827.39
C 60 9.098.898.908.708.51
C 61 9.048.998.698.167.83
C 62 9.119.048.858.688.60
C 63 9.149.078.547.907.46
Table 5. Effective correlation values of each cumulant in various SNR environments for the proposed method. Unlike the other methods, small values indicate strong influence on the classification performance, meaning that the associated cumulants are more effective features for AMC systems.
SNR−10 dB−5 dB0 dB5 dB10 dB
C 20 0.371.736.0712.4516.97
C 21 1.803.079.0715.6318.34
C 40 0.561.353.527.6912.19
C 41 1.193.18.2114.6218.23
C 42 0.730.959.2815.3118.07
C 60 1.820.651.778.0814.02
C 61 2.963.558.4713.4615.24
C 62 3.344.778.514.6418.07
C 63 2.815.3610.2715.5618.15
Table 6. Definitions of the non-linear activation functions used in the deep neural network (DNN). The ReLU was used for all hidden layers, while the Softmax was used for the output layer.
ReLU f x = max x , 0
Softmax f x j =   e x j i e x i
Table 7. The DNN parameters used in the first simulation for optimal feature extraction and performance verification.
ParametersValue
Number of input nodes9
Number of hidden layer3
Number of nodes of 1st hidden layer40
Number of nodes of 2st hidden layer20
Number of nodes of 3st hidden layer10
Number of output nodes5
Activation function of hidden layerReLU
Activation function of output layerSoftmax
Number of training data450,000
Number of test data90,000
Number of validation data90,000
Epochs200
Bacth Size64
Table 8. Classification performance according to elimination of each feature [%]. The feature with the lowest value is the most essential for the classification.
SNR−10 dB−5 dB0 dB5 dB10 dB
ALL86.3789.6795.7098.6199.91
C 20 77.4483.9992.0593.0398.38
C 21 83.1084.6091.8597.5698.92
C 40 79.1683.9191.0396.7398.12
C 41 83.1984.9391.9297.5298.40
C 42 82.9083.6791.4797.4798.69
C 60 83.0983.1491.1496.9198.35
C 61 83.1784.5391.5297.3098.27
C 62 83.2884.8792.1497.4298.55
C 63 83.1185.4691.4097.3498.73
Table 9. Difference in classification performance when all features are used and when the effective features are excluded by each method.
SNR−10 dB−5 dB0 dB5 dB10 dB
Proposed8.936.534.561.881.79
Mutual information3.264.214.561.701.36
Conventional3.476.534.561.701.56
Table 10. The DNN parameters used in the second simulation for optimal feature group extraction and performance verification.
ParametersValue
Number of input nodes5
Number of hidden layer2
Number of nodes of 1st hidden layer30
Number of nodes of 2st hidden layer10
Number of output nodes5
Activation function of hidden layerReLU
Activation function of output layerSoftmax
Number of training data250,000
Number of test data50,000
Number of validation data50,000
Epochs200
Batch Size64
Table 11. Classification performance of each group obtained through the proposed method.
SNR−10 dB−5 dB0 dB5 dB10 dB
Top group80.6781.0290.6596.1797.45
Middle group8081.7686.6995.0596.46
Bottom group8082.0685.7388.8691.59
Table 12. Feature of each group used in the proposed method.
SNRTop GroupMiddle GroupBottom Group
−10 dB C 62 ,   C 61 ,   C 63 ,   C 60 ,   C 21 C 63 ,   C 60 ,   C 21 ,   C 41 ,   C 42 C 20 ,   C 40 ,   C 42 ,   C 41 ,   C 21
−5 dB C 63 ,   C 62 ,   C 61 ,   C 41 ,   C 21 C 61 ,   C 41 ,   C 21 ,   C 20 ,   C 40 C 60 ,   C 42 ,   C 40 ,   C 20 ,   C 21
0 dB C 63 ,   C 42 ,   C 21 ,   C 62 ,   C 61 C 21 ,   C 62 ,   C 61 ,   C 41 ,   C 20 C 60 ,   C 40 ,   C 20 ,   C 41 ,   C 61
5 dB C 21 ,   C 63 ,   C 42 ,   C 62 ,   C 41 C 42 ,   C 62 ,   C 41 ,   C 61 ,   C 20 C 40 ,   C 60 ,   C 20 ,   C 61 ,   C 41
10 dB C 21 ,   C 41 ,   C 63 ,   C 42 ,   C 62 C 63 ,   C 42 ,   C 62 ,   C 20 ,   C 61 C 40 ,   C 60 ,   C 61 ,   C 20 ,   C 62
Table 13. Feature of each group used in the mutual information method.
SNRTop GroupMiddle GroupBottom Group
−10 dB C 63 ,   C 40 ,   C 42 ,   C 62 ,   C 60 C 42 ,   C 62 ,   C 60 ,   C 41 ,   C 61 C 21 ,   C 20 ,   C 61 ,   C 41 ,   C 60
−5 dB C 63 ,   C 40 ,   C 62 ,   C 41 ,   C 61 C 62 ,   C 41 ,   C 61 ,   C 42 ,   C 20 C 21 ,   C 60 ,   C 20 ,   C 42 ,   C 61
0 dB C 60 ,   C 62 ,   C 41 ,   C 20 ,   C 40 C 41 ,   C 20 ,   C 40 ,   C 61 ,   C 63 C 21 ,   C 42 ,   C 63 ,   C 61 ,   C 40
5 dB C 60 ,   C 62 ,   C 41 ,   C 20 ,   C 40 C 41 ,   C 20 ,   C 40 ,   C 61 ,   C 63 C 21 ,   C 42 ,   C 63 ,   C 61 ,   C 40
10 dB C 62 ,   C 41 ,   C 60 ,   C 20 ,   C 40 C 60 ,   C 20 ,   C 40 ,   C 61 ,   C 63 C 21 ,   C 42 ,   C 63 ,   C 61 ,   C 40
Table 14. Feature of each group used in the conventional method.
SNRTop GroupMiddle GroupBottom Group
−10 dB C 42 ,   C 40 ,   C 63 ,   C 41 ,   C 60 C 63 ,   C 41 ,   C 60 ,   C 62 ,   C 20 C 21 ,   C 61 ,   C 20 ,   C 62 ,   C 60
−5 dB C 60 ,   C 40 ,   C 41 ,   C 63 ,   C 42 C 41 ,   C 63 ,   C 42 ,   C 62 ,   C 61 C 21 ,   C 20 ,   C 61 ,   C 62 ,   C 42
0 dB C 60 ,   C 62 ,   C 41 ,   C 40 ,   C 20 C 41 ,   C 40 ,   C 20 ,   C 61 ,   C 63 C 21 ,   C 42 ,   C 63 ,   C 61 ,   C 20
5 dB C 60 ,   C 62 ,   C 41 ,   C 20 ,   C 40 C 41 ,   C 20 ,   C 40 ,   C 61 ,   C 63 C 21 ,   C 42 ,   C 63 ,   C 61 ,   C 40
10 dB C 60 ,   C 62 ,   C 41 ,   C 20 ,   C 40 C 41 ,   C 20 ,   C 40 ,   C 61 ,   C 63 C 21 ,   C 42 ,   C 63 ,   C 61 ,   C 40