Abstract
The order picking process involves a series of activities in response to customer needs, such as the selection or programming of orders (batches), and the selection of different items from their storage location to shipment. These activities are accomplished by a routing policy that determines the picker sequence for retrieving the items from the storage location. Therefore, the order picking problem has been plenty investigated; however, in previous research, the proposed models were based on demand fulfilling, putting aside factors such as the product weight—which is an important criterion—at the time of establishing routes. In this article, a mathematical model is proposed; it takes into account the product’s weight derived from a case study. This model is relevant, as no similar work was found in the literature that improves the order picking by making simultaneous decisions on the storage location assignment and the picker-routing problem, considering precedence constraints based on the product weight and the characteristics of the case study, as the only location for each product in a warehouse with a general layout.
1. Introduction
Based on customers needs, the warehousing and the order picking processes are principal components of any supply chain. Since 1984, the Storage Education and Research Council (WERC) [1], has identified the order picking process as the main area of opportunity for the warehousing industry. Studies carried out by [2,3], show that the order picking is one of the most critical processes at an operational level within a warehouse, because it represents 55–60% of costs; therefore, companies are forced to perform this activity in the best possible way. Zuniga [4] mentions that in warehouses, especially for distribution centers (DC); the order picking process for distribution centers (DC), has become more important and complex, because of its flexibility, which provides many advantages, such as the ability to handle products of different sizes, forms, weights and volumes with the same resources to react to market fluctuations. However, it also increases the number of decision variables and the complexity of the system, which complications decision-making activities.
On the other hand, in the research of [1,5,6] it is established that several factors like average, the variation of order delivery time, integrity and accuracy, are components of the service level. Moreover, a crucial link between order picking and service level is that a product becomes available for shipping as quickly as it is retrieved. Otherwise, a delay in the delivery may be incurred, causing a bad performance of the service or nonconformity by the client. Nonetheless, the company could incur additional work to deliver on time, raising the costs of operation.
The order picking process involves a series of activities, such as the selection or scheduling of orders (batches); the assignment of stock keeping units (SKU) to a storage location; and the shifting of different items from their storage locations to the shipping area in response to requests made by customers. Nevertheless, for [5,7] the main target of order picking is the minimization of either the travel distance or the picking time; these activities are accomplished by routing policy, which determines the picker sequence for retrieval of the items from their storage locations. Therefore, this specifies both the order in which they have to be picked and the order in which the aisles must be visited.
However, according to [8,9], the correct storage assignment facilitates the process precision and the most efficient placement of stocks, achieving faster order cycles and better customer service, which makes storage assignment and routing one of the main problems in practice. Therefore, in this research, we focus on solving both problems together in a company where there is no appropriate location of the products, increasing direct labor to avoid non-compliance with deliveries to customers. The description of the case study is presented in Section 3.
2. Literature Review
In this section, we summarize the main research studies for picker routing and storage location problems in warehouses with manual systems.
It is important to point out that in the literature and in practice, there are two main levels of mechanization for collection in the warehouses, according to [5,9]:
- Manual systems: They employ humans and are divided into three systems:
- Picker-to-parts systems: high-level picking systems with man-aboard and low-level picking systems (manual pick).
- The put system.
- Parts-to-picker systems (AS/RS miniloads, carousels, etc.).
- Mechanized/automated systems: They use machines and are mainly used for valuable, small and delicate items, and are divided into two systems:
- Automated picking.
- Robot picking.
This work concentrates on describing manual systems; in agreement with [5,10], in the majority of warehouses worldwide, humans are employed for order picking, wherein the low-level, picker-to-parts systems are the most common; this is the system used by the company in the case study. On the other hand, according to [11,12], the variety of elements and processes, and the high investments required to get automated or mechanized systems, are difficult to trust and invest in. Furthermore, despite advances in technology, people react more flexibly to shifts occurring in the order picking process. The reader is advised to [13,14] for an overview of mechanized-automated warehouses systems.
In relation to [15], in the literature, three main warehouse layouts are discussed:
- Conventional warehouses or block design: aisles are parallel to one another (picking aisle), where the products to be retrieved are located (pick location).
- Non-conventional warehouses: they have a flying-V shape, U-shape, fishbone or other non-conventional layout.
- Models of general warehouses: structures are undefined, and instead, they use general distance matrices.
As a result, most research on improvements of order-picking efficiency have considered conventional layouts as a solution for their storage location layout, which makes the study results easily transferable to other stores. Some woks, such as [16,17,18], present the shape of the warehouse with a single block, while [19,20,21,22], have contemplated multiple blocks. In the same way, the aisle can be wide ([23,24]), where the picking aisles are assumed to be wide enough to allow order pickers to go from one aisle to another, avoiding wait times as a result of aisle congestion. Nevertheless, studies such as [25,26] contemplated general and non-conventional warehouses respectively.
In manual picking, four activities represent the total time [2]: setup, searching, picking and travel times. The travel and picking times are the time needed to go to and between the picking aisles; the latter comprises the greatest part of the expense of retrieved shown in Figure 1, which is itself the most expensive part of warehouse operating expenses; thus, it is the main option to improve the performance of this process [6]. It also represents the only variable part, while the rest of the components (searching, setup and picking) can be considered constants [3]. As reported by [27] the travel time is determined by the total length of the tour realized for the picker.
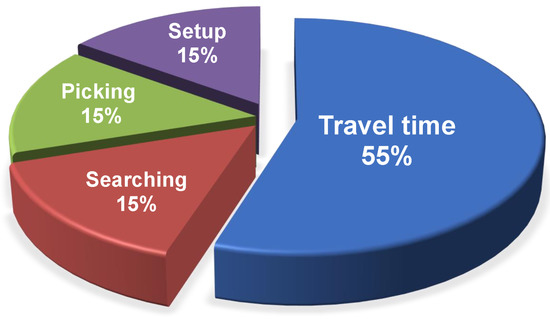
Figure 1.
Proportional times for each activity.
Based on the above, in the literature [19,26,27,28,29], the picker routing problem can be interpreted as a special case of the traveling salesman problem (TSP). According to [10], most of the order picking planning problems, such as the order batching or the picker routing problem, the latter being a generalization of the TSP, have been shown to belong to the class of NP-hard problems; thus, the combination of several planning problems also generates an NP-hard problem. The research of [27] used mathematical models for the picker routing problem; also, they determined that the performance of these strategies (optimal or heuristic) depends on the characteristics of the problem, such as the number of pick location and picking aisles, the position of the deposit and the number of items requested in the picking list. The detailed description of these picker routing and their variations can be found in [14,30,31]; research such as [16,18,20,27] provided optimal solutions; and [19,22,32,33], among others, showed heuristic solutions. It is important to mention that for all studies reviewed by [10], the problems were solved independently.
Drawing on an extensive research carried out by [10], the authors decided that there are three combinations of planning problems to improve the efficiency of order picking, those being the order batching process—the picker routing problem (the focus of the largest number of case studies); the storage location assignment and routing problem (this being the option analyzed in this work); and finally, the storage location and order batching process. Although most of the literature concentrates on giving solutions to the first combination, in [6], the picker routing problem is very interdependent on the storage location problem; therefore, it is important to optimize both processes simultaneously. Also, according to [24], there is a statistically significant interaction between these problems, since the elements that move fast must be assigned to storage locations that can be accessed more easily, which depends largely on the routing policy.
The literature on the routing problem and storage assignment has highlighted several investigations, such as [34] that focuses on proposing different storage assignment strategies and heuristics to picker routing in a case study. That work proposed a mathematical model with an optimal solution. Similarly, in a study conducted by [22], they proposed different storage assignment strategies and an exact solution algorithm (modification of the algorithm of [16]) based on the concept of dynamic programming, to solve such problems in a home products company. In that study, the processes of storing assignment and routing were not performed, since once the products were assigned to the storage spaces, they were subsequently collected. On the contrary, in our work, these decisions were made simultaneously. Nevertheless, both investigations considered precedence constraints based on the weight of the products in both processes. These constraints were also very important for the works conducted by [35,36]. The studies presented provide evidence that the research presented by [26] is the only report wherein a model is formulated for simultaneously determining the assignment and sequencing decisions, but it does not consider the weight of the products in the picking tour and the products are stored in two or more locations in the warehouse; instead, in this work, each product must be set in only location. A summary of the main articles that have been reviewed for this research are shown in Table 1.

Table 1.
Research summary.
Consequently, the order picking problem has been investigated plenty; nevertheless, in previous research, the proposed models were based on the fulfillment of demands, putting aside other factors, such as the weights of the products, which represent an important criterion at the moment of establishing the routes, as presented in [22,34,35,40], since keeping the product in good condition is vital for the satisfaction of customers, mainly in warehouses where fragile products are handled. In the same way, contemplating more than one factor in the picking routing will improve the storage location assignment of the products and with it the order picking, as presented in the case study of this work.
Although some works [5,41] state that the most used method to solve these problems is heuristics, in the literature of order picking, as shown in the Table 1, a mathematical model has not been proposed so far through simultaneously determining storage location assignment, unique, and picker routing (SLAUPR), considering precedence constraints based on the weight of the products and only location for each product in a general warehouse, so this research contributes to the literature because a mathematical model under these characteristics is proposed.
3. Case Description
In order to achieve the distribution process at the national and foreign level of its finished products, the bakery company has a DC to consolidate all of its products. All products are handled on pallets.
This DC is composed of four zones: receiving, storage, picking and shipping. The problem is located in the picking zone. This zone is where special orders are picked. Additionally, these orders are sent to the shipping zone. Next, the handling and arrangement of spaces in the DC are described.
The picking zone is divided into four areas, shown in Figure 2. Areas A and B are intended to store high-demand products; Area C is for medium–low-demand products; and Area D is for low-demand products. Orders are built onto pallets with the respective items (each pallet is a part of the order, consisting of a type of product and its quantity in boxes) requested by the customer. Each product occupies a unique space, but not necessarily all spaces must store products. The area is located on a second floor and is fed by the suppliers who allocate the pallets onto the racks with forklifts. Retrieval is done under the picker-to-parts low-level system.
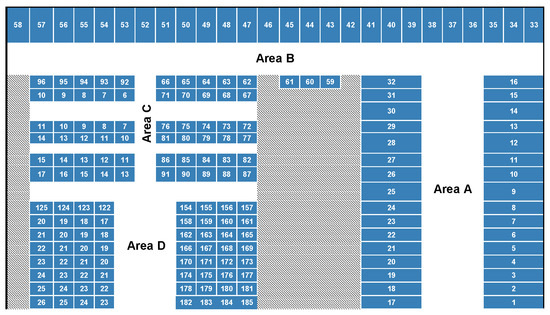
Figure 2.
Layout of the warehouse in our case study.
Area A can store 32 different types of products and each can have five pallets available. In Figure 2 are the spaces from 1 to 32. Area B has 26 spaces (from 33 to 58) with the capacity to store seven pallets of the product. Area B1 is composed of spaces 59–61, and its storage capacity is five pallets each; see Figure 2.
Area C has 30 spaces on each side of the aisle, with a storing capacity of 60 different types of products. In Figure 2 are the spaces from 66 to 121. In area D, there are shelves on both sides of the aisle, and unlike other areas, the product is stored in boxes. Each shelf is eight spaces long by four high, giving a total capacity of 32 on each side, in which only 64 types of different products can be stored. In Figure 2 are the spaces from 122 to 185.
The company has a warehouse management system (WMS) that indicates the route that employees must take to collect the products in the picking area, a route that is established according to the location of the products; but the average time taken to collect the items of the order is greater than that established by the company, because when products are picked—the employees consider alternate routes, and take care of stowing, making sure the weight of the item that is located on top does not affect the one below it—thereby generating extra personnel costs and decreased productivity such that they do not align to non-fulfilled orders. In a comprehensive study of travel time by [42], they found that decreasing travel time is an important factor in reducing costs and delays.
In line with [43], the order picking is carried out by the WMS. This system has the capability of being able to determine the correct location and quantity of each product to be collected, and then indicate the route. However, for [44] a WMS was used to improve warehouse efficiency and maintain accurate inventory by recording transactions. Another advantage of using WMS is to reduce inventory discrepancies. That is mentioned in [7], and was based on comments from professionals. Even so, the algorithms used in this system are not advanced, because they often need a large amount of accurate data that is generally not available in practice. The professionals prefer to keep solutions based on very simple logic to make sure they work in reality. Additionally, these authors and [45] show that the tool most frequently used in the order picking process is mathematical programming, although some professionals disagree with its use. In contrast, in this research, the use of mathematical models in the improvement of this and other processes within the company is viable for professionals.
4. Materials and Methods
This section is dedicated to the formulation of the proposed mathematical model to solve the presented case study and the description of the instances to determine its performance.
As mentioned in the previous section, the picker routing in the selection area is not being carried out in the time established by the company, since the route provided by the WMS does not contemplate the weight of the product; therefore, the employees need to generate alternate routes considering this characteristic. They still had not failed to process any order, but they required more staff to achieve that, and therefore, high costs for this concept arose. Also in Section 2, the authors set out the problem of routing picking (in a warehouse it is often solved employing models based on the TSP) with a variety of formulations in the literature, probably the most prominent being carried out by citing [46]. However, in this formulation, there is no demand associated with the clients, which means that for our research topic we should use a model that contemplates this criterion, as is the case of the capacitated vehicle routing problem (CVRP), which is a generalization of the TSP.
According to the characteristics provided by the company, the following was also considered for the formulation of the mathematical model: The demand for the product is stable and known (changes arise when a new product is introduced); there is always product available; the boxes of the different products have the same dimensions; a product must occupy a single space; the spaces for the assignment of products in the area are well determined; the maximum capacity of each of the spaces is known, and this depends on the type of product that will be assigned; the weight of each box is known; each tour begins in the aisle of area A; and considering the study of [47], all employees take the same time to go from one place to another.
The notation for the SLAUPR model is:
Sets
- I: denotes the set of spaces, indexed by i, j.
- K: denotes the set of different products types available, indexed by k.
- P: denotes the set the orders, indexed by p.
- O ⊆ K: denotes the set of different products to assign, indexed by o.
Parameters
- = Demand of product k in order.
- = Capacity of spaces i for product k.
- = Weights of products k.
- = Matrix of the travel time go from space i to space j of picking area. The distances were created based on the location of spaces and the standard size of a pallet, where each unit of measurement is equivalent to one second.
Variables
- auxiliary variable for subtours.
- Quantity of boxes to pick in the order p in the space j of product k.
Then, the mathematical formulation proposed for SLAUPR is shown below:
The objective function minimizes the travel time. Constraint (2) guarantees fulfilling the demand for each product in the order. Constraint (3) ensures capacity of storage location or space. Constraint (4) guarantees that each order begins at the point of origin. Constraints (6) and (5) ensure that a product is assigned to a unique space and that each space is assigned at least one product. Constraints (7) and (8) ensure that only space where the requested product is assigned in the orders is visited. Conditions (9) and (10) guarantees that each space is visited at most once for order. Constraints (11) and (12) exclude subtours. Mass balance constraints for order (13). Constraint (14), makes sure that first the heaviest product is retrieved, and the Constraints (15)–(18) are the domain decisions variables.
Description of the Instances
To validate the SLAUPR model, random instances based on the behavior of the actual data were generated, and to analyze its patterns, 6 repetitions for each proposed instance were performed.
The size of each instance was related to the number of spaces available to allocate product (i) and type of products requested (k) in each order (p). The products to be assigned (o) may differ from the type of product requested, since it must only be assigned once if a product is requested in several orders.
The Figure 3 shows how the 4 types of scenarios for computational experimentation were created:
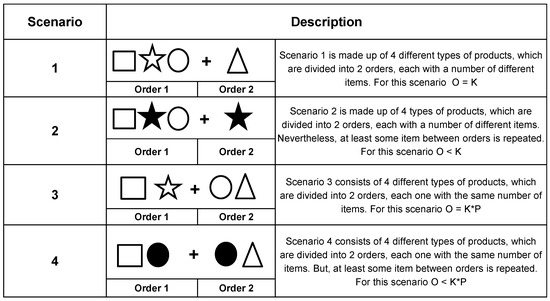
Figure 3.
Scenario descriptions.
For the sizes of the instances, the number of spaces available was taken into account and categorized as follows:
- Small: It considers half of the available spaces in Area A (up to 16 spaces) and is created randomly based on the behavior of the case study. These instances are numbered from 1 to 15, see Table 2.
Table 2. Results for small size instances.
- Medium: It considers Areas A and B (from 32 to 61 spaces). Instances 16–19, 22–25, 28–31 and 34–37 have the behavior of real data; on average, per day, the minimum number of spaces visited is 32, the number of products requested is 8 (in the four scenarios) and the orders number 3. These instances are numbered from 16 to 69, see Table 3. For a better analysis, we used medium type 1, which are all analyzed in Area A (in 32 spaces) and type 2 in both areas (up to 61 spaces).
Table 3. Results for medium instances.
- Large: It considers Areas A, B, C and D. In these instances, Scenario 4 was not considered. Number 79 has the behavior of the actual data, considering the minimum average number of orders per day. These instances are numbered from 70 to 79, see Table 4.
Table 4. Results for large size instances.
For the execution of all computational experiments, a computer with an Intel Xenon 2.4 Ghz processor, 64 Gb RAM and a hard disk with 2 TB capacity was used. The model was developed in the GAMS software version 23.8.2 Cplex 12.
5. Results and Discussion
This section details the computational experimentation that was carried out to validate the model proposed in the previous section.
So as to accomplish the proposed model, stop criteria were determined according to the number of available spaces. The criteria were as follows:
For instances that cover up to 32 spaces, the stop time was 3600 s; up to 61 spaces, 2 h; up to 121 spaces, 3 h; and finally, all spaces in 4 h.
The average results for small, medium and large size instances, respectively, are shown in Table 2, Table 3 and Table 4. In those tables the first six columns detail the descriptions of the instances, where i, k, o, p and scenario were defined in the Section 4. In the Table 2 and Table 3, the seventh column reports the “First optimality Gap (%)”; in the eighth one, “Relative Gap (%)” sets a relative tolerance on the gap between the best integer objective and the objective of the best node remaining [48]. For the calculation of the relative gap, the Equation (19) was employed and the last column, “Time (Sec)”, is the stop time limit given to the instance or the time to find the optimal solution.
In the Table 4, the tenth column that reports the “Linear relaxation (LR)”.
In Table 2, results for small size instances are shown, in which we can observe for most of the analyzed instances, the optimal solution was found in less than an hour; however, for instances where the relative gap was on average 50% (10, 11,13, 14, 15), it was due to:
- An increase in the number of available spaces i of the products, requested k and assigned o, and of the orders p.
- The type of scenario, in this case 3 and 4, since as we can see instances 11, 13 and 15 are those that have the highest relative gaps, above 70%; therefore, for this type of instance we can identify that the most complicated cases are under these scenarios.
- The increase in relative gap is related to the proximity that exists between the number of available spaces and the quantity of products assigned. On average, according to the instances shown, as long as the number of spaces is greater than the quantity of products assigned (), the faster a solution is found; but the closer they get (), the more the complexity increases. This behavior occurs, mainly, in Scenarios 3 and 4; therefore, the instances under these scenarios will present greater complexity.
The results of the medium size instances are shown in Table 3, and in addition to the behaviors described above, it can also be observed that:
- For type 1 instances, when the proximity between the number of available spaces and the quantity of products assigned is approximately 25% (), in less than 3600 s, the Relative Gap is around 16%, 3 of them found the optimal solution and the highest of 36% (instances 16,17, 22–25, 28). However, for type 2, this ratio shows relative gap greater than 80%.
- Nevertheless, when the proximity is approximately 50% () the complexity increases; in this case, in comparison to small instances, it does not depend on the scenario to find the optimal solution; it is not even possible to find the first feasible integer solution in less than 3600 or 7200 s for type 1 or 2 instances, respectively, except for the case when only one order is requested (instance 32).
- The most complex scenarios continue to be 3 and 4, unlike when only one order is requested, because under this criterion, it is possible to find an optimal solution (type 28 and 32 instances) for medium type 1 instances. Note that type 2 reaches the point of not finding the first feasible integer solution, regardless of the scenario or the number of orders.
Finally, the results of the large size instances are shown in Table 4, in which we can observe that:
- We can observe that in most cases, the first feasible integer solution was not found, though in cases with a relative gap, one of the repetitions of instances 74 and 75 yielded the results shown in the table, but the rest did not show any results. Instance 78 was under the criteria of a single order and the six repetitions show the average relative gap present.
- On the other hand, from small and medium sizes instances Scenarios 3 and 4 are the ones that present the greatest complexity, except when only one order is requested; therefore, no more large size instances were considered, as they were expected to not show any results.
- In instance number 79, although a longer runtime was considered, it was not possible to find linear relaxation; therefore, a gap was not obtained.
Considering the information described above, we found that for some real instances, the model does not find an initial solution, and for others, its linear relaxation was not found; therefore, it is concluded that the proposed model is difficult to solve for this type of instance, as [49] specifies.
6. Conclusions
Some of the fundamental processes of the supply chain are those related to storage; specifically in this work, the improvement of the efficiency for order picking in the picking area.
As a solution to a case study in which the picking area has a warehouse with a general layout—and despite having software to perform the order picking process, the system does not allow performing the collection of orders according to the weight of the product, which generates more work and an increase in operating costs—a mathematical model was proposed that takes into account the weight considerations of the products. This model is a fundamental piece because similar work has been not found in the literature where the efficiency of order preparation is improved, assigning initial unique storage locations, routing simultaneously and contemplating precedence restrictions based on the product weight and characteristics mentioned in the case study.
The proposed model helps to support tactical decision-making to obtain a correct location of product, making the picking time shorter. The model would be applied every time the demand changes; however, the WMS would be the support for daily operational decisions, since with the locations determined by the model, the results of the routes given by this software could improve.
To test the computational behavior of the model, the experimentation was carried out considering four scenarios and three sizes of instances, obtaining the following results: optimal solutions for approximately 64% of the small instances and 5% of the medium ones; however, for larger instances and similar to those that are actually managed, results were not found for the established time. As before mentioned, in the Section 5, the complexity of the problem is mainly related to the proximity between the quantity of available spaces and the quantity of products assigned; therefore, those aspects are work for the future, as shall be a more specific solution strategy for the problem, aiming for any possible improvements that can be implemented.
Author Contributions
J.B.Z. and J.A.S.M. contributed in this work in the formulation of the mathematical model and the process of experimentation, giving a practical approach to its implementation. T.E.S.F., editing and writing of the document; giving a practical approach to the case study. J.A.M.S. conducted a literature review based on the importance of the order picking problem, in addition to analyzing the state of the art of the models applied to the solutions of these problems. All authors have read and agreed to the published version of the manuscript.
Funding
This research was funded by a national scholarships Mexico’s National Council for Science and Technology (CONACyT) (456828).
Acknowledgments
This work was founded by Facultad de Ingeniería Mecánica Eléctrica, Universidad Autónoma de Nuevo León, Mexico, and additionally by the Council for Science and Technology (CONACYT) with a scholarship.
Conflicts of Interest
The authors declare no conflict of interest.
References
- Goetschalckx, M.; Ashayeri, J. Classification and design of order picking systems. Logist. World 1989, 2, 99–106. [Google Scholar] [CrossRef]
- Tompkins, J.; White, J.; Bozer, Y.; Tanchoco, J.M.A. Facilities Planning. In Facilities Planning, 4th ed.; John Wiley and Sons: Hoboken, NJ, USA, 2010; p. 864. [Google Scholar]
- Henn, S.; Koch, S.; Doerner, K.F.; Strauss, C.; Wäscher, G. Metaheuristics for the Order Batching Problem in Manual Order Picking Systems. Eur. J. Oper. Res. 2010, 3, 82–105. [Google Scholar] [CrossRef]
- Zuniga, C.A.; Olivares-Benitez, E.; Tenahua, A.M.; Mujica, M.A. A methodology to solve the Order Batching Problem. IFAC-PapersOnLine 2015, 28, 1380–1386. [Google Scholar] [CrossRef]
- De Koster, R.; Le-Duc, T.; Roodbergen, K.J. Design and control of warehouse order picking: A literature review. Eur. J. Oper. Res. 2007, 182, 481–501. [Google Scholar] [CrossRef]
- Bartholdi, J.; Hackman, S. Warehouse and Distribution Science Release 0.96. 2014. Available online: https://www2.isye.gatech.edu/~jjb/wh/book/editions/wh-sci-0.96.pdf (accessed on 10 September 2019).
- Davarzani, H.; Norrman, A. Toward a relevant agenda for warehousing research: literature review and practitioners’ input. Logist. Res. 2016, 8, 1–18. [Google Scholar] [CrossRef]
- Brynzér, H.; Johansson, M.I. Storage location assignment: Using the product structure to reduce order picking times. Int. J. Prod. Econ. 1996, 46, 595–603. [Google Scholar] [CrossRef]
- Manzini, R.; Bindi, F.; Ferrari, E.; Pareschi, A. Correlated Storage Assignment and Iso-Time Mapping Adopting Tri-Later Stackers. A Case Study from Tile Industry. In Warehousing in the Global Supply Chain; Springer: London, UK, 2012; pp. 373–396. [Google Scholar]
- Van Gils, T.; Ramaekers, K.; Caris, A.; De Koster, R.B.M. Designing efficient order picking systems by combining planning problems: State-of-the-art classification and review. Eur. J. Oper. Res. 2018, 267, 1–15. [Google Scholar] [CrossRef]
- Elbert, R.M.; Franzke, T.; Glock, C.H.; Grosse, E.H. The effects of human behavior on the efficiency of routing policies in order picking: The case of route deviations. Int. J. Prod. Res. 2017, 111, 537–551. [Google Scholar] [CrossRef]
- Grosse, E.H.; Glock, C.H.; Neumann, W.P. Human factors in order picking: A content analysis of the literature. Int. J. Prod. Res. 2017, 55, 1260–1276. [Google Scholar] [CrossRef]
- De Koster, R. Automated and Robotic Warehouses: Developments and Research Opportunities. Logist. Infrastruct. 2015, 2, 4–18. [Google Scholar]
- Azadeh, K.; De Koster, R.; Roy, D. Robotized and automated warehouse systems: Review and recent developments. Transp. Sci. 2019, 53, 917–945. [Google Scholar] [CrossRef]
- Masae, M.; Glock, C.H.; Grosse, E.H. Order picker routing in warehouses: A systematic literature review. Int. J. Prod. Econ. 2019, in press. [Google Scholar] [CrossRef]
- Ratliff, H.D.; Rosenthal, A.S. Order-Picking in a Rectangular Warehouse: A Solvable Case of the Traveling Salesman Problem. Oper. Res. 1983, 31, 507–521. [Google Scholar] [CrossRef]
- Manzini, R.; Gamberi, M.; Persona, A.; Regattieri, A. Design of a class based storage picker to product order picking system. Int. J. Adv. Manuf. Technol. 2007, 32, 811–821. [Google Scholar] [CrossRef]
- Petersen, C.G.; Schmenner, R.W. An Evaluation of Routing and Volume-based Storage Policies in an Order Picking Operation. Comput. Oper. Res. 1999, 30, 481–501. [Google Scholar] [CrossRef]
- Theys, C.; Bráysy, O.; Dullaert, W.; Raa, B. Using a TSP heuristic for routing order pickers in warehouses. Eur. J. Oper. Res. 2010, 200, 755–763. [Google Scholar] [CrossRef]
- Roodbergen, K.J.; Koster, R. Routing methods for warehouses with multiple cross aisles. Int. J. Prod. Res. 2001, 39, 1865–1883. [Google Scholar] [CrossRef]
- Shqair, M.; Altarazi, S.; Al-Shihabi, S. A statistical study employing agent-based modeling to estimate the effects of different warehouse parameters on the distance traveled in warehouses. Simul. Model. Pract. Theory 2014, 49, 122–135. [Google Scholar] [CrossRef]
- Žulj, I.; Glock, C.H.; Grosse, E.H.; Schneider, M. Picker routing and storage-assignment strategies for precedence-constrained order picking. Comput. Ind. Eng. 2018, 123, 338–347. [Google Scholar] [CrossRef]
- Goetschalckx, M.; Ratliff, H.D. An efficient algorithm to cluster order picking items in a wide aisle. Eng. Costs Prod. Econ. 1988, 13, 263–271. [Google Scholar] [CrossRef]
- Van Gils, T.; Ramaekers, K.; Braekers, K.; Depaire, B.; Caris, A. Increasing order picking efficiency by integrating storage, batching, zone picking, and routing policy decisions. Int. J. Prod. Econ. 2018, 197, 243–261. [Google Scholar] [CrossRef]
- Çelk, M.; Süral, H. Order picking under random and turnover-based storage policies in fishbone aisle warehouses. IIE Trans. 2014, 46, 283–300. [Google Scholar] [CrossRef]
- Daniels, R.L.; Rummel, J.L.; Schantz, R. A model for warehouse order picking. Eur. J. Oper. Res. 1998, 105, 1–17. [Google Scholar] [CrossRef]
- Scholz, A.; Henn, S.; Stuhlmann, M.; Wäscher, G. A new mathematical programming formulation for the Single-Picker Routing Problem. Eur. J. Oper. Res. 2016, 253, 68–84. [Google Scholar] [CrossRef]
- Kulak, O.; Sahin, Y.; Taner, M.E. Joint order batching and picker routing in single and multiple-cross-aisle warehouses using cluster-based tabu search algorithms. Flex. Serv. Manuf. J. 2012, 24, 52–80. [Google Scholar] [CrossRef]
- Lin, C.C.; Kang, J.R.; Hou, C.C.; Cheng, C.Y. Joint order batching and picker Manhattan routing problem. Comput. Ind. Eng. 2016, 95, 164–174. [Google Scholar] [CrossRef]
- Van Gils, T.; Ramaekers, K.; Caris, A.; De Koster René, B.M. Distance approximations for routing manual pickers in a warehouse. IIE Trans. 1993, 25, 78–87. [Google Scholar]
- Caron, F.; Marchet, G.; Perego, A. Routing policies and COI-based storage policies in picker-to-part systems. Int. J. Prod. Res. 1998, 36, 713–732. [Google Scholar] [CrossRef]
- De Koster, R.; Van Der Poort, E. Routing orderpickers in a warehouse: A comparison between optimal and heuristic solutions. IIE Trans. 1998, 30, 469–480. [Google Scholar] [CrossRef]
- Vaughan, T.; Petersen, C. The effect of warehouse cross aisles on order picking efficiency. Int. J. Prod. Res. 1999, 37, 881–897. [Google Scholar] [CrossRef]
- Dekker, R.; De Koster, M.B.M.; Roodbergen, K.J.; Van Kalleveen, H. Improving Order Picking Response Time at Ankor’s Warehouse. Interfaces 2004, 34, 303–313. [Google Scholar] [CrossRef]
- Chabot, T.; Lahyani, R.; Coelho, L.C.; Renaud, J. Order picking problems under weight, fragility and category constraints. Int. J. Prod. Res. 2017, 55, 636–6379. [Google Scholar] [CrossRef]
- Matusiak, M.; de Koster, R.; Kroon, L.; Saarinen, J. A fast simulated annealing method for batching precedence-constrained customer orders in a warehouse. Int. J. Prod. Res. 2014, 236, 968–977. [Google Scholar] [CrossRef]
- Hwang, H.; Oh, Y.H.; Lee, Y.K. An evaluation of routing policies for order-picking operations in low-level picker-to-part system. Int. J. Prod. Res. 2004, 42, 3873–3889. [Google Scholar] [CrossRef]
- Chan, F.T.; Chan, H.K. Improving the productivity of order picking of a manual-pick and multi-level rack distribution warehouse through the implementation of class-based storage. Int. J. Prod. Res. 2011, 38, 2686–2700. [Google Scholar] [CrossRef]
- Dijkstra, A.S.; Roodbergen, K.J. Exact route-length formulas and a storage location assignment heuristic for picker-to-parts warehouses. Transp. Res. Part E 2017, 102, 38–59. [Google Scholar] [CrossRef]
- Grosse, E.H.; Glock, C.H.; Ballester-Ripoll, R. A simulated annealing approach for the joint order batching and order picker routing problem with weight restrictions. Int. J. Oper. Quant. Manag. 2014, 20, 65–83. [Google Scholar]
- Bahrami, B.; Aghezzaf, E.H.; Limere, V. Using Simulation to Analyze Picker Blocking in Manual Order Picking Systems. Order picking problems under weight, fragility and category constraints. Procedia Manuf. 2017, 11, 1798–1808. [Google Scholar] [CrossRef]
- Azadnia, A.H.; Taheri, S.; Ghadimi, P.; Mat Saman, M.Z.; Wong, K.Y. Order Batching in Warehouses by Minimizing Total Tardiness: A Hybrid Approach of Weighted Association Rule Mining and Genetic Algorithms. Sci. World J. 2013, 2013, 246578. [Google Scholar] [CrossRef]
- Rouwenhorst, B.; Reuter, B.; Stockrahm, V.; van Houtum, G.J.; Mantel, R.J.; Zijm WH, M. Warehouse design and control: Framework and literature review. Eur. J. Oper. Res. 2000, 122, 515–533. [Google Scholar] [CrossRef]
- Shiau, J.Y.; Lee, M.C. A warehouse management system with sequential picking for multi-container deliveries. Comput. Ind. Eng. 2010, 58, 382–392. [Google Scholar] [CrossRef]
- Battini, D.; Glock, C.H.; Grosse, E.H.; Persona, A.; Sgarbossa, F. Human energy expenditure in order picking storage assignment: A bi-objective method. Comput. Ind. Eng. 2016, 94, 147–157. [Google Scholar] [CrossRef]
- Miller, C.E.; Tucker, A.W.; Zemlin, R.A. Integer programming formulations and traveling salesman problems. J. Assoc. Comput. Mach. 1960, 7, 326–329. [Google Scholar] [CrossRef]
- Jarvis, J.M.; McDowell, E.D. Optimal Product Layout in an Order Picking Warehouse. IIE Trans. 1991, 23, 93–102. [Google Scholar] [CrossRef]
- IBM Knowledge Center. Available online: https://www.ibm.com/support/knowledgecenter/SSSA5P_12.6.0/ilog.odms.cplex.help/CPLEX/Parameters/topics/EpGap.html (accessed on 18 September 2019).
- Weidinger, F. Picker routing in rectangular mixed shelves warehouses. Comput. Oper. Res. 2018, 95, 139–150. [Google Scholar] [CrossRef]
© 2020 by the authors. Licensee MDPI, Basel, Switzerland. This article is an open access article distributed under the terms and conditions of the Creative Commons Attribution (CC BY) license (http://creativecommons.org/licenses/by/4.0/).