Article

Strain Analysis on Electrochemical Failures of Nanoscale Silicon Electrode Based on Three-Dimensional In Situ Measurement

1
Department of Mechanics, School of Mechanical Engineering, Tianjin University, 135 Yaguan Road, Jinnan District, Tianjin 300350, China
2
Tianjin Key Laboratory of Modern Engineering Mechanics, School of Mechanical Engineering, Tianjin University, 135 Yaguan Road, Jinnan District, Tianjin 300350, China
3
School of Chemical Engineering and Technology, Tianjin University, 135 Yaguan Road, Jinnan District, Tianjin 300350, China
*
Authors to whom correspondence should be addressed.
Appl. Sci. 2020, 10(2), 468; https://doi.org/10.3390/app10020468
Submission received: 17 December 2019 / Revised: 4 January 2020 / Accepted: 6 January 2020 / Published: 8 January 2020

Abstract

:
Nanoscale silicon film electrodes in Li-ion battery undergo great deformations leading to electrochemical and mechanical failures during repeated charging-discharging cycles. In-situ experimental characterization of the stress/strain in those electrodes still faces big challenges due to remarkable complexity of stress/strain evolution while it is still hard to predict the association between the electrode cycle life and the measurable mechanical parameters. To quantificationally investigate the evolution of the mechanical parameters, we develop a new full field 3D measurement method combining digital image correlation with laser confocal profilometry and propose a strain criterion of the failure based on semi-quantitative analysis via mean strain gradient (MSG). The experimental protocol and results illustrate that the revolution of MSG correlates positively with battery capacity decay, which may inspire future studies in the field of film electrodes.

1. Introduction

Nowadays, rechargeable lithium-ion batteries (LIBs) have become the main power source of modern electronic products such as electric vehicles, cellphones and other portable electronic devices [1,2,3], due to their advantages of high specific energy, small self-discharge, no memory effect and good circulation performance. To satisfy the increasing demands for LIBs with higher capacity, various improved strategies of LIBs techniques have been proposed [4,5,6]. One effective approach to enhance the specific capacity (SC) is to employ alternative anode materials with higher SC. Silicon (Si) draws great attention in recent years as a promising anode material for it has the highest theoretical SC value (about 3579 mAhg−1) among those potentially alternative anode materials in LIBs so far. This is because, based on the up to date knowledge, Si anodes can be embedded with more lithium ions when LIBs work [7]. However, the commercial applications of Si anodes are hindered by several factors. The most challenging problem is that Si anodes suffer from considerable volumetric changes during the lithiation/delithiation processes (more than 400%) [6,8,9,10], which directly results in mechanical failures after several charge/discharge cycles [6,11,12,13,14,15,16,17,18].
In the past ten years, silicon-based LIBs have been studied by many researchers from theoretical and experimental aspects, respectively. In the theoretical aspect, the interactions between the micro structures of the silicon and the lithium ions during charging/discharging process are of main concern, based on either the elasticity or diffusion theories. Specifically, Lu et al. and Fang proposed an analytical method that describes the dynamic process of the silicon particles and lithium ions [19,20]. Suo and Qu established a mechanical-chemical coupling model based on the elastoplastic theory [21,22,23]. Zhang developed the electrochemical-mechanical coupling model, by which the influence of the elastic modulus on diffusion phenomena has been investigated [24]. Xie and Li et al. investigated the stress distributions in LIBs by a traditional cantilever model, while the rigidity evolution of the silicon anode has been also obtained [25,26]. Liu et al. analyzed the insertion-induced stress in a Si anode and the interfacial decohesion effect of a silicon thin film electrode adhesively bonded to a rigid substrate using finite element analysis (FEA) [27]. M.T. Demirkan investigated the influence of the anode density on the LIBs capacity and cycle life [16]. In the experimental aspect, the studies mainly focus on in situ observations and measurements of the anode deformation, phenomenologically or quantificationally. On the one hand, the fracture/cracking phenomena of the Si anode have been characterized phenomenologically through various imaging systems, including the atom force microscope (AFM) [8] and the optical microscope [28]. On the other hand, the anode deformation/deflection have been measured quantificationally to depict the mechanical behavior of the Si anode combining with the modelling calculations [8,25,28,29,30,31]. Furthermore, some researchers were inspired by nanotechnology and consequently optimized the nanostructures of Si anode to improve the LIBs cycling performance [5,6,32]. A key factor to comprehensively understand the failure mechanism of the Si anode is that the full field deformation and the three-dimensional (3D) shape can be characterized quantificationally in real time during the lithiation/delithiation processes. Traditional full field displacement/strain measurement techniques are mostly based on optical methods, such as DIC (digital image correlation) [33,34], Moiré methods [35,36,37,38] and grid methods [39,40]. However, in situ measurement of Si anode poses extra problems when the anodes are within the electrolyte when they are in service. In addition, it is difficult to deposit any speckles or other types of optical marks onto the anode surface.
In the current study, the above-mentioned issues in the experimental aspect have been discussed in detail. The novelty of this work includes the following. A real time/full field 3D measurement method, combining the traditional DIC technology with the laser scanning method, is developed to realize the characterization of anode deformation in 3D space. A parameter defined as mean strain gradient (MSG) is proposed to describe the uniformity extent of electrochemical reactions based on full field strain distribution data. Besides, a button cell with an optical window opened, matched with a laser confocal scanning microscopy (LCSM) system, is designed and self-refitted, by which the anode surface can be observed and measured in situ. The remainder of the paper is divided into the following sections. In the Methodology Section, the basic principles of the in-suit measurement method are presented. In the Experimental Section, the sample preparation, the testing procedures and other experimental details are described. In the Results and Discussion Section, the experimental results are discussed and analyzed. In the Conclusion Section, we provide a summary of the study.

2. Measurement Principle

The 3D-DIC technique is generally believed to be one of the most effective full field strain/surface shape measurement methods [33,34,41]. Although 3D surface deformation measurement can be easily achieved using 3D-DIC method with satisfactory accuracy, the direct application of such a technique to the measurement of anodes in LIBs is still challenging, because the traditional 3D-DIC method depends on binocular vision technique using various imaging devices. Commonly used methods of 3D reconstruction with a single imaging device, such as structured light projection (SLP) and laser scanning can simply measure the 3D surface shape instead of 3D deformation. To achieve genuine 3D deformation determination, extra in-plane displacement measurement must be introduced and combined. In the current study, the authors employ such a strategy by combining the in-plane (2D) DIC method with laser scanning using an LCSM system. The imaging principle of the system is illustrated in Figure 1.
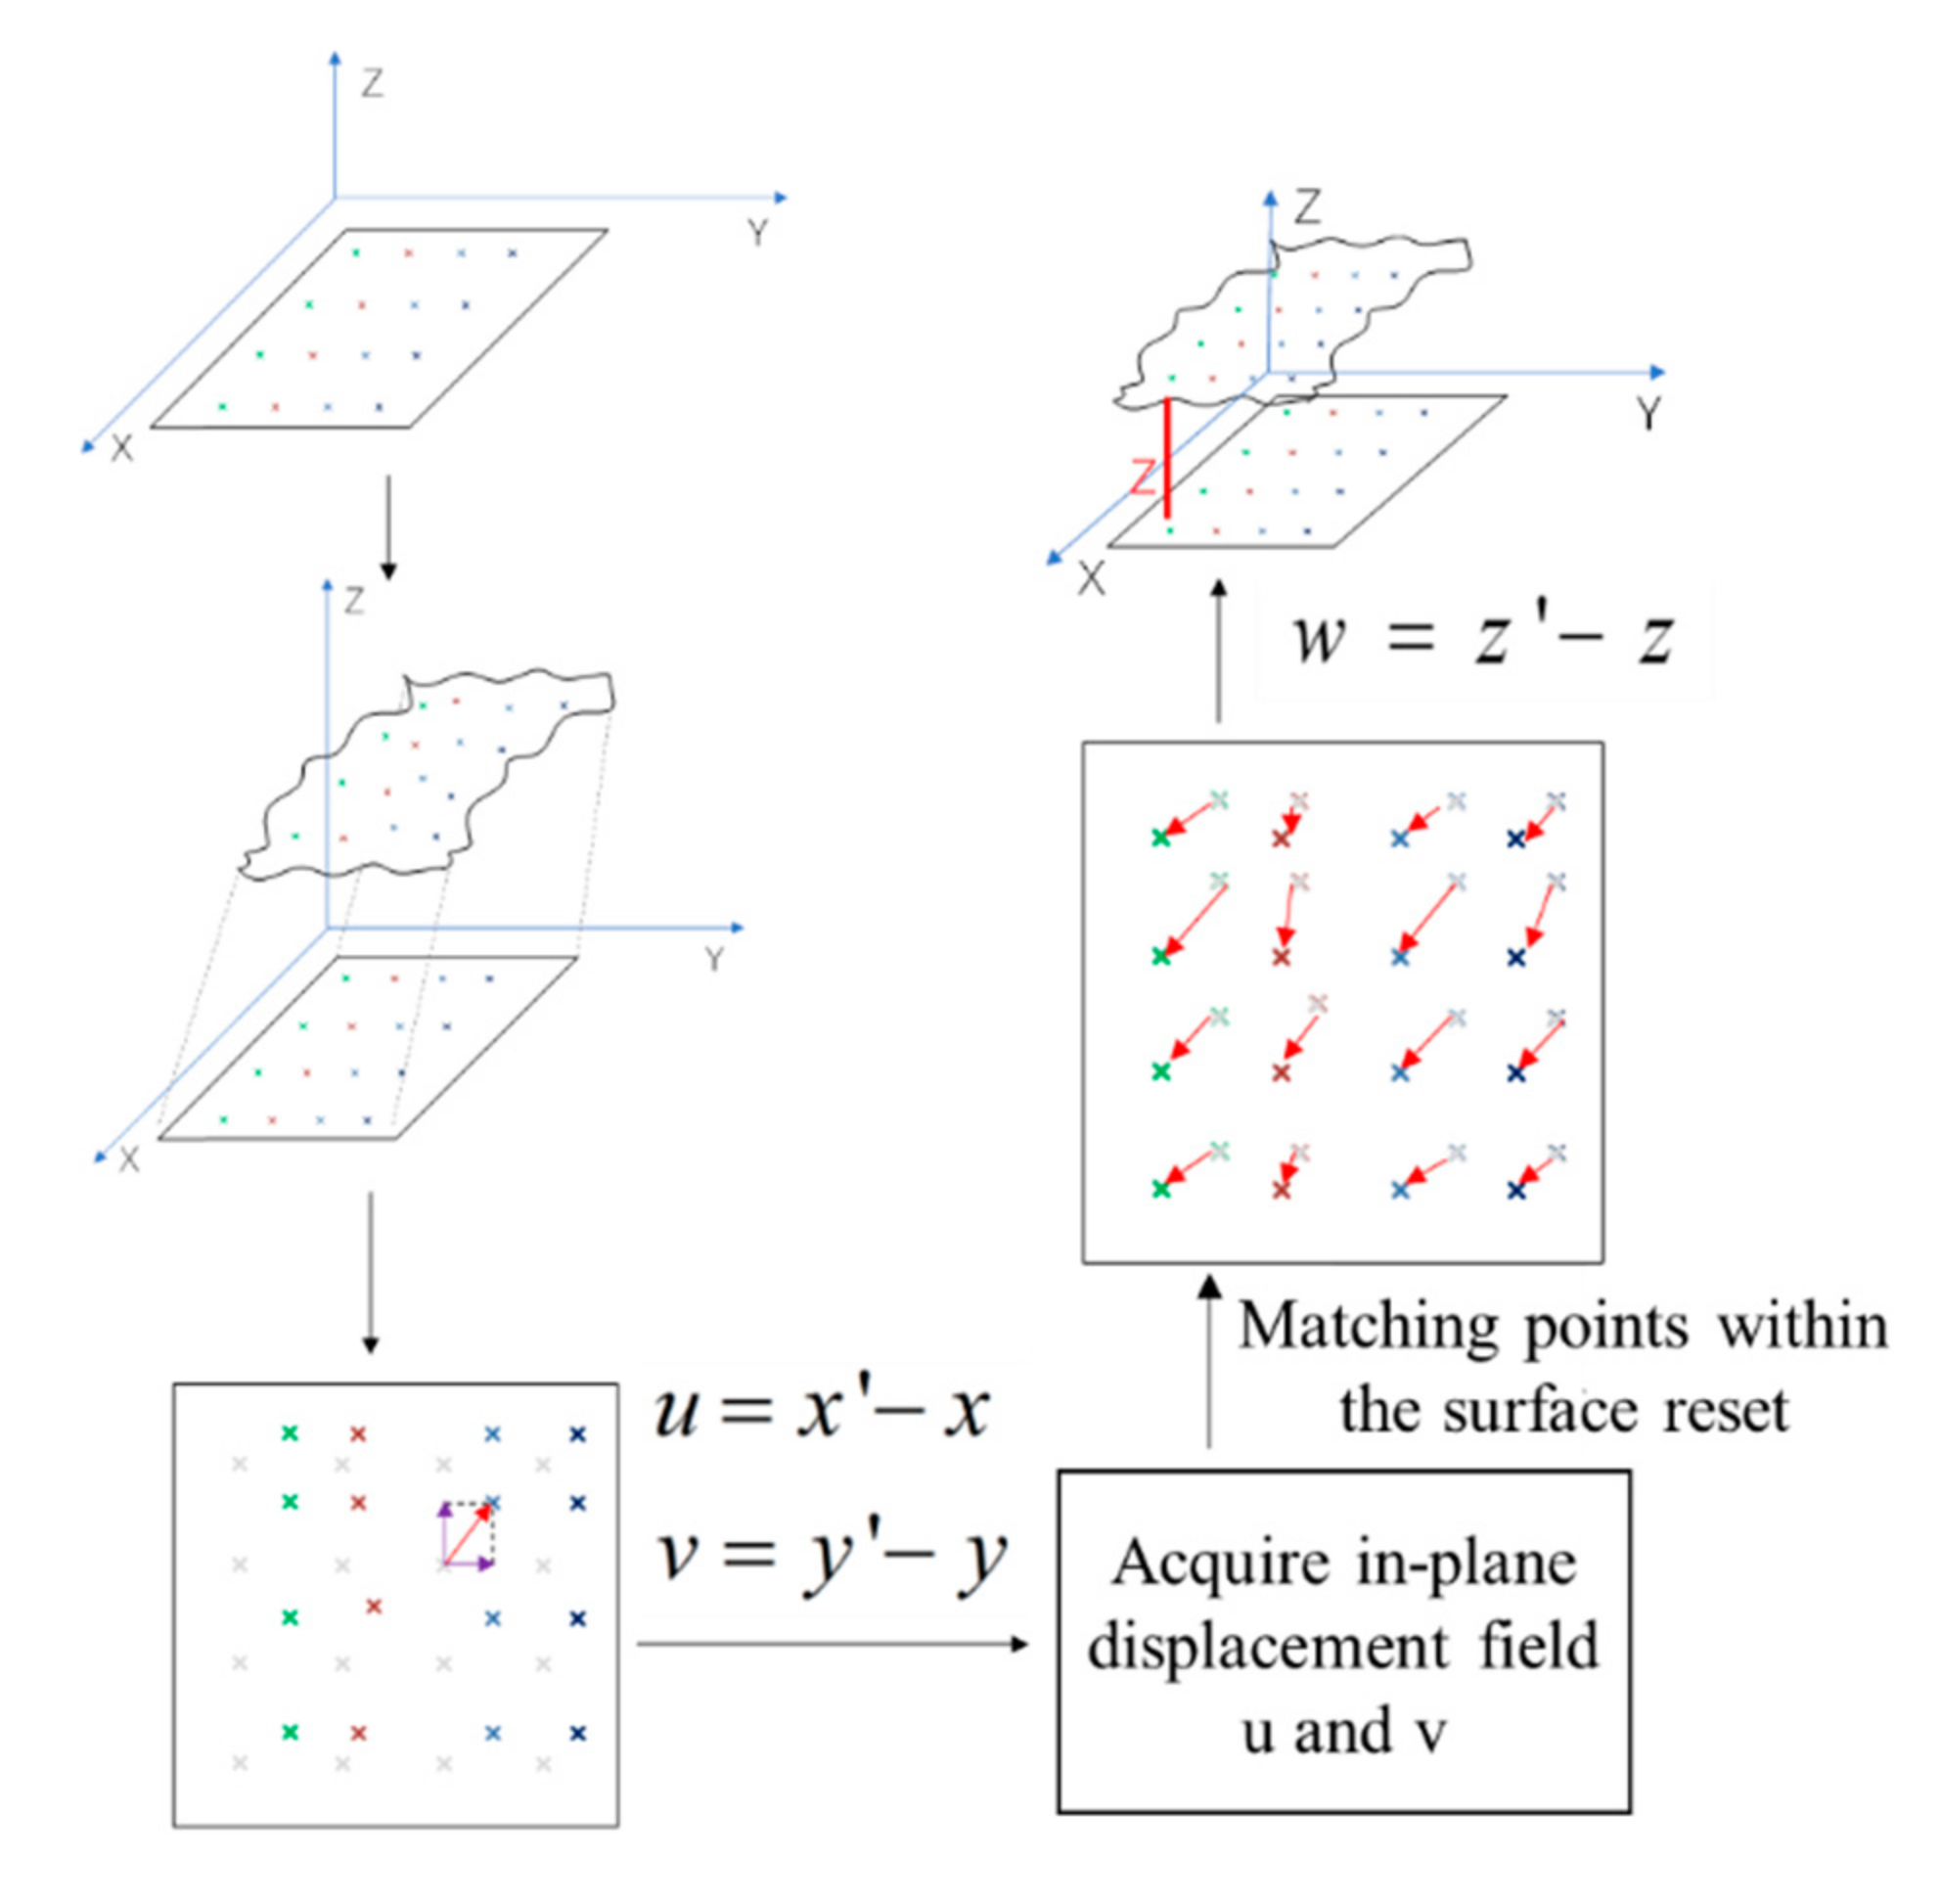
As shown in Figure 1, an LCSM system has the ability to offer grey level images of 256 bits describing the in-plane features and to scan the electrode surface describing the surface shape, simultaneously. However, the in-plane displacement distribution obtained by the DIC method and the 3D surface shape by laser scanning are coupled. The key issue here is to decouple such information. The decoupling process can be described as follows:
(1)
Images of 256 bit grey-level in laser mode and the surface shape data of the tested electrode are simultaneously captured with an LCSM before the electrode deforms, expressed as I x , y and Z x , y , respectively. Note that I x , y which denotes the grey-level values distribution and Z x , y which denotes the height values distribution are the functions of the in-plane coordinate values x , y .
(2)
Images of 256 bit grey-level (in color mode) and the surface shape data (in laser mode) of the tested the electrode are simultaneously captured after the electrode deforms, expressed as I x , y and Z x , y , respectively.
(3)
In-plane displacement distribution of the electrode surface can be determined with color mode images by DIC technique. The displacement along two mutually perpendicular directions can be expressed as u x , y and v x , y , respectively.
(4)
The 3D surface is shifted back to its original location (before it deforms) by subtracting the in-plane displacement distribution values, rewritten as Z x u , y v .
(5)
Decoupled out-of-plane displacement by subtracting Z x , y from   Z x u , y v . The decoupled out-of-plane displacement is written as w x , y .
Through the above five steps, a genuine 3D deformation measurement is achieved. The overall measurement principle can be summarized and illustrated in Figure 2.
The measurement principle, the algorithm and other details of the traditional DIC/3D DIC technique have been discussed in a series of articles [33,34,41]. Hence, in the current study the relevant contents of DIC are not repeated.
The theoretical error of the 3D deformation calculated according to the method shown in Figure 2 is as follows: displacement sensitivity is about 0.005 to 0.05 pixels, and strain sensitivity is about 50 to 100 microstrains.

3. Experimental

3.1. Sample Preparation

A typical inner structure of the button cell CR2032 is illustrated in Figure 3a, in which the anode/working electrode and the cathode material/counter electrode located beside the opposite sides of the separator. Obviously, the common button cell structures with the anode optically invisible are not suitable for in situ measurement. A redesigned and reassembled button cell CR2032 with an opening optical window is thus developed, presented in Figure 3b, in which the anode (working electrode) is placed reversely close to the optical window. Besides, to shorten the lithium ion transmission path, the electrode structure was designed as a gradient structure, as seen the yellow box in Figure 3b. Such a structural design not only ensures the shortest flow path of lithium ion, but also realizes in situ observation and measurement under a microscope. Furthermore, unlike the traditional button cell CR2032, a working electrode in the form of nanoscale Si thin film is employed in the current study. The Si film electrode is manufactured by an RF magnetron sputtering method, which indicates that the Si film electrode is amorphous [42]. The RF magnetron sputtering parameters are as follows: rate of flow of Ar is 40 mL/min, intensity of pressure is 2.0 Pa, power of working is 200 W, time of working is 40 min. After the deposition of Si thin film on a circular copper foil collector as the substrate, the thickness of the film was measured using a laser profiler, and the thickness of Si thin film is 800 nm. The Si film electrode along with the copper foil substrate and other essential elements/materials shown in Figure 3 are subsequently assembled together in a glove-box filled with ultra-high purity argon (water content < 0.1 ppm, oxygen content < 0.1 ppm). The quartz glass window was sealed with cement (GSE, K-737). The sealed button cell was filled with 1 M LiPF6 in ethylene carbonate and dimethyl carbonate (EC:DEC = 1:1 vol%, Tianjin Jinniu Power Sources Material Company, China) as the electrolyte. The diameter of the optically visible window is 6 mm. The basic parameters of the elements/materials of the self-assembled button cell are listed in Table 1.
Well assembled button cell sample were still put in a calorstat for 12 h before their first charging/discharging cycle. The assembled button cell is shown in Figure 3c.

3.2. Electrochemical Cycling Experiments

The electrochemical cycling tests of charging/discharging process were conducted at room temperature using a battery testing system that offers 8 signal channels in one experiment (BTS-8, KJ GROUP). The cell was charged/discharged at a constant density of i = 340 mAhg−1 and the charge/discharge rate was about 0.1 C (the theoretical specific capacity of silicon is 3579 mAh g−1). The cell was maintained as an open circuit for two minutes between two arbitrary consecutive galvanostatic charge and discharge process. The maximum and minimum values of the charging/discharging voltages are 0.5 V and 2.5 V, respectively. The cell runs 14 cycles in total in the current experiment, in which the projection/two-dimensional images as well as the 3D surface shape of the ROIs (region of interest) of the Si film electrode were in situ captured and recorded every three minutes using an LCSM system (Olympus OLS5000) through the quartz glass.

3.3. Imaging Processing Parameters

The positions in the working electrode of the one ROI selected to calculate the strain and the out-of-plane displacement are shown in Figure 3d. The physical dimensions and the pixel dimensions of ROI are 190 μ m × 190 μ m and 300 pixels × 300 pixels, respectively. The pixel dimensions of the subset employed in DIC calculation are 10 pixels.

4. Results and Discussion

4.1. Surface Shape/strain Distribution of the Si Electrode

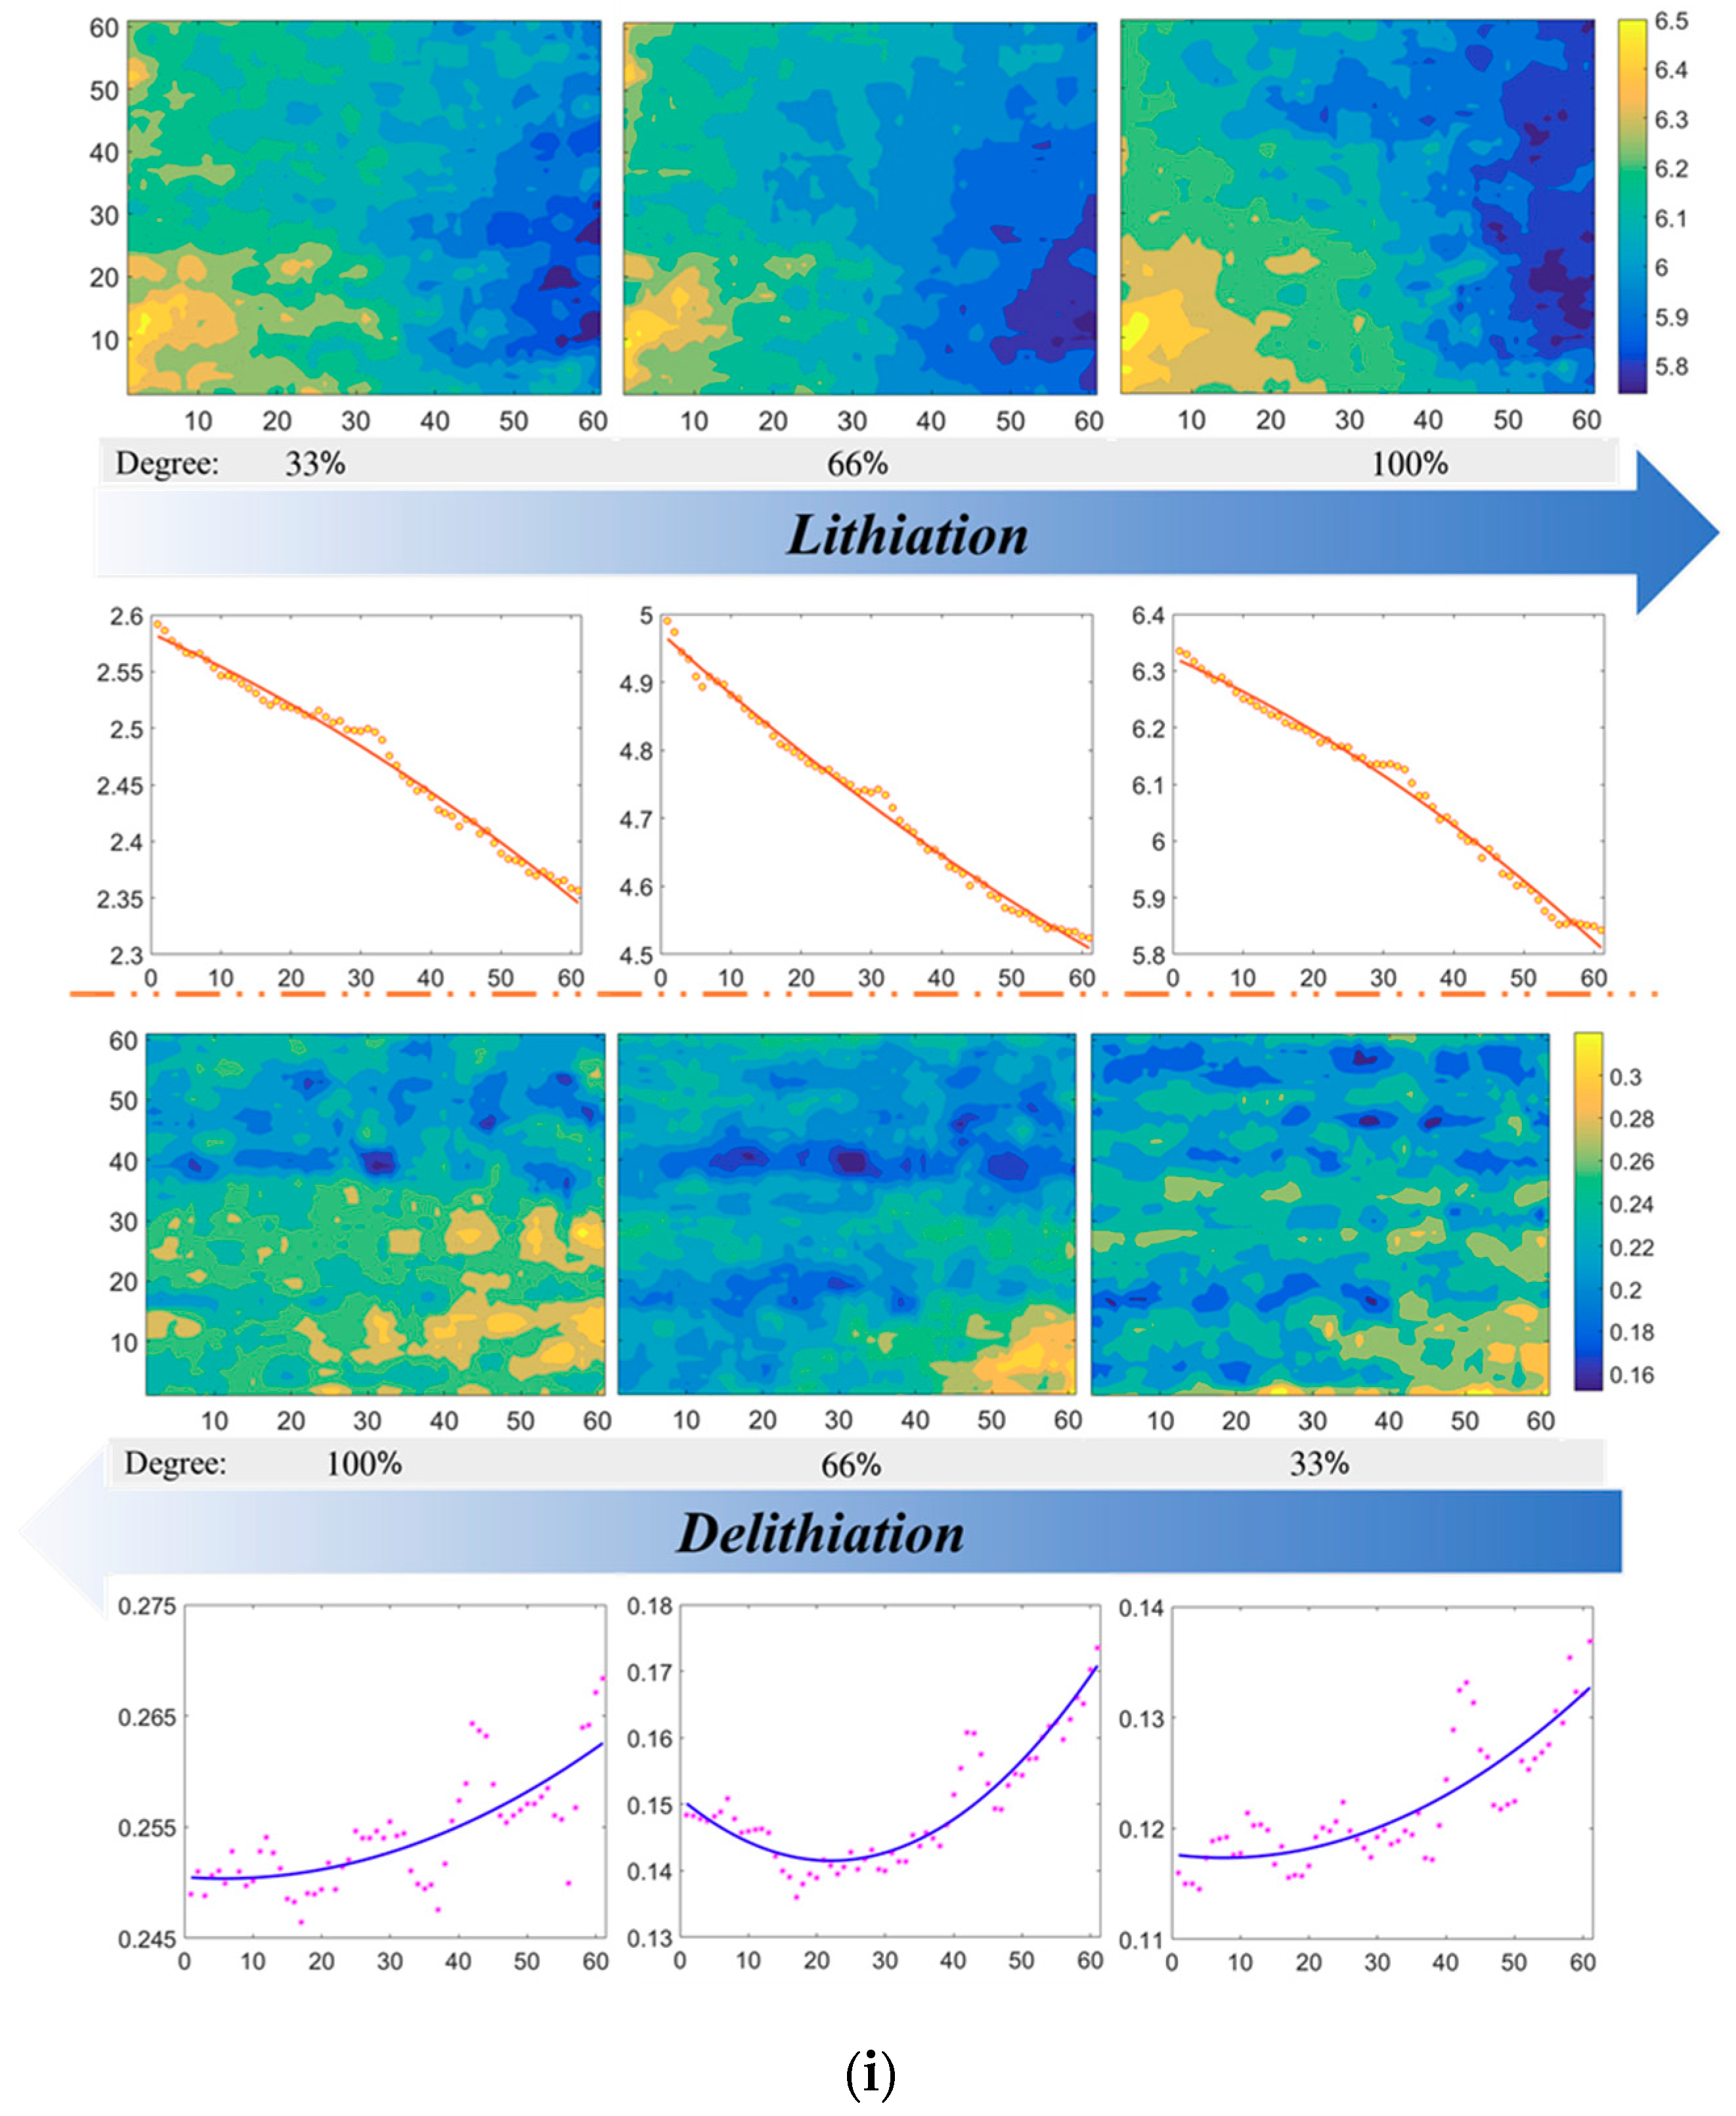
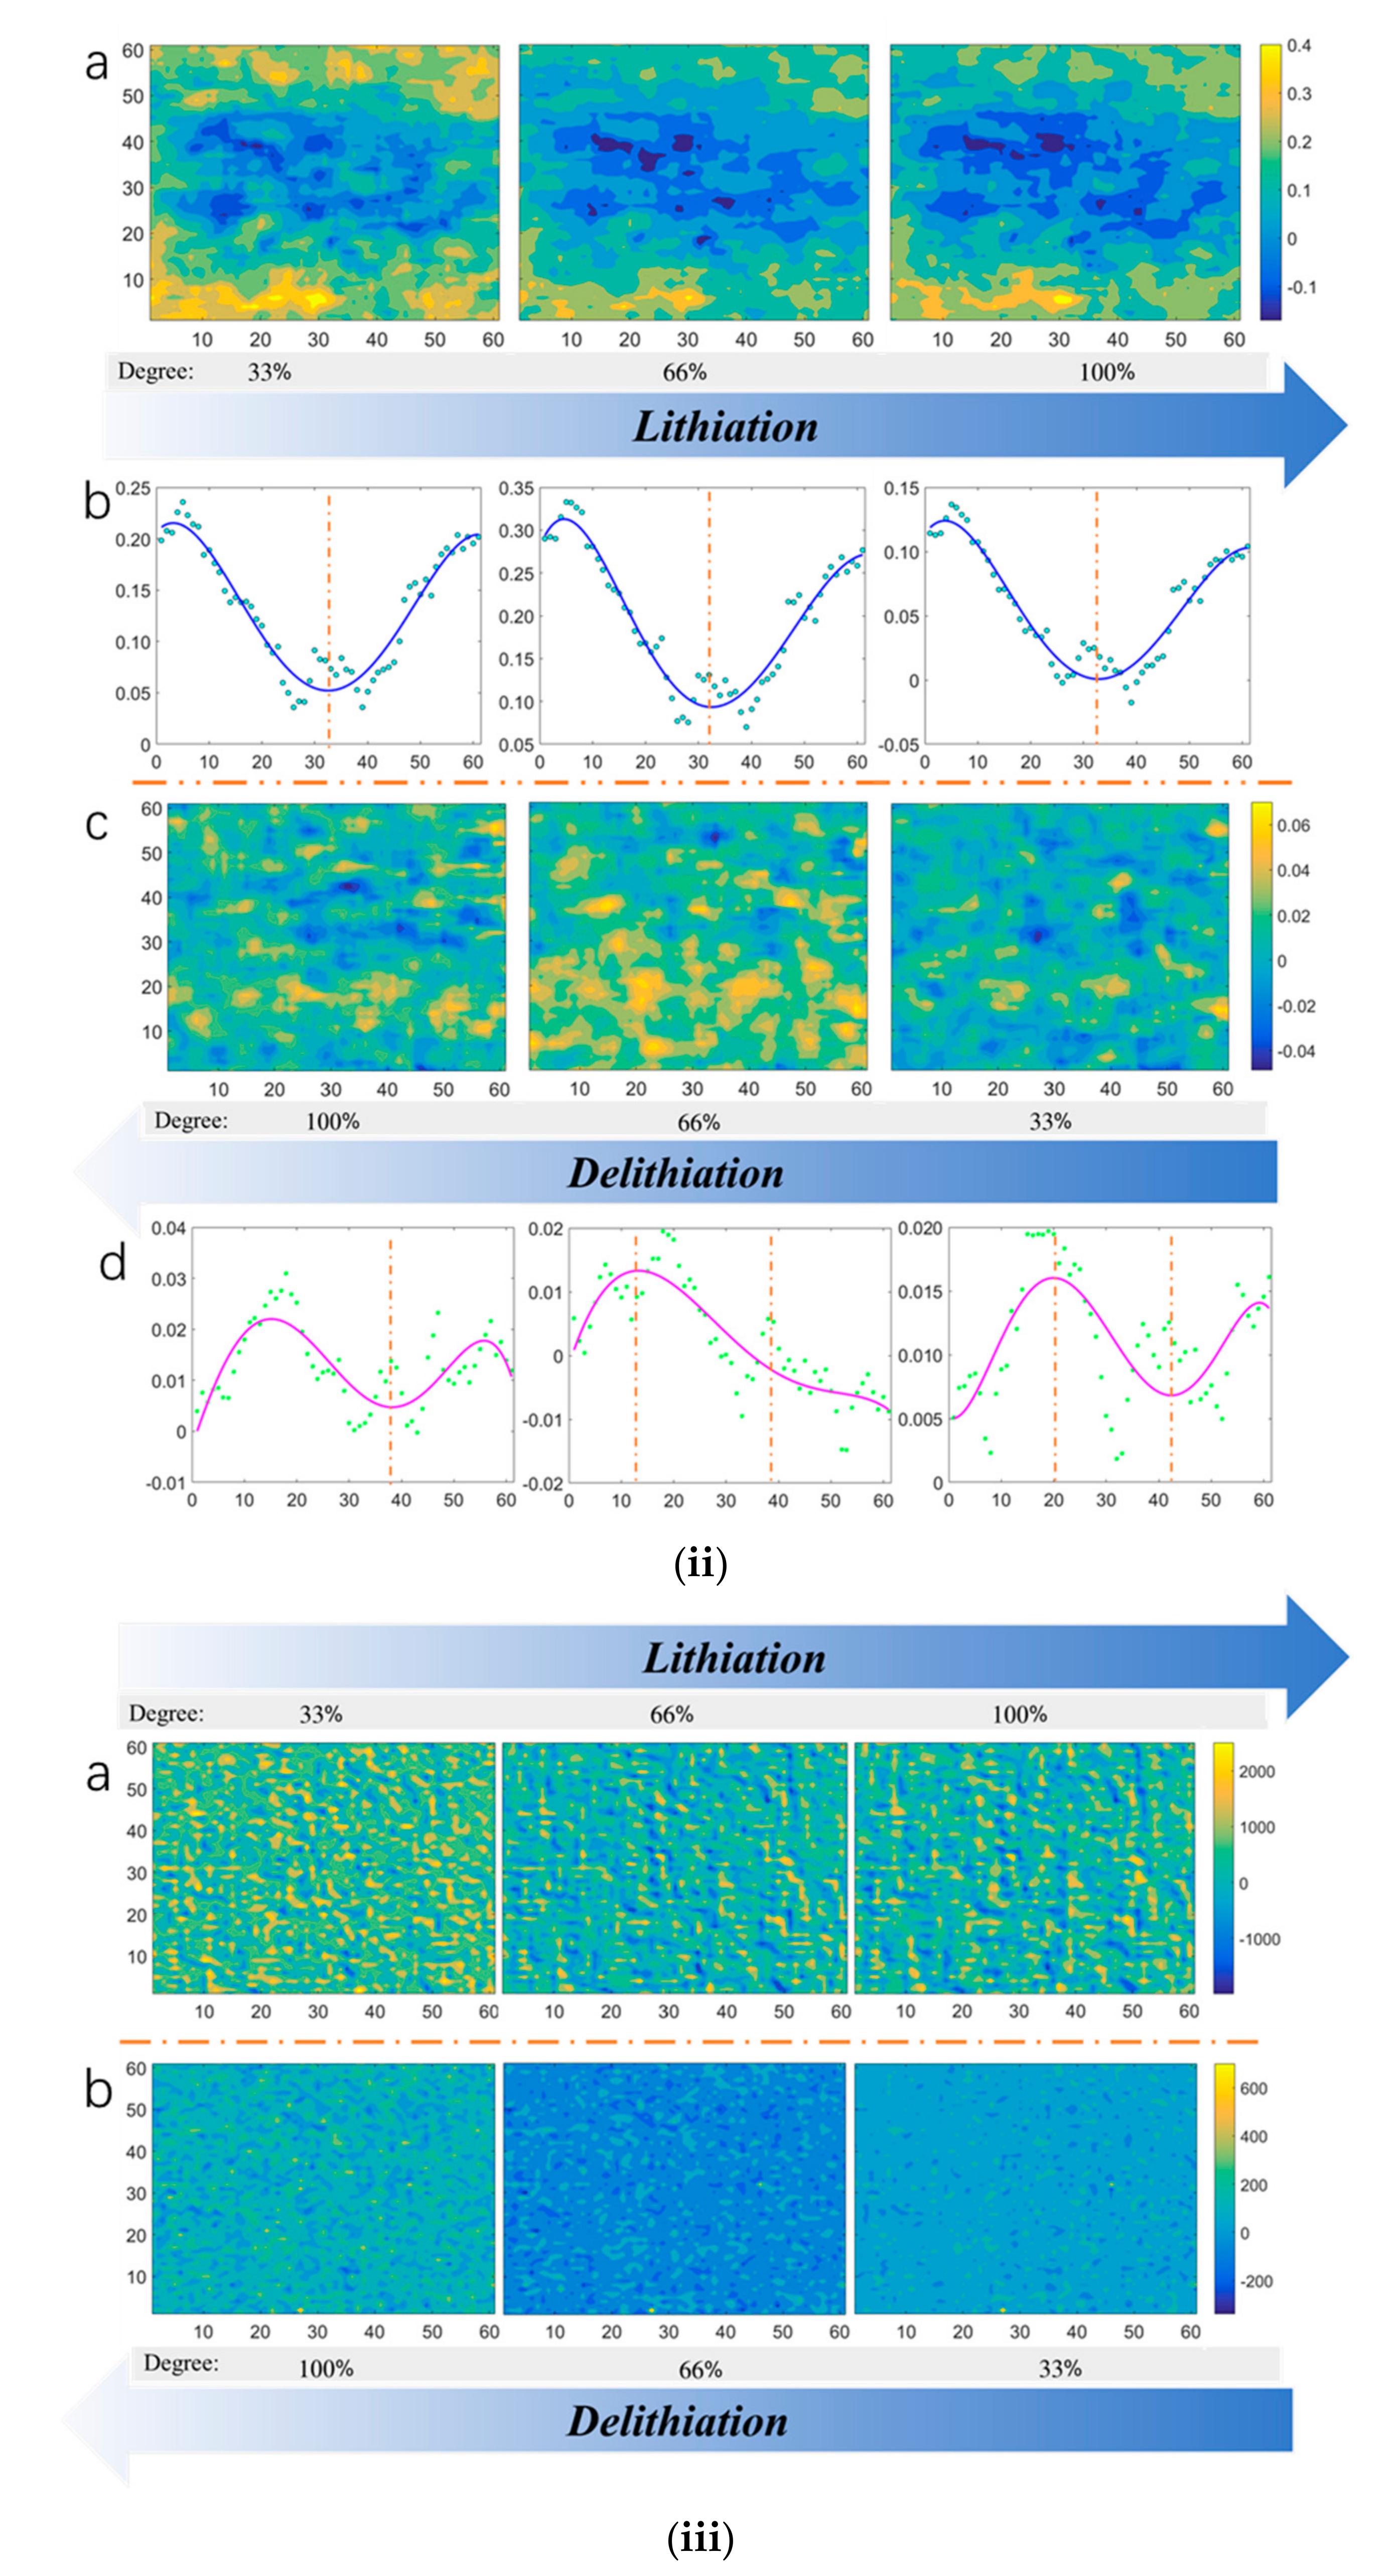
Compared to the thickness of Si film electrode, the copper foil substrate can be considered as a semi-infinite solid, a common model in solid mechanics. Based on the semi-infinite solid model, the deformation of the copper foil has not been taken into account in the current investigation. Through the lithiation and the delithiation process, the Si film electrode can freely expand and shrink except its bonding surface with the copper substrate. The surface deformation of the electrode during its lithiation/delithiation process is presented in Figure 4, including in-plane deformation distribution and out-of-plane displacement distribution. The strain distribution ε x x shows the radial strain distribution (see Figure 4i), and the strain distribution ε y y shows strain distribution of the tangential direction accordingly (see Figure 4ii). The out-of-plane displacement distribution is presented in Figure 4iii. Due to the radial motion of lithium ions along the silicon thin film electrode, the distribution of radial deformation of the electrode is different from that of circumferential deformation. In order to facilitate the analysis, we deal with the in-plane strain distribution: the strain ε x x is averaged in the y direction, and these averages are fitted, shown as Figure 4i b and d. What’s more, the trend of strain distribution is the opposite in the process of lithium insertion and delithiation: the strain distribution near the central area should be changed greatly in the process of lithium insertion, and the delithiation process is reversed, shown as Figure 4i. The strain ε y y is averaged in the x direction, and these averages are fitted, shown as Figure 4ii b and d. The strain distribution ε x x   exhibits gradient along x direction. The strain distribution ε y y exhibits symmetry in the y direction, and the strain distribution ε y y   exhibits gradient along y direction in every tiny subregion. At the initial stage of the lithiation processes, the tangential strain   ε y y was significantly smaller than the radial strain ε x x , shown as Figure 4i,ii. The out-of-plane displacement w of lithium removal is significantly smaller than the out-of-plane displacement w of lithium intercalation, shown as Figure 4iii). Besides, the out-of-plane displacement w also shows average at single time of the electrochemical reaction, while the strain distribution ε x x and ε y y tends to increase. This result is due to the transport path of lithium ions. The strain distributions indicate that an electrode in the form of a circular thin film deposited on a semi-infinite solid deforms in lithiation/delithiation processes similarly to a thermal expansion process.
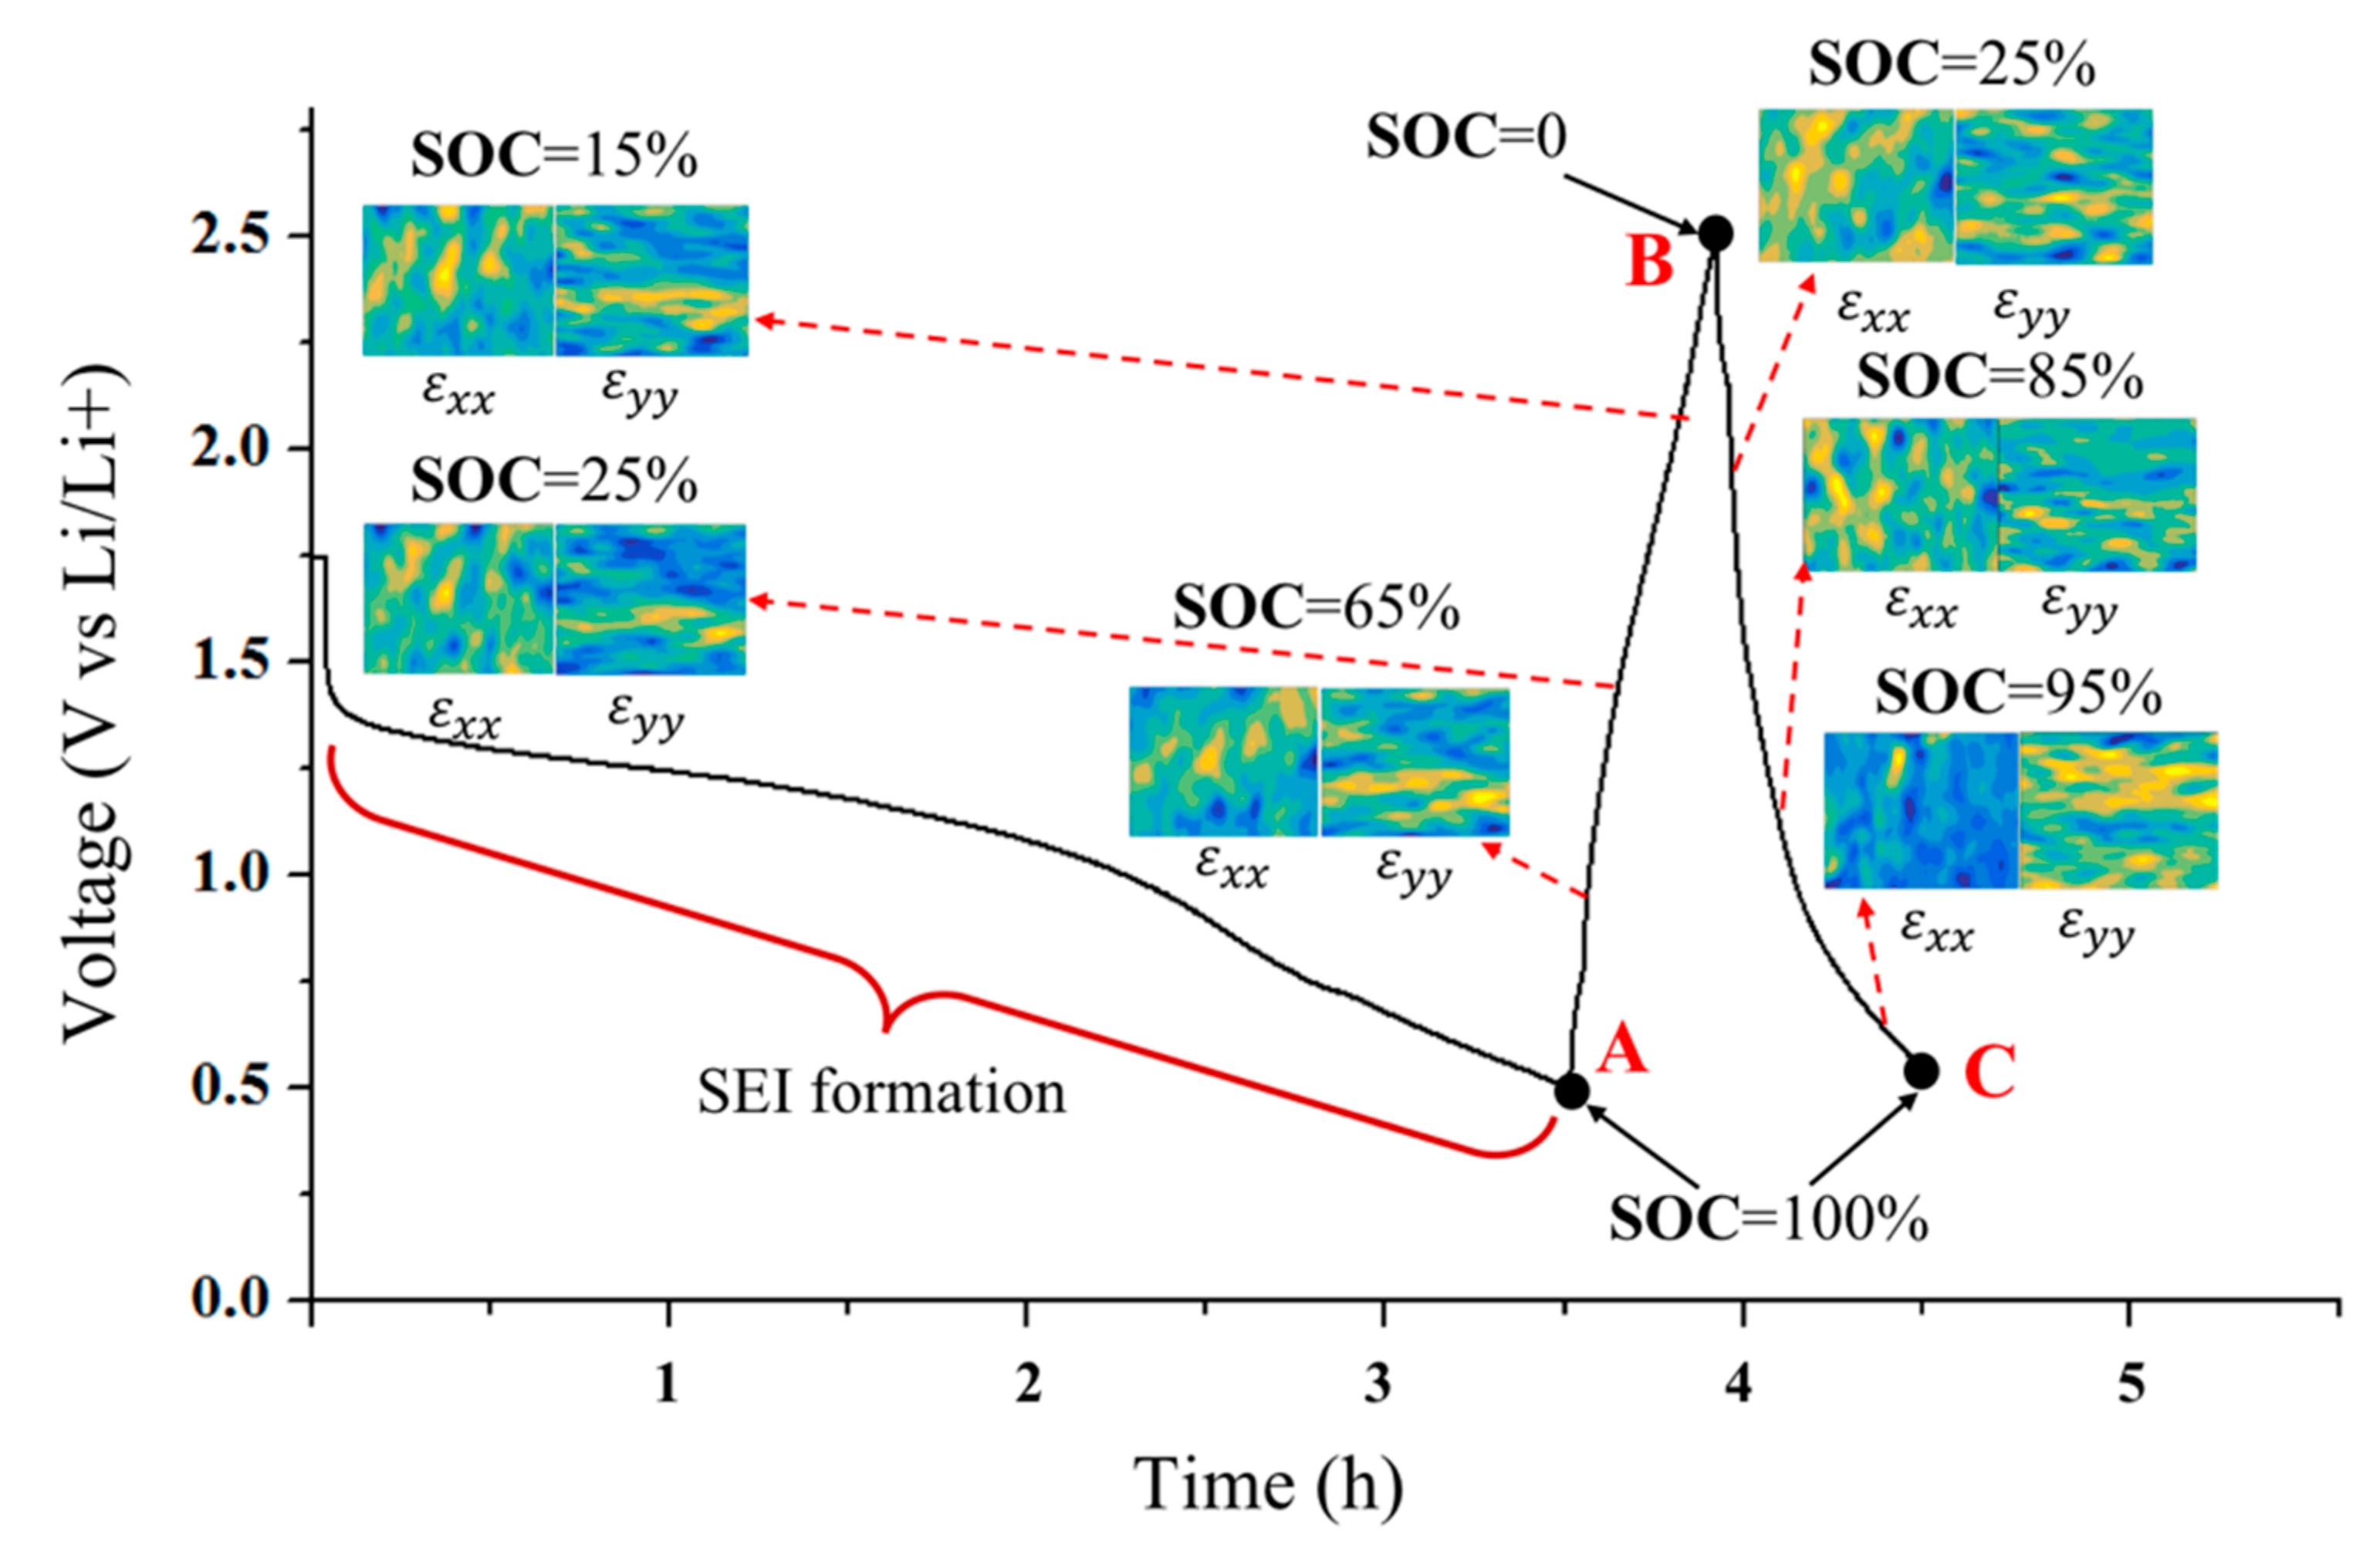
The overall evolutions of the surface strains of the electrode is illustrated in Figure 5. The state of charge (SOC) represents the ratio of remaining power to total capacity in the battery (0% = empty; 100% = full). From the figures (Figure 4 and Figure 5), it is shown that the strain increases when lithium ions are embedded in silicon electrode material during lithiation process, while strain decreases when lithium ions are removed from silicon electrode material during delithiation process.

4.2. Strain Criterion of Electrochemical/Mechanical Failures

The diffusion-induced stress in Si film electrodes relates to various factors such as the reaction path between the electrode and the electrolyte and the material in continuity of the Si electrode. Besides, the Young’s modulus of the Si electrode varies through the electrochemical process. Thus, it is hardly possible to experimentally determine the dynamic process of the inner stress distribution. However, material deformation, normally expressed with a concept of strain from a mechanical standpoint, exists objectively, which can be measured quantificationally. Since the strain is not uniform across the electrodes, how to evaluate the deformation and damage of electrode is a challenging problem. Based on the current experiments, the full field strains of the electrode in every phases of the electrochemical process are determined. To effectively describe the mechanical/electrochemical failure of the working electrode, the authors employed a parameter of MSG (mean strain gradient) that depicts the randomness and the discontinuity of the strain distribution. The mathematical description of MSG can be expressed as follows.
δ t o t a l = i = 1 a j = 1 b f x ε i j 2 + f y ε i j 2 / A × B
δ X = i = 1 a j = 1 b f x ε i j 2 / A
δ Y = i = 1 a j = 1 b f y ε i j 2 / B
where δ t o t a l denotes the MSG considering both x and y directions, while δ X and δ Y denote the MSG along x and y direction, respectively, A and B are the pixel dimensions of the ROI along x and y direction, respectively, a and b are the pixel dimensions of the subset along x and y direction, respectively. ε i j is the strain values at a certain point ( i , j ) in the pixel coordinate, defined with the following two equations.
ε i j = u i j + u i j x d x u i j d x = u i j x         a l o n g   x   d i r e c t i o n v i j + v i j y d y v i j d y = v i j y         a l o n g   y   d i r e c t i o n
where u i j   and v i j are the displacement value along x and y directions, respectively. f x ε i j and f y ε i j are the gradient values of the strain along x and y directions, respectively. The physical meaning of the strain gradient explains the strain fluctuations along a certain direction which results from the inhomogeneity of the electrochemical reactions. One big advantage to analyze the electrochemical performance of the electrode by the introduced MSG parameter is that, compared to other calculation-based stress analysis methods, the characteristics of genuine deformations over a large area on the electrode can be determined experimentally, describing the macroscopical electrochemical properties such as the reaction intensity. Indeed, results from the current experiments proved that the stress distribution expressed great inconformity. It is generally believed that tensile stress is commonly defined positive, while compressive stress negative in mechanics. The electrode is under compressive stress during lithium insertion, while the electrode is under tensile stress during lithium removal. However, genuine stresses are commonly opposite in sign at different electrode locations due to the material inhomogeneity based on the current experimental results. The development trend of the MSG along two orthogonal directions with the lithiation/delithiation procedures revolving is shown as Figure 6 and Figure 7.
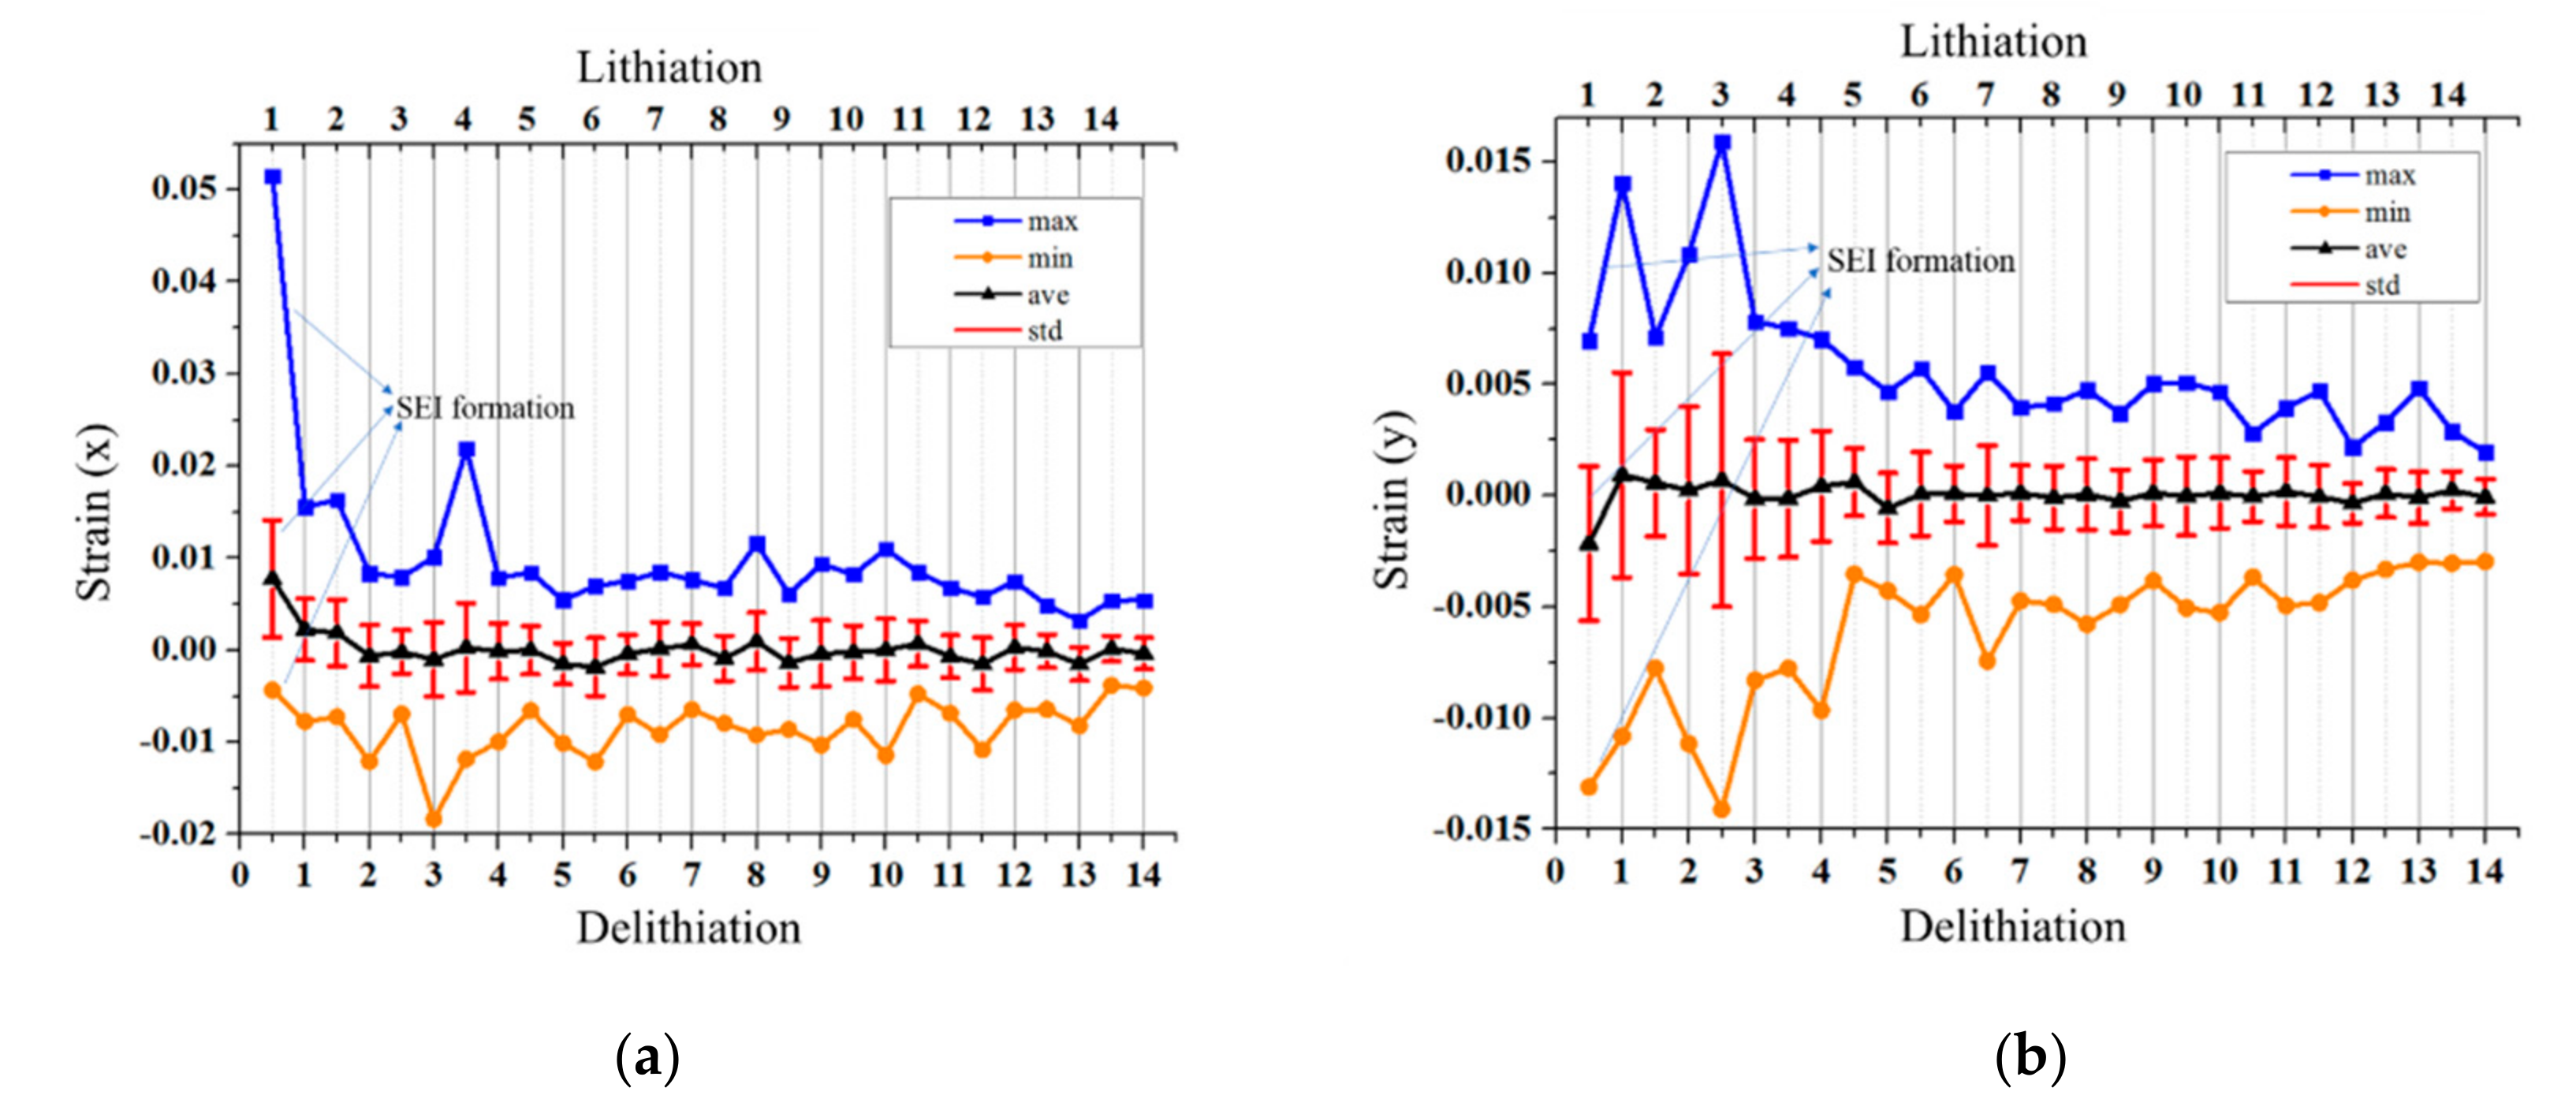
In Figure 6a,b, the evolution curves of strains in different directions have been presented, in which the abbreviations of max and min represent maximum and minimum values of the strains, respectively, while ave and std represent average values and standard deviations, respectively. The strains in lithiation process are obtained by differencing the locations of B state and C state (see Figure 5), while in delithiation process by differencing the locations of A state and B state. In Figure 7a,b, the evolution curves of MSGs in different directions have been presented.
From the results, it can be summarized as follows:
(i)
Both the out-of-plane displacement and the in-plane strain during the lithiation/delithiation process show great discreteness over a large surface area. Positive strains and negative strains exist simultaneously, which indicates that the stress distribution is inhomogeneous.
(ii)
Average strains slightly fluctuate with the cycles evolving, which indicates that electrochemical failures are not uncorrelated with average strains. In other words, single point analysis of strain/stress is not feasible in investigating electrochemical failures of electrode.
(iii)
MSG values mainly decreases with the cycle number increasing. The trend indicates that the strain distribution tends to be uniform with the electrochemical reaction of working electrode. Furthermore, the trend of MSGs are opposite in lithiation and delithiation processes, which demonstrates that MSG is sensible to the movement directions of Li-ions.

5. Conclusions

A developed DIC method combined with laser confocal profilometry has been presented to realize the in situ 3D measurement. The in-plane strain and the out-of-plane displacement distribution of the silicon film electrode have been experimentally determined simultaneously during the lithiation/delithiation processes. A semi-quantitative analysis method by introducing a parameter of MSG was proposed to describe the electrochemical/mechanical failures based on a strain criterion strategy. The results indicate that MSG is able to depict the electrode failures more comprehensively for the parameter employs full field deformation information.

Author Contributions

Conceptualization, Z.Q., Z.S. and C.L.; data curation, Z.Q.; investigation, Z.Q.; methodology, Z.Q. and Z.W.; project administration, W.M.; resources, L.L., S.W.; supervision, C.L. All authors have read and agreed to the published version of the manuscript.

Funding

The authors are grateful for the financial support from the National Natural Science Foundation of China (Grant Nos. 11602167, 11572218, 11572217, 11772222, 11472186), National Key Research and Development Program of China (2018YFB0703500, 2016YFB0100511).

Conflicts of Interest

The authors declare no conflicts of interest.

References

  1. Tarascon, J.M.; Armand, M. Issues and challenges facing rechargeable lithium batteries. Nature 2001, 414, 359–367. [Google Scholar] [CrossRef] [PubMed]
  2. Goodenough, J.B.; Park, K.S. The Li-Ion Rechargeable Battery: A Perspective. J. Am. Chem. Soc. 2013, 135, 1167–1176. [Google Scholar] [CrossRef]
  3. Li, J.; Daniel, C.; Wood, D. Materials Processing for Lithium-Ion Batteries. J. Power Sources 2011, 196, 2452–2460. [Google Scholar] [CrossRef]
  4. Lu, J.; Chen, Z.; Pan, F.; Cui, Y.; Amine, K. High-Performance Anode Materials for Rechargeable Lithium-Ion Batteries. Electrochem. Energy Rev. 2018, 1, 35–53. [Google Scholar] [CrossRef]
  5. Hsu, C.M.; Connor, S.T.; Tang, M.X.; Cui, Y. Wafer-scale silicon nanopillars and nanocones by Langmuir–Blodgett assembly and etching. Appl. Phys. Lett. 2008, 93, 85. [Google Scholar] [CrossRef]
  6. Chan, C.K.; Peng, H.; Liu, G.; McIlwrath, K.; Zhang, X.; Huggins, R.A.; CUI, Y. High-Performance Lithium Battery Anodes Using Silicon Nanowires. Nat. Nanotechnol. 2008, 3, 31–35. [Google Scholar] [CrossRef]
  7. Larcher, D.; Beattie, S.; Morcrette, M.; Edström, K.; Jumas, J.-C.; Tarascon, J.-M. Recent findings and prospects in the field of pure metals as negative electrodes for Li-ion batteries. J. Mater. Chem. 2007, 17, 3759. [Google Scholar] [CrossRef]
  8. Beaulieu, L.Y.; Eberman, K.W.; Turner, R.L.; Krause, L.J.; Dahn, J.R. Colossal Reversible Volume Changes in Lithium Alloys. Electrochem. Solid-State Lett. 2001, 4, A137. [Google Scholar] [CrossRef]
  9. Obrovac, M.N.; Krause, L.J. Reversible Cycling of Crystalline Silicon Powder. J. Electrochem. Soc. 2007, 154, A103. [Google Scholar] [CrossRef]
  10. Golmon, S.; Maute, K.; Lee, S.H.; Dunn, M.L. Stress generation in silicon particles during lithium insertion. Appl. Phys. Lett. 2010, 97, 033111. [Google Scholar] [CrossRef]
  11. Goodenough, J.B.; Kim, Y. Challenges for Rechargeable Li Batteries. Chem. Mater. 2010, 22, 587–603. [Google Scholar] [CrossRef]
  12. Abada, S.; Marlair, G.; Lecocq, A.; Marlair, G.; Lecocq, A.; Petit, M.; Sauvant-Moynot, V.; Huet, F. Safety focused modeling of lithium-ion batteries: A review. J. Power Sources 2016, 306, 178–192. [Google Scholar] [CrossRef]
  13. Kasavajjula, U.; Wang, C.; Appleby, A.J. Nano- and bulk-silicon-based insertion anodes for lithium-ion secondary cells. J. Power Sources 2007, 163, 1003–1039. [Google Scholar] [CrossRef]
  14. Chu, T.C.; Ranson, W.F.; Sutton, M.A. Applications of digital-image-correlation techniques to experimental mechanics. Exp. Mech. 1985, 25, 232–244. [Google Scholar] [CrossRef]
  15. Choi, Y.S.; Pharr, M.; Oh, K.H.; Vlassak, J.J. A simple technique for measuring the fracture energy of lithiated thin-film silicon electrodes at various lithium concentrations. J. Power Sources 2015, 294, 159–166. [Google Scholar] [CrossRef] [Green Version]
  16. Demirkan, M.T.; Trahey, L.; Karabacak, T. Low-density silicon thin films for lithium-ion battery anodes. Thin Solid Film. 2016, 600, 126–130. [Google Scholar] [CrossRef]
  17. Beattie, S.D.; Larcher, D.; Morcrette, M.; Simon, B.; Tarascon, J.-M. Si Electrodes for Li-Ion Batteries—A New Way to Look at an Old Problem. J. Electrochem. Soc. 2008, 2, A158–A163. [Google Scholar] [CrossRef]
  18. Deshpande, R.; Deshpande, R.; Verbrugge, M.; Cheng, Y.-T.; Wang, J.; Liu, P. Battery Cycle Life Prediction with Coupled Chemical Degradation and Fatigue Mechanics. J. Electrochem. Soc. 2012, 159, A1730–A1738. [Google Scholar] [CrossRef]
  19. Lu, B.; Song, Y.; Guo, Z.; Zhang, J. Modeling of progressive delamination in a thin film driven by diffusion-induced stresses. Int. J. Solids Struct. 2013, 50, 2495–2507. [Google Scholar] [CrossRef] [Green Version]
  20. Feng, H.; Daining, F. Diffusion-Induced Stresses of Spherical Core-Shell Electrodes. J. Electrochem. Soc. 2013, 4, A595–A600. [Google Scholar]
  21. Brassart, L.; Suo, Z. Reactive flow in solids. J. Mech. Phys. Solids 2013, 61, 61–77. [Google Scholar] [CrossRef]
  22. Cui, Z.; Gao, F.; Qu, J. A finite deformation stress-dependent chemical potential and its applications to lithium ion batteries. J. Mech. Phys. Solids 2012, 60, 1280–1295. [Google Scholar] [CrossRef]
  23. Brassart, L.; Suo, Z. Reactive flow in large-deformation electrodes of lithium-ion batteries. Int. J. Appl. Mech. 2012, 3, 1250023. [Google Scholar] [CrossRef] [Green Version]
  24. He, Y.-L.; Hu, H.J.; Song, Y.C.; Song, Y.-C.; Guo, Z.-S.; Liu, C.; Zhang, J.-Q. Effects of concentration-dependent elastic modulus on the diffusion of lithium ions and diffusion induced stress in layered battery electrodes. J. Power Sources 2014, 248, 517–523. [Google Scholar] [CrossRef]
  25. Xie, H.; Zhang, Q.; Song, H.; Shi, B.; Kang, Y. Modeling and in situ characterization of lithiation-induced stress in electrodes during the coupled mechano-electro-chemical process. J. Power Sources 2017, 342, 896–903. [Google Scholar] [CrossRef]
  26. Li, D.; Wang, Y.; Hu, J.; Lu, B.; Cheng, Y.; Zhang, J. In situ measurement of mechanical property and stress evolution in a composite silicon electrode. J. Power Sources 2017, 366, 80–85. [Google Scholar] [CrossRef]
  27. Liu, M. Finite element analysis of lithium insertion-induced expansion of a silicon thin film on a rigid substrate under potentiostatic operation. J. Power Sources 2015, 275, 760–768. [Google Scholar] [CrossRef]
  28. Yang, L.; Chen, H.; Jiang, H.; Wei, Y.-J.; Song, W.I.; Fang, D.-N. Failure mechanism of 2D silicon film anodes: In-situ observations and simulations on crack evolution. Chem. Commun. 2018, 10, 1039. [Google Scholar]
  29. Chen, J.; Thapa, A.K.; Berfield, T.A. In-situ characterization of strain in lithium battery working electrodes. J. Power Sources 2014, 271, 406–413. [Google Scholar] [CrossRef]
  30. Jones, E.M.C.; Silberstein, M.N.; White, S.R.; Sottos, N.R. In Situ Measurements of Strains in Composite Battery Electrodes during Electrochemical Cycling. Exp. Mech. 2014, 54, 971–985. [Google Scholar] [CrossRef]
  31. Haimei, X.; Haibin, S.; Yilan, K.; Jianshan, W. In Situ Experimental Measurement of the Mechanical Properties of Carbon-Based Electrodes during the Electrochemical Process. J. Electrochem. Soc. 2018, 165, A2069–A2074. [Google Scholar]
  32. Wang, Y.; Liu, Y.; Zheng, J.; Zheng, H.; Mei, Z.; Du, X.; Li, H. Electrochemical performances and volume variation of nano-textured silicon thin films as anodes for lithium-ion batteries. Nanotechnology 2013, 24, 424011. [Google Scholar] [CrossRef] [PubMed]
  33. Bing, P.; Huimin, X.; Bo-qin, X.; Fu-long, D. Performance of sub-pixel registration algorithms in digital image correlation. Meas. Sci. Technol. 2006, 17, 1615. [Google Scholar] [CrossRef]
  34. Pan, B.; Qian, K.; Xie, H.; Asundi, A. Two-dimensional digital image correlation for in-plane displacement and strain measurement: A review. Meas. Sci. Technol. 2009, 20, 62001. [Google Scholar] [CrossRef]
  35. Li, C.; Xie, H.; Liu, Z.; Liu, S. Microscopic 3D structural inversion technique for multilevel periodic structures with SEM moiré method. J. Opt. 2014, 16, 102001. [Google Scholar] [CrossRef]
  36. Li, C.; Liu, Z.; Xie, H. Novel scanning electron microscope bulge test technique integrated with loading function. Rev. Sci. Instrum. 2014, 85, 103709. [Google Scholar] [CrossRef] [PubMed]
  37. Li, C.; Liu, Z.; Xie, H.; Wu, D. Statistics-based electron Moiré technique: A novel method applied to the characterization of mesoporous structures. Nanoscale 2014, 6, 13409–13415. [Google Scholar] [CrossRef]
  38. Li, C.; Liu, Z.; Xie, H.; Wu, D. Novel 3D SEM Moire method for micro height measurement. Opt. Express 2013, 21, 15734–15746. [Google Scholar] [CrossRef]
  39. Li, C.; Liu, Z.; Xie, H. A measurement method for micro 3D shape based on grids-processing and stereovision technology. Meas. Sci. Technol. 2013, 24, 045401. [Google Scholar] [CrossRef]
  40. Wen, H.; Liu, Z.; Li, C.; He, X.; Rong, J.; Huang, X.; Xie, H. Centrosymmetric 3D Deformation Measurement using Grid Method with a Single-Camera. Exp. Mech. 2017, 57, 537–546. [Google Scholar] [CrossRef] [Green Version]
  41. Pan, B.; Lu, Z.; Xie, H. Mean intensity gradient: An effective global parameter for quality assessment of the speckle patterns used in digital image correlation. Opt. Lasers Eng. 2010, 48, 469–477. [Google Scholar] [CrossRef]
  42. Vogel, Y.B.; Zhang, J.; Nadim, D.; Ciampi, S. Switching of Current Rectification Ratios within a Single Nanocrystal by Facet-Resolved Electrical Wiring. ACS Nano 2018, 12, 8071–8080. [Google Scholar] [CrossRef] [PubMed]
Figure 1. Imaging principles of the LCSM for in-plane images and surface shape.
Applsci 10 00468 g001
Figure 2. The measurement principle of the three dimensional (3D) deformation measurement method.
Applsci 10 00468 g002
Figure 3. Structural schematics of the button cell in (a) common mode and (b) reverse mode: 1, copper foil; 2, working electrode (silicon electrode); 3, top cover; 4, separator; 5, counter electrode (lithium metal); 6, gasket; 7, steel jacket. The picture of a well assembled button cell is shown in (c) and a microscopic image of the Si electrode in (d), and the red box represents the region of interest in (d).
Applsci 10 00468 g003
Figure 4. Electrode deformation distributions of sample during the first electrochemical cycle. (i) The strain distribution ε x x shows the radial strain distribution. (ii) The strain distribution ε y y shows strain distribution of the tangential direction accordingly. (iii) The out-of-plane displacement distribution w is presented.
Applsci 10 00468 g004aApplsci 10 00468 g004b
Figure 5. Electrode deformation distributions of the electrode.
Applsci 10 00468 g005
Figure 6. (a) Evolution of strains along x direction in electrochemical cycles, and (b) evolution of strains along y direction in electrochemical cycles.
Applsci 10 00468 g006
Figure 7. (a) Evolution of mean strain gradient (MSG) along x direction in electrochemical cycles, and (b) evolution of MSG along y direction in electrochemical cycles.
Applsci 10 00468 g007
Table 1. Parameters of the cell materials.
Diameter
(Millimeter)
Thickness
(Micro)
Material/Ingredient
Working electrode80.8Silicon
Counter electrode15.6450Lithium metal
Observation window6200Quartz glass
Separator1928Microporous polypropylene film
Gasket15.6800Stainless steel
Top cover20 Stainless steel