Article

Environmental Impacts Associated to Different Stages Spanning from Harvesting to Industrialization of Pineapple through Life Cycle Assessment

by
Eduardo Castillo-González
1,*,
Mario Rafael Giraldi-Díaz
2,
Lorena De Medina-Salas
2 and
Raúl Velásquez-De la Cruz
2
1
Facultad de Ingeniería Civil, Universidad Veracruzana, Circuito Gonzalo Aguirre Beltrán, Zona Universitaria, Xalapa 91040, Veracruz, Mexico
2
Facultad de Ciencias Químicas, Universidad Veracruzana, Circuito Gonzalo Aguirre Beltrán, Zona Universitaria, Xalapa 91040, Veracruz, Mexico
*
Author to whom correspondence should be addressed.
Appl. Sci. 2020, 10(19), 7007; https://doi.org/10.3390/app10197007
Submission received: 8 August 2020 / Revised: 15 September 2020 / Accepted: 16 September 2020 / Published: 8 October 2020
(This article belongs to the Section Environmental Sciences)

Abstract

:
In this research, environmental impacts associated with the harvest and processing of pineapple (fresh-packed, in syrup, and dehydrated) were determined using the life cycle assessment (LCA) tool and specialized software SimaPro® (version 8.4), according to ISO14040:2006 and ISO14044:2006 standards. The information used to develop inventory included field interviews and industrial visits within the study area. The functional unit was defined as one kilogram of fruit. The selected impact categories were carbon footprint, water footprint, and energy footprint; the results obtained for the agronomic stage were 0.47 kg CO2 eq (equivalent), 78 L of water, and 9.09 MJ, respectively. The growth stage of the pineapple plant was found to be the one that generates greatest environmental impacts for all three categories. For packaged fruit, 0.58 kg CO2 eq, 82 L of water, and 11.03 MJ were quantified; for pineapples in syrup it was 1.12 kg CO2 eq, 103 L of water, and 19.28 MJ; and for dehydrated fruit, it was 5.12 kg CO2 eq, 782 L of water and 97.04 MJ. This concludes that the most significant environmental impact occurred in all cases during the pineapple cultivation stage.

1. Introduction

The constant increase of populations with higher incomes leads to a demand for more food. As such, in the last 30 years, food production has increased by more than 100% [1]. This has had repercussions on intensive production crops leading to the consumption of fertilizers, machinery, and supplies, as well as transportation for their distribution to large urban centers. All of these agricultural supply chains require considerable amounts of energy, mainly fossil fuels. Both consumption indicators are direct vectors for the generation of environmental impacts. Nowadays, there is a growing concern about climate change due to the increase in greenhouse gas (GHG) emissions. The agricultural sector contributes approximately 13% of worldwide GHG emissions [2]. In addition, intensive agriculture increases consumption of irrigation water for continuous food production, which causes water stress, especially in areas with less rainfall [3,4]. The use of water grew at almost twice the rate of population increase in the last century and 70% of the total water consumed worldwide is used by agriculture [5].
The parametric indicators of carbon, energy, and water footprint are important quantities to verify the potential direct and indirect environmental effects of agricultural products [6,7,8,9,10,11]. Among the different existing methodologies to carry out the aforementioned, LCA stands out, given that it allows detailed tracking of process flows throughout the production and supply chain, as well as evaluation of inputs and outputs of the system, including its final disposal as waste [12].
Pineapple is a tropical fruit with many health benefits due to its anti-inflammatory and digestive potential, antioxidant content and immune support, and more [13]. Internationally, it is a fruit of high economic value, with a world production of 29,929,843 tons in 2018 [14]. Currently, pineapple demand has increased in 16 countries, including China and Europe [15]. However, as a result of harvesting pineapple, adverse environmental impacts are generated during the different stages spanning from harvest to industrialization. It is necessary to identify and quantify these impacts to detect areas of opportunity that allow their minimization and achieve sustainable production.
In the literature consulted, there are various studies on the LCA of pineapple with different valorization methods; their main impact categories are GHG emissions, water, and energy consumption [16,17]. Besides including the production impact categories, Usubharatana and Phungrassami [18], and Frankowska, Jeswani, and Azapagic [19], include pineapple (Cayena Lisa) packed in syrup, accounting for the use of organic and synthetic fertilizers, herbicides, and fossil fuels. It was found that fertilization contributes up to 79% of the carbon footprint from the agricultural stage, while fuel, chemical products, and packaging for the industrial phase contribute 42% of CO2 eq.
Other research consulted assessed the environmental impacts generated by production and fresh packing of pineapple for the carbon footprint and water categories. Carbon footprint was 32% for the agricultural stage and 68% for the industrial one [20]. An additional study accounted for the effects caused by the production and packaging of pineapple through carbon footprint, water footprint, and energy footprint. The agricultural stage was found to be the main source of carbon footprint impacts (60%); of these, 40% were caused by the use of fertilizers, 18% were originated by fuel consumption, and the rest were caused by other activities. As for the packaging for the fresh fruit, box production generated a 24% contribution of CO2 eq emissions and refrigeration during the distribution led to 15% [21].
As shown, although there is published information regarding the pineapple production process, this does not fully comprise the agricultural stage and some of the main pineapple processing scenarios. Thus, this article aimed to determine the environmental impacts associated, quantified through carbon, water, and energy footprints, from the supply chain and the operations involved in the cultivation of pineapple. Three case studies of its industrialization were analyzed. For this purpose, the information here presented was collected through fieldwork: (i) packed as fresh fruit, (ii) dehydrated pulp, and (iii) pineapples in syrup, through the life cycle assessment.

2. Materials and Methods

The methodology used for this work was based on ISO14040:2006 and ISO14044:2006 [12,22], which includes the phases shown in Figure 1: definition of objectives and scope (I), Life Cycle Inventory (LCI) (II), Life Cycle Impact Assessment (LCIA) (III), and life cycle interpretation (IV).

2.1. Definition of Objectives and Scope

This phase includes the initial studies to know the product and everything related to its processing to develop the other three phases of the LCA accurately, as well as the intended use of the results. The geographic scope, delimitation in study time, and quality level required for the data were defined [23,24]. For this reason, the functional unit and the system boundary were described. The functional unit was taken as a way to quantify the flows of matter and energy. The main aim was to provide a reference for comparison between the flows involved in the entire process, so that the environmental impacts of the products were reported according to the functionality of the product, and to compare the products from the same category amongst themselves [25,26]. The system boundary was established to consider the components or processes that constitute the product system. Likewise, the inputs and outputs to be considered were identified. For example, the manufacture of inputs; the transformation processes to make the final product; energy supply; identification of coproducts, effluents, emissions, and generated waste, among others [27].

2.2. Life Cycle Inventory

Data collection and calculation procedures that identify the inputs and outputs of the system were performed during this phase, taking into account the flows released into the environment. It was essential to have detailed information on each stage of the production process since both the material and energy flows were quantified and the outflows to the environment are associated with each of the processes involved. All of this was incorporated into the LCI database.

2.3. Life Cycle Impact Assessment

In the LCIA, the environmental impacts associated with the product system were quantified. Science-based methods through impact categories were used to assess the environmental component of a sustainable product. Table 1 shows a description of the impact categories that were used in this study: carbon footprint, water footprint, and energy footprint. To determine the environmental impacts of greenhouse gas emissions, the ReCiPe methodology was chosen (v. 1.01) [28], based on the ISO14067:2018 standard [29]. While the water accounting and vulnerability evaluation (WAVE) [30] method was used to determine water footprint throughout the production and supply chain, according to the provisions of the ISO14046:2014 standard [31].
The cumulative energy demand (CED) methodology was used to calculate the energy footprint, which allowed us to know the different types of renewable and non-renewable energy sources used in the product system [38]. For the quantification of energy flows, energy conversion, efficiency, and plant factors were used due to energy losses from production to final energy consumption, mainly concerning the generation of electrical power. The data were collected from local and international references [39,40,41,42], as explained and shown below in Table 2. The energy footprint is not a proper category of environmental impact. However, it is a consistent approach indicator for the environmental performance of products and processes, which quantifies the energy content of all different (renewable and non-renewable) energy resources from a product system and an important driver of several environmental impacts as global warming or fossil fuel depletion [8,9,43,44,45].

2.4. Interpretation of Life Cycle

LCA interpretation was aimed at analyzing results and their relation to the goal and scope definition. According to ISO14040:2006 and ISO14044:2006, conclusions were reached, the limitations of the results were presented, and recommendations were provided based on the findings during the preceding phases of the LCI and LCIA. Moreover, a sensitivity analysis was performed to complete the interpretation of the life cycle. Finally, the environmental impacts of the processes were compared individually or globally with other LCA researches.

3. LCA of Pineapple Cultivation and Processing

3.1. Objectives and Scope

As mentioned above, the objective of the current LCA was to quantify carbon, water, and energy footprints from the supply chain, and the operations involved in the cultivation of pineapple and its industrialization, such as (i) packed as fresh fruit, (ii) dehydrated pulp, and (iii) pineapples in syrup. The functional unit was defined under the following situations: (i) in the agricultural stage, 1 kg of harvested pineapple; (ii) in the three industrialization scenarios, 1 kg of packed pineapple/dehydrated pineapple/pineapples in syrup. This study was carried out from “the cradle to the gate” since it considered the production (agricultural stage) and fruit processing (industrial stage), which included the extraction, transformation, use, and consumption of raw materials during the supply chain up to obtaining the final products.
For the achievement of this LCA, the material and energy flows were tracked and analyzed, which included intermediate flows, outflows as products, co-products, residual flows to treatment, and flows released to the environment such as gas emissions and liquid or solid effluents. Capital goods were considered, such as the use of machinery for the land preparing and the transportation of supplies [49], while others were excluded, such as the construction of facilities, since their contribution was not very significant in the LCA result [50,51]. The following procedure was used in the quantification of the inventory of capital goods: (i) the main materials that make up the capital good were identified, as well as their quantity; some examples include steel, plastic, non-ferrous metals, among others; (ii) the useful life of the product was established, generally 20 years; (iii) the functional unit was quantified from the amount of product produced, for example packaged pineapple during the product’s useful life; and (iv) the amount of material calculated (i) was divided by the functional unit quantified in (iii). Therefore, each material amount from the capital good was quantified per kg of packed fruit. This data was compiled and included in LCI using this procedure.

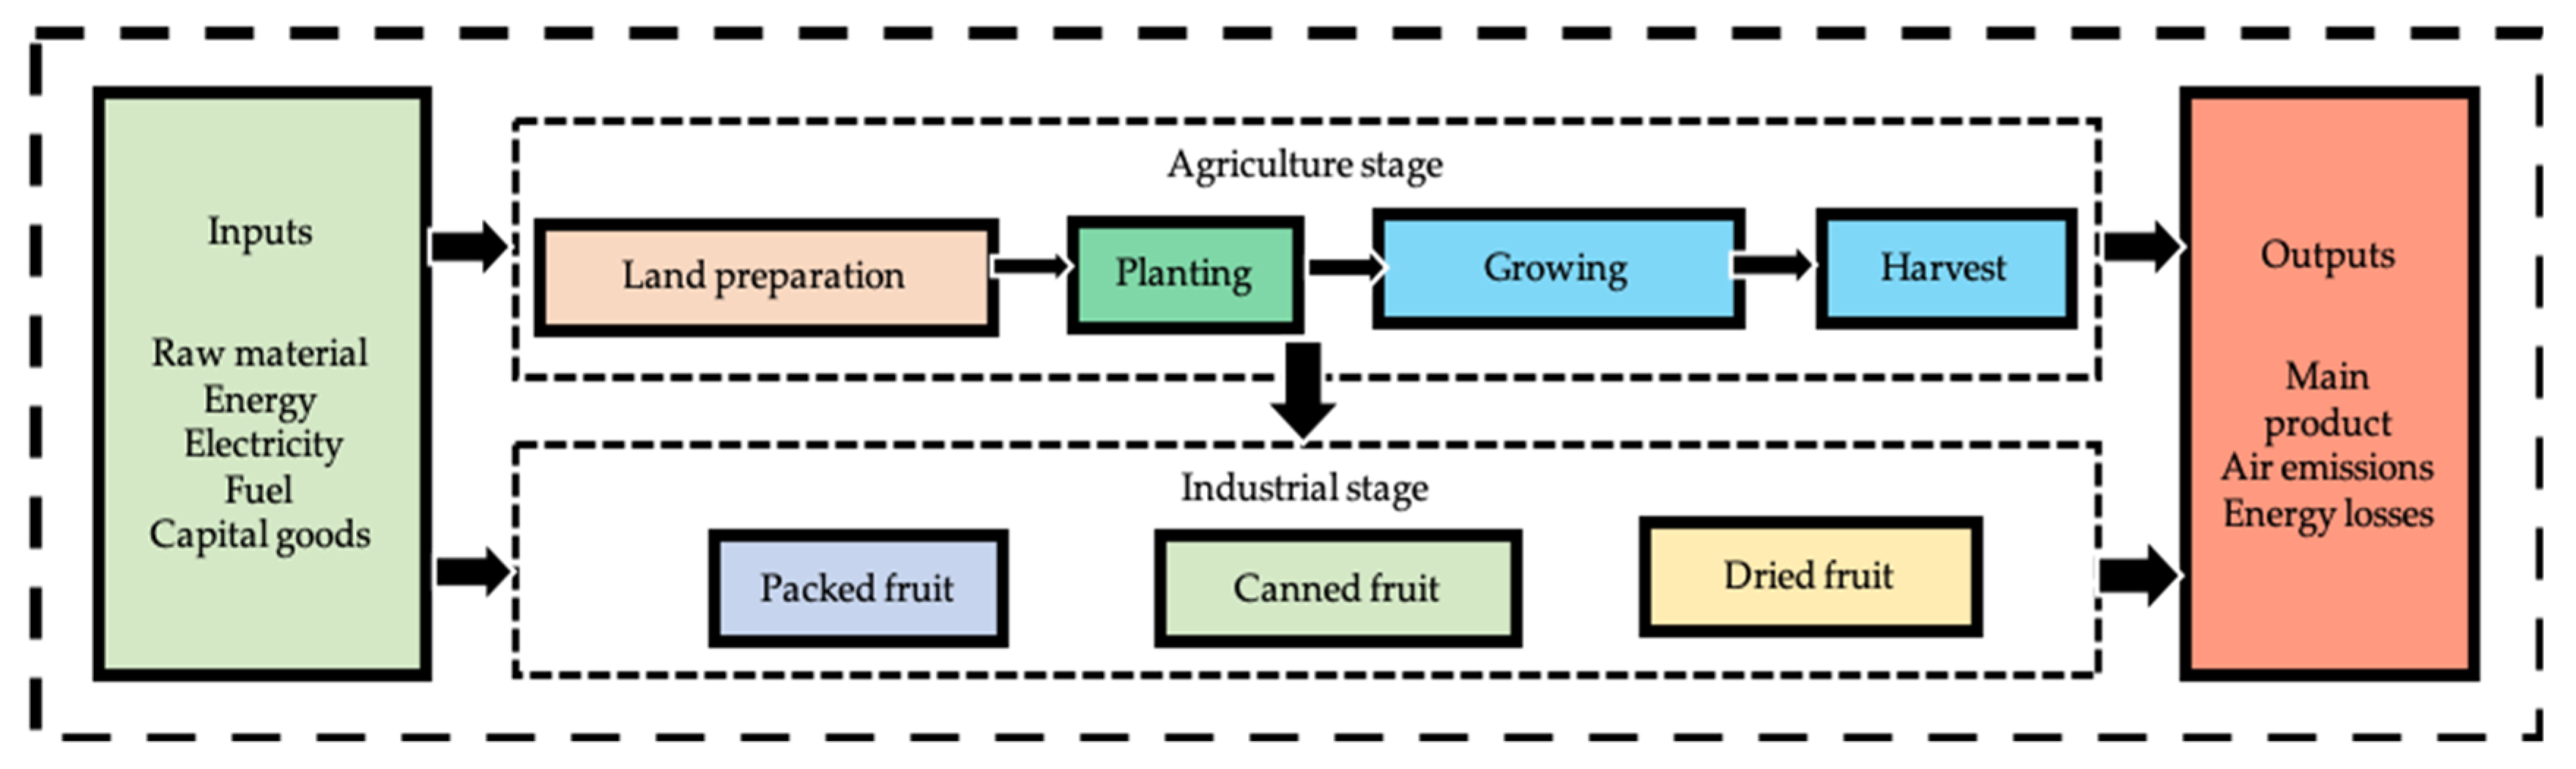
3.2. System Boundary Description

The study area was located in southeastern Mexico, at 18°00′ north latitude and 95°24′ west longitude, with an average altitude of 95 m above sea level. The climate is warm-humid with rains in summer and a mean temperature of 25 °C; annual rainfall is in the range of 1100 to 1600 mm [52]. This information was relevant for the water balances. Figure 2 shows the diagram of the agricultural and industrial production processes considered for this study. The agricultural stage was divided into four sub-stages: (i) land preparation, (ii) planting, (iii) development of the pineapple plant, and (iv) harvest. The industrial stage was made up of three different processing routes: (v) packing, (vi) fruit in syrup, and (vii) dehydrator.

3.2.1. Agricultural Stage

For land preparation, the use of two tractors—80 horsepower (HP) and 120 HP—and necessary implements for each specific task were considered, including rotary mowers, harrows, rounders, plows, and a bed ridger machine. Diesel consumption was accounted for during the eight stages of site preparation. Each task was performed once per harvest cycle. During the irrigation, the underground water extracted from 100 m below the surface was quantified, accounted for the use of a 150 hp pump to a water supply to 166 ha for 10 months of scheduled irrigation, with four days of irrigation weekly. The use of various agrochemicals was considered for plant growth. Such agrochemicals are formulas of nitrogen, phosphorus, and potassium (NPK), Bromacil, Ametrex, Fosetil-Al, and glyphosate. The quantity of packaging bags and plastic bottles during each activity were considered according to the supplies used. When the harvest was made, pineapple was the main product, but the seed was also obtained for the next growing cycle. Figure 3 shows the processes of the agricultural stage that were quantified for the current LCA.

3.2.2. Industrial Stage

After the fruit was harvested, it was sent for processing, according to the three pineapple industrialization processes considered for this LCA, which were commercially located in the study area. Fruit that did not meet quality standards was marketed locally without receiving any processing. Figure 4 shows all sub-stages that included fresh packaging, fruit in syrup, and dehydrated fruit. Each of them is described below.
Packed fruit. The distance considered from the cultivation area to the packing plant was 2 km; transportation took place through trucks with a 15 t capacity. The fruit was received and quality was verified for export. Pineapples that did not meet the standard were returned to the producer. Next, the fruit was immediately washed in tanks with chlorinated water; then, the pineapples were lifted by a metallic conveyor belt, where the fruits were arranged by operators while the washing water was drained. Each pineapple received a wax bath and was air-dried at normal temperature. Meanwhile, cardboard boxes were assembled where the fruits were packed. The individual boxes with fruit were arranged on pallets that were sent to refrigeration for later transportation and delivery to the customer-distributor. Throughout the process, the electrical energy consumed by the different electrical devices, liters of wax consumed, kilograms of cardboard boxes, and supplies needed to assemble the pallets—i.e., a portable platform on which pineapples can be moved, stacked, and stored—were accounted for.
Fruit in syrup. For this process, the fruit was transported by trucks with a capacity of 15 t and the same 2 km distance. The fruit was received and immediately the crowns were removed during the selection of those that met quality specifications. Subsequently, the fruit was washed, peeled, cored, and cut. Then, tin cans were filled and the sterilization and labeling process continued. The energy supplied for the pre-sterilization, sterilization, and syrup production processes through fuel oil were quantified; energy losses were also considered. The manufacture and transportation of tin cans were also included.
Dehydrated fruit. In this stage, the fruit was transported in trucks with a capacity of 3 t from the production area. Once the pineapple was unloaded at the processing site, the crown was removed and the fruit was washed, peeled, cored, and cut into circular slices. Afterward, it was transferred to dehydration chambers for a 14 h process. Immediately after, selection and packaging processes were carried out. The consumption of electrical power were conducted mainly by conveyor belt motors, a turbine used to drive hot air to the dehydration chamber to reach the final humidity conditions of the dehydrated fruit, and other consumptions from the factory facilities were counted. Likewise, the fuel used during supplies transportation was considered.

3.3. Life Cycle Inventory

The information was collected through field interviews with farmers, merchants, entrepreneurs, and specialists in the cultivation and processing of pineapples [46,47]. This field work was carried out in two stages: (i) the first was a recognition of the place of pineapple production, the geographical distribution of the agricultural areas, and the processing places; (ii) in a second stage, questionnaires were prepared that were applied to farmers, operational managers of industrial processes, and the main controllers in the supply chain. The data collected was regarding the time of use for machinery, diesel consumed, type and quantity of agrochemicals, power used by electrical equipment, and water flow for irrigation. Subsequently, the mass and energy balances were carried out, where inputs, intermediate process flows, coproducts, and outputs of the system were quantified, such as air emissions, effluents of residual water, and solid waste The secondary process data was complemented with information from the literature [39,40,41,42,48]. Secondary data were mainly the transport of supplies, some inputs such as plastic or waxes, and electrical power from a specific assembly for national standards; all of them were included in the Ecoinvent 3.5 database [53]. Some of these assemblies were adapted and updated according to local information collected. For example, regarding the secondary data of main inputs consumed in the product system, local information was used, mainly in relation to energy consumption for its manufacturing, as shown in Table 2.
In the case of the electrical grid supply, Ecoinvent 3.5 provided an assembly for the case of local generation of electrical power. The foreground data of primary energy were updated and the energy efficiencies and losses of the distribution network according to information compiled from national technical reports are shown in Table 3. For non-renewable fuels, Equation (1) was used; the primary fuel supplied was taken as input. For renewable energy, Equation (2) was applied; the input was the primary energy reported from the balance sheets of the national energy sector.
EPG = ( PFS ) ( NCV ) ( η ) ( FC )
EPG = ( PES ) ( TPE ) ( η ) ( FC )
where:
  • EPG: electric power generation, GWh.
  • PFS: primary fuel supplied, kg, L or m3.
  • NCV: Net calorific value conversion factor, units according to the fuel supplied.
  • η: net thermal efficiency from the overall cycle of electric power generation, fraction.
  • PES: primary energy share, fraction.
  • TPE: total primary energy for electric power generation (in the national grid), MJ
  • FC: conversion factor, 1 GWh/3.6E+06MJ.
On the other hand, residual energy flows from equipment such as the boiler, drying chamber, and syrup preparation process were quantified, as shown in Figure 4. These energy flows were considered as lost energy to the surroundings of the system from the devices with heat transfer and were considered as waste energy emitted to the environment.
Economic allocation was applied, according to products and co-products generated from the product system. In the pineapple production system, outlets of co-products were identified. For example, fruit were rejected in the quality controls during industrialization. These fruits, although of lower quality, were marketed at a lower price, and economic allocations were applied. For this to happen, data on prices and quantities of rejected fruits were collected from the producers to quantify economic allocation of the outflow of the co-product. The allocation procedure and its result are shown in Table 4. The quantity column shows the amount of fresh fruit required to produce one kg of processed fruit, while the prices column represents the sales prices locally in 2019.
Table 5 shows foreground data collection from the product system. All the quantities that are shown were referenced to the functional unit of 1 kg of processed fruit and classified by sub-stages of the product system. Nursery maintenance is shown first, with water, diesel, transportation, and agrochemicals being the most important supplied resources. During the land preparation labor, the main inputs were accounted for the use of heavy machinery, as a result, fuels were consumed and plastic was used for mulching. On the other hand, water, pesticides, and transportation were needed as basic inputs for planting. However, for the development and growth of the pineapple plant, the use of specific machinery, water, agrochemicals products, and plastic, as well as their transportation from production sites, were quantified. For the packaging of fresh fruit, the number of cardboard boxes required and the water and electrical energy consumed were considered important. For the fruit in syrup, can containers, fuel oil, electricity, and water were quantified. In the case of the dehydration process, the amount of liquefied petroleum gas (LPG) was required and the packaging material for the final product were considered.

3.4. Life Cycle Impact Assessment

Table 6 shows the environmental impacts associated with the agricultural process of the pineapple fruit, as well as three different processes of the harvested pineapple per impact category.

4. Results and Discussion

As shown in Table 6, the additional processing to the harvested pineapple fruit goes through increased magnitudes of associated environmental impacts in the three categories analyzed. The lowest rise was in the packing process, where fruit handling did not demand extensive processing. In the case of pineapples in syrup, there was growth in the values of carbon and energy footprints. This is a consequence of the energy supply necessary for greater processing operations. However, the greatest impacts were generated in the industrial dehydration stage. The most relevant reasons were, first of all, the energy supplied for the drying of the fruit, and, secondly, the quantity of fresh fruit that was consumed to produce 1 kg dehydrated pineapple, which required 9.94 kg of fresh pineapple. On the other hand, in the stages of packing fresh fruit and for fruit in syrup, 1.05 kg and 1.29 kg of fresh pineapple were supplied, respectively. The specific results of the different processing stages studied are discussed below.

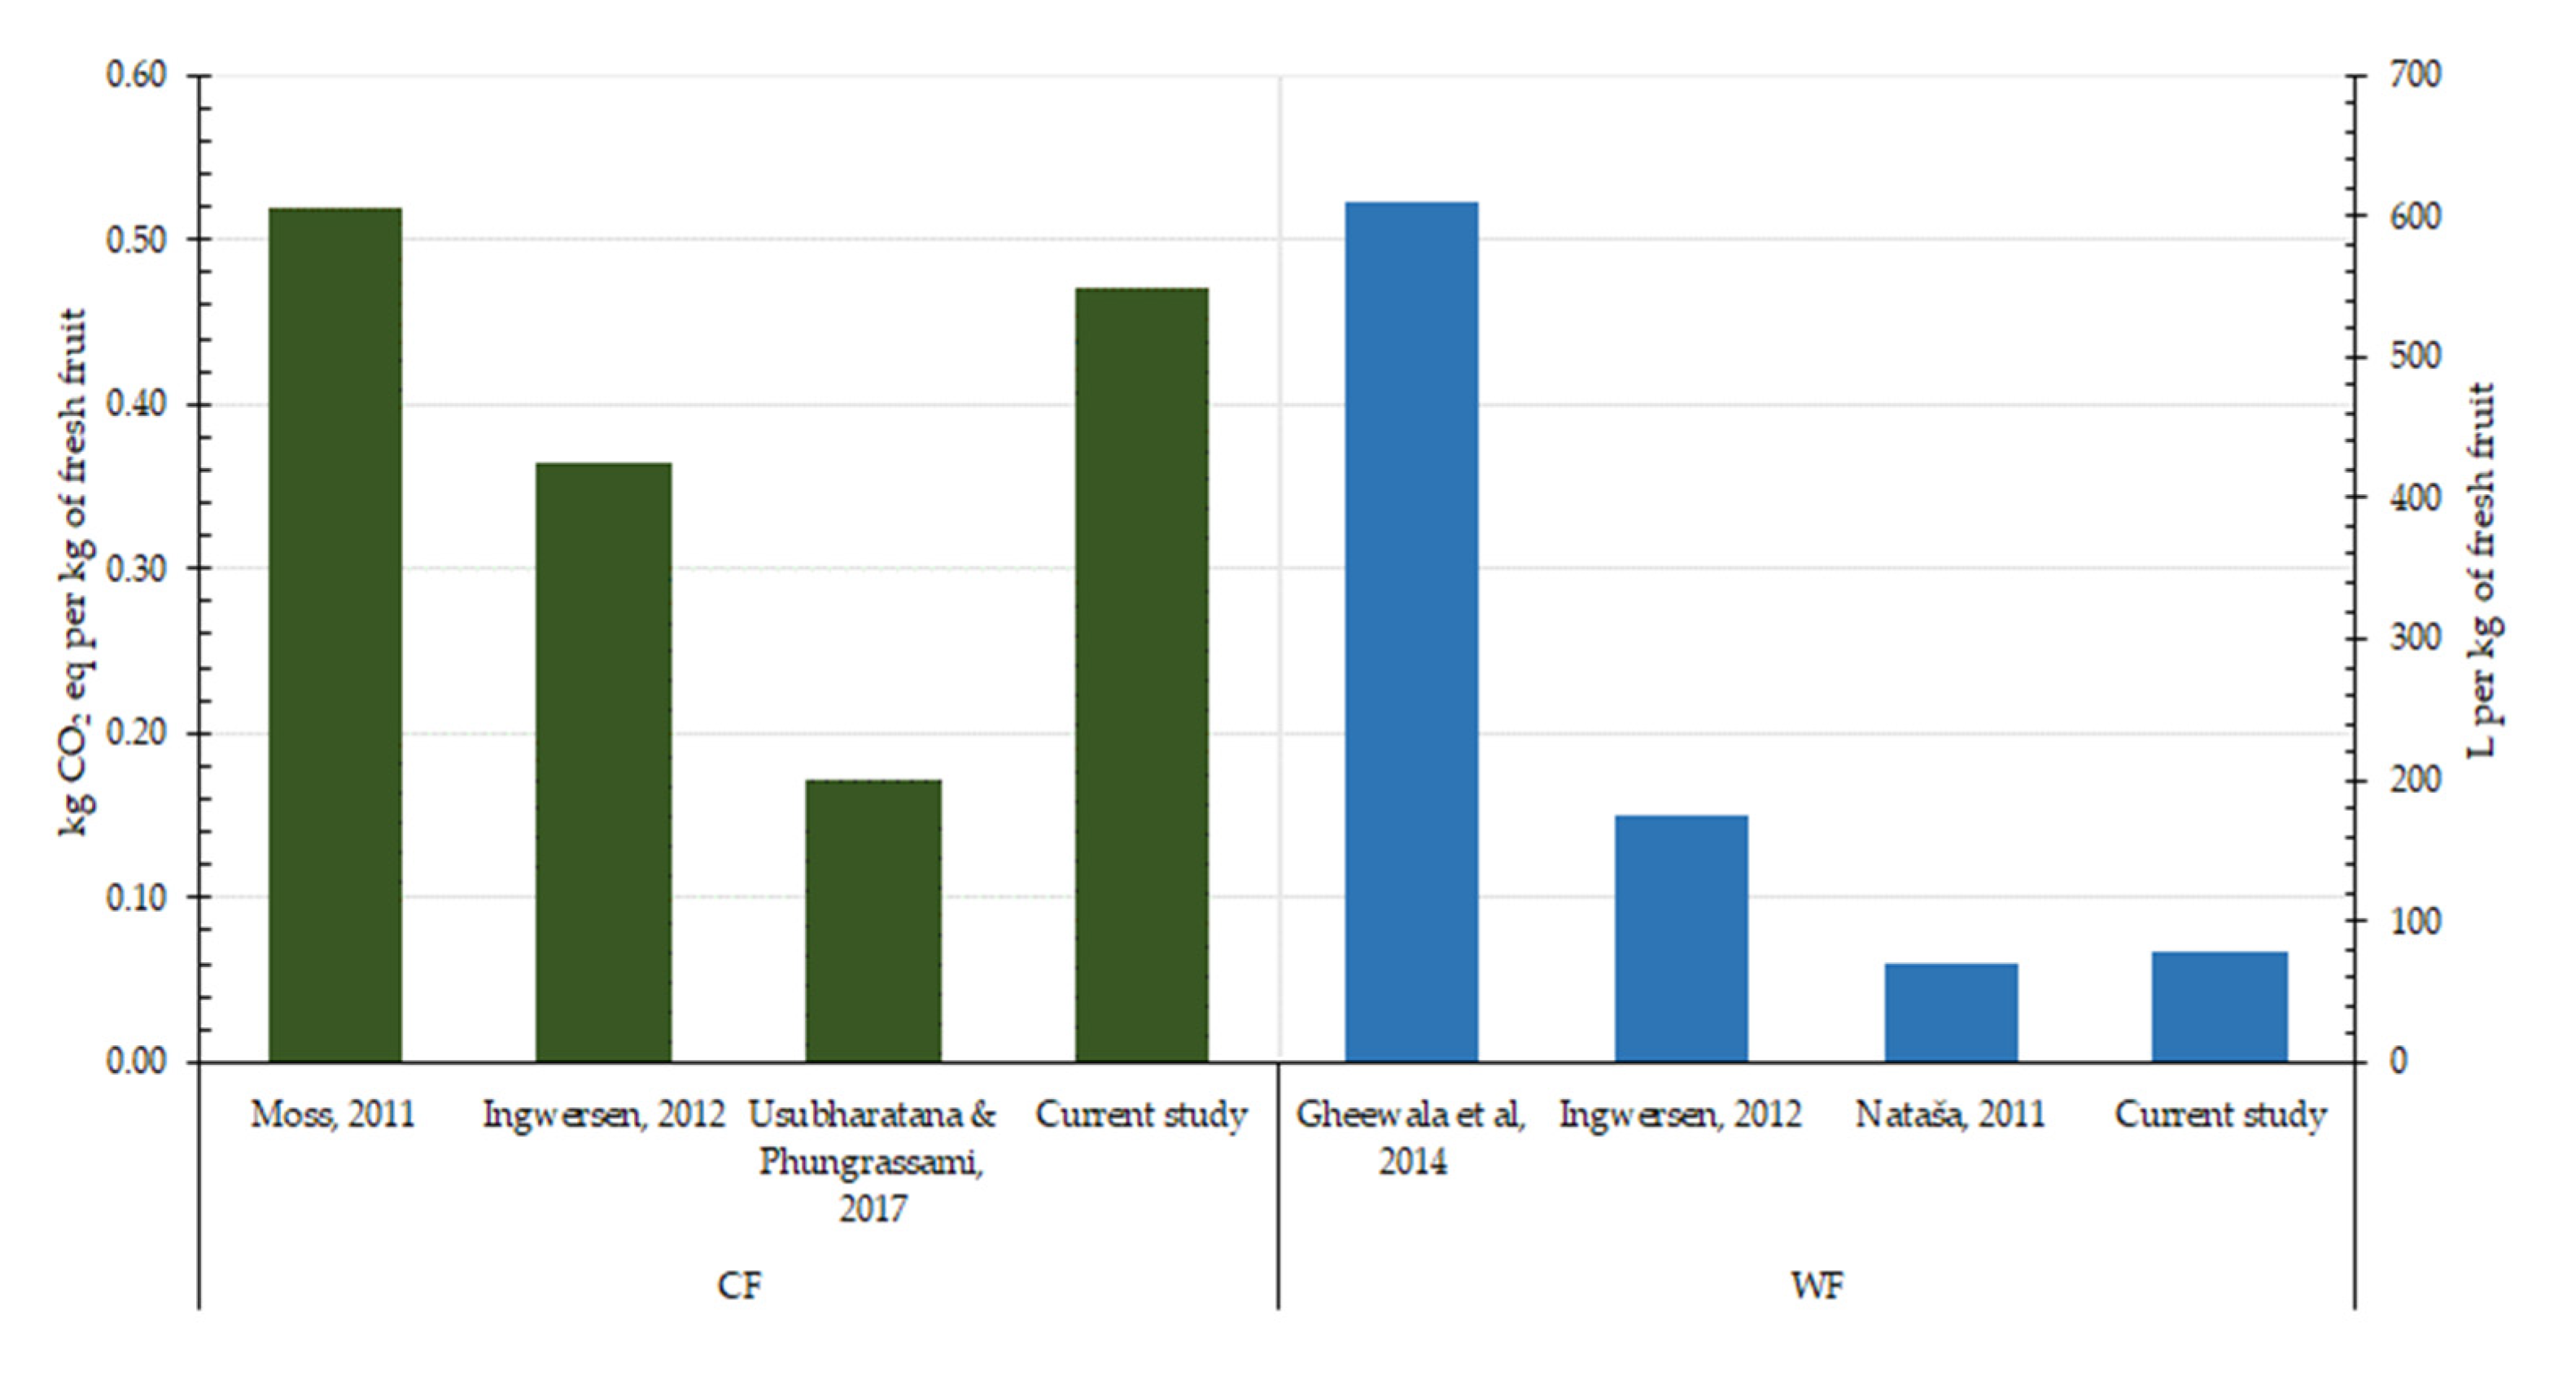
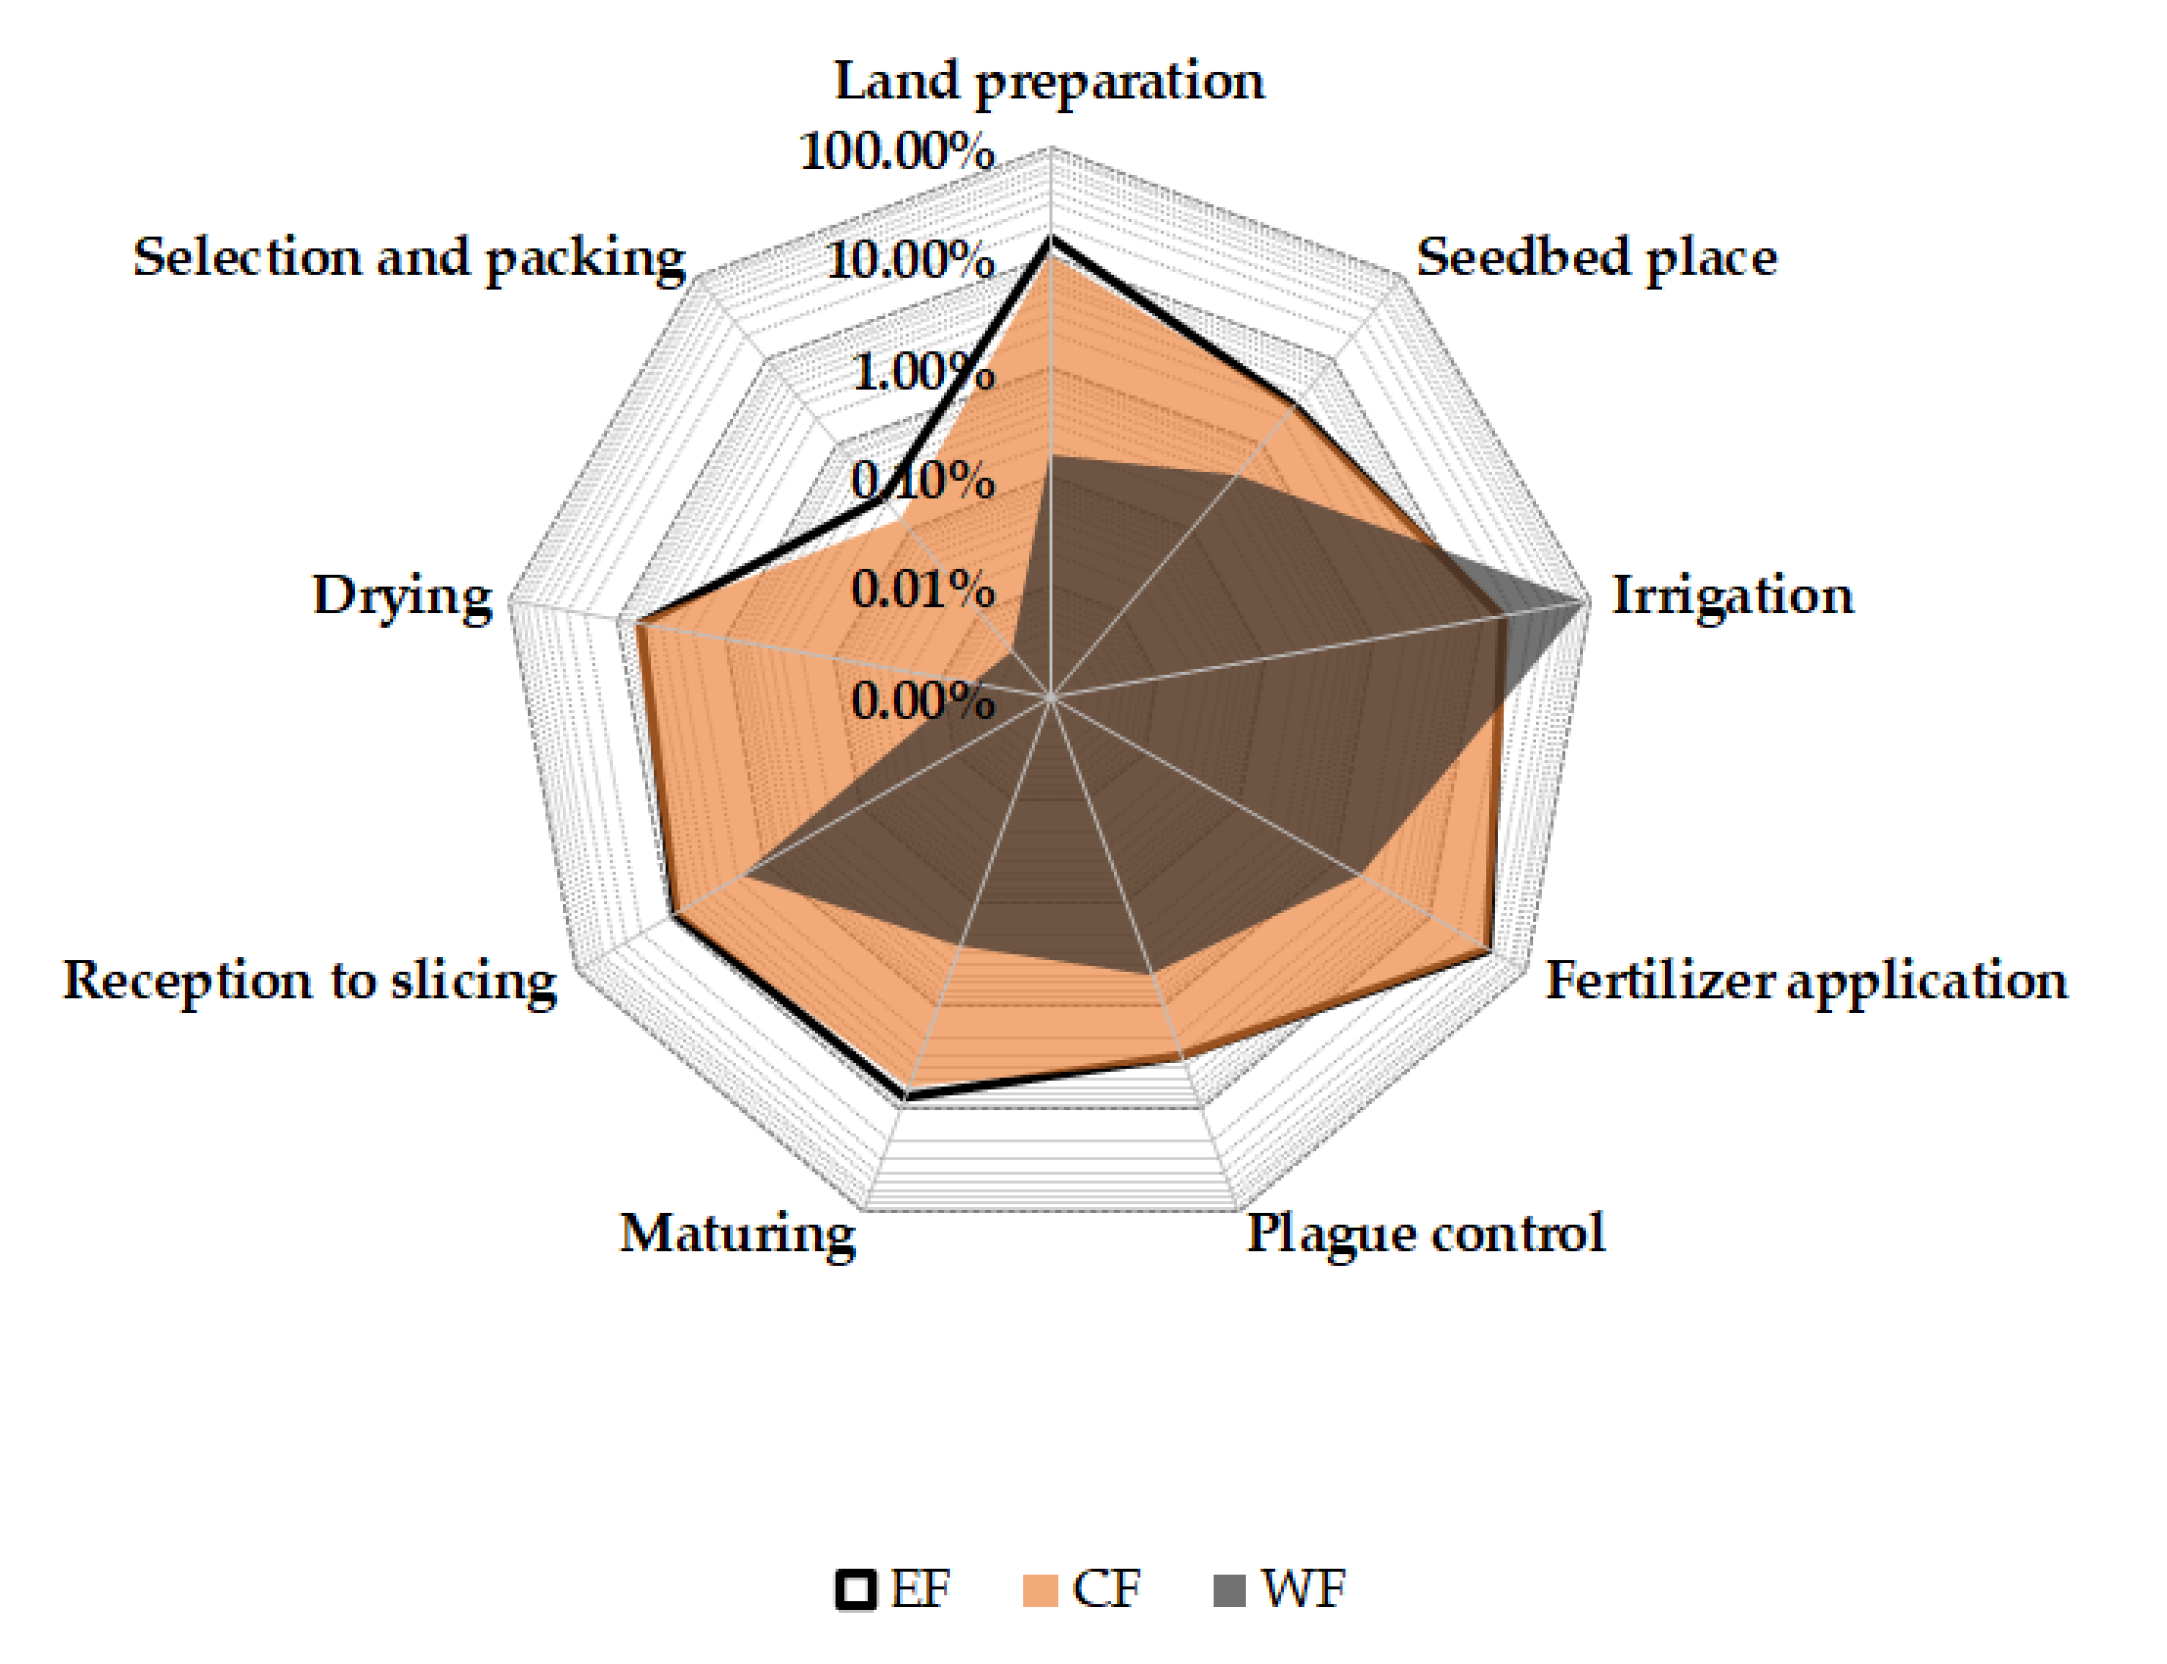
4.1. Agricultural Stage

Figure 5 shows the results of the carbon, water, and energy footprint of the agricultural stage. For the carbon footprint, fertilization contributed 53.5% of the environmental impacts, which were related to the manufacture, transportation, and supply of these products. While irrigation contributed 22.1% due to the use of the motor pump for water extraction, the manufacturing of plastic and steel pipes from the distribution network was also included. Land preparation contributed 12.9% of impacts, which were associated with the manufacturing and use of plastic for the covering of the soil. With a lower contribution to this category we find plague control, seedbed site, as well as the stage of growth and maturation of the fruit, each of them contributing a share of around 4% of the total environmental impact.
For water footprint, the water supply from irrigation and rainwater (blue water and green water) contributed 96.7%. Irrigation was related to the extraction and use of water during the dry months, while only the proportion of rainwater that was useful for the plant was quantified [54]. With a much lesser contribution to impact (calculated by the water footprint) was the use of agrochemicals, which together contributed just over 3.3%. Regarding the energy footprint, it had a great similarity to the impact of the carbon footprint due to its close relationship with the supply and combustion of fossil fuels. The application of fertilizers had the greatest contribution, with an impact of 50%, mainly due to the manufacture of agrochemicals. Electricity consumption for irrigation and land preparation each contributed about 18%. Nazri [55] reported a share of 45.7% as a result of the consumption of fertilizers from the fruit cultivation stage, which is a value close to that shown in the current LCA.
Figure 6 shows the comparison of the results of the carbon and water footprints in the agricultural stage from the literature to the current LCA for the production of 1 kg of fresh pineapple. Usubharatana and Phungrassami [18] quantified a low value in the carbon footprint (0.172 kg of CO2 eq.). This could be because bioorganic fertilizers were used in their process. While Ingwersen [21] and Moss [56] reported results ranging from 0.364 to 0.520 kg of CO2 eq., respectively, in both studies, particular conditions of cultivated land scales, transportation, and different varieties of cultivated pineapple were analyzed with respect to the current study.
In the case of the water footprint, the current LCA quantified 78.6 L, an impact similar to that reported by Nataša [57] of 69.8 L. Due to local conditions, no additional irrigation was required. Ingwersen [21] reported a higher value, 174.5 L. In this study, intensive irrigation water was estimated through farmer surveys. Gheewala et al. [58] reported a very high water footprint value, greater than 600 L since the total amount of rainwater that occurred in the study area was included as a value of water supply for the cultivation of the fruit. Besides, this study was performed in a tropical zone with abundant rainfall throughout the year.

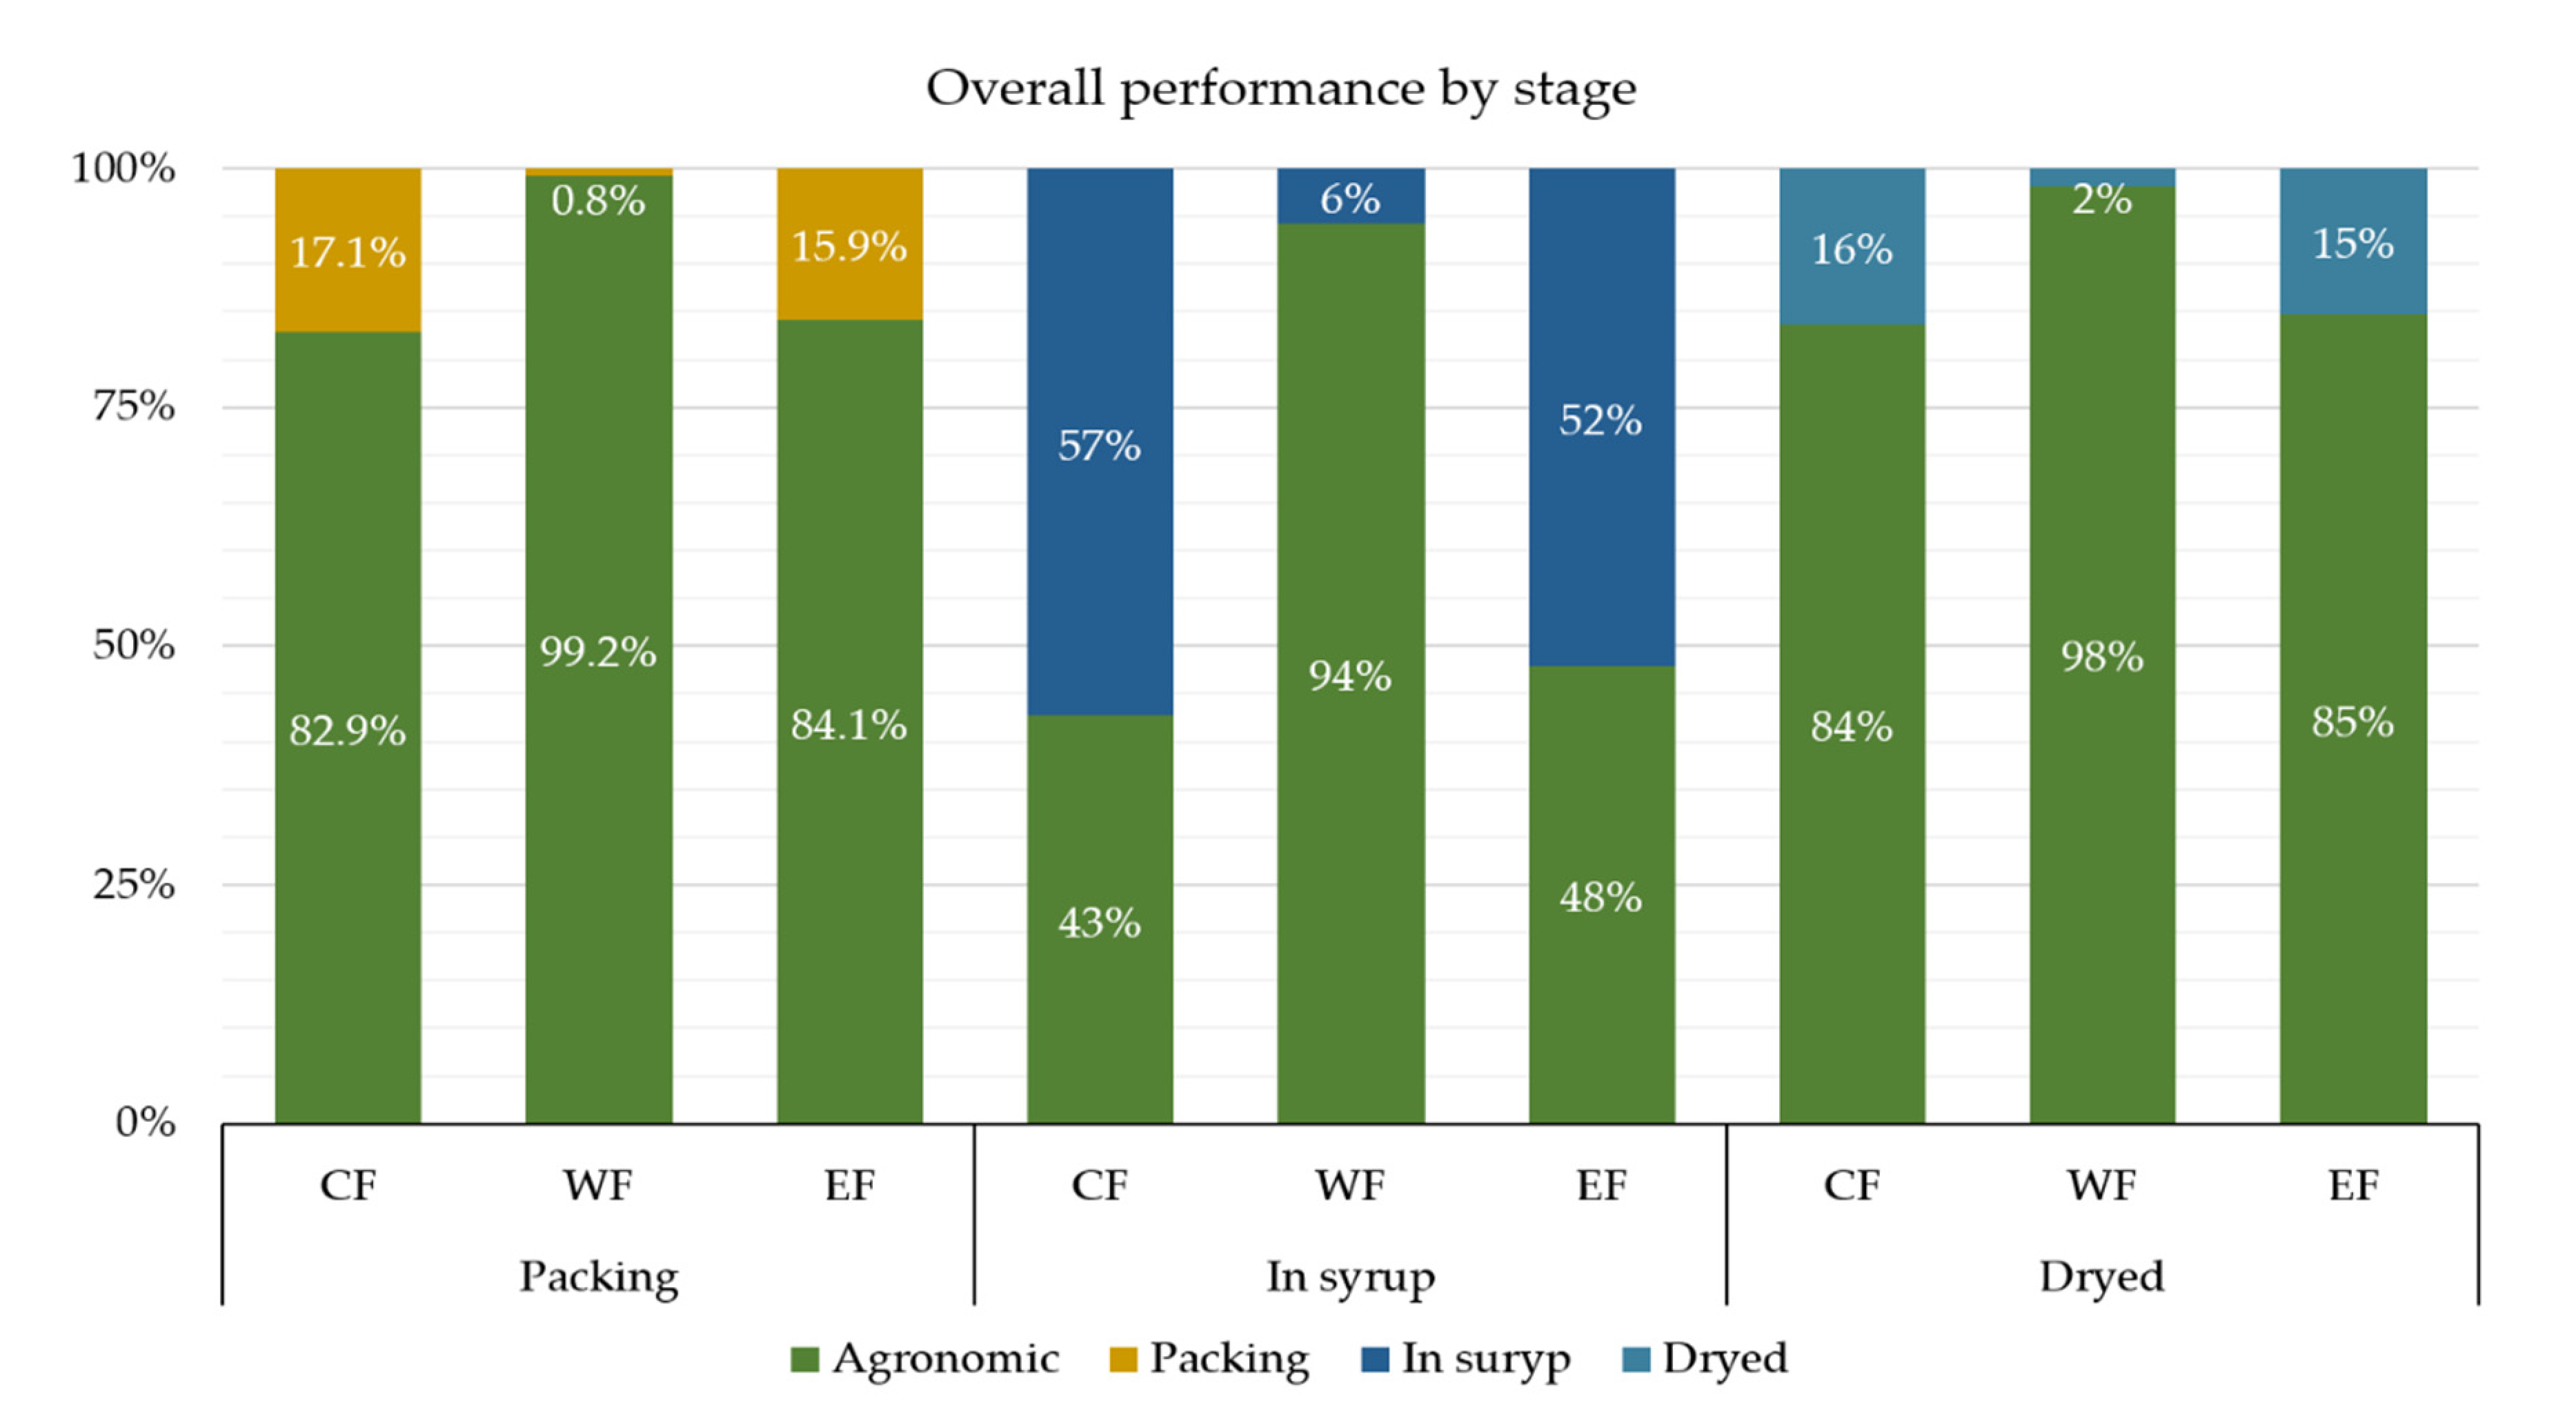
4.2. Pineapple Fruit Processing

In the case of the three pineapple processing products analyzed, the contributions per impact per stage are shown in Figure 7. The greatest environmental impact for all three categories were attributed to the agricultural stage; this was more relevant for fresh-packed pineapple and dehydrated fruit. However, industrialization of the fruit in syrup included more processing stages (as shown in Figure 4), thus the contribution of the environmental impact from the cultivation of pineapple decreased slightly. Figure 7 details the impacts associated with each processing scenario proposed in the current LCA.

4.2.1. Pineapple Packing Process

Figure 8 shows the shared values of carbon, water, and energy footprints per process, grouped starting at the agricultural and industrial stages, and up to the packaged pineapple scenario. Regarding the carbon footprint, a share of 82.9% was shown to correspond to fruit cultivation. Within the fruit cultivation percentage, application of fertilizers had the highest participation at 43.1%, since its manufacture was included. Irrigation and land preparation followed at 17.8% and 10.4%, respectively. The industrial stage had a participation of 17.1%. Box assembly and fruit packaging were the processes with the greatest impacts within this stage at 13.2% of the total carbon footprint. For the water footprint, 95.9% the impacts generated came from the irrigation process, mainly during the growth and maturation of the plant. A share of 3.2% corresponded to the water supply for the application of agrochemicals throughout plant cultivation. Less than 1% of the remaining impact was generated during the packaging process; it came from cleaning the fruit.
Regarding the energy footprint impact, a similarity to the carbon footprint was shown in the distribution of impacts due to its relationship with the consumption of fossil fuels. The greatest impact came from the agricultural stage with a share of 84.2%, while the industrial stage contributed a share of 15.9%, mainly related to the manufacturing and transportation of cardboard boxes.
Figure 9 shows the energy flows that made up the energy footprint from the cultivation process and the packaging of pineapples by the type of primary energy supplied. The largest proportions of energy flows were consumed by fertilizer manufacturing, irrigation, and soil preparation operations, which accounted for more than 70% of total consumption. In the industrial stage, the highest consumption was shown in the pineapple box assembly and packaging operations with a share of 11.3%. The same was observed with the other two pineapple processes, as shown below. The main source of energy supply came from the fossil primary energy, with a share greater than 90%.

4.2.2. Pineapple Process in Syrup

Figure 10 shows the results of the carbon, water, and energy footprints by grouped processes of the agricultural and industrial stages for the pineapples in syrup scenario. In the agricultural stage of the carbon footprint category, the application of fertilizers had the greatest contribution, with a share of 22%. In the industrial stage, the set of processes that began with reception and ended with the fruit inside filled cans, included washing, peeling, coring, and chopping of the fruit, generated the greatest impact in this category with a share of 43%. This value coincides with that reported by Usubharatana and Phung [18], with a share of 41.6%. They showed that the greatest impacts were caused by the manufacture of metal containers, as in the present study.
Regarding the water footprint, as it was in the previous packaging process, the largest share corresponded to irrigation with 91.5%. While in the industrial stage, its impact was much less; as a whole it shared only 5.8%. On the other hand, the distribution of the impact from the energy footprint was similar to the carbon footprint due to the strong local dependence on energy supply from fossil fuels. The energy flows are shown in detail below.
Figure 11 shows the energy flows that contributed to the energy footprint for the production of pineapples in syrup. In this case, each type of energy generation source, placed using a flow line, supplied the processes that made up the product system. It shows the largest flows of energy supply come from non-renewable sources, represented by fossil fuels; these correspond to more than four-fifths of all the energy consumed by the product system, with a share of 81%. The two processes with the greatest demand for fossil energy (>50%) were the application of fertilizers, which included their manufacturing, in the agricultural stage, and the industrial processes of preparing the fruit up to filling cans with it. Another important source of energy contribution was biomass with a share of 8.6%, which came from added sugar for syrup production. This was because, locally, when manufacturing sugar from sugarcane, the residual bagasse generated in milling was used in cogeneration processes to supply energy for the production equipment [59,60,61].
Figure 10 shows the contribution of nuclear-non-renewable energy, with shares of 1.7%, which corresponded to the primary energy used for its transformation into secondary energy. Therefore, this energy corresponded to electricity consumption from the product system stages. However, the flow of hydro energy provided a share of 1.5%, which also corresponded to the consumption of electric power. The supply of electrical power comes largely, among other processes, in the manufacture of metal containers filled with pineapples in syrup. It is important to highlight that local electricity generation is highly dependent on processes that use fossil fuels, such as natural gas and fuel oil, which impacts both the energy and carbon footprint. When processing pineapples in syrup, the energy losses from the syrup preparation stages, and boiler, were quantified, which had a share of 15% with respect to the total energy supplied.

4.2.3. Pineapple Dehydration Process

Figure 12 shows the results of carbon, water, and energy footprints by grouped processes of the agricultural and industrial stages for the dehydrated pineapple scenario. As was the case in the two previous industrialization processes, the carbon footprint also showed that a greatest share was generated by the manufacturing and application of fertilizers (43%), followed by irrigation and land preparation, with a share of 18% and 10%, respectively. These three processes come from the agricultural stage. While in the industrial stage, the largest share was produced in the initial stages, which included the reception and preparation of the fruit up to the process of slicing, with a share of 9%. The dehydration process exerted a share of 7%. In the first case, it was caused by electrical consumption from the equipment. In the second one, it was due to the use of energy from fossil fuels for the drying chamber. For the water footprint category, again, its impact was directly related to the supply of water for irrigation during fruit cultivation, with a share of 95%.
For the energy footprint, as expected, most came from the manufacturing and application of fertilizers, with a share of 85%. The remaining proportion corresponded to the industrial stage, as demonstrated in the tracking of energy flow in Figure 13. This shows that energy flows from their primary source of supply up to the processes where they were consumed. Non-renewable energy from fossil fuels supplied a large proportion of the energy required, with a global share of about 92%. As explained above, locally, the energy was supplied to many of the productive sectors and was derived from the oil and natural gas industries, including the electricity generation processes, which had repercussions on the impacts quantified by the energy and carbon footprints.
In the case of renewable energy, they have little relevance, only a share of 4%; there are few incentives for the use of biomass, with some exceptions, such as the bioenergetic use from bagasse in the production of cane sugar, which was previously mentioned [62,63,64]. In the stage that includes the dehydration oven chamber, energy losses of 24% were quantified with respect to the total energy supplied, this should be taken into consideration to improve the efficiency in the design of the dryer or in the implementation of an energy recovery system.

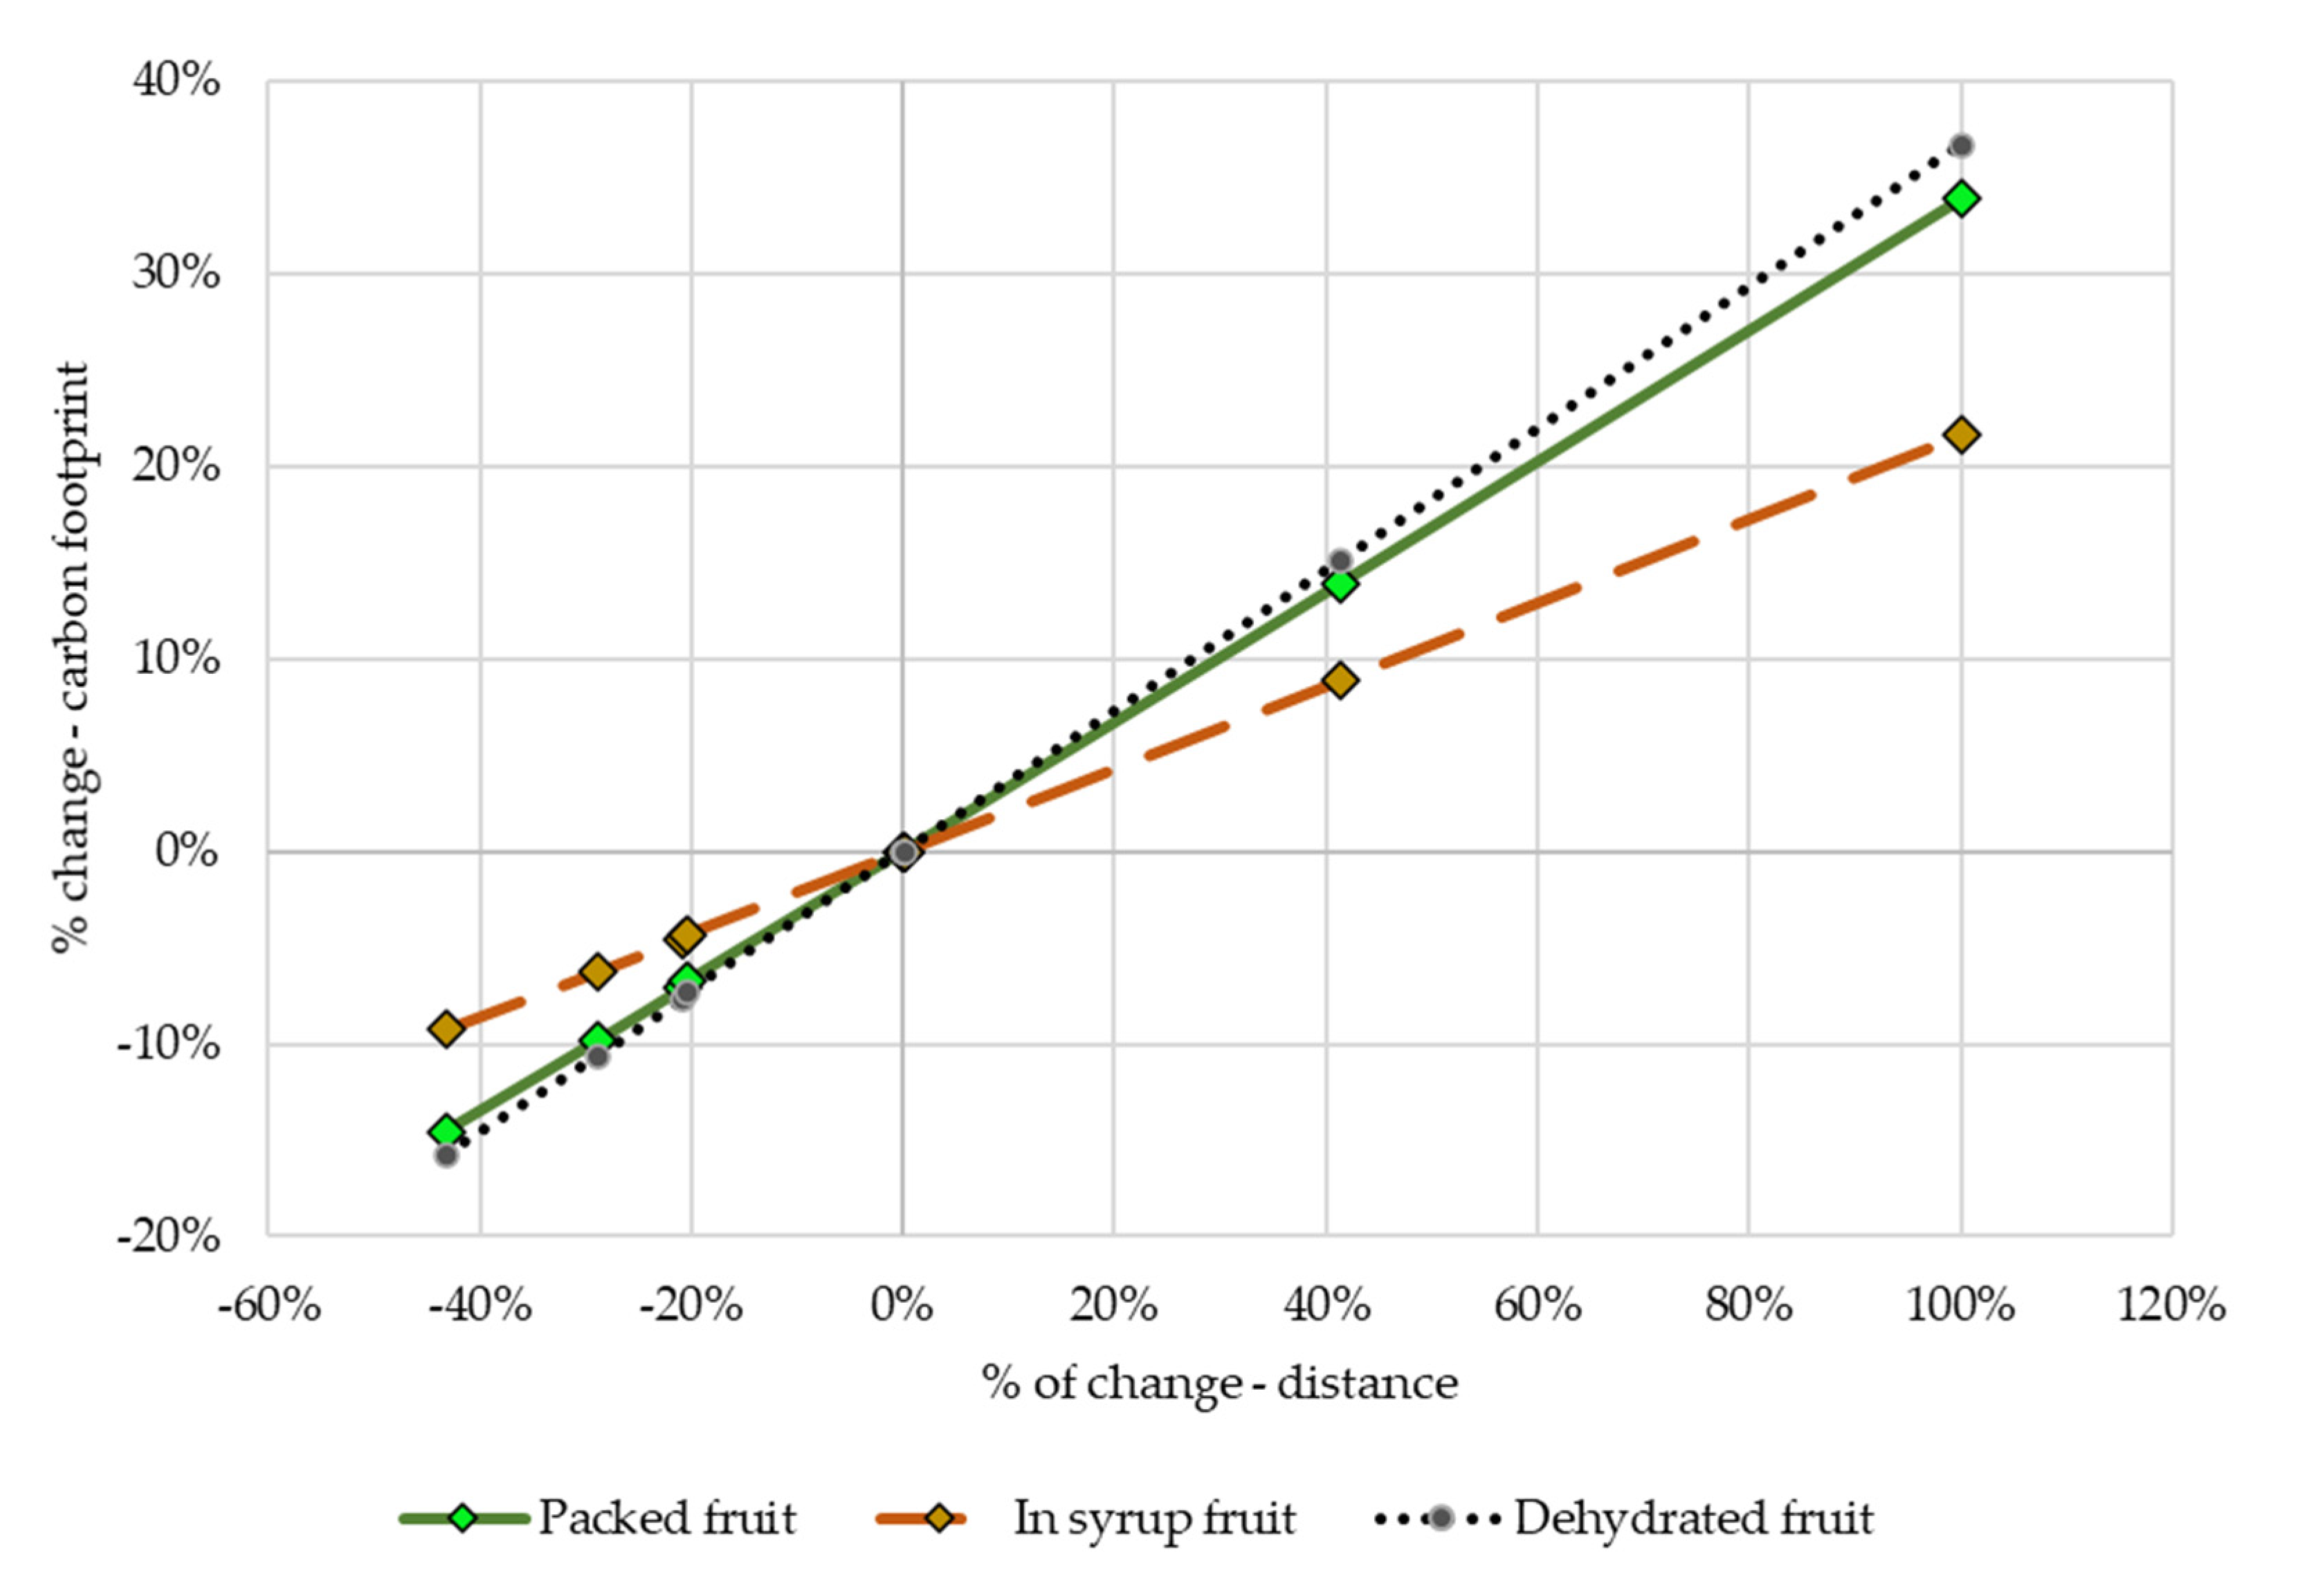
4.3. Sensitivity Analysis

Figure 14 shows the sensitivity of the carbon footprint in relation to the transportation inputs from the three evaluated industrialization scenarios. The operation of transport in the product system was selected since a considerable environmental impact was demonstrated, mainly from the cultivation stage in the agro-industrial processes [65,66]. For the current sensitivity analysis, this was carried out by varying the distribution centers of the inputs considered in the base case, which were those reported by local producers during field interviews. Sales centers for the main inputs were located both closer to the current ones and further away; thus, the environmental impact in the product system was quantified. It was shown that the sales centers closest to the study area decreased the impacts generated from the carbon footprint by 15%, while the most remote sites increased the quantification of the impact by around 33%. Despite having distribution centers close to the production area, the economic factor may be relevant in the producers’ decisions for the selection of the current site for input acquisition at the expense of other factors, such as the quality of the product or even environmental aspects. This coincided with Goordazi, Fahimnia, and Sarkis [67], who reported that inefficiencies in the management of suppliers and shipping routes generated higher CO2 emissions. A greater change in GHG emissions was also shown in the pineapple packing and dehydration processes. During these processes, there was more dependence on the quantity of pineapples transported from the cultivation areas. Additionally, some inputs for packaging materials were purchased from places far away from the study site. For the pineapples in syrup process, some of the required inputs were acquired in areas close to the place of processing, i.e., the sugar for the syrup was transported from a nearby sugar cane plant.

5. Conclusions

This research quantified the environmental impacts associated with the cultivation and industrial processing of pineapples using carbon, water, and energy footprints. The LCI-database was made up of information from local producers and data from suppliers of raw materials and inputs in the region, which allowed this evaluation of the pineapple industry. Global results showed that the fruit cultivation stage was the greatest generator of environmental impact for the three quantified footprints. This was consistent with the literature consulted. The manufacturing and application of the different agrochemical products supplied during the agricultural stage contributed to the greatest impacts of carbon and energy footprints. Although irrigation operations generated the largest proportion of the water footprint due to intensive cultivation, it nonetheless required a year-round supply of water. Furthermore, agricultural producers do not have a widespread implementation of drip irrigation, which would lead to more efficient water consumption.
The stages of industrialization were shown not to contribute greatly to the evaluated environmental impacts, despite having different equipment and operations. In these stages, the greatest impacts were originated from processes that required considerable energy supplies, both thermal and electrical power. In the study area, which was a sample of what happens at the regional level, there was a lot of energy dependence on fossil fuels throughout the supply chain. This includes the production of electrical power that comes, for the most part, from non-renewable energy sources, as reported in Figure 10 and Figure 12. There is still a need to diversify primary energy sources that could reduce the total environmental impacts of the product system. On the other hand, proper management in the selection of suppliers of the input supply chain would reduce environmental impacts generated by transport.

Author Contributions

Conceptualization, E.C.-G., M.R.G.-D., and L.D.M.-S.; methodology, L.D.M.-S.; formal analysis, L.D.M.-S.; writing—original draft preparation, E.C.-G.; writing—review and editing, E.C.-G., M.R.G.-D., and L.D.M.-S.; resources, E.C.-G.; validation, L.D.M.-S.; supervision, M.R.G.-D.; data curation, R.V.-D.l.C.; project administration, E.C.-G.; investigation R.V.-D.l.C. All authors have read and agreed to the published version of the manuscript.

Funding

This research was funded by Universidad Veracruzana.

Conflicts of Interest

The authors declare no conflict of interest.

References

  1. Water for Sustainable Food and Agriculture: A Report Produced for the G20 Presidency of Germany; FAO: Rome, Italy, 2017.
  2. International Energy Agency CO2 Emissions from Fuel Combustion 2019; Organisation for Economic Co-Operation and Development (OECD): Paris, France, 2019.
  3. Pfister, S.; Bayer, P.; Koehler, A.; Hellweg, S. Projected water consumption in future global agriculture: Scenarios and related impacts. Sci. Total Environ. 2011, 409, 4206–4216. [Google Scholar] [CrossRef] [PubMed]
  4. Pfister, S.; Bayer, P. Monthly water stress: Spatially and temporally explicit consumptive water footprint of global crop production. J. Clean. Prod. 2014, 73, 52–62. [Google Scholar] [CrossRef]
  5. FAO; WWC. Towards a Water and Food Secure Future: Critical Perspectives for Policy-Makers; FAO & WWC: Roma, Italy, 2015. [Google Scholar]
  6. Pandey, D.; Agrawal, S.B. Carbon Footprint Estimation in the Agriculture Sector. In Sustainable Urban Logistics: Concepts, Methods and Information Systems; Springer: Singapore, 2014; Volume 1, pp. 25–47. [Google Scholar]
  7. Rebolledo-Leiva, R.; Meza, L.A.; Iriarte, A.; González-Araya, M.C. Joint carbon footprint assessment and data envelopment analysis for the reduction of greenhouse gas emissions in agriculture production. Sci. Total Environ. 2017, 593, 36–46. [Google Scholar] [CrossRef]
  8. Huijbregts, M.A.J.; Hellweg, S.; Frischknecht, R.; Hendriks, H.W.M.; Hungerbühler, K.; Hendriks, A.J. Cumulative Energy Demand As Predictor for the Environmental Burden of Commodity Production. Environ. Sci. Technol. 2010, 44, 2189–2196. [Google Scholar] [CrossRef] [PubMed] [Green Version]
  9. Puig, R.; Fullana-I-Palmer, P.; Baquero, G.; Riba, J.-R.; Gala, A.B. A Cumulative Energy Demand indicator (CED), life cycle based, for industrial waste management decision making. Waste Manag. 2013, 33, 2789–2797. [Google Scholar] [CrossRef]
  10. Jefferies, D.; Muñoz, I.; Hodges, J.; King, V.J.; Aldaya, M.M.; Ercin, A.E.; I Canals, L.M.; Hoekstra, A.Y. Water Footprint and Life Cycle Assessment as approaches to assess potential impacts of products on water consumption. Key learning points from pilot studies on tea and margarine. J. Clean. Prod. 2012, 33, 155–166. [Google Scholar] [CrossRef] [Green Version]
  11. D’Ambrosio, E.; De Girolamo, A.M.; Rulli, M.C. Assessing sustainability of agriculture through water footprint analysis and in-stream monitoring activities. J. Clean. Prod. 2018, 200, 454–470. [Google Scholar] [CrossRef]
  12. International Organization for Standardization (ISO). ISO 14044 Environmental Management-Life Cycle Assessment-Requirements and Guidelines. Available online: https://www.iso.org/obp/ui/#iso:std:iso:14044:ed-1:v1:es (accessed on 31 August 2020).
  13. Joy, P.P. Benefits and Uses of Pineapple. Available online: https://www.researchgate.net/profile/Pp_Joy/publication/306017037_Benefits_and_uses_of_pineapple/links/57aad02f08ae3765c3b63025/Benefits-and-uses-of-pineapple.pdf (accessed on 31 August 2020).
  14. Crops, Mexico, Pineapple, Official Data (2018). Available online: http://www.fao.org/faostat/en/#data/QC (accessed on 31 August 2020).
  15. Piña Mexicana. Available online: https://www.gob.mx/cms/uploads/attachment/file/257084/Potencial-Pi_a.pdf (accessed on 15 May 2020).
  16. Crivelli, C. Análisis del Ciclo de Vida de dos sistemas de manejo para la producción de piña en México. Master’s Thesis, Universitat Politècnica de Catalunya. Departament d’Enginyeria Civil i Ambiental, Barcelona, Spain, 2017. [Google Scholar]
  17. Silvetti, F.; Cáceres, D. La expansión de monocultivos de exportación en Argentina y Costa Rica. In Conflictos Socioambientales y Lucha Campesina Por la Justicia Ambiental; Mundo Agrar: Córdoba, Argentina, 2015; p. 16. [Google Scholar]
  18. Usubharatana, P.; Phungrassami, H. Evaluation of Opportunities to Reduce the Carbon Footprint of Fresh and Canned Pineapple Processing in Central Thailand. Pol. J. Environ. Stud. 2017, 26, 1725–1735. [Google Scholar] [CrossRef]
  19. Frankowska, A.; Jeswani, H.K.; Azapagic, A. Life cycle environmental impacts of fruits consumption in the UK. J. Environ. Manag. 2019, 248, 109111. [Google Scholar] [CrossRef]
  20. Marius de Ramos, Q.R.; Toboada, E.B. Cradle-to-Gate Life Cycle Assessment of Fresh and Processed Pineapple in the Philippines. Nat. Environ. Poll. Tech. 2018, 17, 783–790. [Google Scholar]
  21. Ingwersen, W.W. Life cycle assessment of fresh pineapple from Costa Rica. J. Clean. Prod. 2012, 35, 152–163. [Google Scholar] [CrossRef]
  22. International Organization for Standardization (ISO). ISO 14040 Environmental Management-Life Cycle Assessment-Principles and Framework. Available online: https://www.iso.org/obp/ui#iso:std:iso:14040:ed-2:v1:es (accessed on 31 August 2020).
  23. Aguayo, F.; Peralta, M.E.; Lama, J.R.; Soltero, V.M. Ecodiseño Ingeniería Sostenible de la Cuna a la Tumba (C2C), 1st ed.; RC Libros: Madrid, Spain, 2011; pp. 65–85. [Google Scholar]
  24. Bribián, I.Z.; Aranda-Usón, A.; Scarpellini, S. Life cycle assessment in buildings: State-of-the-art and simplified LCA methodology as a complement for building certification. Build. Environ. 2009, 44, 2510–2520. [Google Scholar] [CrossRef]
  25. Besnier, A.; Bosque, F.; Farrant, L.; Labau, M.; Lempereur, V.; Penavayre, S. Analyse de cycle de vie de filières agro-alimentaires. Available online: https://www.vignevin.com/wp-content/uploads/2019/03/ACYDU_Synth%C3%A8seAcvEnviro.pdf (accessed on 28 August 2019).
  26. Fonction, Unité Fonctionnelle et flux de référence. Available online: http://stockage.univ-valenciennes.fr/MenetACVBAT20120704/acvbat/chap03/co/ch03_160_3-2-1.html (accessed on 3 April 2020).
  27. Haya, E. Análisis de Ciclo de Vida. Available online: https://www.eoi.es/es/file/66611/download?token=BTXaL249 (accessed on 3 April 2020).
  28. Huijbregts, M.A.J.; Steinmann, Z.J.N.; Elshout, P.M.F. ReCiPe2016: A harmonized life cycle impact assessment method at midpoint and endpoint level. Int. J. Life Cycle Assess. 2017, 22, 138–147. [Google Scholar] [CrossRef]
  29. International Organization for Standardization (ISO). ISO 14067 Greenhouse Gases—Carbon Footprint of Products—Requirements and Guidelines for Quantification. Available online: https://www.iso.org/obp/ui#iso:std:iso:14067:ed-1:v1:es (accessed on 31 August 2019).
  30. Berger, M.; Van Der Ent, R.; Eisner, S.; Bach, V.; Finkbeiner, M. Water Accounting and Vulnerability Evaluation (WAVE): Considering Atmospheric Evaporation Recycling and the Risk of Freshwater Depletion in Water Footprinting. Environ. Sci. Technol. 2014, 48, 4521–4528. [Google Scholar] [CrossRef] [PubMed]
  31. International Organization for Standardization (ISO). ISO 14046 Environmental management—water footprint—Principles, requirements and guidelines. Available online: https://www.iso.org/obp/ui#iso:std:iso:14046:ed-1:v1:es (accessed on 31 August 2020).
  32. Análisis de Ciclo de Vida y Huella de Carbono. Available online: http://www.comunidadism.es/wp-content/uploads/downloads/2012/10/PUB-2009-033-f-C-001_analisis-ACV-y-huella-de-carbonoV2CAST.pdf (accessed on 13 May 2020).
  33. Life Cycle Environmental Impacts Study for Europe, Middle East and Africa (AMEA). Available online: https://www8.hp.com/h20195/v2/getpdf.aspx/c05876603.pdf (accessed on 20 May 2020).
  34. Stranddfort, H.K.; Hoffmann, L.; Schmidt, A. Impact Categories, Normalization and Weighting in LCA; Danish Ministry of the Environment: Odense, Denmark, 2005; pp. 77–79.
  35. Lovarelli, D.; Bacenetti, J.; Fiala, M. Water Footprint of crop productions: A review. Sci. Total Environ. 2016, 548, 236–251. [Google Scholar] [CrossRef]
  36. Bockel, L.T.; Jönsson, O.M. Carbon Footprinting Across the Food Value Chain: A New Profitable Low Carbon Initiative? A Review of the Main Benefits for Businesses, Public Bodies and Issues for Developing Countries; Food and Agriculture Organization of the United Nations (FAO): Rome, Italy, 2011. [Google Scholar]
  37. Hoesktra, A.Y.; Chapagain, A.K.; Aldaya, M.M.; Mekonnen, M.M. The Water Footprint Assessment Manual: Setting the Global Standard, 1st ed.; Earthscan: London, UK, 2011. [Google Scholar]
  38. Hischier, R.; Althaus, H.-J.; Doka, G.; Frischknecht, R.; Humbert, S.; Koellner, T.; Margni, M.; Weidema, B.P.; Bauer, C.; Dones, R.; et al. Implementation of Life Cycle Impact Assessment Methods, 3rd ed.; Swiss Centre for Life Cycle Inventories: St. Gallen, Switzerland, 2013. [Google Scholar]
  39. SENER (Secretaría de Energía). Balance Nacional de Energía 2018. Available online: https://www.gob.mx/cms/uploads/attachment/file/528054/Balance_Nacional_de_Energ_a_2018.pdf (accessed on 18 April 2020).
  40. International Energy Agency. World Energy Balances 2019; OECD Publishing: Paris, France, 2019. [Google Scholar]
  41. International Energy Agency. Electricity Information 2000; OECD Publishing: Paris, France, 2019. [Google Scholar]
  42. Secretaría de Energía (SENER). Programa de Desarrollo del Sistema Eléctrico Nacional 2018–2032. Available online: https://base.energia.gob.mx/prodesen/PRODESEN2018/PRODESEN18.pdf (accessed on 18 April 2020).
  43. Huijbregts, M.A.J.; Rombouts, L.J.A.; Hellweg, S.; Frischknecht, R.; Hendriks, A.J.; Van De Meent, D.; Ragas, A.M.J.; Reijnders, L.; Struijs, J. Is Cumulative Fossil Energy Demand a Useful Indicator for the Environmental Performance of Products? Environ. Sci. Technol. 2006, 40, 641–648. [Google Scholar] [CrossRef] [Green Version]
  44. Frischknecht, R.; Wyss, F.; Knöpfel, S.B.; Lützkendorf, T.; Balouktsi, M. Cumulative energy demand in LCA: The energy harvested approach. Int. J. Life Cycle Assess 2015, 20, 957–969. [Google Scholar] [CrossRef]
  45. Wiesen, K.; Wirges, M. From cumulated energy demand to cumulated raw material demand: The material footprint as a sum parameter in life cycle assessment. Energy Sustain. Soc. 2017, 7, 25. [Google Scholar] [CrossRef]
  46. Martínez, P.; Escudero, M.; Romero, A.; Hernández, A.; (Fieldwork in the Pineapple Farm Sector, Juan Rodriguez Clara, Veracruz, México). Personal communication, 2019.
  47. Buendía, L.; Domínguez, C.; Sánchez, O.; (Fieldwork in the Pineapple Industrial Sector, Juan Rodriguez Clara, Veracruz, México). Personal communication, 2019.
  48. Secretaría de Energía (SENER). Sistema de Información de Energía. Available online: http://sie.energia.gob.mx (accessed on 18 April 2020).
  49. Brogaard, L.K.; Christensen, T.H. Life cycle assessment of capital goods in waste management systems. Waste Manag. 2016, 56, 561–574. [Google Scholar] [CrossRef]
  50. D3.5 Report on the LCA of the Solution. Available online: http://www.digesmart.eu/documentos/D3.5%20Report%20on%20the%20life%20cycle%20assessment%20study%20of%20the%20solution_(public)_EN.pdf (accessed on 25 May 2020).
  51. Henry, B.; Ledgard, S.; Nebel, B.; Wiedemann, S. Guidelines for Conducting Life Cycle Assessment of the Environmental Performance of Wool Textiles, 1st ed.; International Wool Textile Organization: Brussels, Belgium, 2016. [Google Scholar]
  52. Cuadernillo municipal de Juan Rodríguez Clara, Ver 2019. Available online: http://ceieg.veracruz.gob.mx/wp-content/uploads/sites/21/2019/06/Juan-Rodr%C3%ADguez-Clara_2019.pdf (accessed on 19 August 2020).
  53. Ecoinvent Database. Available online: https://www.ecoinvent.org/database/database.html (accessed on 29 February 2020).
  54. Jeswani, H.K.; Azapagic, A. Water footprint: Methodologies and a case study for assessing the impacts of water use. J. Clean. Prod. 2011, 19, 1288–1299. [Google Scholar] [CrossRef]
  55. Nazri, A.M.; Pebrian, D.E. Analysis of Energy Consumption in Pineapple Cultivation in Malaysia: A Case Study Pertanika. J. Sci. Technol. 2017, 1, 17–28. [Google Scholar]
  56. Moss, R. Summary of Studies on Environmental Performance of Fresh Pineapple Produced in Ghana for Export to Europe 2011. Available online: https://www.twinn.com.au/pdf/C-footprint-of-pineapple-production-and-transport-WAFF.pdf (accessed on 31 August 2020).
  57. Nataša, S. Water Footprint Assessment Bananas and Pineapples; Soil & More International: Thousand Oaks, CA, USA, 2011. [Google Scholar]
  58. Gheewala, S.H.; Silalertruksa, T.; Nilsalab, P.; Mungkung, R.; Perret, S.R.; Chaiyawannakarn, N. Water Footprint and Impact of Water Consumption for Food, Feed, Fuel Crops Production in Thailand. Water 2014, 6, 1698–1718. [Google Scholar] [CrossRef] [Green Version]
  59. Rincón, L.E.; Becerra, L.A.; Moncada, J.; Cardona, C.A. Techno-Economic Analysis of the Use of Fired Cogeneration Systems Based on Sugar Cane Bagasse in South Eastern and Mid-Western Regions of Mexico. Waste Biomass-Valoriz. 2013, 5, 189–198. [Google Scholar] [CrossRef]
  60. García, C.A.; Fuentes, A.; Hennecke, A.; Riegelhaupt, E.; Manzini, F.; Masera, O. Life-cycle greenhouse gas emissions and energy balances of sugarcane ethanol production in Mexico. Appl. Energy 2011, 88, 2088–2097. [Google Scholar] [CrossRef]
  61. Aguilar-Rivera, N.; Rodríguez, D.; Enríquez, V.; Castillo, A.; Herrera, A. The Mexican Sugarcane Industry: Overview, Constraints, Current Status and Long-Term Trends. Sugar Tech 2012, 14, 207–222. [Google Scholar] [CrossRef]
  62. Alemán-Nava, G.S.; Casiano-Flores, V.H.; Cárdenas-Chávez, D.L.; Diaz-Chavez, R.; Scarlat, N.; Mahlknecht, J.; Dallemand, J.-F.; Parra-Saldivar, R. Renewable energy research progress in Mexico: A review. Renew. Sustain. Energy Rev. 2014, 32, 140–153. [Google Scholar] [CrossRef]
  63. Lozano-García, D.F.; Santibañez-Aguilar, J.E.; Lozano, F.J.; Flores-Tlacuahuac, A. GIS-based modeling of residual biomass availability for energy and production in Mexico. Renew. Sustain. Energy Rev. 2020, 120, 109610. [Google Scholar] [CrossRef]
  64. Honorato-Salazar, J.A.; Sadhukhan, J. Annual biomass variation of agriculture crops and forestry residues, and seasonality of crop residues for energy production in Mexico. Food Bioprod. Process. 2020, 119, 1–19. [Google Scholar] [CrossRef]
  65. Islam, S.; Ponnambalam, S.G.; Lam, H.L. A novel framework for analyzing the green value of food supply chain based on life cycle assessment. Clean Technol. Environ. Policy 2016, 19, 93–103. [Google Scholar] [CrossRef]
  66. Konieczny, P.; Dobrucka, R.; Mroczek, E. Using carbon footprint to evaluate environmental issues of food transportation. Int. J. Logist. Manag. 2013, 9, 3–10. [Google Scholar]
  67. Goodarzi, S.; Fahimnia, B.; Sarkis, J. Supply Chain Carbon Management; Institute of Transport and Logistics Studies: Sydney, Australia, 2019. [Google Scholar]
Figure 1. The methodology of life cycle assessment (LCA). Source: own elaboration based on [12,22].
Applsci 10 07007 g001
Figure 2. General diagram of the agricultural and industrial production process. Source: own elaboration.
Applsci 10 07007 g002
Figure 3. Unit processes that make up the pineapple production stage. Source: own elaboration.
Applsci 10 07007 g003
Figure 4. Unit processes that are part of the packing, preserving, and dehydrating industry. Source: own elaboration.
Applsci 10 07007 g004
Figure 5. Environmental impacts associated with the agronomic stage.
Applsci 10 07007 g005
Figure 6. Comparison of the carbon footprint and water footprint between different authors [18,21,56,57,58].
Applsci 10 07007 g006
Figure 7. Global environmental impacts by stage and type of industry.
Applsci 10 07007 g007
Figure 8. Carbon, water, and energy footprint of pineapples packed by main unit processes.
Applsci 10 07007 g008
Figure 9. The energy footprint of packed pineapple by main unit processes.
Applsci 10 07007 g009
Figure 10. Carbon, water, and energy footprint of pineapples in syrup by main unit processes.
Applsci 10 07007 g010
Figure 11. The energy footprint of pineapples in syrup by main unit processes.
Applsci 10 07007 g011
Figure 12. The carbon, water, and energy footprints of dehydrated pineapple by main unit processes.
Applsci 10 07007 g012
Figure 13. The energy footprint of dehydrated pineapple by the main processes.
Applsci 10 07007 g013
Figure 14. Transport sensitivity analysis for the carbon footprint category.
Applsci 10 07007 g014
Table 1. List of impact categories evaluated.
CategoryDescriptionUnit
Carbon footprint
(CF)
It accounts for the GHG emission, which is expressed in kg CO2 eq., emitted throughout the supply chain for a product or service. It takes into account the production of raw material, transport, and transformation, up to the final disposal of the waste generated. kg CO2 eq
Water footprint
(WF)
The category that quantifies the volume of water consumed in all stages of production to manufacture a product. It includes the source and use of “freshwater”, “green water”, and “gray water”.
It is represented according to the water resource available to the human population.
L
Energy footprint
(EF)
Energy consumed in obtaining raw materials, manufacturing, distribution, use, and end of life of the analyzed element. It includes the direct energy used, as well as indirect energy.MJ
Note: These methods are included in the SimaPro software (v. 8.4) used in the present study. Source: own elaboration with information from [29,30,31,32,33,34,35,36,37].
Table 2. Energy consumption for manufacturing supplies used in the product system.
SuppliesEnergy Consumption by Source (%)
CokeDieselFuel OilLP GasNatural GasBiomassElectricity
Cans21.710.310.220.00469.32-8.44
Cardboard-2.875.110.9068.18-22.94
Fertilizers and pesticides-12.87--25.73-61.40
Glue5.123.320.630.6776.43-13.83
Plastic and Wax-21.232.730.2057.59-18.25
Sugar-0.020.75--91.337.90
Source: own elaboration with information from [39,40,41,42,46,47,48].
Table 3. Representative values that characterize the generation of electrical power at the national level a.
Type of EnergyPFS (2018)NCV FactorPES bηPF cEPG
%%%GWh%
Natural gas15.6 × 109m338.13MJ/m340.4838.6566377937.27
Coal16.3 × 109kg19.43MJ/kg21.5932.6612868016.76
Fuel oil6.4 × 109L40.23MJ/L17.5337.6332689215.71
Diesel687.6 × 106L38.12MJ/L1.7931.31022791.33
Uranium47.4 × 103kg3.29GJ/g10.6331.577136457.97
Hydro-energy 7.9793.9403049617.82
Geothermal 7.7216.67352223.05
Wind 0.0399.6271220.07
Solar (photovoltaic) 0.00399.216120.007
Notes: a A factor of 17.7% of losses from the distribution in the electrical grid was included. b The total primary energy (TPE) was 1.46698 × 10¹² MJ. c The plant factor was initially used to correct the real fuel consumption for the effective operating time per electric power generation plant. Source: own elaboration with information from [39,40,41,42].
Table 4. Economic allocation applied to pineapple inflows to processing stages.
ProcessFlowQuantity, kgPrice, USD/kgFlow Value, USDAllocation
Q1 or Q2P1 or P2Q1 × P1 Q 1 × P 1 Q 1 × P 1 + Q 2 × P 2
Packed pineappleAccepted fruit1.000.230.230.968
Rejected fruit0.080.100.0080.032
Pineapples in syrupAccepted fruit1.230.170.210.970
Rejected fruit0.060.100.0060.030
Dehydrated pineappleAccepted fruit9.850.171.660.994
Rejected fruit0.100.100.0100.006
Source: own elaboration with information from [46,47].
Table 5. Foreground data collection from the main stages of the product system.
Agricultural Stage (FU: 1 kg of Fresh Pineapple)
Sub-StageMaterialQuantityUnit
Nursery maintenanceWater1.94 × 10−1L
Transport3.82 × 10kgkm
NPK4.09 × 10−4kg
Pesticides7.06 × 10−5kg
Land preparationDiesel2.86 × 10−6kg
Machinery7.01 × 10−6kg
Plastic1.79 × 10−2kg
SowingWater1.47 × 10−2L
Transport9.88 × 10−1kgkm
Pesticides9.82 × 10−5kg
Plant growthWater8.08 × 10L
Diesel6.32 × 10−7kg
Transport8.82 × 102kgkm
Machinery4.45 × 10−6kg
NPK6.91 × 10−2kg
Pesticides1.70 × 10−3kg
Plastic3.34 × 10−3kg
Steel1.79 × 10−3kg
Industrial Stage (FU: 1 kg of Packed Pineapple)
Sub-StageMaterialQuantityUnit
PackagingCardboard8.04 × 10−2kg
Electric energy 8.09 × 10⁻³kWh
Wax5.51 × 10−4kg
Water1.67 × 10−1L
Industrial Stage (FU: 1 kg of in Syrup Pineapple)
In syrupCans1.78 × 10−1kg
Fuel oil3.17MJ
Electric energy5.91 × 10−3kWh
Sugar1.43 × 10−2kg
Water4.55 × 10−1L
Glue1.05 × 10−3kg
Industrial Stage (FU: 1 kg of Dehydrated Pineapple)
DehydratedWater1.25 × 10−1L
Electric energy6.73 × 10−2kWh
Plastic bags2.72 × 10−3kg
L.P. Gas4.56MJ
Table 6. Environmental impacts per impact category.
CFWFEF
kg CO2 eqLMJ
Agriculture stage (1 kg of fresh pineapple)0.4778.609.09
Packaging (1 kg of packed pineapple)0.5882.2811.03
In Syrup (1 kg of in syrup pineapple)1.12103.1919.28
Dehydrated (1 kg of dehydrated pineapple)5.12782.6697.04
Note: Packaging, In Syrup and Dehydrated processes, included environmental impact from the agriculture stage.

