Article

Biometrics Verification Modality Using Multi-Channel sEMG Wearable Bracelet

1
College of Engineering and Technology, American University of the Middle East, Al-Eqaila 54200, Kuwait
2
Image, Signal and Intelligent System Laboratory (LISSI, EA 3956), Université Paris-Est Créteil (UPEC), 94400 Vitry sur Seine, France
*
Author to whom correspondence should be addressed.
Appl. Sci. 2020, 10(19), 6960; https://doi.org/10.3390/app10196960
Submission received: 4 September 2020 / Revised: 25 September 2020 / Accepted: 1 October 2020 / Published: 5 October 2020

Abstract

:
Electrical biosignals have the potential for use as biometric authenticators, owing to their ability to facilitate liveness detection and concealed nature. In this work, the viability of using surface electromyogram (sEMG) as a biometric modality for users verification is investigated. A database of multi-channel sEMG signals is created using a wearable armband from able-bodied users. Each user used his/her muscles to form a password that consists of a unique combination of specific hand gestures. A total of 18 features are extracted from the signals in order to distinguish between the users. Several features are extracted in the frequency domain after estimating the power spectral density while using the Welch’s method. Specifically, average frequency, signal power, median frequency, Kurtosis, Deciles, coefficient of dissymmetry, and the peak frequency of the sEMG signal are considered. To further increase the accuracy of the classifier, time domain features are also extracted through segmentation of the signal into 10 segments, and then calculating both the root mean square and length of the signal. Several classifiers that are based on K-nearest Neighbors (KNN), Linear Discernment Analysis (LDA), and Ensemble of Classifiers are constructed, trained, and statistically compared, resulting in an average accuracy in 97.4%, 98.3%, and 98.5%, respectively. False acceptance rate (FAR) and False Rejection Rate (FRR) are estimated for each classifier in order to determine the effectiveness of the biometrics verification system. Although the ensemble classifier accuracy was found to be the highest, the results show that the KNN classifier exhibits a FAR of 0.2% and FRR of 2.9%. Thus, the KNN classifier was found to he the optimum classifier after the extraction of all 18 features. This work demonstrates the usefulness of sEMG as a biometric authenticator in user verification.

1. Introduction

Wearable electronic devices have found significant applications in both the research and commercial operations of biometrics and biomedical engineering over the past decades [1]. The expanding use of wearable devices and their popularity is leading to novel approaches that enhance the different ways humans interact with their environment, smart devices, and each other [2,3]. The key advantage of wearables utilizing a wide variety of sensors is their ability to capture the user’s physiological and behavioural data, which can be subsequently used for biometric systems in order to verify the individual’s identity. Traditional biometrics of identification/authentication include identifier (ID), password (PW), and/or ownership-based ID card methods. The user has a risk of forgetting the password or user name or might lose the ownership-based ID card [4,5]. However, this risk is fully eliminated with wearable biometrics.
Biometrics systems are based on recognizing user’s data by using either unique physical or behavioral features of the user. The physical features include fingerprint, face recognition, and eye (iris) scan. While, the behavioral ones include gait recognition, voice recognition, Electrocardiography (ECG), Electromyography (EMG), and electroencephalogram (EEG) [6,7].
Although biometric technology has seen significant advances, some biometric systems fail to meet security and robustness requirements in certain real-world situations. By way of an example, the susceptibility to to spoofing—persons who pretend to be others for the purpose of obtaining illegal accesses to private information or services [8,9]. The study and prevention of spoofing is considered to be an active area of research and development.
As wearable devices, utilizing sEMG can capture the detailed characteristics of the human muscles and, thus, it is useful in human gesture recognition applications. The information extracted from sEMG signals obtained via a human arm is sufficient for classifying intended hand gestures [10]. The primary objective of this work is to demonstrate the utilization of the sEMG multi-channel wearable armband in authenticating the identity of individuals with the application of Machine learning algorithms.
Previous studies using ECG/EMG sensors fusion to authenticate the identity of the users can be found in [11]. Belgacem et al. [12] studied the usefulness of a biometric system utilizing information that was obtained via both ECG and EMG physiological data. A non-intrusive one-lead ECG setup was adapted into the palm of the user to collect ECG biometric data. Subsequently, the authors used Fourier descriptors for feature extraction. Finally, an optimum-path forest classifier was used in order to distinguish between individuals.
Siho Shin et al. [13] proposed a non-contact secure private authentication that is based on an EMG signals. A total of fifty signals were extracted from the arm of subjects with the assistance of a two channel electrode system. A set of metrics, such as the mean, length, variation, zero crossing, and median frequency, were extracted from the signals to enhance the identification rate and formulate a machine learning algorithm. The Artificial Neural Network (ANN) algorithm showed a relatively high accuracy of 81.6%. Holi et al. [14] used vector quantization and Gaussian mixture model in order to obtain the EMG signals for use in biometric applications. The identification rate of 97.9% was achieved with an average of 73.33% obtained from 49 individuals. The aforementioned experiment demonstrated that EMG signals alone can produce user distinguishable biometric data. Al-Mulla et al. [15] presented a novel pseudo-wavelet function for mechanomyographic (MMG) signal extraction during dynamic fatiguing contractions. A bio-impedance analysis (BIA) wrist band has been used to identify users with an eight-electrode installed. The success rate with BIA was 85% and, by adding a circumference with 1 mm accuracy, the authors improved their result up to 90%. Hisaaki Yamaba et al. [16] presented a method that uses a list of gestures as a password for EMG user authentication system for mobile phones access. Fourier transform was used to extract the features from the EMG signals. James Cannan et al. [17] presented a method for improving EMG utilization, which was based on biometrically identifying a specific user. The experiments were performed to identify small group sizes of four, 10, and 19. An average identification accuracy across all 11 gestures was found to be 55.32%, 75.44%, and 90.32%, for groups of 19, 10, and four subjects, respectively. Ryohei Shioji et. al. [18] used eight dry sensors to measure EMG from the wrist and carry out a personal authentication approach. A convolutional neural network (CNN) was used in the learning phase for authentication. The data collected by the authors were from eight individuals over a four-day period resulting in a total of 960 data captures. The average accuracy of the two-class separation was 94.9% by CNN [18].
The development and optimization of sEMG feature extraction and classification for the purpose of controlling prostheses or use in biometric applications is an active area of research, even though the analysis performed is mainly from a machine learning perspective [19,20,21]. Feature extraction involves the production of specific data structures from the raw data after eliminating noise and stressing important signal features. In general, features extraction can occur in the time domain, frequency domain, or the combined time-frequency domain [22]. The steps in analyzing the EMG signals have been proposed by Sakshi Sharma et al. [23].
Initially, the surface EMG signal is obtained from the user’s forearm while using discrete wavelet transform. Subsequently, singular value decomposition is used for feature extraction. Furthermore, fuzzy logic classifiers are used to recognize the different hand gestures in the context of linguistic terms. Zainal Arief et al. [24] compared five feature extractions from an eight channel EMG signal that was obtained while using a wearable bracelet located on the forearm muscles resulting in significant differences in hand gestures. The time series features extraction that were evaluated by the authors were mean absolute value (MAV), willison amplitude (WAMP), variance (VAR), zero crossing (ZC), and waveform length (WL). MAV and WL are found to offer better recognition rate. Chantaf et al. [25] acquired EMG signals from BIOPAC system. Subsequently, seven frequency domain features were extracted and then classified using a radial basis function (RBF) network. The average accuracy was 80%. Yamaba et.al. [26] proposed a method that uses a unique combination of gestures as a password. The author’s demonstrated the similarities and differences between the patterns and behaviours of the gestures obtained from different subjects [26]. To identify pass-gestures, four features were extracted in the time domain, including the maximum and minimum value of unprocessed s-EMG data and their corresponding time-min and time-max. Support vector machine (SVM) classifiers of each user were trained on separating these four features, where cross validation was performed using the same raw data.
This paper proposes biometrics authentication system for user’s verification. The biometric identity studied in this research is based on the EMG signal. The biometric device used to acquire the sEMG signal is a wearable multi-channel armband consisting of eight electrodes. A total of 56 users were enrolled in the biometric system. The users enrolled trained to use the sEMG biometric system prior to data collection. A total of 18 features were extracted from the signals to distinguish between users. Seven frequency domain features and eleven-time domain features were analyzed. Initially, the power spectral density (PSD) of each channel was estimated using the periodogram function implementing Welch’s method. Subsequently, average frequency, kurtosis, the power of signal, median frequency, coefficient of dissymmetry, deciles, and peak frequency of PSD were calculated as frequency domain features. Furthermore, the length or duration of data is calculated as a new feature through dividing the signal into 10 equal length segments and calculating the root mean squre (RMS) of each segment. The K-nearest neighbors (kNN), linear discriminant analysis classifier (LDA), and ensemble of classifier have been applied to optimize the results of the system. The system will grant/deny access to the user from the captured sEMG biometrics identity as a signature that is based on hand gestures. Performance analysis of the biometrics system has been presented to validate the capacity of the system by estimating both the false acceptance rate (FAR) and the false rejection rate (FRR). The results presented in this paper showed that the KNN classifier exhibits a testing accuracy of 97.4% with a FAR of 0.2% and an FRR of 2.9%. Thus, the KNN classifier was found to be the optimum classifier after the extraction of all 18 features. This work demonstrates the usefulness of sEMG as a biometric authenticator in user verification.

2. Methodology

Usually in biometrics systems, the users should initially enroll themselves in the system by means of recording raw biometric imformation to the system. This process is called Enrolment and it consists of three different phases: Capture, Process, and Enroll [27].
In the capture phase, raw EMG signals are acquired by a wearable eight-channel EMG armband. In the processing stage, features that are unique for each user and used to distinguish enrolled users from each other are extracted from the raw sEMG signals and they form a biometric signature specified for each user. This process is done into two phases, the first one is signal preprocessing and the second one is features extraction. In the Enroll phase, the processed template is stored as a database in the hard disk, SD Card, or any other storage device for later comparisons.
Once Enrolment phase is done, the users can be authenticated by the system by matching their signature with the stored template [28]. The authentication process is defined as the process in which new biometric information is recorded by the individual who is being authenticated by the system. The system can then compare the enrolled biometric template to recognize the user. There are two types of users Authentication systems, Verification and Identification. Verification is used to match the recorded biometric sample against the enrolled data that are saved and stored in advance and require the user to claim of his/her identity, such as a unique key or card or user name [29]. On the other hand, the Identification aims to recognize users from their biometric features.
Figure 1 shows the schematic chart illustrating the two distinct paths involved in the proposed biometrics system. The first path is to enroll the users in the system and train the data, which is called the training phase. sEMG gestures that form a password of each user are used to create a database. Features are extracted from the recorded sEMG signals of users, and machine learning protocols are applied to these signals in order to characterize the signals that are required to form the identify of the users. The second path is to verify the identity of the user by comparing and matching the identity of the enrolled users with the saved database. The system should grant/deny access of the users based on a defined threshold.

3. Multi-Channel Wearable Armband

Different wearable smart systems that contain sensors exist in the market for acquiring a wide range of bio-signals, such as: EEG, EMG, ECG, and EDA [30]. Myo armband applies the concept of Human Computer Interaction (HCI). It is a wearable bracelet that is mainly used for applications where humans should interact with computers and systems interactively. The wearable bracelet consists of eight dry sEMG (electromyography) electrodes. Myo is equipped with Inertial Measurement Unit (IMU) [31]. With the smart design of the multi-channel wearable bracelet, users can wear it on their forearm, just below their elbow. Myo has different application in detecting several hand gestures and movements that are used to create sEMG databases. A combination of hand gestures can be used by the users to form a biometric password. The detected gestures are reflected on the screen to give users a feedback on the data acquisition time. With the eight different sEMG electrodes of Myo, this enables more accurate authentication system due to more infomation of sEMG signals of the enrolled users in the authentication system.

4. EMG Signal

EMG signals capture the electric potential movements created by the muscles, which always have a potential difference when the muscles are electrically or neurologically contracted. At least one pair of electrodes is required to acquire the signal. To simultaneously capture the activities of multiple muscles, an array of multiple electrodes is used [32,33]. Two kinds of EMG signals exist, surface EMG (sEMG) and intramuscular EMG (imEMG) signals. sEMG signals acquired using Myo bracelet are used in this research. sEMG signals are captured by recording muscle activities from the skin surface. imEMG signals are captured from the muscle tissue that is acquired by percutaneous wire needle electrodes inserted into muscle with a single surface reference electrode on the skin. When compared with imEMG, sEMG is much easier to capture and it is non-invasive. In this research, sEMG signals are captured from the forearm muscle on the hand as a biometric information for user authentication using multi-channel Myo bracelet. Figure 2 shows the raw sEMG signals captured by Myo armband while the user is doing three hand gestures without any signal processing technique applied to the signals. The sEMG sensors of the armband are numbered from one to eight to be able to match the signals with the forearm muscles. The signals are represented in time domain with the amplitude of the signal on y-axis and the samples on the x-axis.

5. Database

The database of sEMG signal is collected from different volunteers for diversity purposes. All of the volunteers are able-bodied with no health issues. Each user recorded the signals at multiple sessions of the same biometric identity to allow for genuine attempts. The Myo bracelet was used to gather the data of users sEMG signals that forms a password. Each user has been asked to select three gestures out of four gestures and arrange them in a way to form a password using hand actions. A database of fifty-six participants has been collected (twenty-four males and thirty-two females with ages ranging from 16 to 62 years). The first step is to connect the armband wirelessly to the PC. Then, A software is developed to connect the Myo armband to the PC and visualize the data during data acquisition phase. The recorded data are stored into a matrix data format. The features are extracted from the collected database. The extracted features are used to train and test the offline classifiers using numerical tools. There are three different phases data collection, data processing, and feature extraction [34,35].
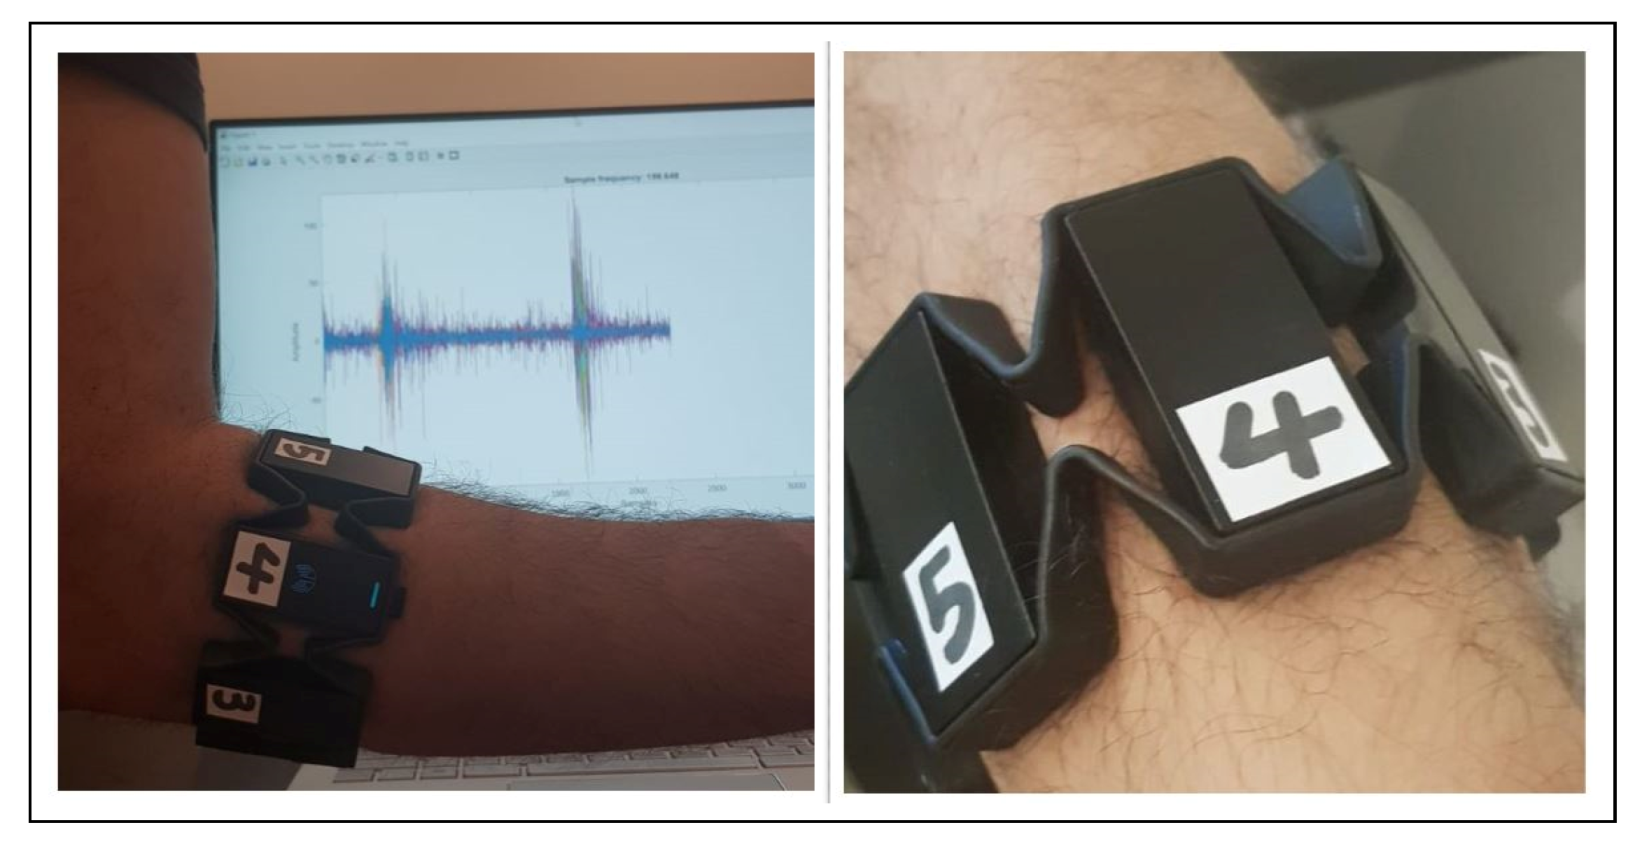
To ensure that the data collected from the users are consistent, a set of instructions are prepared to apply them for all users as a data collection protocol. The users were instructed to adjust their elbow joint at an angle of 90 during the data acquisition. Each volunteer collected the dataset that forms the biometrics password in several sessions in order to ensure that the user can perform the same pattern that consists of a combination of hand gestures. One of the most important instructions is that the Myo bracelet has to be attached at the same position on the forearm of all users, with sensor number 4 placed on brachioradialis muscle, as shown in Figure 3. The users have the option to select three gestures from four hand gestures (Fist the hand, open the fingers, Wave-out, and wave-in). The users were instructed to adjust their hand to the resting position initially and then perform one of the proposed combination of hand gestures that forms a biometric password of this user. Subsequently, return the hand back to the initial resting position. The time-elapsed for hand gestures action is around nine seconds. Each particular user has to set a user name that will be used for log in and it is case sensitive. All of the users received a training session prior to the signature acquisition. For each user enrolled in the system, twenty tests following the protocol have been acquired. The characteristics of the database have a significant impact on the outcome of the evaluation. The amount of data available that could be used to characterize the features being compared is what determines the adequacy of the biometrics performance later on.
All of the users gave their informed consent for inclusion prior to their participation in this experimental study. The research was conducted in accordance with the Declaration of Helsinki, and the protocol was approved by the Ethics Committee with reference (F190916-02). The training phase of the system consists of creating training set for each user, feature extraction, and training of classifiers. There are users with 20 tests for each user. In total of 1120 tests, each test contains eight signals as a multi-channel wearable armband used to acquire EMG signals. A single binary-class classifier is trained for each user, resulting in two class outputs (access granted, or access rejected) and 56 models have been created, one classifier model for each enrolled user. As a random choice, 70% of the data of each user was selected for the training phase, which leads to 14 signals for granted class and 770 signals for rejected class, making the data highly unbalanced. Under-sampling is performed in order to overcome this problem. This results in 14 signal being randomly selected for the granted class and to create rejected class, one signal from each user (except valid user) is selected for rejected class. As a consequence, 14 signals are captured for the granted class and 55 signals for the rejected class.

6. Features Extraction

In the feature extraction process, the size of the raw data was reduced to be able to input these parameters to the Machine Learning (ML) classification model. In general, sEMG data contain important and irrelevant information. The irrelevant information should be discarded to reduce the dimensionality of the features vector by mapping sEMG data to another space. This step is important for extracting the main features from the data of each user that aid in distinguishing between the enrolled users [36,37].
The calculation of the Power Spectral Density (PSD) of the sEMG signal is important, since it is calculated by using the relevant parameters that are used for the authentication of users. The PSD depicts the density of a signal with reference to the frequency. The main purpose of spectral density calculation is to capture the spectral density of sEMG signal from a series of time samples. There are two different techniques used in the estimation of PSD, parametric, and non-parametric. The estimated PSD is calculated directly from the signal in the Nonparametric techniques. The most known simple method is called periodogram. In periodogram method, discrete-time Fourier transform of sampled signal is calculated first, and then the magnitude squared of the result is calculated [38]. In this research, the PSD is estimated by periodogram applying Welch’s method, as in [39]. The power of the sEMG signal is estimated against frequency in order to reduce the noise. The signal is converted from time domain to frequency domain using periodograms [40].
After estimating the PSD of sEMG signals of the constructed database, different frequncy domain features are extracted for the purpose of feeding the classifier with the feature vector for the verification of individuals in the proposed biometrics verification system. These parameters are Kurtosis, signal power, deciles, median frequency, frequency peak and dissymmetry coefficient and frequency peak.
The selected features characterize the sEMG signal to be able to differentiate between the users data stored in the database. The power of a signal represents the distribution of energy along the signal. The average frequency is used to calculate the average of the signal in frequency domain. The kurtosis measure of the combined weight of a distribution’s tails relative to the center of the distribution. The median frequency is calculated in order to divide the PSD into two sections, 50% of data are less than the median and 50% are greater This can be generalized, so that the segments of the distribution can be four, ten, or n segments. These calculated parameters are called quartiles, deciles, percentiles, or quantiles. The coefficient of dissymmetry offers information pertaining to the profile of the PSD from the prespective of symmetry. The peak frequency is the frequency at the maximum of the PSD.
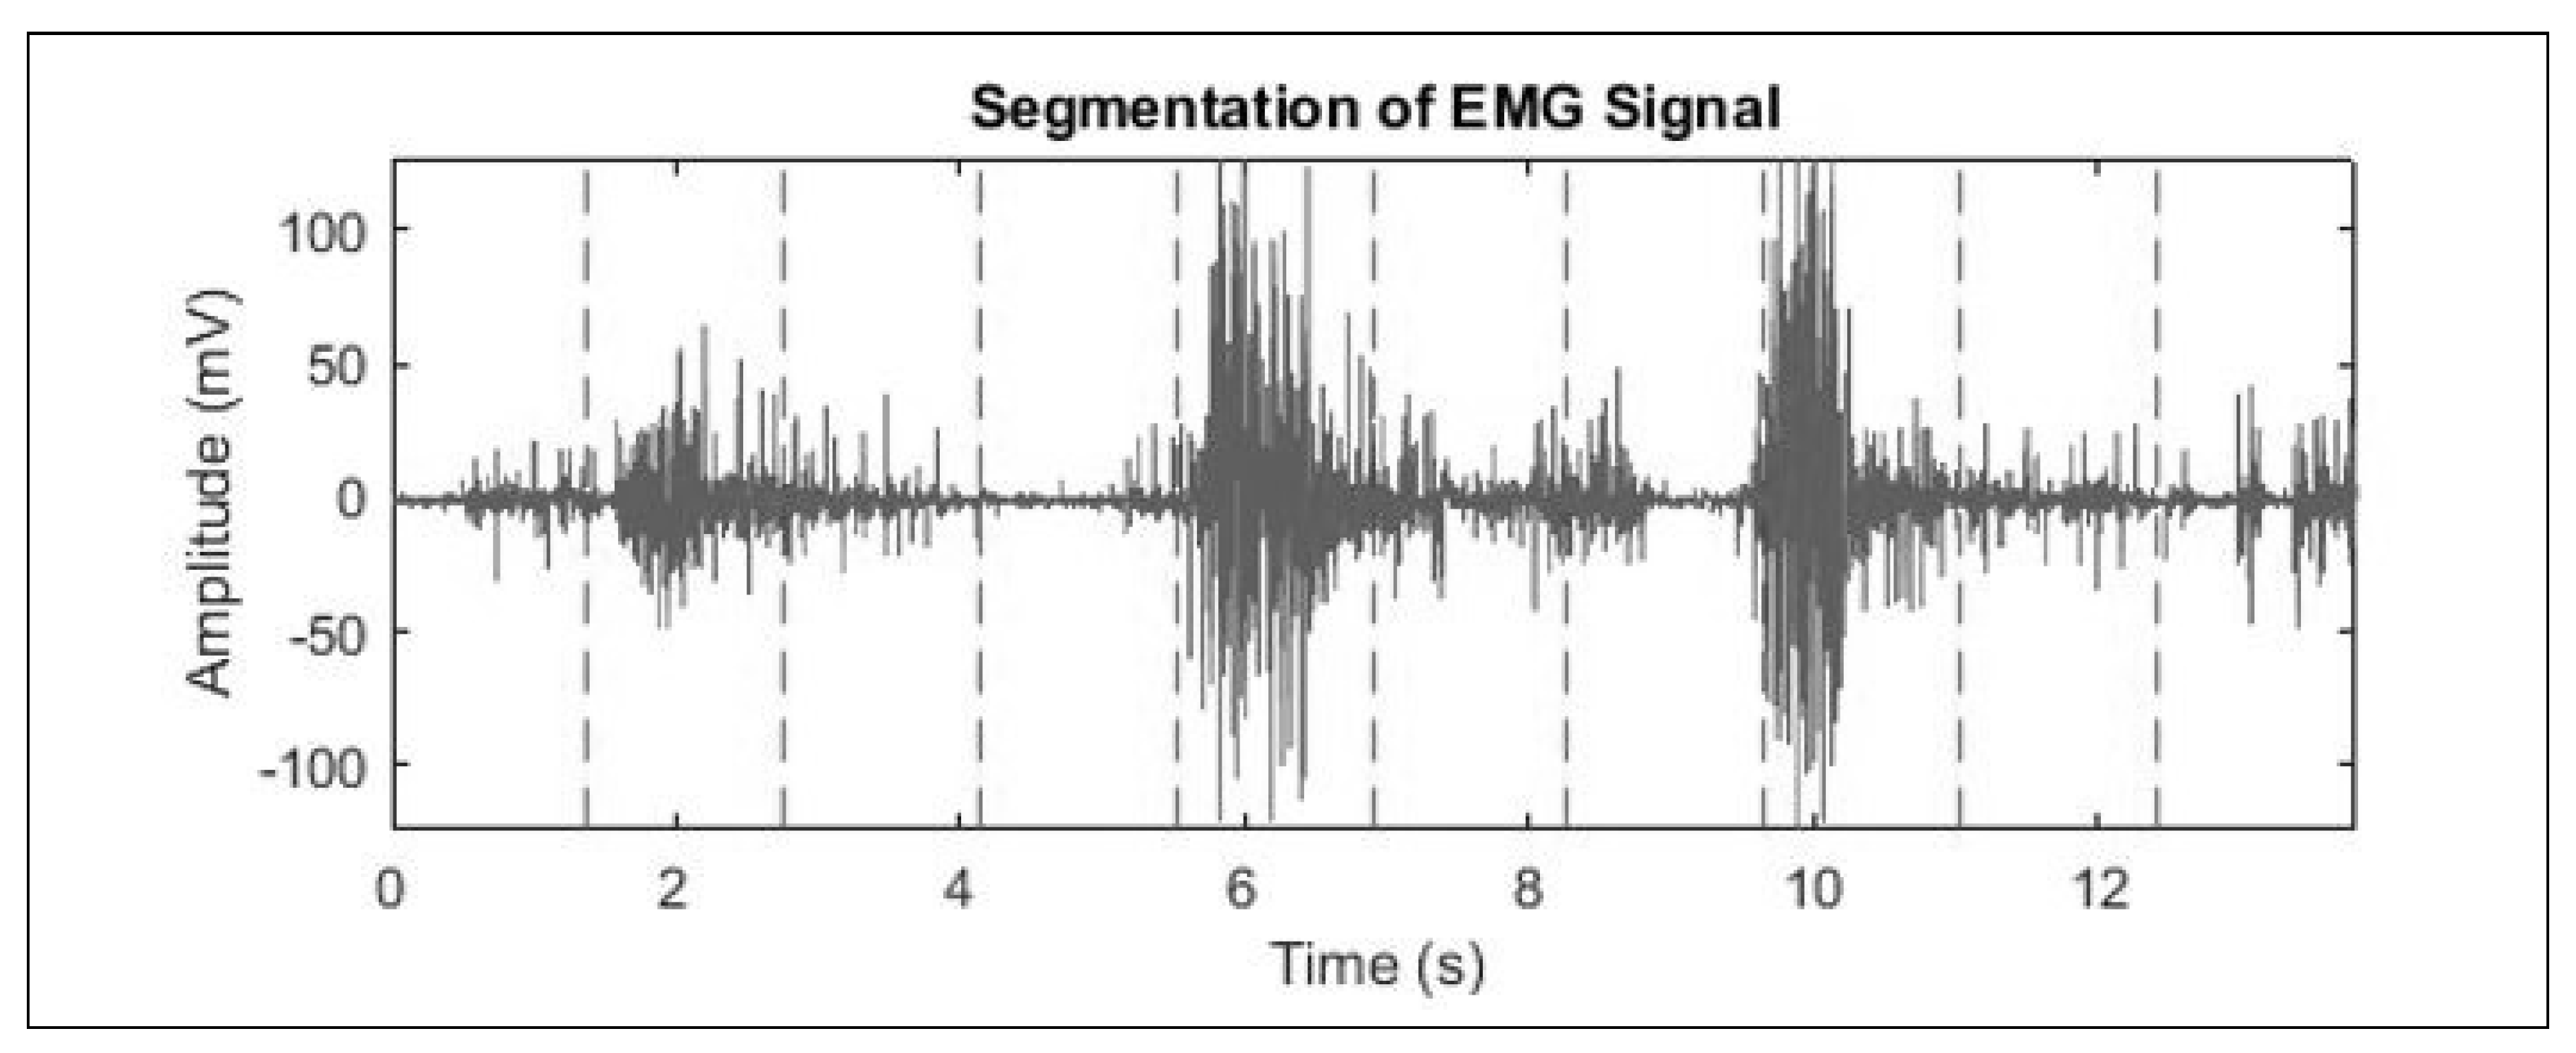
These features are called frequency domain features of the sEMG signal. Time domain features were also calculated for better accuracy in classification. These include length or duration of data and the root mean square (RMS) of each segment of the time domain signal. In this study, the EMG signal was segmented into 10 equal lengths. as shown in Figure 4.
The features extracted from sEMG signals are summarized and listed in Table 1.

7. Machine Learning Models

Machine-learning models are widely used in biometrics verification system based on wearable technology systems. The result of machine-learning algorithms executed by the matching unit is a numerical value that estimate the similarity degree between the input signal and a registered user in the system. After obtaining this result, a threshold value is usually set in order sto determine the final decision of the biometrics system either access granted or access denied [2]. False acceptance rate (FAR) and false rejection rate (FRR) are considered to be the main biometrics performance analysis parameters used to estimate the accuracy of the system. For optimization, three classifiers, k-nearest neighbors (kNN), linear discriminant analysis classifier (LDA), and ensemble of classifier or boosted trees, were used to train these dataset and obtain the best model.

7.1. k-Nearest Neighbors

The KNN classifier model follows the concept of classification of unknown instances can be accomplished by referencing the unknown to the known based on a metric of similarity [41]. The instances labeled unknown are offered the same class label as their nearest known neighbor. In this work, the Minkowski distance method has been used in KNN algorithm applications. The Minkowski distance is a technique for measuring the distance that is based on Euclidean space, as defined by
d s t = i = 1 n x s j y t j p p
if the Minkowski distance parameter p = 1, the Minkowski metric measures the city block distance, p = 2, if the Minkowski metric output the Euclidean distance, and p = inf , the Minkowski metric that is indicated the Chebychev distance.

7.2. Linear Discriminant Analysis (LDA)

Linear discriminant analysis (LDA) classifier has been extensively used in sEMG pattern recognition for bionic arm control [42]. In the LDA classifier, a group of higher dimensional features are separated into classes and they serve as input to the classifier. Subsequently, a projection that optimizes the mapping between the raw features and a lower-dimensional phase space is found, while maintaining the same class structure. As a consequence, the within-class distances are minimized, while the between-class distances are maximized, achieving a maximized discrimination facility. Mathematically, this optimized projection is estimated by applying eigen value decomposition on the training data scatter matrices.
LDA depends on the Bayes classification rule, in which states that, for a given vector x, assign it to the class c k when the following inequality is satisfied
p ( c k x ) > p ( c j x ) f o r   a l l   k j
These posterior probabilities cannot be directly measured, but they can be obtained from estimates of the priori probabilities and the distribution of the class according to the Bayes formula:
p ( c k x ) = p ( c k ) p ( x c k ) p ( x )
Where p ( c k x ) is the probability density function for the vector within k class, p ( c k ) is the prior probability for class k and is usually assumed to be equal for all classes, p ( x ) is the probability density function of the input space and it is also constant over all of the classes. Subsequently, the decision rule can be simplified to:
p ( x c k ) > p ( x c j )   f o r   a l l   k j
In the implementation of LDA classifier, the probability density functions for all of the classes are assumed to follow a multivariate Gaussian distribution.
p ( x c k ) = 1 ( 2 π ) f d e t ? ( C ) e x p ( 1 2 ( x μ k ) T C 1 ( x μ k ) )
where x is the vector to be classified, f is the dimension of the vector, C is the common covariance matrix of all the classes, k and μ k are the mean value of class k.

7.3. Ensemble Classifier (Gentle AdaBoost Algorithm)

In collective classifiers, more than one singular classifier is applied together in order to improve the overall classification performance. Algorithms, like support vector machines, decision trees, Naive Bayes method, linear separators, and artificial neural networks (ANN), are extensively used as single classifiers [28]. Boosting technique is a method of machine learning aims to construct a strong classifier from a mix of weak classifiers. Further details on the description and implementation of the boosting techniques can be found in [43,44,45,46].
Adaboost chooses a parameter α t that measures the importance that is assigned to h t . For this, a coefficient α t is calculated as:
α t = 1 2 l n ( 1 ϵ t ϵ t )
The final hypothesis H computes the sign of weighted combination of weak hypotheses:
H ( x ) = s i g n ( t = 1 T α t h t ( x ) )
A weak classifier should satisfy two conditions; it should do better than random guessing and it should have enough computational power to learn a problem.

8. Results

The three classifiers are trained and tested following the offline procedure. The main aim of applying three classifier models is to select the model that is best suited for biometrics user verification. A total of 30% of the collected database was allocated for testing. As the system is designed to be used for user’s verification, the user should input the user name first and then the user should enter the biometrics identity.
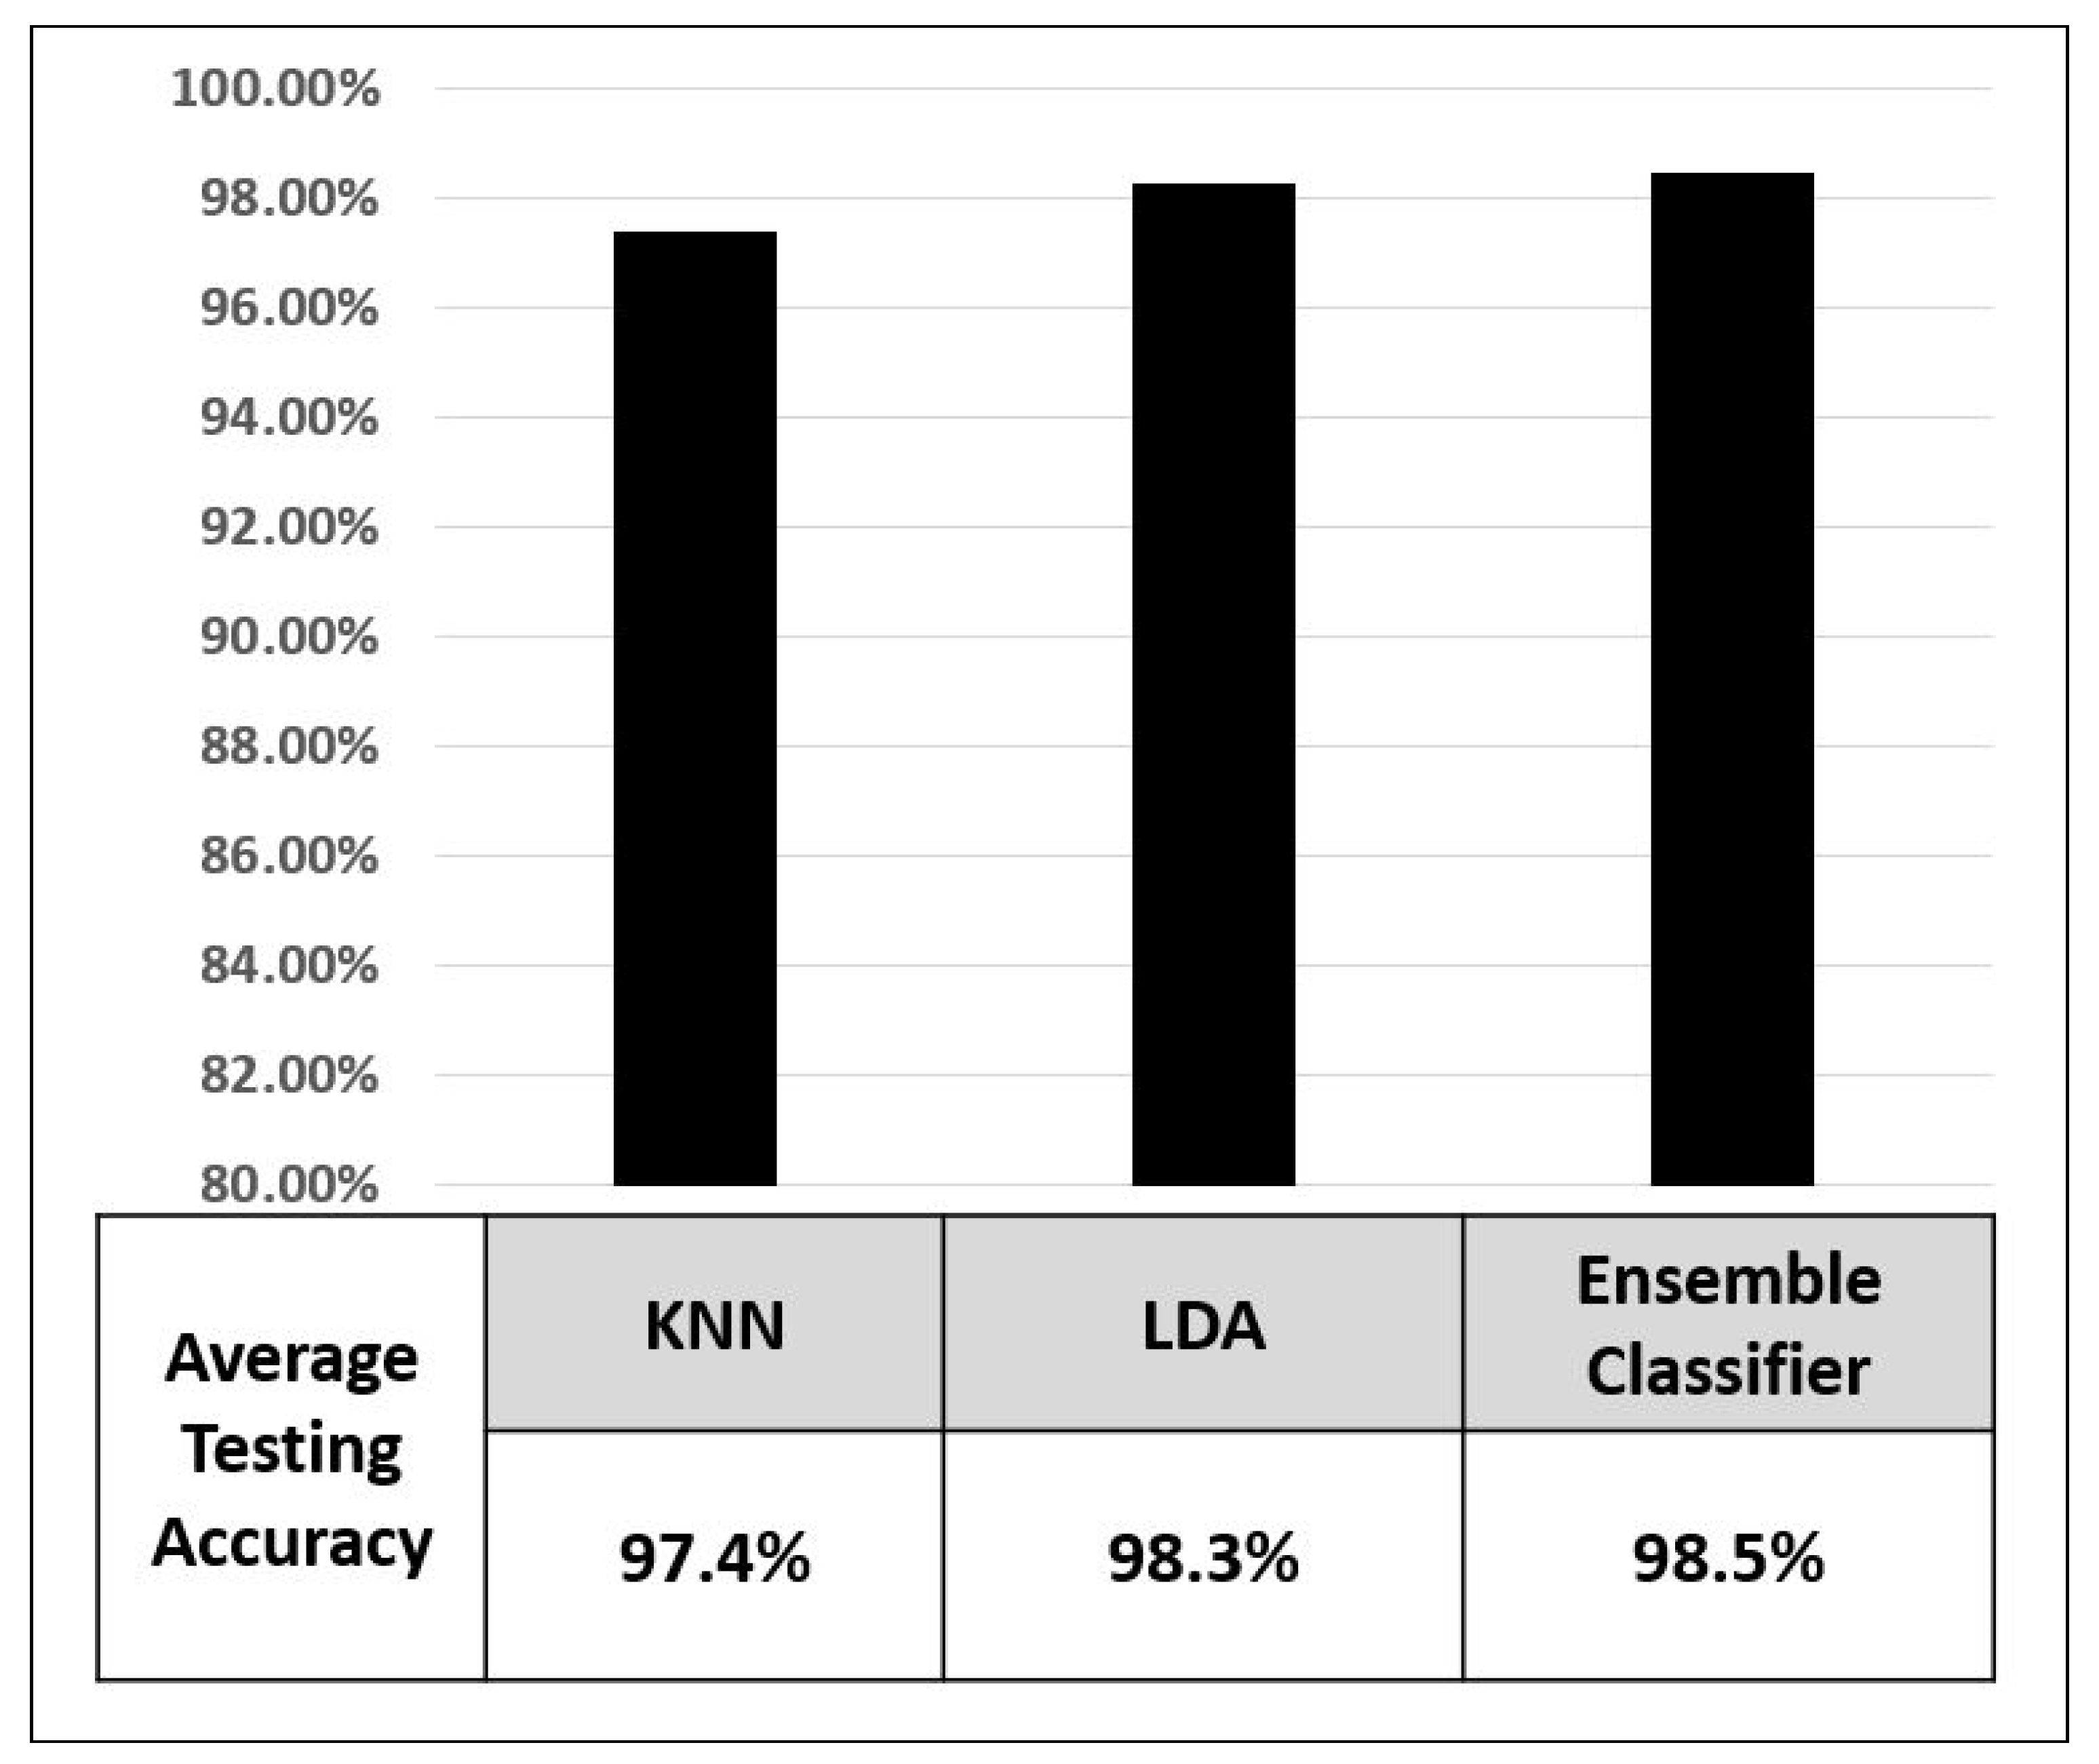
A cross-validation process is performed in order to select the parameters values for each of the three classifier applied in this research. The same dataset is used to train and test each classifier. Table 2 shows the selected parameter for each classifier used in the training and testing of the data. The best model for each classifier type of the three classifiers was selected based on its accuracy results. The testing results are statistically studied and compared to find the best classifier model (KNN, LDA, and Ensemble classifier). The average testing accuracy is calculated as an average of thirty trials. The Ensemble classifier algorithm produced the highest testing accuracy of 98.5%. The LDA classifier provided a testing accuracy equal to 98.3%. Furthermore, the KNN classifier provided a mean value of the testing accuracy equal to 97.4%. Figure 5 presents the results.
For performance analysis of the system, the accuracy, false acceptance rate (FAR), and false rejection rate (FRR) for each case are calculated. The FAR gives the percentage of accepted unauthorized users attempted to spoof the system. A system’s FAR typically is stated as the ratio of the number of false acceptances divided by the number of verification attempts.
The FRR on the opposite side provides the percentage of rejected attempts of authorized users tried to access the system. A system’s FRR is calculated as the ratio of the number of false recognitions divided by the number of verification attempts. For biometrics verification applications, the registered users need to declare their identity, which is a user name in this particular application, along with the biometric identifier. The authentication system then compares the input identity with the stored template in a database of various claimed identities to confirm or deny the authenticity claims [47]. As such, the verification mode is a binary classification. The performance of the verification system is evaluated by both FAR and FRR.
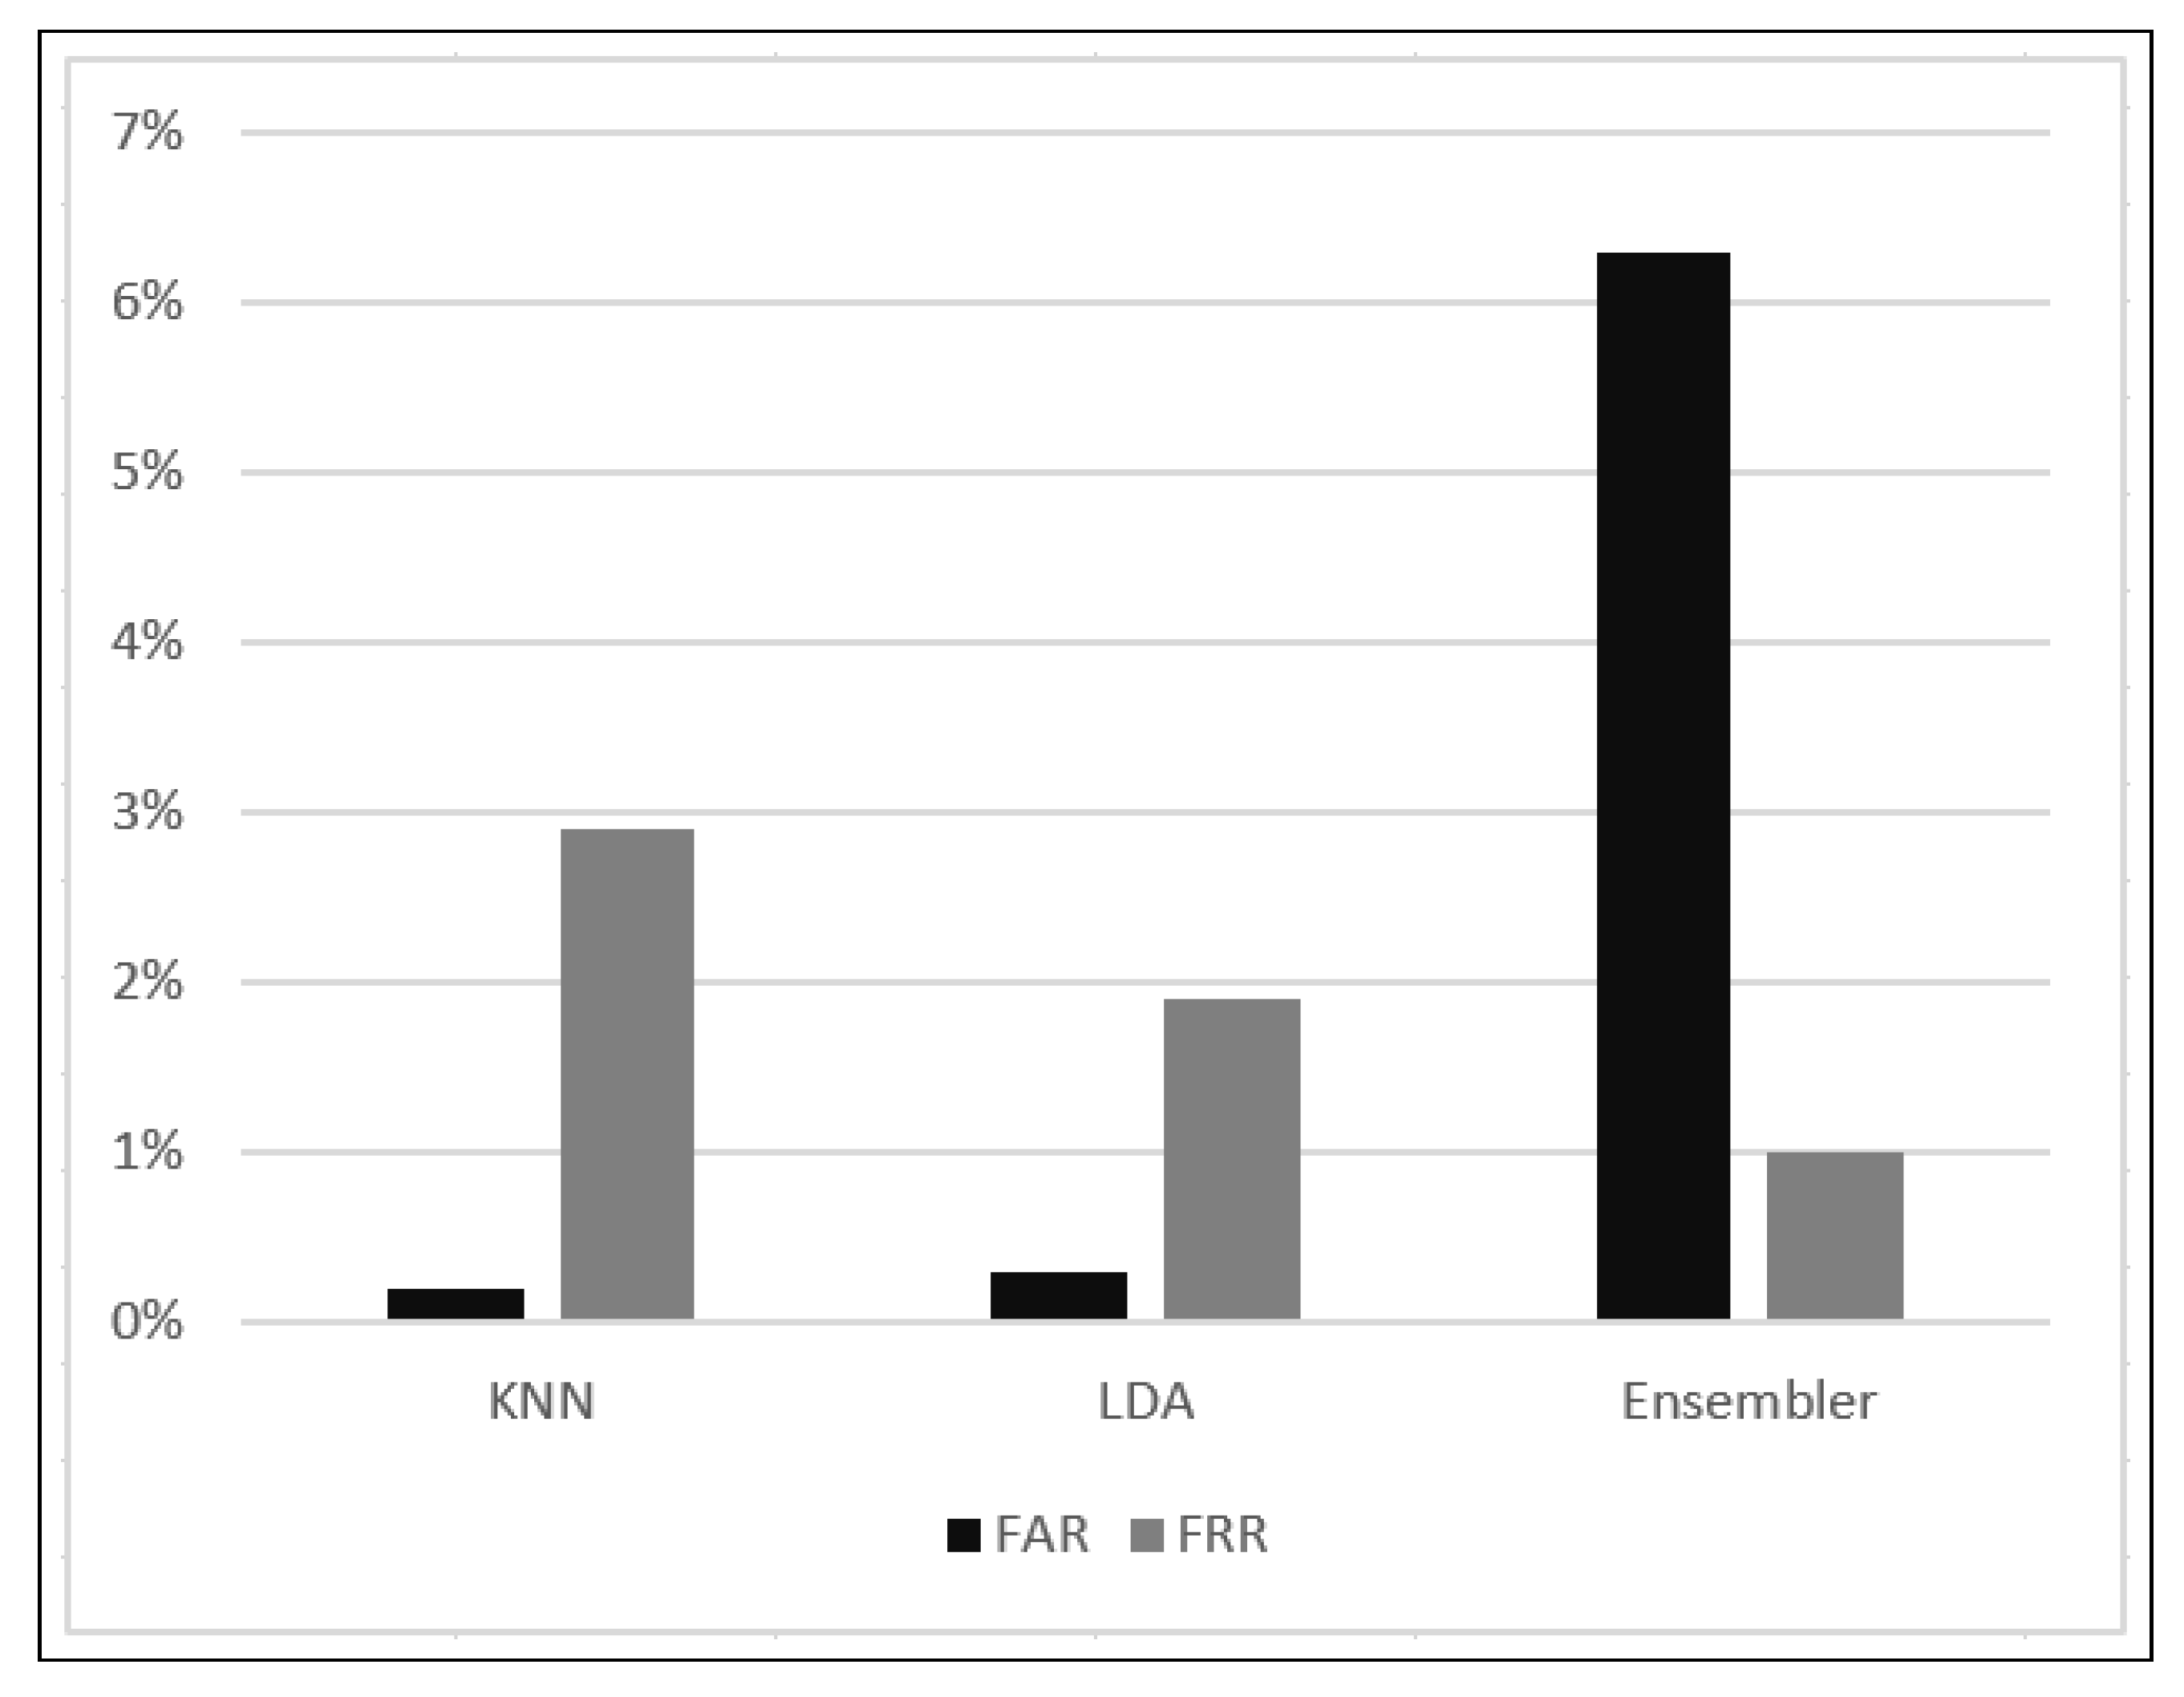
The values of FAR and FRR are calculated in all verification scenarios and for each type of classifiers presented in this research. For the KNN classifier, the average value of FAR is 0.2%, which inticates that none of the users are able to access any other user even by mimicking the hand actions and the FRR is 2.9% which means out of 100 user, 2.9 users were not able to access the system due to a deviation in the hand actions that represents the password of their own. For the LDA classifier, the FAR is 0.3% and FRR is 1.9%. While, applying the Ensemble Classifier resulted in FAR of 6.3% and FRR of 1%. Figure 6 shows the FAR and FRR of the three classifiers.
Although the ensemble classifier was found to exhibit the highest accuracy within all three classifiers, the KNN classifier, on the other-hand, offered at FAR of 0.2% and FRR of 2.9%. This makes the KNN is the better suited algorithm to be used in the verification biometrics system that is presented in this paper.

9. Conclusions

The performance of sEMG signals as a biometric modality for user verification is investigated. The users were able to perform a custom-set gesture code. The resulting sEMG signals were captured and proceed as form of hidden biometric identity. The results indicated that the custom-set gesture code definitely improves the verification performance. The set of frequency and time domain features extracted in this study allowed for improved classifier accuracy. The KNN classifier was found to be optimum with an average accuracy of 97.4%. The FAR and FRR of the results obtained by KNN classifer are 0.2% and 2.9%, respectively.

Author Contributions

Conceptualization, S.S. and A.N.-a.; methodology, S.S.; software, S.S.; validation, S.S. & A.N.-a.; formal analysis, S.A.; investigation, S.S.; resources, S.S & T.B.; data curation, S.S and T.B.; writing—original draft preparation, S.S & A.S.K.; writing—review and editing, A.S.K. and A.N.-a.; supervision A.N.-a. and S.A. All authors have read and agreed to the published version of the manuscript.

Funding

This research received no external funding.

Acknowledgments

The authors would like to acknowledge the support of the Robotics Research Center at the American University of the Middle East.

Conflicts of Interest

The authors declare no conflict of interest.

References

  1. Enzo, V.; Scilingo, P. Recent Advances on Wearable Electronics and embedded computing systems for biomedical applications. Electronics 2017, 6, 12. [Google Scholar]
  2. Blasco, J.; Chen, T.; Tapiador, M.; Peris-Lopez, P. A survey of wearable biometric recognition systems. ACM Comput. Surv. 2016, 49, 1–35. [Google Scholar] [CrossRef]
  3. Said, S.; Al Kork, S.; Nait-Ali, A. Wearable Technologies in Biomedical and Biometric Applications. In Biometrics under Biomedical Considerations; Springer: Singapore, 2019; pp. 211–227. [Google Scholar]
  4. Kim, J.; Pan, S. A Study on EMG-based Biometrics. J. Internet Serv. Inf. Secur. (JISIS) 2017, 7, 19–31. [Google Scholar]
  5. Zhang, R.; Zhang, N.; Du, C.; Lou, W.; Hou, Y.; Kawamoto, T. Shoulder-surfing resistant authentication for augmented reality. In Proceedings of the International Conference on Communications (ICC), Paris, France, 21–25 May 2017; pp. 1–6. [Google Scholar]
  6. Moon, K. Biometrics technology status and prospects. Internet Serv. Inf. Secur. 2005, 98, 38–47. [Google Scholar]
  7. Bailey, K.; Okolica, J.; Peterson, G. User identification and authentication using multi-modal behavioral biometrics. Comput. Secur. 2014, 43, 77–89. [Google Scholar] [CrossRef]
  8. Hadid, A.; Evans, N.; Marcel, S.; Fierrez, J. Biometrics Systems Under Spoofing Attack. IEEE Signal Process. Mag. 2015, 32, 20–30. [Google Scholar] [CrossRef] [Green Version]
  9. Evans, N. Handbook of Biometric Anti-Spoofing: Presentation Attack Detection; Springer: Berlin/Heidelberg, Germany, 2019. [Google Scholar]
  10. Saponas, T.; Tan, S.; Morris, D.; Balakrishnan, R. Demonstrating the feasibility of using forearm electromyography for muscle–computer interfaces. In Proceedings of the 26th SIGCHI Conference on Human Factors in Computing Systems, Florence, Italy, 5–10 April 2008. [Google Scholar]
  11. Faragó, P.; Groza, R.; Ivanciu, L.; Hintea, S. A Correlation-based Biometric Identification Technique for ECG, PPG and EMG. In Proceedings of the 42nd International Conference on Telecommunications and Signal Processing (TSP), Budapest, Hungary, 3–5 July 2019. [Google Scholar]
  12. Belgacem, N.; Fournier, R.; Nait-Ali, A.; Bereksi-Reguig, F. A novel biometric authentication approach using ECG and EMG signals. J. Med. Eng. Technol. 2015, 39, 226–238. [Google Scholar] [CrossRef]
  13. Shin, S.; Jung, J.; Kim, Y. A study of an EMG-based authentication algorithm using an artificial neural network. In Proceedings of the IEEE SENSORS, Glasgow, UK, 29 October–1 November 2017. [Google Scholar]
  14. Krishnamohan, P.; Holi, M. GMM modeling of person information from EMG signals. In Proceedings of the IEEE Recent Advances in Intelligent Computational Systems, Gerona, Spain, 11–15 July 2017. [Google Scholar]
  15. Al-Mulla, M.; Sepulveda, F. Novel Pseudo-Wavelet function for MMG signal extraction during dynamic fatiguing contractions. Sensors 2014, 14, 9489–9504. [Google Scholar] [CrossRef] [Green Version]
  16. Yamaba, H.; Kurogi, A.; Kubota, S.; Katayama, T.; Park, M.; Okazaki, N. Evaluation of feature values of surface electromyograms for user authentication on mobile devices. Artif. Life Robot. 2017, 22, 108–112. [Google Scholar] [CrossRef]
  17. Cannan, J.; Hu, H. Automatic user identification by using forearm biometrics. In Proceedings of the IEEE/ASME International Conference on Advanced Intelligent Mechatronics, Wollongong, Australia, 9–12 July 2013. [Google Scholar]
  18. Shioji, R.; Ito, S.; Ito, M.; Fukumi, M. Personal authentication based on wrist EMG analysis by a convolutional neural network. In Proceedings of the 5th IIAE International Conference on Intelligent Systems and Image Processing, Waikiki, HI, USA, 7–12 September 2017. [Google Scholar]
  19. Benatti, S.; Milosevic, B.; Farella, E.; Gruppioni, E.; Benini, L. A prosthetic hand body area controller based on efficient pattern recognition control strategies. Sensors 2017, 17, 869. [Google Scholar] [CrossRef] [Green Version]
  20. Englehart, K.; Hudgins, B. A robust, real-time control scheme for multifunction myoelectric control. IEEE Trans. Biomed. Eng. 2003, 50, 848–854. [Google Scholar] [CrossRef] [PubMed]
  21. Englehart, K.; Hudgins, B.; Parker, P.; Stevenson, M. Classification of the myoelectric signal using time-frequency based representations. Med Eng. Phys. 1999, 21, 431–438. [Google Scholar] [CrossRef]
  22. Zecca, M.; Micera, S.; Carrozza, M.; Dario, P. Control of multifunctional prosthetic hands by processing the electromyographic signal. Crit. Rev. Biomed. Eng. 2002, 30, 4–6. [Google Scholar] [CrossRef] [PubMed] [Green Version]
  23. Sharma, S.; Farooq, H.; Chahal, N. Feature extraction and classification of surface EMG signals for robotic hand simulation. Commun. Appl. Electron. (CAE) 2016, 4, 27–31. [Google Scholar] [CrossRef]
  24. Arief, Z.; Sulistijono, I.; Ardiansyah, R. Comparison of five time series EMG features extractions using Myo Armband. In Proceedings of the International Electronics Symposium (IES), Surabaya, Indonesia, 29–30 September 2015; pp. 11–14. [Google Scholar]
  25. Chantaf, S.; Naït-Ali, A.; Karasinski, P.; Khalil, M. ECG modelling using wavelet networks: Application to biometrics. Int. J. Biom. 2010, 2, 236–249. [Google Scholar] [CrossRef]
  26. Yamaba, H.; Kurogi, T.; Aburada, K.; Kubota, S.; Katayama, T.; Park, M.; Okazaki, N. On applying support vector machines to a user authentication method using surface electromyogram signals. Artif. Life Robot. 2018, 23, 87–93. [Google Scholar] [CrossRef]
  27. Dantcheva, A.; Velardo, C.; D’angelo, A.; Dugelay, J. Bag of soft biometrics for person identification. Multimed. Tools Appl. 2011, 51, 739–777. [Google Scholar] [CrossRef]
  28. Soutar, C.; Roberge, D.; Stoianov, A.; Gilroy, R.; Kumar, B. Biometric Encryption: Enrollment and verification procedures. Int. Soc. Opt. Photonics 1998, 3386, 24–35. [Google Scholar]
  29. Yamaba, H.; Nagatomo, S.; Aburada, K.; Kubota, S.; Katayama, T.; Park, M.; Okazaki, N. An Authentication Method Independent of Tap Operation on the Touchscreen of a Mobile Device. J. Robot. Netw. Artif. Life 2015, 2, 60–63. [Google Scholar] [CrossRef] [Green Version]
  30. Said, S.; Alkork, S.; Beyrouthy, T.; Fayek, M. Wearable Bio-Sensors Bracelet for Driver’s Health Emergency. In Proceedings of the 2nd International conference on Bio-engineering for Smart Technlogied (Biosmart), Paris, France, 30 August–1 September 2017. [Google Scholar]
  31. Rawat, S.; Vats, S. Evaluating and exploring the MYO ARMBAND. In Proceedings of the International Conference System Modeling & Advancement in Research Trends (SMART), Moradabad, India, 25–27 November 2016. [Google Scholar]
  32. Qingqing, L.; Penghui, D.; Zheng, J. Enhancing the Security of Pattern Unlock with Surface EMG-Based Biometrics. Appl. Sci. 2020, 10, 541. [Google Scholar]
  33. Robertson, D.; Caldwell, G.; Hamill, J.; Kamen, G. Whittlesey, S. Research Methods in Biomechanics; Human Kinetics: Champaign, IL, USA, 2014. [Google Scholar]
  34. Said, S.; Boulkaibet, I.; Sheikh, M.; Karar, A.S.; Alkork, S.; Nait-ali, A. Machine-Learning-Based Muscle Control of a 3D-Printed Bionic Arm. Sensors 2020, 20, 3144. [Google Scholar] [CrossRef] [PubMed]
  35. Barioul, R.; Ghribi, S.F.; Kanoun, O. A low cost signal acquisition board design for myopathy’s EMG database construction. In Proceedings of the 13th International Multi-Conference on Systems, Signals & Devices (SSD), Leipzig, Germany, 21–24 March 2016; pp. 274–279. [Google Scholar]
  36. Akhmadeev, K.; Houssein, A.; Moussaoui, S.; Høgestøl, E.A.; Tutturen, I.; Harbo, D.; Laplaud, H.F.; Gourraud, P.A. SVM-based tool to detect patients with multiple sclerosis using a commercial EMG sensor. In Proceedings of the 2018 IEEE 10th Sensor Array and Multichannel Signal Processing Workshop (SAM), Sheffield, UK, 8–11 July 2018. [Google Scholar]
  37. Chantaf, S.; Makni, L.; Nait-ali, A. Single Channel Surface EMG Based Biometrics. In Hidden Biometrics; Springer: Singapore, 2020; pp. 71–90. [Google Scholar]
  38. Kay, S. Modern Spectral Estimation: Theory and Application; Pearson Education India: Delhi, India, 1998. [Google Scholar]
  39. Proakis, J. Digital Signal Processing: Principles Algorithms and Applications; Pearson Education India: Delhi, India, 2001. [Google Scholar]
  40. Barbé, K.; Pintelon, R.; Schoukens, J. Welch method revisited: Nonparametric power spectrum estimation via circular overlap. IEEE Trans. Signal Process. 2009, 58, 553–555. [Google Scholar] [CrossRef]
  41. Paul, Y.; Goyal, V.; Jaswal, R. Comparative analysis between SVM & KNN classifier for EMG signal classification on elementary time domain features. In Proceedings of the 4th International Conference on Signal Processing, Computing and Control (ISPCC), Solan, India, 21–23 September 2017. [Google Scholar]
  42. Zhang, H.; Zhao, Y.; Yao, F.; Xu, L.; Shang, P.; Li, G. An adaptation strategy of using LDA classifier for EMG pattern recognition. In Proceedings of the 35th Annual International Conference of the IEEE Engineering in Medicine and Biology Society (EMBC), Osaka, Japan, 3–7 July 2013. [Google Scholar]
  43. Freund, Y.; Schapire, R. A desicion-theoretic generalization of on-line learning and an application to boosting. In Proceedings of the European Conference on Computational Learning Theory, Barcelona, Spain, 13–15 March 1995. [Google Scholar]
  44. Freund, Y.; Schapire, R.; Abe, N. A short introduction to boosting. J. Jpn. Soc. Artif. Intell. 1999, 14, 771–780. [Google Scholar]
  45. Friedman, J.; Hastie, T.; Tibshirani, R. Additive logistic regression: A statistical view of boosting. Ann. Stat. 2000, 28, 337–374. [Google Scholar] [CrossRef]
  46. Mekhalfa, F.; Nacereddine, N. Gentle Adaboost algorithm for weld defect classification. In Proceedings of the Signal Processing: Algorithms, Architectures, Arrangements, and Applications (SPA), Poznan, Poland, 20–22 September 2017; pp. 301–306. [Google Scholar]
  47. He, J.; Jiang, N. Biometric From Surface Electromyogram (sEMG): Feasibility of User Verification and Identification Based on Gesture Recognition. Front. Bioeng. Biotechnol. 2020, 8, 58. [Google Scholar] [CrossRef] [PubMed]
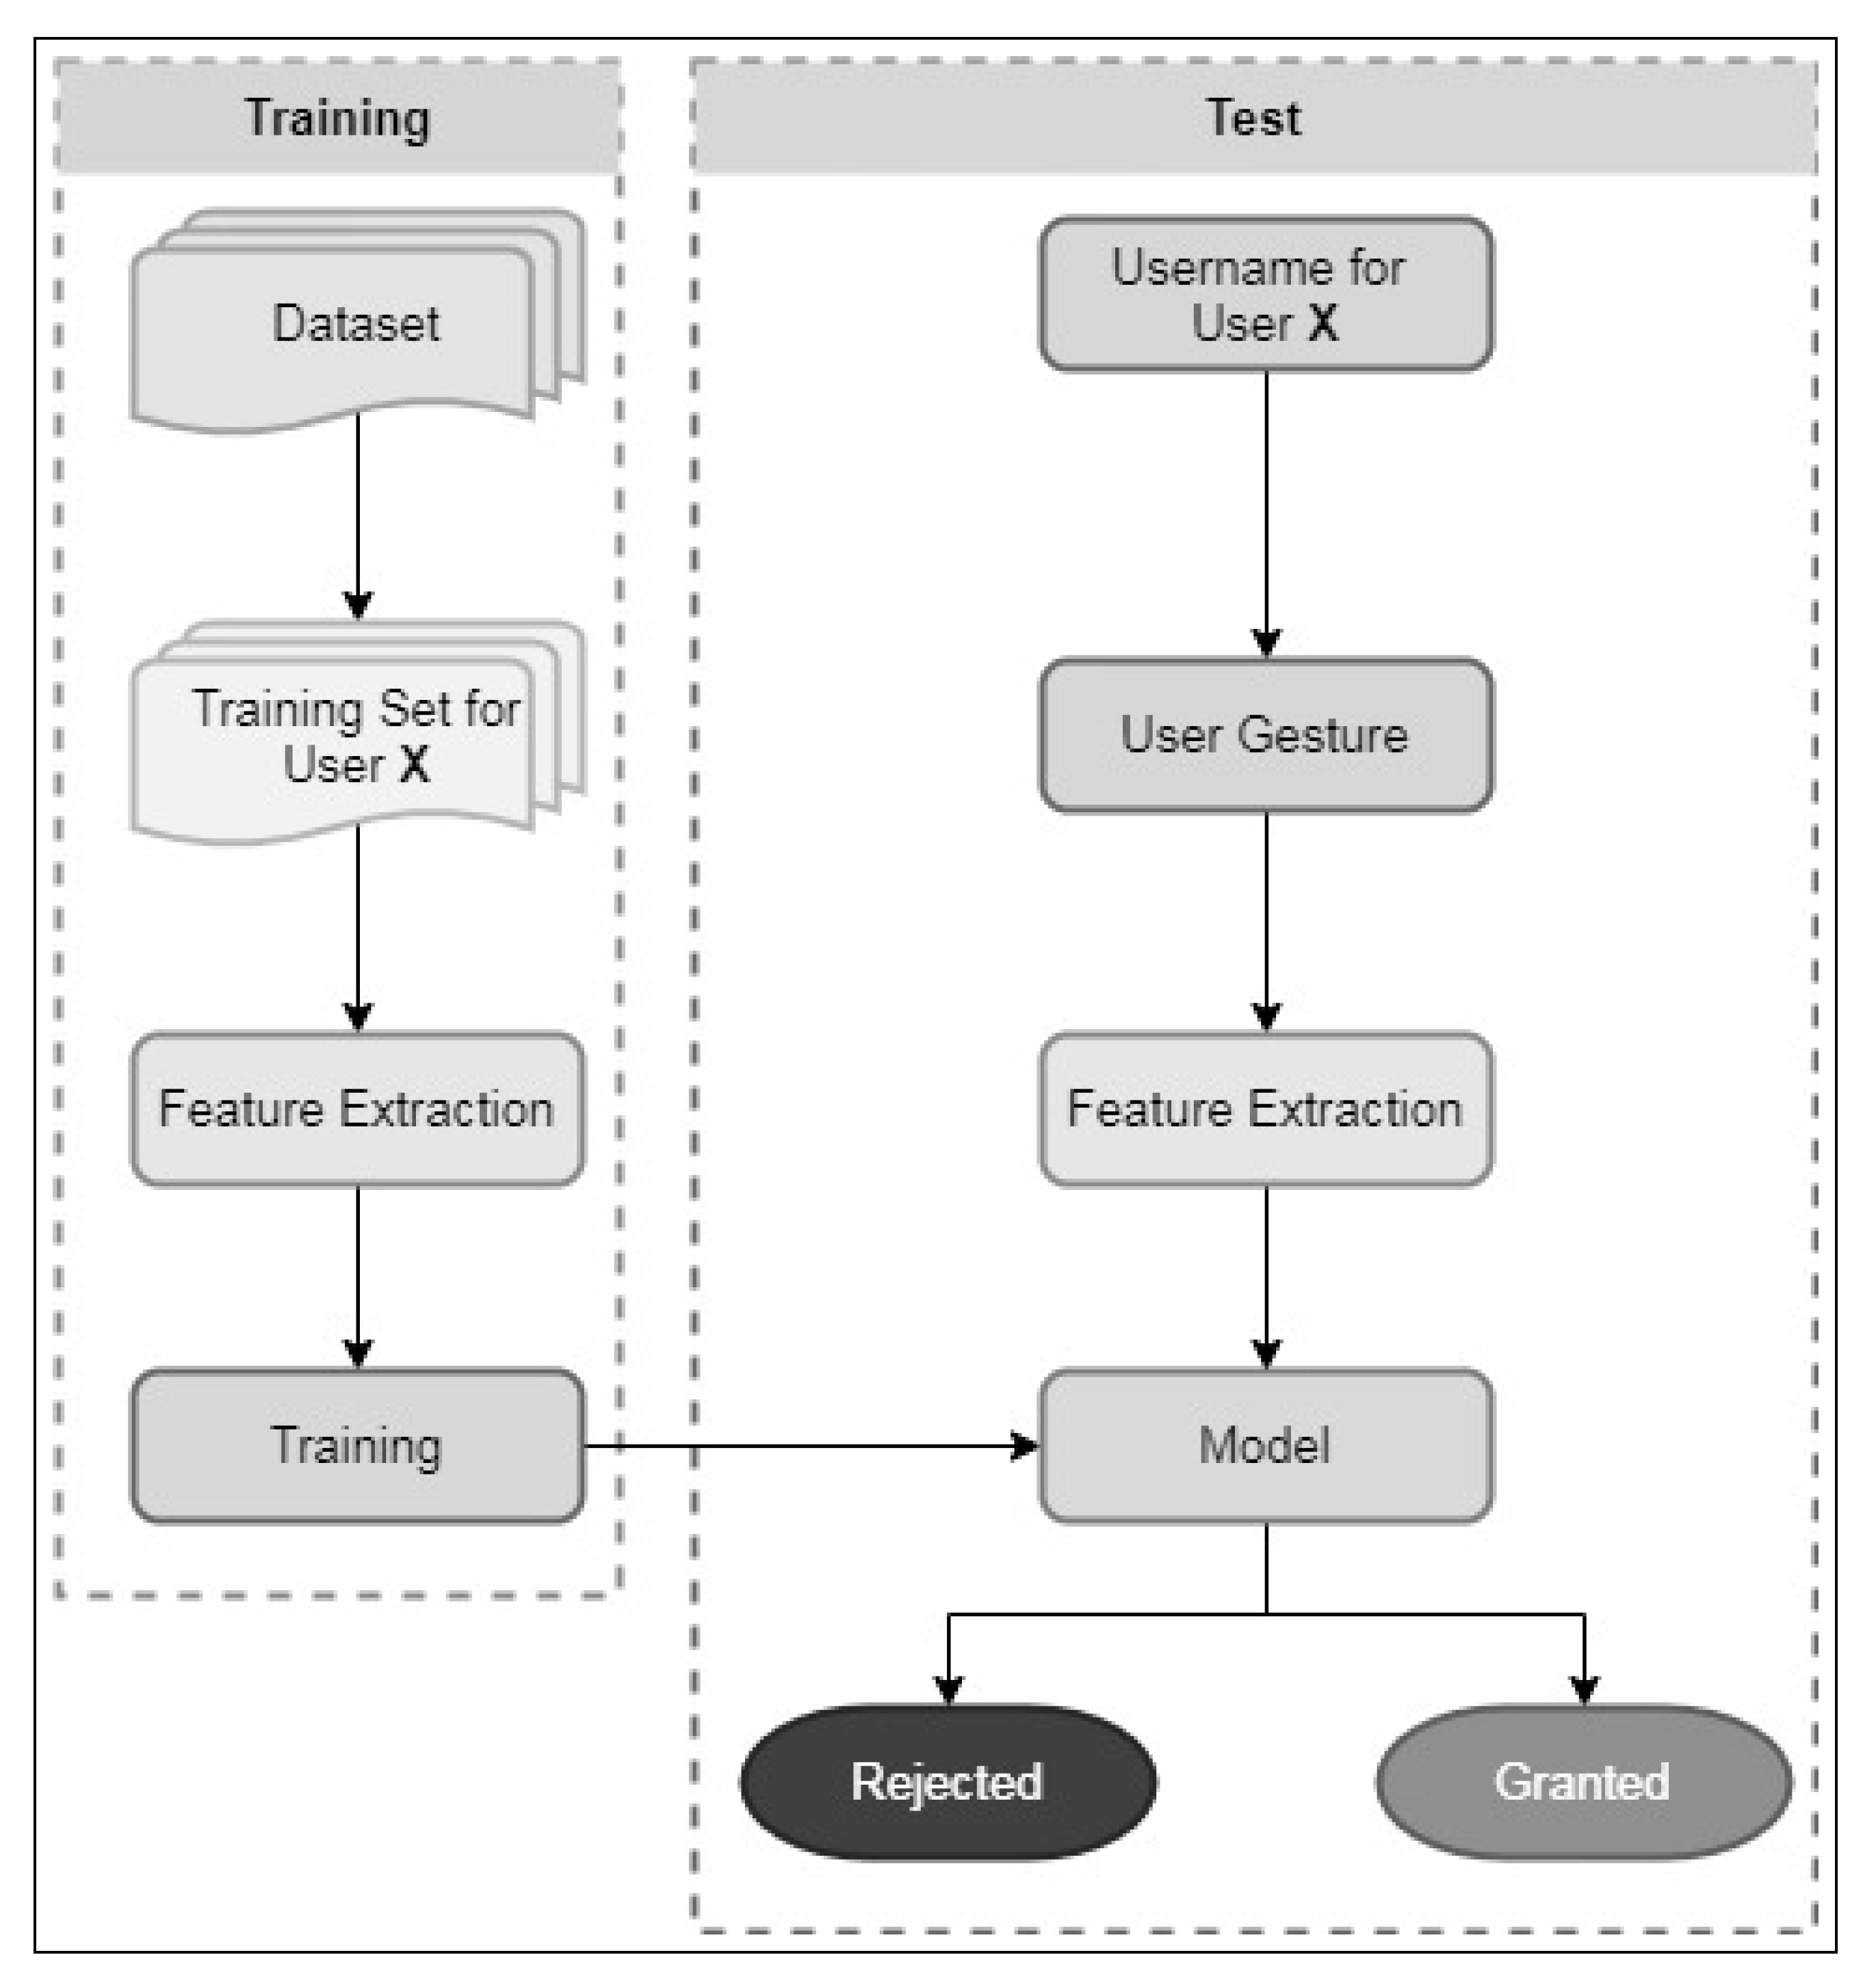
Figure 1. EMG verification system schematic chart.
Applsci 10 06960 g001
Figure 2. Raw time domain surface electromyogram (sEMG) signals.
Applsci 10 06960 g002
Figure 3. Acquisition of sEMG data of a user to create the database (Enrolment).
Applsci 10 06960 g003
Figure 4. Segmentation of Electromyography (EMG) signal.
Applsci 10 06960 g004
Figure 5. Average Testing Accuracy.
Applsci 10 06960 g005
Figure 6. False acceptance rate (FAR) and false rejection rate (FRR) of the three classifiers.
Applsci 10 06960 g006
Table 1. Summary of the Extracted features.
Frequency-Domain FeaturesTime-Domain Features
KurtosisLength of the signal
Signal PowerRoot Mean Square of each segment of the signal
Deciles,
Median frequency
Frequency peak
Dissymmetry coefficient
Frequency Peak
Table 2. Selected parameters for the classifiers.
k-Nearest Neighbors
Number of neighbors2
Distance metricMinkowski
Distance WeightInverse
Exponent0.57
Linear Discriminant Analysis
Delta0.01
Gamma0.7
Discriminant TypePseudoLinear
Ensemble Classifier
Weak LearnerDecision Tree
MethodGentleBoost
Number of Learning Cycles11
Learning Rate0.95
Minimum Leaf Size22
Maximum number of Split1