The Derivation of Defect Priorities and Core Defects through Impact Relationship Analysis between Embedded Software Defects


Abstract
1. Introduction
2. Materials and Methods
2.1. Content Analysis
2.2. DEMATEL Method
2.2.1. Step 1: Deriving the Direct Relation Matrix (DRM)
2.2.2. Step 2: Normalizing the Matrix
2.2.3. Step 3: Calculating for the Total Relation Matrix (TRM, T)
2.2.4. Step 4: Separating the Influencing (Cause) Elements and the Influenced (Effect) Elements
2.2.5. Step 5: Calculating the Threshold
2.2.6. Step 6: Drawing the Cause and Effect Diagram
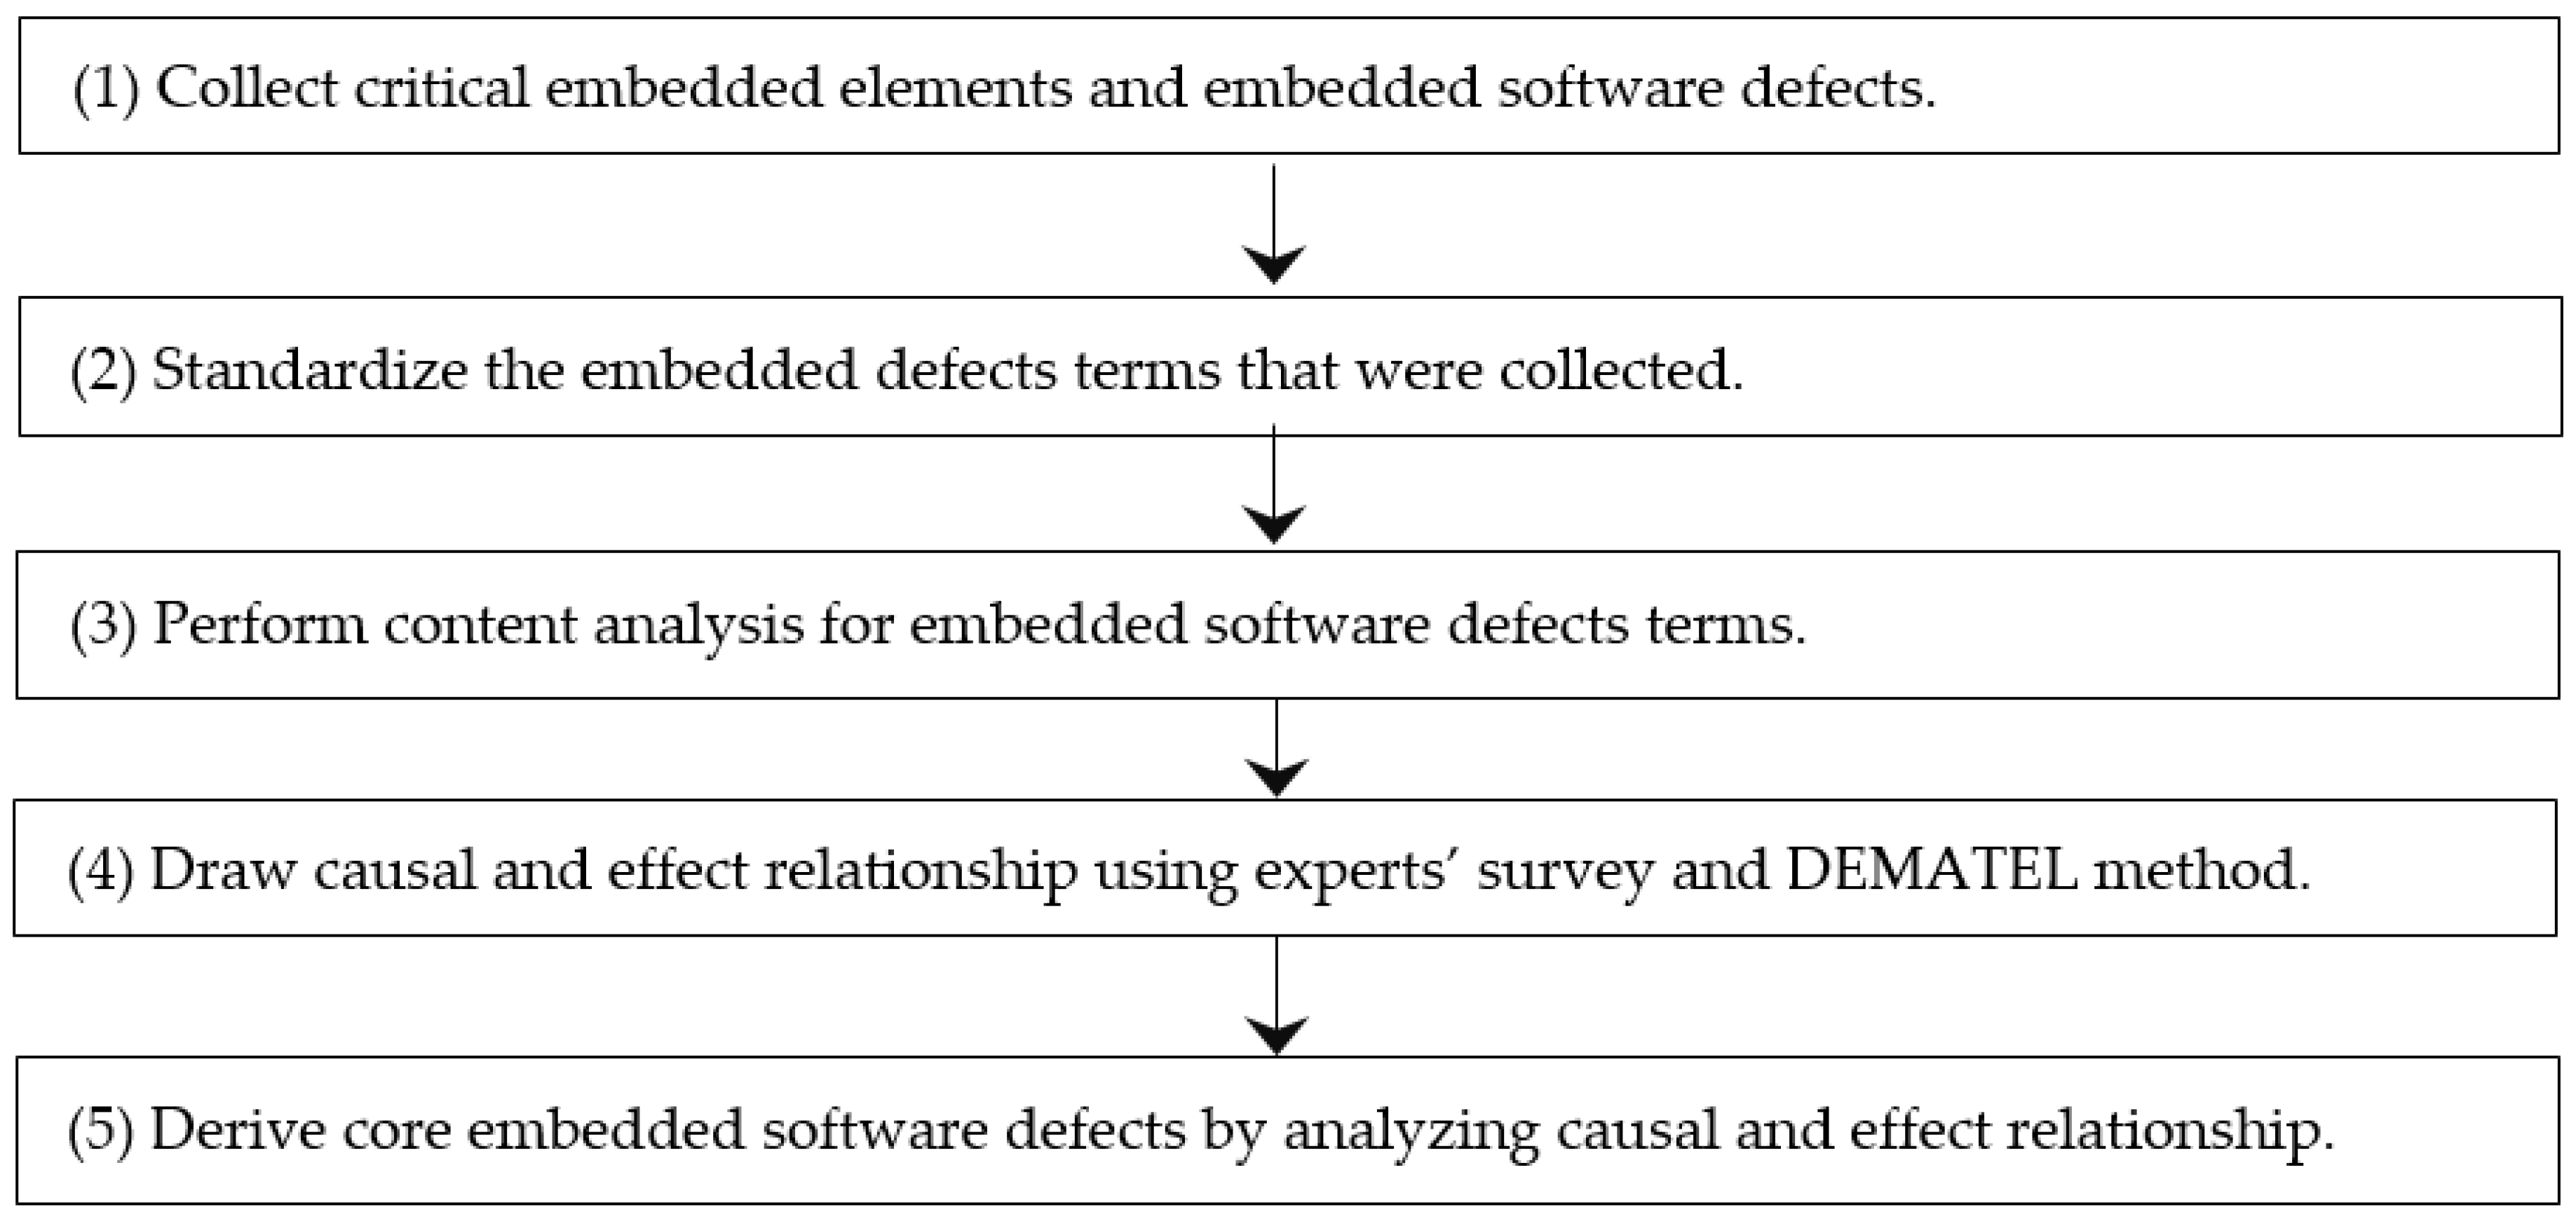
2.3. Research Procedure
2.4. Materials
2.4.1. Collected Critical Embedded Elements and Embedded Software Defects
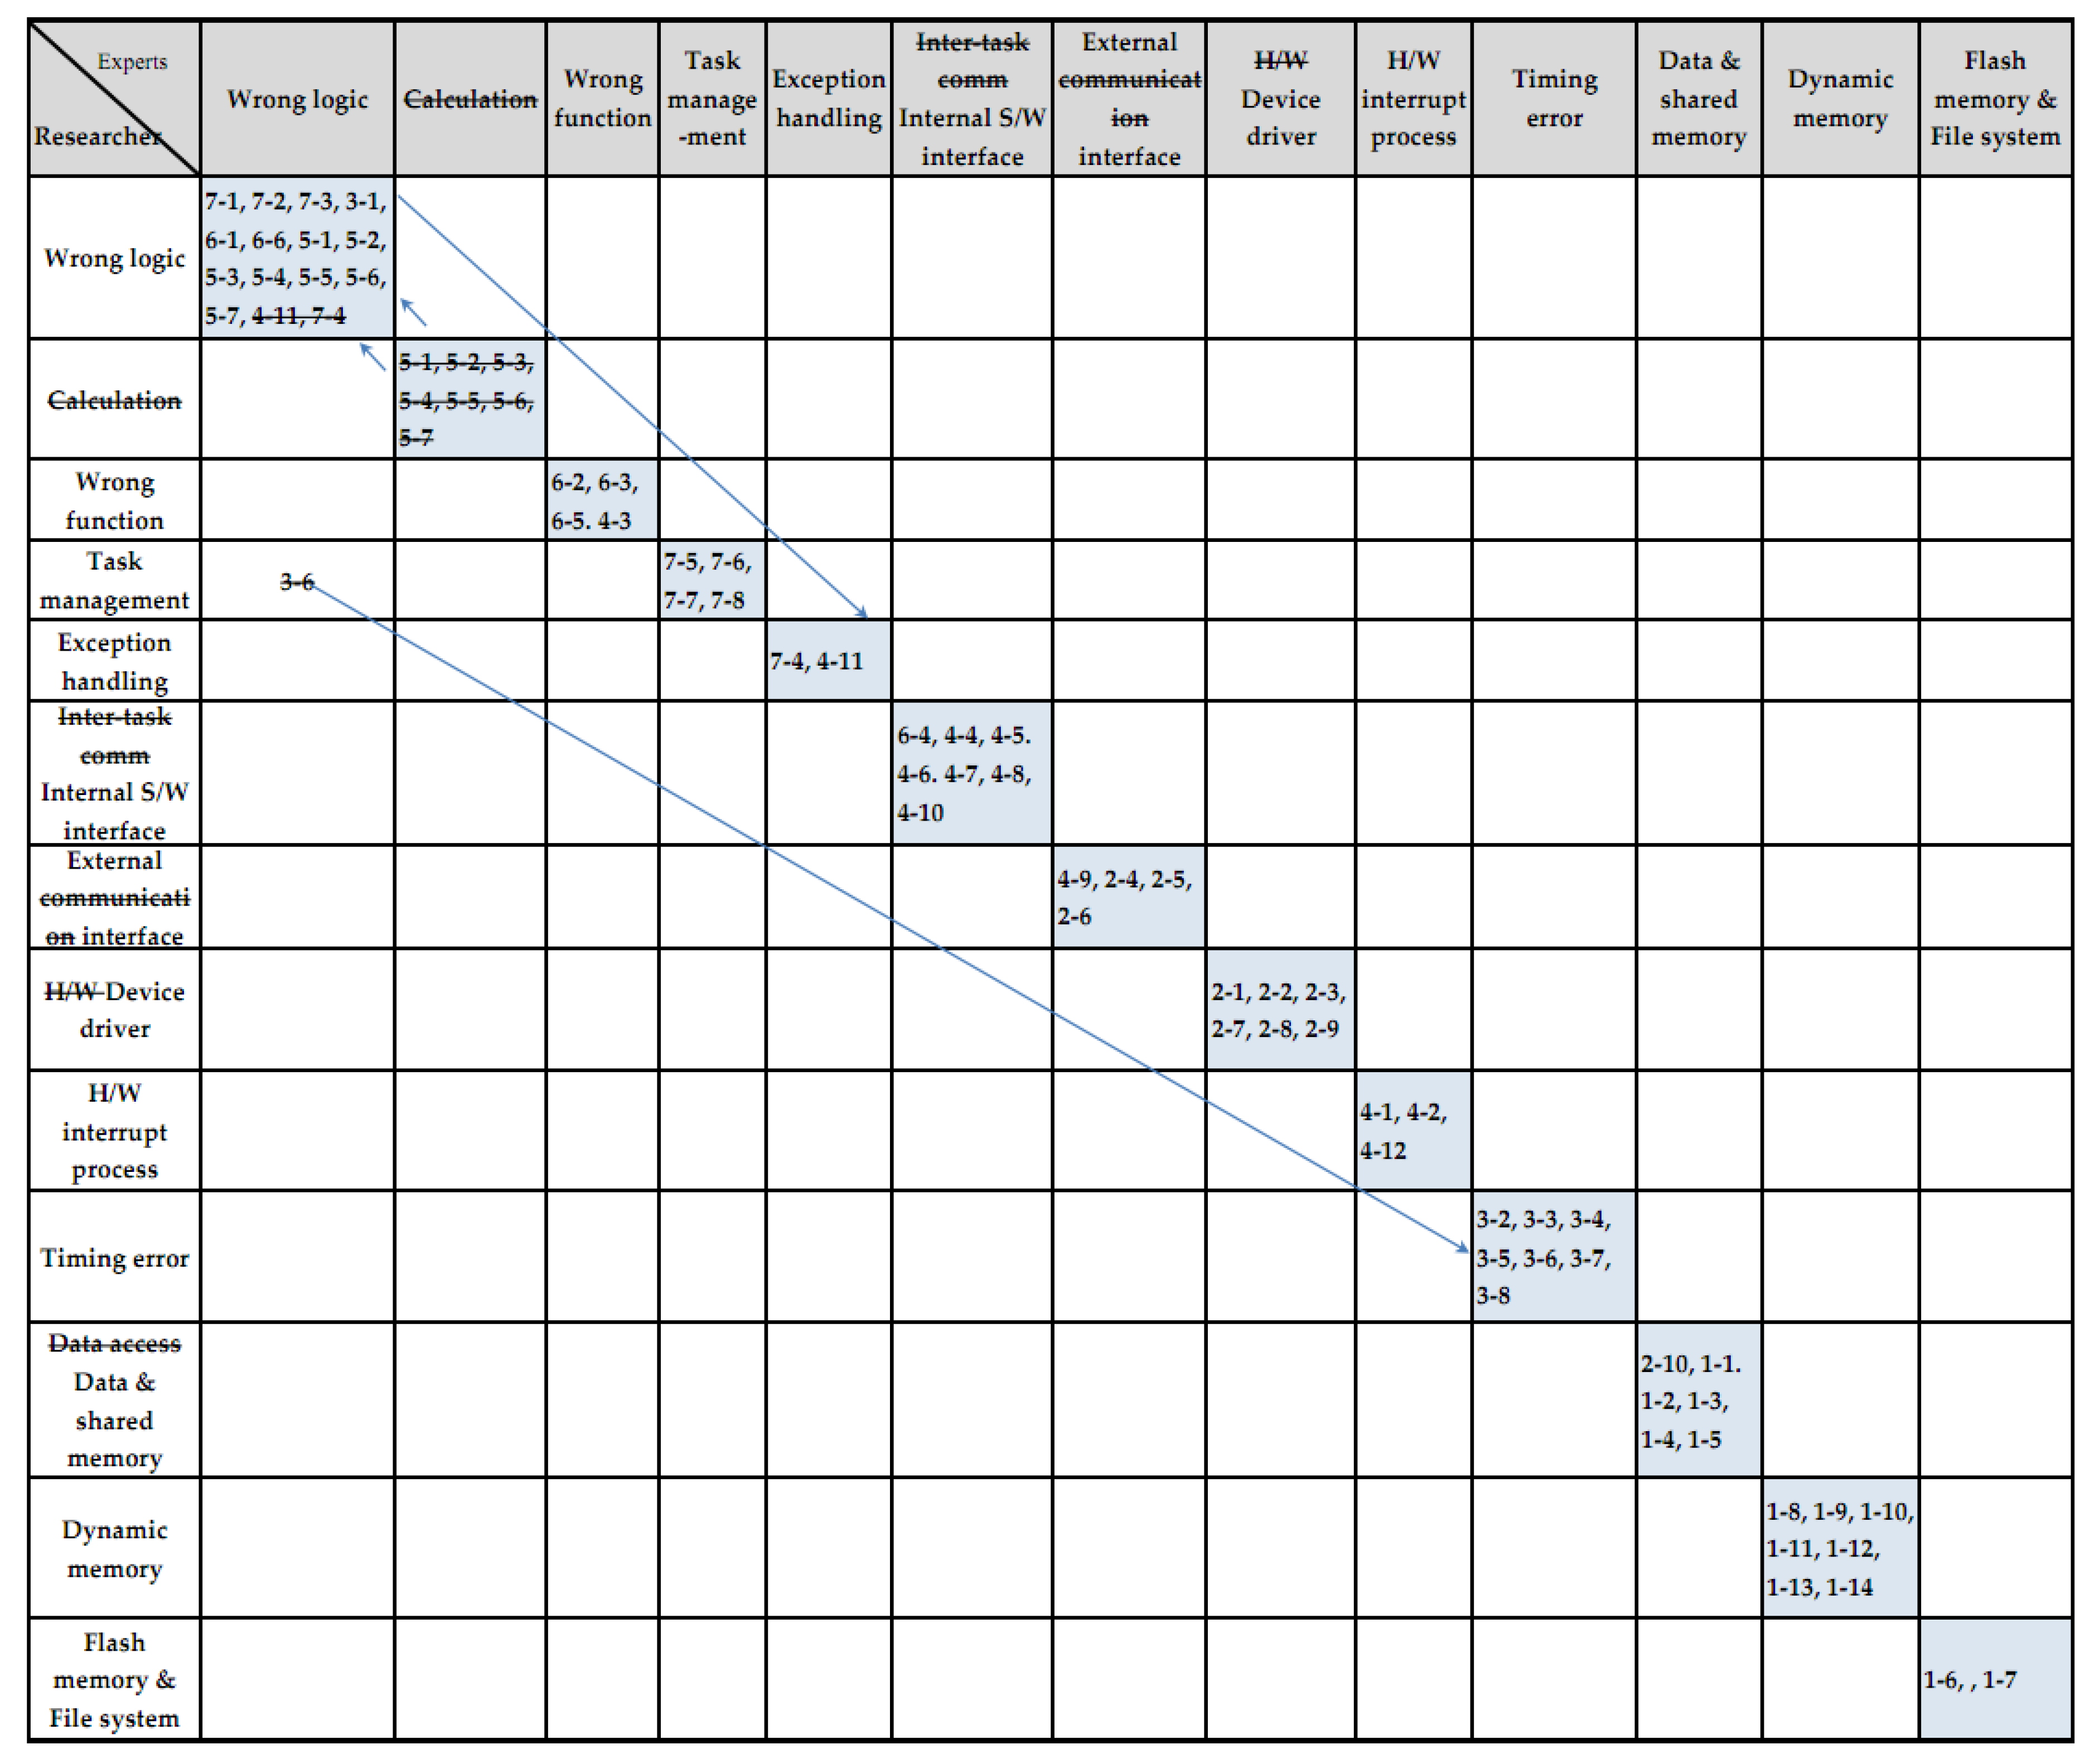
2.4.2. Standardization of Terms
2.4.3. Embedded Software Defects via Content Analysis
3. Results
3.1. Derived 12 Embedded Software Defects
3.2. Expert Opinions on the Influence Relationships of Embedded Software Defects
3.3. DEMATEL Analysis of Expert Opinions
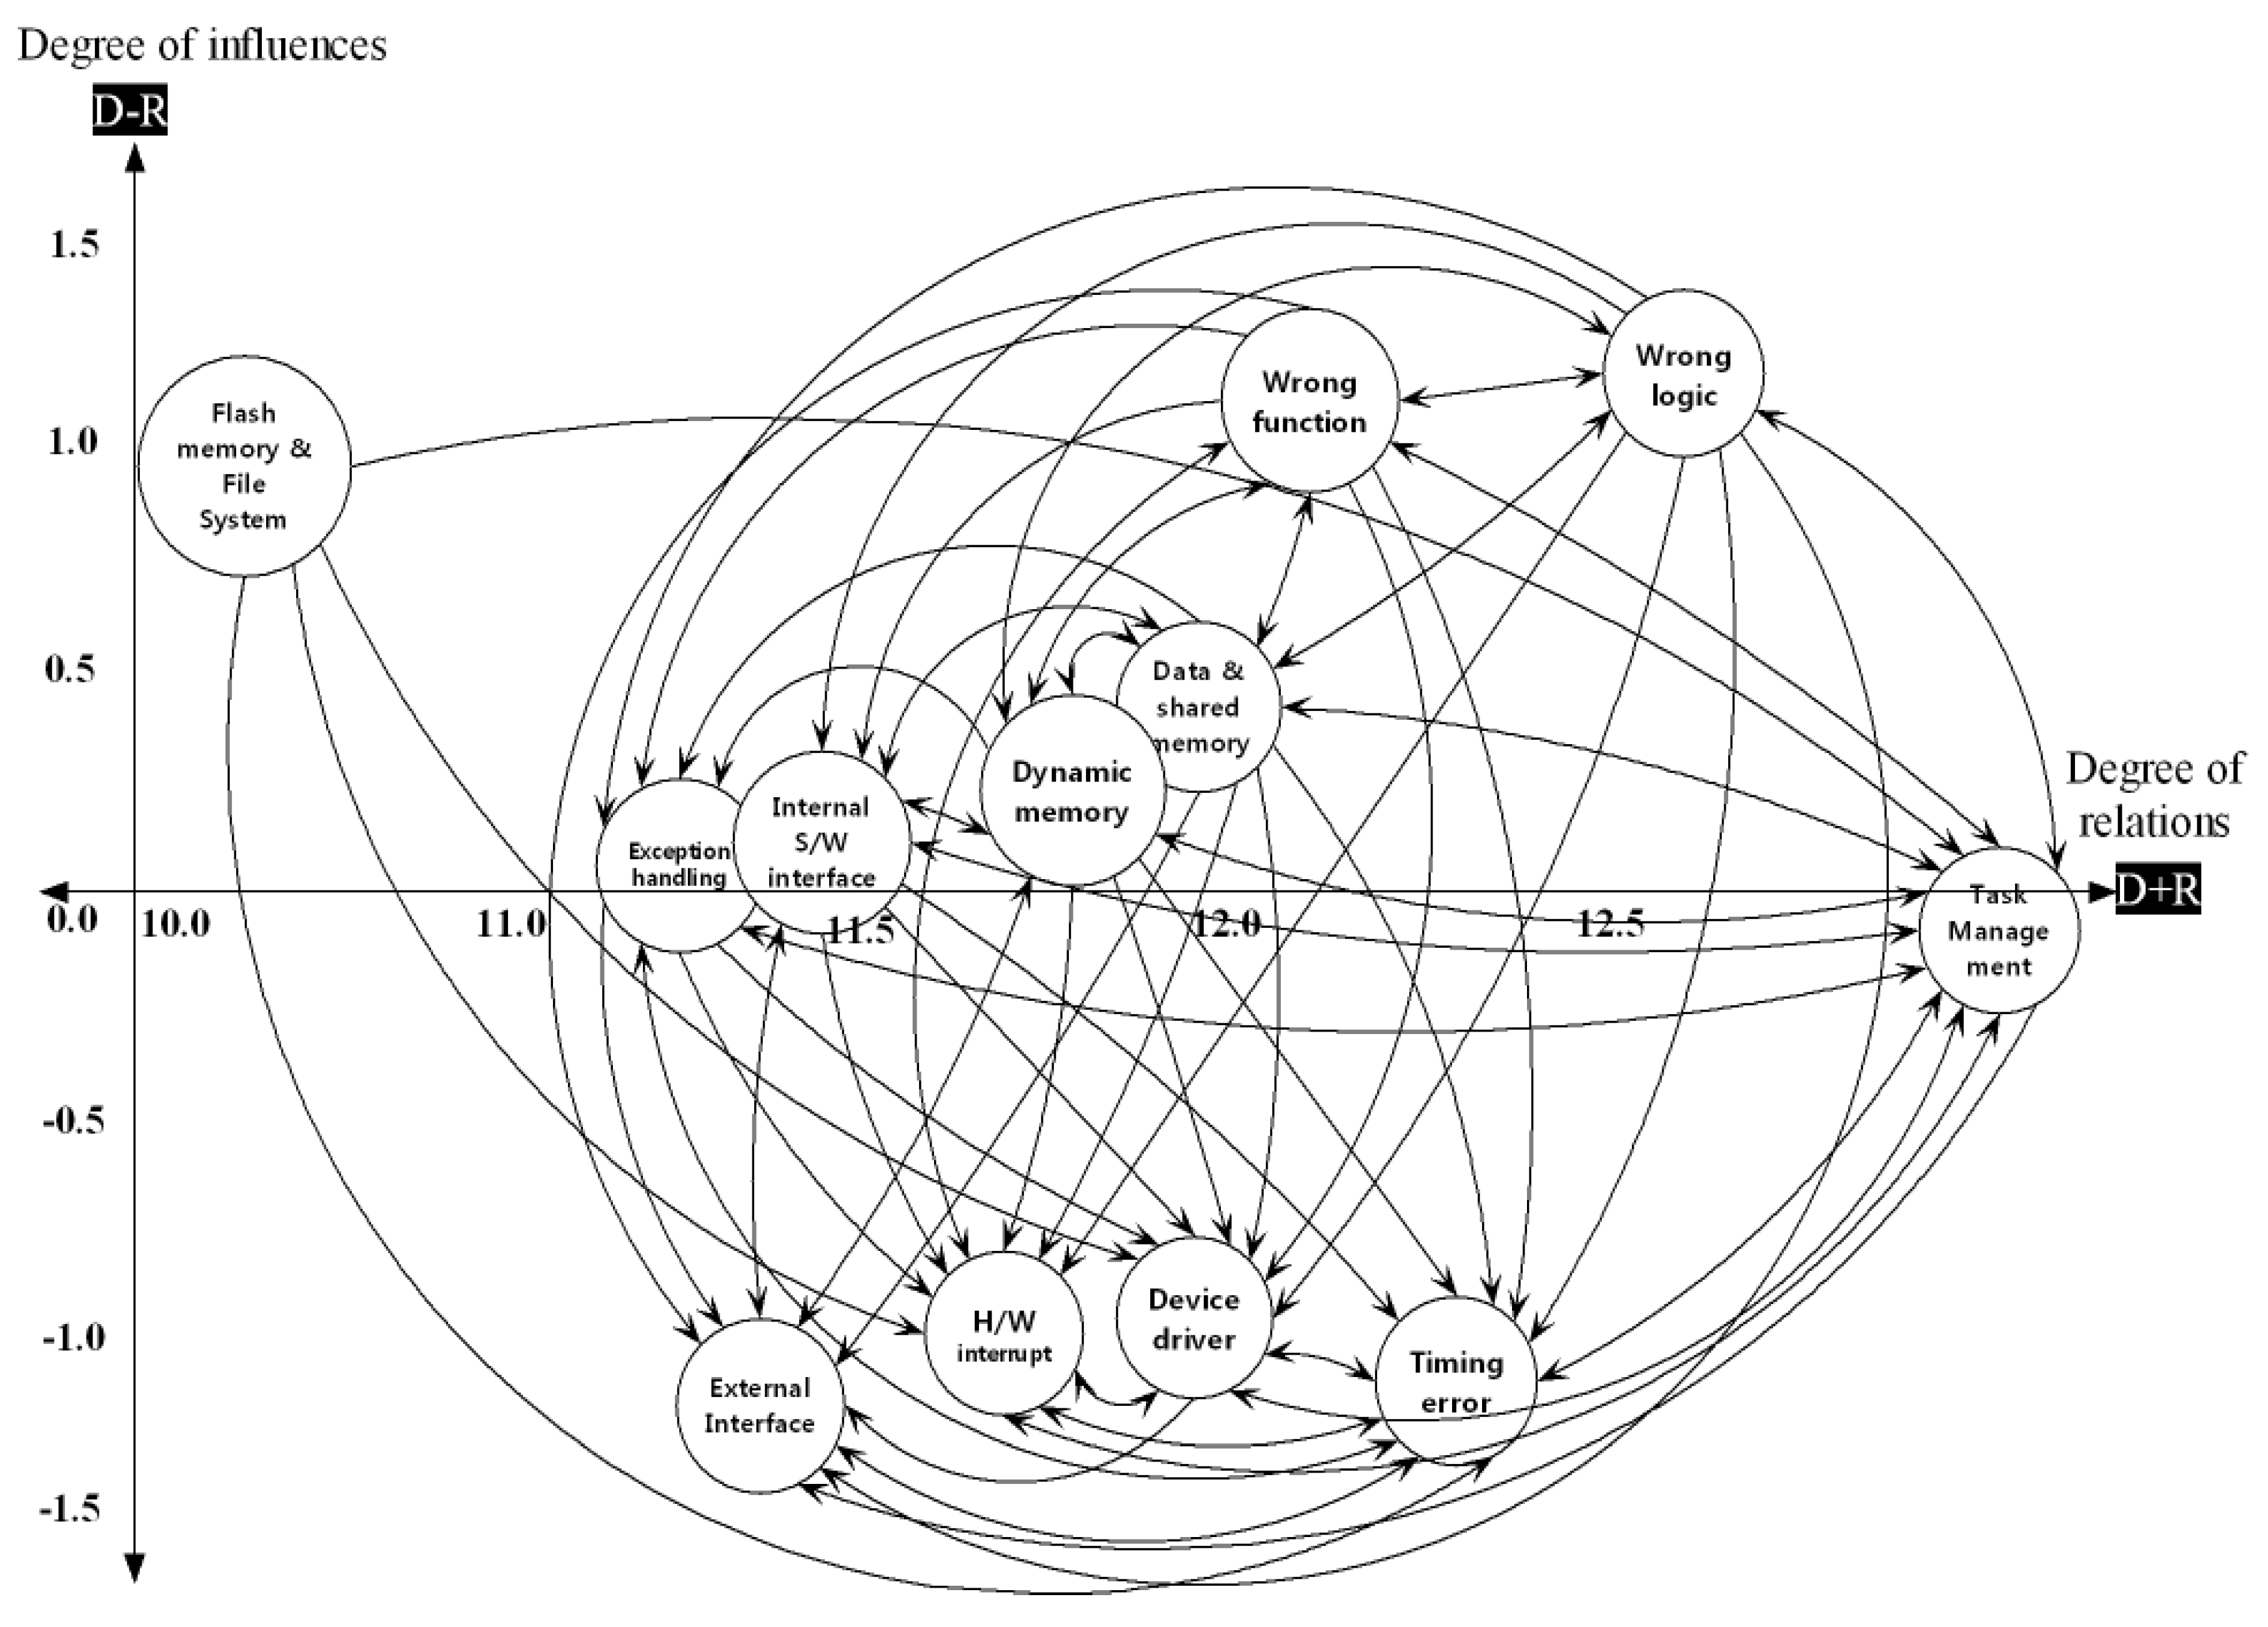
3.4. Influence Analysis between Embedded Software Defects
3.5. Validation with Embedded Software Developer Experts
3.6. The Difference between Previous Studies and This Study
4. Conclusions
Author Contributions
Funding
Conflicts of Interest
References
- Leveson, N.G.; Turner, C.S. An investigation of the Therac-25 accidents. Computer 1993, 26, 18–41. [Google Scholar] [CrossRef]
- Lann, G.L. The Ariane 5 Flight 501 failure—A case study in system engineering for computing systems. [Research Report] RR-3079. INRIA 1996. Available online: https://hal.inria.fr/inria-00073613 (accessed on 2 September 2020).
- Cousot, P.; Cousot, R. A gentle introduction to formal verification of computer systems by abstract interpretation. In Logics and Languages for Reliability and Security; Esparza, J., Spanfelner, B., Grumberg, O., Eds.; IOS Press: Amsterdam, The Netherlands, 2010; pp. 1–29. [Google Scholar] [CrossRef]
- Mäntylä, M.V.; Lassenius, C. What types of defects are really discovered in code reviews? IEEE Trans. Softw. Eng. 2009, 35, 430–448. [Google Scholar] [CrossRef]
- Huh, S.-M.; Kim, W.-J. A method to establish severity weight of defect factors for application software using ANP [Korean]. J. KIISE 2015, 42, 1349–1360. Available online: http://www.riss.kr/link?id=A101312445 (accessed on 2 September 2020). [CrossRef]
- IEEE. IEEE standard classification for software anomalies. In IEEE Std. 1044–2009 (Revision of IEEE Std 1044–1993); IEEE: New York, NY, USA, 2010; pp. 1–23. Available online: http://www.ctestlabs.org/neoacm/1044_2009.pdf (accessed on 2 September 2020).
- Huber, J.T. A Comparison of IBM’s Orthogonal Defect Classification to Hewlett Packard’s Defect Origins, Types and Modes 1.0. Hewlett Packard Co. 1999. Available online: http://www.stickyminds.com/sitewide.asp?Function=edetail&ObjectType=ART&ObjectId=2883 (accessed on 2 September 2020).
- IBM. Orthogonal Defect Classification v5.2 for Software Design and Code. IBM. 2013. Available online: https://researcher.watson.ibm.com/researcher/files/us-pasanth/ODC-5-2.pdf (accessed on 2 September 2020).
- Barr, M. Five top causes of nasty embedded software bugs. Embed. Syst. Des. 2010, 23, 10–15. [Google Scholar]
- Barr, M. Five more top causes of nasty embedded software bugs. Embed. Syst. Des. 2010, 23, 9–12. [Google Scholar]
- Lutz, R. Analyzing software requirements errors in safety-critical, embedded systems. In Proceedings of the IEEE International Symposium on Requirements Engineering; IEEE: San Diego, CA, USA, 1993; pp. 126–133. [Google Scholar] [CrossRef]
- Hagar, J.D. Software Test Attacks to Break Mobile and Embedded Devices; Chapman and Hall/CRC: Boca Raton, FL, USA, 2013. [Google Scholar]
- Lee, S.Y.; Jang, J.S.; Choi, K.H.; Park, S.K.; Jung, K.H.; Lee, M.H. A study of verification for embedded software [Korean]. Ind. Eng. Manag. Sys. 2004, 11, 669–676. Available online: http://www.riss.kr/link?id=A60279480 (accessed on 2 September 2020).
- Jung, D.-H.; Ahn, S.-J.; Choi, J.-Y. Programming enhancements for embedded software development-focus on MISRA-C [Korean]. J. KIISE Comp. Pract. Lett. 2013, 19, 149–152. Available online: http://www.riss.kr/link?id=A99686225 (accessed on 2 September 2020).
- Bennett, T.; Wennberg, P. Eliminating embedded software defects prior to integration test. J. Def. Softw. Eng. Triakis Corp. 2005. Available online: https://pdfs.semanticscholar.org/3070/1dcef9b58d6c167751aaeaff7c9628cf04c4.pdf (accessed on 2 October 2020).
- Seo, J. Embedded Software Interface Test Based on the Status of System [Korean]. Ph.D. Thesis, Department of Computer Science and Engineering Graduate School, EWHA Womans University, Seoul, Korea, 2009. Available online: http://www.riss.kr/link?id=T11551362 (accessed on 2 September 2020).
- Choi, Y.N. Automated Debugging Cooperative Method for Dynamic Memory Defects in Embedded Software System Test [Korean]. Master’s Thesis, Department of Computer Science and Engineering Graduate School, EWHA Womans University, Seoul, Korea, 2010. Available online: http://dspace.ewha.ac.kr/handle/2015.oak/188271 (accessed on 2 September 2020).
- Lee, S. Automated Method for Reliability Verification in Embedded Software System Exception Handling Test [Korean]. Master’s Thesis, Department of Computer Science and Engineering Graduate School, Ewha Womans University, Seoul, Korea, 2011. Available online: https://dspace.ewha.ac.kr/handle/2015.oak/188659 (accessed on 2 September 2020).
- Cotroneo, D.; Lanzaro, A.; Natella, R. Faultprog: Testing the accuracy of binary-level software fault injection. IEEE T. Depend. Secure. 2016, 15, 40–53. [Google Scholar] [CrossRef]
- Lee, H.-J.; Yoon, J.-H.; Lee, K.-Y.; Lee, D.-W.; Na, J.-W. Reclassification of fault, error, and failure types for reliability verification of defense embedded systems [Korean]. Proc. Inst. Control Robot. Syst. 2012, 7, 925–932. Available online: http://www.riss.kr/link?id=A99705651 (accessed on 2 September 2020).
- Lee, H.-J.; Park, J.-W. JTAG fault injection methodology for reliability verification of defense embedded systems [Korean]. J. Korea Acad. Ind. Coop. Soc. 2013, 14, 5123–5129. [Google Scholar] [CrossRef]
- Lee, H.-J. Statistical JTAG Fault Injection Methodology for Reliability Verification of Aerospace Embedded Systems [Korean]. Master’s Thesis, Department of Electronics and Information Engineering Korea Aerospace University, Gyeonggi, Korea, 2012. Available online: http://www.riss.kr/link?id=T12740845 (accessed on 2 September 2020).
- Jankowicz, D. The Easy Guide to Repertory Grids; John Wiley and Sons: Chichester, UK, 2005. [Google Scholar]
- Si, S.-L.; You, X.-Y.; Liu, H.-C.; Zhang, P. DEMATEL technique: A systematic review of the state-of-the-art literature on methodologies and applications. Math. Probl. Eng. 2018. [Google Scholar] [CrossRef]
- Elo, S.; Kyngäs, H. The qualitative content analysis process. J. Adv. Nurs. 2008, 62, 107–115. [Google Scholar] [CrossRef] [PubMed]
- White, M.D.; Marsh, E.E. Content analysis: A flexible methodology. Libr. Trends 2006, 55, 22–45. Available online: http://hdl.handle.net/2142/3670 (accessed on 2 September 2020). [CrossRef]
- Mayring, P. Qualitative content analysis. Qual. Soc. Res. 2000, 1, 1159–1176. [Google Scholar] [CrossRef]
- Sumrit, D.; Anuntavoranich, P. Using DEMATEL method to analyze the causal relations on technological innovation capability evaluation factors in Thai technology-based firms. Int. T. J. Eng. Manage. Appl. Sci. Technol. 2013, 4, 81–103. Available online: https://citeseerx.ist.psu.edu/viewdoc/download?doi=10.1.1.411.8216&rep=rep1&type=pdf (accessed on 2 September 2020).
- Asgharpour, M.J. Group Decision Making and Game Theory in Operation Research, 3rd ed.; University of Tehran Publications: Enghelab Square, Iran, 2003. [Google Scholar]
- Seyed-Hosseini, S.M.; Safaei, N.; Asgharpour, M.J. Reprioritization of failures in a system failure mode and effects analysis by decision making trial and evaluation laboratory technique. Reliab. Eng. Syst. Safe. 2006, 91, 872–881. [Google Scholar] [CrossRef]
- Ölçer, M.G. Developing a spreadsheet based decision support system using DEMATEL and ANP approaches. Master’s Thesis, DEÜ Fen Bilimleri Enstitüsü, Turkey, 2013. Available online: http://hdl.handle.net/20.500.12397/7682 (accessed on 2 September 2020).
- Hsu, C.-C. Evaluation criteria for blog design and analysis of causal relationships using factor analysis and DEMATEL. Expert. Syst. Appl. 2012, 39, 187–193. [Google Scholar] [CrossRef]
- Shieh, J.-I.; Wu, H.-H.; Huang, K.-K. A DEMATEL method in identifying key success factors of hospital service quality. Knowl. Based Syst. 2010, 23, 277–282. [Google Scholar] [CrossRef]
- Yang, Y.-P.O.; Leu, J.-D.; Tzeng, G.-H. A novel hybrid MCDM model combined with DEMATEL and ANP with applications. Int. J. Oper. Res. 2008, 5, 160–168. [Google Scholar]
- Ji, S.; Bao, X. Research on software hazard classification. Procedia Eng. 2014, 80, 407–414. [Google Scholar] [CrossRef][Green Version]
- Noergaard, T. Embedded Systems Architecture: A Comprehensive Guide for Engineers and Programmers, 1st ed.; Elsevier Inc.: Oxford, UK, 2005. [Google Scholar]
- Choi, H.; Sung, A.; Choi, B.; Kim, J. A functionality-based evaluation model for embedded software [Korean]. J. KIISE Softw. App. 2005, 32, 1192–1205. Available online: http://www.riss.kr/link?id=A82294417 (accessed on 2 September 2020).
- Seo, J.; Choi, B. An interface test tool based on an emulator for improving embedded software testing [Korean]. J. KIISE Comp. Pract. Lett. 2008, 32, 547–558. Available online: http://www.riss.kr/link?id=A82300048 (accessed on 2 September 2020).
- Sung, A.; Choi, B.; Shin, S. An interface test model for hardware-dependent software and embedded OS API of the embedded system. Comp. Stand. Inter. 2007, 29, 430–443. [Google Scholar] [CrossRef]
- Rodriguez Dapena, P. Software Safety Verification in Critical Software Intensive Systems. Ph.D. Thesis, Technische Universiteit Eindhoven, Eindhoven, The Netherlands, 2002. [Google Scholar] [CrossRef]
- Sung, A. Interface based embedded software test for real-time operating system [Korean]. Ph.D. Thesis, Department of Computer Science and Engineering, Ewha Womans University, Seoul, Korea, 2007. Available online: http://www.riss.kr/link?id=T11039605 (accessed on 2 September 2020).
- Jung, H. Failure Mode Based Test Methods for Embedded Software [Korean]. Master’s Thesis, Ajou University Graduate School of Engineering, Suwon-si, Korea, 2007. Available online: http://www.riss.kr/link?id=T11077107 (accessed on 2 September 2020).
- Jones, N. A Taxonomy of Bug Types in Embedded Systems. Stack Overflow, Embeddedgurus.Com. 2009. Available online: https://embeddedgurus.com/stack-overflow/2009/10/a-taxonomy-of-bug-types-in-embedded-systems (accessed on 2 September 2020).
- Durães, J.A.; Madeira, H.S. Emulation of software faults: A field data study and a practical approach. IEEE Trans. Softw. Eng. 2006, 32, 849–867. [Google Scholar] [CrossRef]


| Researchers | Software Defects |
|---|---|
| IEEE 1044 [6] | IEEE 1044-1993 standard classification for software anomalies |
| HP Huber JT [7] | Hewlett Packard’s defect origins, types, and modes |
| IBM ODC [8] | Orthogonal defect classification (ODC) for software design and code |
| Other researchers | Collected software defects defined by 21 researchers worldwide |
| Category | Defects | Sub-Defects |
|---|---|---|
| Logic | Conditional statement | Checking, duplicating IF statement, empty IF statement, compared with other variables, missing important conditions (case, etc.) |
| Rotation logic | Infinite loops, infinite recursions, algorithm, logic sequences, flow control, error checking, check scope, status handling, missing a step | |
| Concurrent logic | Synchronization, race conditions, mutual exclusions, critical sections, concurrent processing, coordination process, condition loads | |
| Interface, Timing | External interface | Human interface error, different protocols, incorrect protocols |
| Wrong function (internal interface) | Return pointers, incorrect Application programming interface(API), software architecture, function/class/object relationship, no existence subroutines, missing return values, incorrect parameter’s error, calls incorrect subroutines, calls incorrect module, incorrect interrupt | |
| I/O timing | Time overrun, incorrect Input/Output(I/O) timing | |
| Computation | Division by zero | Divide by zero |
| Expression | Wrong operator, incorrect parenthesis usage, different unit calculations, incorrect sign usage, missing expressions, wrong expressions | |
| Precision loss | Mixed modes, round/truncation calculations, underflow, overflow | |
| Data | Data structure | Error of data design, wrong data structures, wrong data units, pack/unpack |
| Data usage | Leaks, use after free, un-assignment, initialization pointer, memory violation, other variable type usages, other variable use dimensions, null pointers, wrong index, use other flags, error script variable usage, save/access errors, initialization errors | |
| Data value self | Wrong input data, wrong operation data, wrong external data, wrong sensor data |
| Step | Procedures |
|---|---|
| 1 | Create an appropriate category that contains the attributes of the first element |
| 2 | Create a new category if the following element is different from the first element |
| 3 | Distribute the following elements into similar categories |
| 4 | Combine and detach existing categories as needed to create new ones |
| 5 | Repeat until all elements are classified |
| 6 | Place all unclassifiable elements in the miscellaneous group |
| 7 | Repeat classification until the elements in the miscellaneous group account for less than 5% of the total |
| Collaborator | Category C1 (Matched with R1) | Category C2 (Matched with R2) | Category C3 (Non-Matched) | |
|---|---|---|---|---|
| Researcher | ||||
| Category R1 (matched with C1) | 1.1, 2.1, 4.2, 3.2, 3.3 (matched) | 1.4 (non-matched) | - | |
| Category R2 (matched with C2) | - | 2.2, 2.3, 2.4, 3.1, 3.4 (matched) | 2.5 (non-matched) | |
| Category R3 (non-matched) | - | 1.2, 4.3 (non-matched) | ||
| Category R4 (non-matched) | - | 4.4 (non-matched) | 4.1, 1.3 (non-matched) | |
| Researcher | Embedded Software Defects | Researcher | Embedded Software Defects | ||
|---|---|---|---|---|---|
| Barr [9] | Race condition Non-reentrant function Missing volatile keyword Stack overflow Heap fragmentation | Barr [10] | Memory leak Deadlock Priority inversion Incorrect priority assignment | ||
| Ji and Bao [35] | Initialize Input Interface Output Control Fault detection Fault handles Performance | Noergaard [36] | Managing data: serial and parallel I/O Interfacing the I/O components Device driver Flash memory Multitasking and process management Memory management I/O and file system management | ||
| Choi et al. [37] | Task management Inter-task communication Time management Interrupt Signal processing I/O management Memory management Networking File system | Jung et al. [14] | Types Declarations and definitions Pointer type conversion Arithmetic type conversion Expressions Control flow Control statement expressions Switch statements Functions | ||
| Hagar [12] | Data computation bug Structural logic flow Long duration control Logic and control law Data Computation Software(S/W)-to-Hardware(H/W) interface H/W-to-S/W interface S/W-system fault tolerance S/W error recovery H/W to S/W communications bug Time-related Human interface | Seo and Choi [38] | Memory Timer I/O device Task management Exception handling Inter-task communication Virtual memory management Physical memory management Time management Interrupt handling I/O management (i.e., device driver I/O) Networking File system | ||
| Sung et al. [39] | Task management Inter-task management Time management Interrupt/signal/exception handling Memory management I/O management Networking File system I/O device Timer Hardware initialization | Rodriguez -Dapena [40] | Calculations faults Data faults Internal interface faults Logic faults Control flow faults Interface between components Control flow between components H/W to S/W interface faults H/W to S/W interface User interface faults | ||
| Seo [16] | S/W-to-H/W interface S/W-to-S/W interface | Lee [18] | Exception handling | ||
| Lutz [11] | Process flow | Interface specification | Bennett and Wennberg [15] | Internal faults Interface faults | |
| Program fault | Internal faults Interface faults Functional faults | Function faults | Operating faults Condition faults Behavior faults | ||
| Sung [41] | Kernel Interface | Task management Inter-task communication Time management Interrupt/exception handling Memory management I/O management Networking File system | Lee [22] | Assignment Checking Interface Algorithm | |
| Lee et al. [20]; Lee and Park [21] | Time out Data violation Complete with delay Error without effect Exception | ||||
| Hardware interface | |||||
| Jung [42] | Control logic | Jones [43] | Getting bored and running | Run-time environment (e.g., stack and heap allocation, memory models, etc.) | |
| Sensor | Missing S/W logic between sensor and system Wrong alalog/digital conversion | ||||
| Knocking off the obvious mistakes | Initialization Pointer dereferencing Arithmetic errors | ||||
| Key | Wrong A/D conversion table, Key alone event | ||||
| Background/foreground issues | Reentrancy Atomicity Interrupt response times | ||||
| LCD panel | Display error | ||||
| Indicator | Indication error Buzzer | ||||
| Timing related | Resource allocation mistake Priority/schedule issues Deadlocks Priority inversion Race conditions | ||||
| Motor actuator Analog/digital(A/D) conversion error Digital/analog(D/A) conversion error | |||||
| Durães and Madeira [44]; Cotroneo et al. [19] | Missing variable initialization Missing variable assignment with a value Missing variable assignment with an expression The incorrect value assigned to a variable Missing function call Missing IF construct + statements Missing IF construct + statements + ELSE construct Missing small and localized part of the algorithm Missing IF construct around statements Missing AND in expression used as branch condition Missing OR in expression used as branch condition Wrong variable used in the parameter of function call Wrong arithmetic expression in function call parameter | Lee et al. [13] | Input data handling logic | Aanalog/digital sampling Aanalog/digital conversion Fail-safe Interrupt | |
| Control logic | Expression Data processing Branch control Loop control | ||||
| Output data Handling logic | Output port set Abort output (Incorrect time, feedback control error) Fail-safe | ||||
| YN Choi [17] | Memory allocation | Leakage Zero allocation Fail allocation | |||
| Memory access | Null pointer access Free pointer access Invalid pointer access Outbound access Collision | ||||
| Memory free | Illegal free Null pointer free Duplicate free | ||||
| Experts | Embedded Software Expert | ||
|---|---|---|---|
| Field of Embedded Software Development | Number of Years of Embedded Software Experience | Experts Class or Certification | |
| Experts 1 | Mobile, Internet of thing | 20 years | IT Auditor |
| Experts 2 | Internet Cable TV, IoT, Device driver | 10 years | Professional engineer |
| Experts 3 | Mobile, industrial device control | 8 years | Top engineer |
| Experts 4 | Industrial control | 8.5 years | Professional engineer |
| Code | Embedded Software Defects | Code | Embedded Software Defects |
|---|---|---|---|
| 1-1 | Data access | 4-1 | Wrong interrupts |
| 1-2 | Shared memory | 4-2 | Incorrect subroutine called |
| 1-3 | Data violation | 4-3 | Nonexistent subroutine call |
| 1-4 | Data boundary error | 4-4 | Wrong parameter |
| 1-5 | Type mismatch | 4-5 | Inter-task communication |
| 1-6 | Save storage data | 4-6 | Internal interface |
| 1-7 | Flash memory | 4-7 | Module interface |
| 1-8 | Memory initialization | 4-8 | Incorrect API usage |
| 1-9 | Memory management | 4-9 | Wrong protocol |
| 1-10 | Memory access | 4-10 | Software architecture |
| 1-11 | Resource leaks | 4-11 | Exception handling |
| 1-12 | Memory free error | 4-12 | None sensor logic |
| 1-13 | Memory overflow error | 5-1 | Missing computation |
| 1-14 | Memory violation error | 5-2 | Incorrect operand and operator |
| 2-1 | Wrong H/W interface | 5-3 | Incorrect parenthesis |
| 2-2 | I/O devices | 5-4 | Round and truncate |
| 2-3 | User interfaces | 5-5 | Sign convention |
| 2-4 | External interface | 5-6 | Divide by zero |
| 2-5 | Send and receive packets error | 5-7 | Arithmetic overflow and underflow |
| 2-6 | Networking | 6-1 | Wrong logic |
| 2-7 | Input value error | 6-2 | Non-reentrant function |
| 2-8 | Output signal | 6-3 | Wrong objects |
| 2-9 | Data I/O process | 6-4 | Wrong relationship |
| 2-10 | Incorrect sensor data | 6-5 | Incorrect return |
| 3-1 | Optimization | 6-6 | Logic error |
| 3-2 | Time out | 7-1 | Infinite loops |
| 3-3 | Time fault causes data loss | 7-2 | If and case statements |
| 3-4 | Complete with delay | 7-3 | Check variables |
| 3-5 | Time delay | 7-4 | Serialization |
| 3-6 | Feedback control error | 7-5 | Deadlock |
| 3-7 | Set time and read | 7-6 | Concurrent processing |
| 3-8 | Time management | 7-7 | Task management |
| 7-8 | Recursion | ||
| Code | Embedded Software Defects | Definition | Sub-Defects |
|---|---|---|---|
| E1 | Wrong logic | Control logic and calculation | Control flow, if, case, loop statements, divided by zero |
| E2 | Wrong function | Function itself defects | Non-reentrant function, incorrect objects |
| E3 | Task management | Concurrent processing error | Deadlock, race condition, task management |
| E4 | Exception handling | Device driver exception handle error | Software exception handling excluding device driver error |
| E5 | Internal software interface | Communication error between software | Internal interface, inconsistent module interface, wrong parameter |
| E6 | External interface | Communication error with the external system | Networking, send and receive packet error, human interface |
| E7 | Device driver | Hardware control device driver | I/O device, I/O port process, I/O device status |
| E8 | Hardware interrupt | The processing routine for hardware interrupt | Non interrupt routine, incorrect interrupt routine, process error |
| E9 | Timing error | Defects that cannot complete in time | Time out, time delay, feedback control error, set time and read time |
| E10 | Data, shared memory | Data and static memory | Data definition, data access, shared memory |
| E11 | Dynamic memory | Defect using dynamic memory | Memory initialization, memory management, resource leaks, memory overflow |
| E12 | Flash memory and file system | Data storage device | Flash memory, storage data save |
| No. | Embedded Expert Respondents | Survey Analysis Result of Cronbach’s α | |||||
|---|---|---|---|---|---|---|---|
| Field of Embedded Software Development | Number of Years of Embedded Software Experience | Respondent Class or Certification | Scale Average if This Item was Deleted | Scale Distribution if This Item was Deleted | Modified Full Correlation | Cronbach’s α if this Item was Deleted | |
| R1 | IP CCTV, IoT, Device driver | 10 | P.E. * | 26.639 | 98.358 | 0.765 | 0.895 |
| R2 | Device driver | 6.5 | P.E. * | 26.882 | 99.615 | 0.736 | 0.897 |
| R3 | Industrial device control | 6 | P.E. * | 27.778 | 103.559 | 0.312 | 0.911 |
| R4 | Mobile, IoT | 20 | IT auditor | 27.333 | 101.231 | 0.534 | 0.902 |
| R5 | Mobile, IoT | 9.5 | IT auditor | 27.222 | 99.447 | 0.676 | 0.898 |
| R6 | Mobile | 10.5 | IT auditor | 27.132 | 97.346 | 0.671 | 0.897 |
| R7 | Mobile | 14 | P.E. * | 27.681 | 102.680 | 0.584 | 0.901 |
| R8 | Mobile, IoT | 12 | P.E. * | 27.208 | 99.649 | 0.546 | 0.902 |
| R9 | IoT | 8 | Top engineer | 27.111 | 98.155 | 0.632 | 0.899 |
| R10 | Network cam, | 7 | P.E. * | 26.757 | 98.843 | 0.717 | 0.897 |
| R11 | Mobile, industrial device control | 8 | Top engineer | 27.819 | 101.743 | 0.478 | 0.904 |
| R12 | Industrial control | 8.5 | P.E. * | 27.882 | 98.748 | 0.569 | 0.901 |
| R13 | Mobile | 10 | P.E. * | 27.882 | 98.748 | 0.569 | 0.901 |
| R14 | Intrusion Prevention System | 6 | P.E. * | 27.569 | 97.939 | 0.477 | 0.906 |
| R15 | IoT | 5 | Top engineer | 26.604 | 98.507 | 0.693 | 0.897 |
| R16 | Home automation | 5 | Top engineer | 27.167 | 96.252 | 0.616 | 0.900 |
| Average | 9.125 | N/A | N/A | N/A | N/A | 0.906 | |
| E1 | E2 | E3 | E4 | E5 | E6 | E7 | E8 | E9 | E10 | E11 | E12 | |
|---|---|---|---|---|---|---|---|---|---|---|---|---|
| E1 | 0.0000 | 2.3125 | 2.6250 | 2.3750 | 1.6875 | 1.6250 | 2.4375 | 2.1875 | 2.6250 | 2.5000 | 2.6250 | 2.5000 |
| E2 | 2.3125 | 0.0000 | 2.7500 | 2.3750 | 2.3125 | 2.1875 | 2.1875 | 2.1250 | 2.1875 | 2.2500 | 2.3125 | 1.6250 |
| E3 | 1.9375 | 1.7500 | 0.0000 | 2.1250 | 2.3750 | 2.4375 | 2.2500 | 2.5625 | 2.6250 | 2.3125 | 2.3125 | 1.6875 |
| E4 | 2.3125 | 1.9375 | 2.3125 | 0.0000 | 1.7500 | 1.9375 | 1.7500 | 1.8125 | 2.0625 | 1.7500 | 1.6250 | 1.3750 |
| E5 | 1.9375 | 2.0625 | 2.3750 | 1.9375 | 0.0000 | 2.1875 | 2.0625 | 1.8750 | 2.2500 | 1.3750 | 1.6250 | 1.5000 |
| E6 | 1.6250 | 1.3750 | 1.7500 | 1.6875 | 1.7500 | 0.0000 | 1.8750 | 2.0625 | 2.8125 | 1.4375 | 1.3750 | 0.8750 |
| E7 | 1.5625 | 1.5000 | 1.8125 | 1.6250 | 1.6875 | 2.1875 | 0.0000 | 2.3125 | 2.5000 | 1.8125 | 1.8750 | 1.2500 |
| E8 | 1.3750 | 1.2500 | 1.9375 | 1.3125 | 1.6250 | 2.1875 | 2.7500 | 0.0000 | 2.5000 | 1.6875 | 1.6875 | 1.4375 |
| E9 | 1.6250 | 1.6875 | 2.3750 | 1.7500 | 2.0000 | 2.7500 | 2.4375 | 2.3750 | 0.0000 | 1.6875 | 1.3750 | 1.3750 |
| E10 | 2.3125 | 2.3750 | 2.3125 | 2.0000 | 2.0000 | 1.8750 | 2.0000 | 1.9375 | 1.9375 | 0.0000 | 2.3125 | 1.6875 |
| E11 | 2.2500 | 2.3125 | 2.1875 | 2.1250 | 2.0000 | 1.7500 | 2.0000 | 1.8750 | 2.0625 | 2.3125 | 0.0000 | 1.6250 |
| E12 | 1.6875 | 1.6250 | 2.1250 | 1.3750 | 1.6875 | 1.7500 | 2.0625 | 2.3125 | 1.8125 | 2.1250 | 1.9375 | 0.0000 |
| E1 | E2 | E3 | E4 | E5 | E6 | E7 | E8 | E9 | E10 | E11 | E12 | |
|---|---|---|---|---|---|---|---|---|---|---|---|---|
| E1 | 0.4742 | 0.5415 | 0.6444 | 0.5562 | 0.5387 | 0.5825 | 0.6266 | 0.6103 | 0.6662 | 0.5715 | 0.5711 | 0.4786 |
| E2 | 0.5421 | 0.4435 | 0.6307 | 0.5416 | 0.5444 | 0.5846 | 0.6007 | 0.5907 | 0.6343 | 0.5467 | 0.5448 | 0.4360 |
| E3 | 0.5205 | 0.4992 | 0.5229 | 0.5239 | 0.5378 | 0.5845 | 0.5939 | 0.5961 | 0.6390 | 0.5395 | 0.5353 | 0.4306 |
| E4 | 0.4732 | 0.4474 | 0.5365 | 0.3879 | 0.4563 | 0.5006 | 0.5081 | 0.5035 | 0.5472 | 0.4602 | 0.4526 | 0.3714 |
| E5 | 0.4677 | 0.4583 | 0.5472 | 0.4657 | 0.3998 | 0.5181 | 0.5274 | 0.5144 | 0.5631 | 0.4548 | 0.4595 | 0.3811 |
| E6 | 0.4099 | 0.3897 | 0.4718 | 0.4103 | 0.4168 | 0.3884 | 0.4686 | 0.4684 | 0.5256 | 0.4086 | 0.4031 | 0.3210 |
| E7 | 0.4337 | 0.4189 | 0.5034 | 0.4336 | 0.4405 | 0.4951 | 0.4291 | 0.5054 | 0.5459 | 0.4477 | 0.4462 | 0.3549 |
| E8 | 0.4189 | 0.4024 | 0.4980 | 0.4148 | 0.4305 | 0.4869 | 0.5181 | 0.4140 | 0.5368 | 0.4355 | 0.4319 | 0.3545 |
| E9 | 0.4573 | 0.4456 | 0.5472 | 0.4594 | 0.4730 | 0.5383 | 0.5412 | 0.5323 | 0.4838 | 0.4653 | 0.4514 | 0.3766 |
| E10 | 0.5112 | 0.4991 | 0.5803 | 0.4982 | 0.5026 | 0.5394 | 0.5591 | 0.5495 | 0.5879 | 0.4345 | 0.5140 | 0.4130 |
| E11 | 0.5048 | 0.4927 | 0.5711 | 0.4980 | 0.4981 | 0.5304 | 0.5540 | 0.5423 | 0.5865 | 0.5130 | 0.4262 | 0.4072 |
| E12 | 0.4466 | 0.4317 | 0.5238 | 0.4335 | 0.4490 | 0.4888 | 0.5134 | 0.5150 | 0.5325 | 0.4679 | 0.4581 | 0.3156 |
| Code | Defects | D | R | D+R | D-R |
|---|---|---|---|---|---|
| E1 | Wrong logic | 6.86 | 5.66 | 12.52 | 1.20 |
| E2 | Wrong function | 6.64 | 5.47 | 12.11 | 1.17 |
| E3 | Task management | 6.52 | 6.58 | 13.10 | −0.05 |
| E4 | Exception handling | 5.64 | 5.62 | 11.27 | 0.02 |
| E5 | Internal software interface | 5.76 | 5.69 | 11.44 | 0.07 |
| E6 | External interface | 5.08 | 6.24 | 11.32 | −1.16 |
| E7 | Device driver | 5.45 | 6.44 | 11.89 | −0.99 |
| E8 | Hardware interrupt | 5.34 | 6.34 | 11.68 | −1.00 |
| E9 | Timing error | 5.77 | 6.85 | 12.62 | −1.08 |
| E10 | Data, shared memory | 6.19 | 5.75 | 11.93 | 0.44 |
| E11 | Dynamic memory | 6.12 | 5.69 | 11.82 | 0.43 |
| E12 | Flash memory and file system | 5.58 | 4.64 | 10.22 | 0.94 |
| Code | Defects Sorted by D+R | D+R | Code | Defects Sorted by D-R | D-R |
|---|---|---|---|---|---|
| E3 | Task management | 13.1 | E1 | Wrong logic | 1.2 |
| E9 | Timing error | 12.62 | E2 | Wrong function | 1.17 |
| E1 | Wrong logic | 12.52 | E12 | Flash memory and file system | 0.94 |
| E2 | Wrong function | 12.11 | E10 | Data, shared memory | 0.44 |
| E10 | Data, shared memory | 11.93 | E11 | Dynamic memory | 0.43 |
| E7 | Device driver | 11.89 | E5 | Internal software interface | 0.07 |
| E11 | Dynamic memory | 11.82 | E4 | Exception handling | 0.02 |
| E8 | Hardware interrupt | 11.68 | E3 | Task management | −0.05 |
| E5 | An internal software interface | 11.44 | E7 | Device driver | −0.99 |
| E6 | External interface | 11.32 | E8 | Hardware interrupt | −1 |
| E4 | Exception handling | 11.27 | E9 | Timing error | −1.08 |
| E12 | Flash memory and file system | 10.22 | E6 | External interface | −1.16 |
| Code | Defects | Opinions of 10 Embedded Software Experts | Rank | |||||||||
|---|---|---|---|---|---|---|---|---|---|---|---|---|
| 1 | 2 | 3 | 4 | 5 | 6 | 7 | 8 | 9 | 10 | |||
| E1 | Device driver | 6 | 4 | 4 | 1 | 2 | 3 | 1 | 1 | 4 | ||
| E2 | H/W interrupt | 4 | 2 | 2 | 2 | 3 | 1 | 4 | 5 | 4 | 1 | |
| E3 | Timing error | 5 | 3 | 5 | 4 | 5 | 2 | 3 | 6 | 5 | 3 | |
| E4 | Data and shared memory | 6 | 5 | 5 | ||||||||
| E5 | Dynamic memory | 2 | 5 | 6 | ||||||||
| E6 | Flash memory and file system | 1 | 6 | 5 | 2 | |||||||
| E7 | Internal software interface | 1 | ||||||||||
| E8 | External interface | 6 | 3 | 3 | 5 | 3 | 1 | 2 | 2 | 3 | 2 | |
| E9 | Wrong logic | 1 | 6 | 3 | 6 | |||||||
| E10 | Wrong function | 4 | 4 | |||||||||
| E11 | Task management | 3 | 5 | 1 | 4 | 5 | 5 | |||||
| E12 | Exception handling | 4 | 4 | 2 | 6 | 6 | ||||||
© 2020 by the authors. Licensee MDPI, Basel, Switzerland. This article is an open access article distributed under the terms and conditions of the Creative Commons Attribution (CC BY) license (http://creativecommons.org/licenses/by/4.0/).
Share and Cite
Huh, S.M.; Kim, W.-J. The Derivation of Defect Priorities and Core Defects through Impact Relationship Analysis between Embedded Software Defects. Appl. Sci. 2020, 10, 6946. https://doi.org/10.3390/app10196946
Huh SM, Kim W-J. The Derivation of Defect Priorities and Core Defects through Impact Relationship Analysis between Embedded Software Defects. Applied Sciences. 2020; 10(19):6946. https://doi.org/10.3390/app10196946
Chicago/Turabian StyleHuh, Sang Moo, and Woo-Je Kim. 2020. "The Derivation of Defect Priorities and Core Defects through Impact Relationship Analysis between Embedded Software Defects" Applied Sciences 10, no. 19: 6946. https://doi.org/10.3390/app10196946
APA StyleHuh, S. M., & Kim, W.-J. (2020). The Derivation of Defect Priorities and Core Defects through Impact Relationship Analysis between Embedded Software Defects. Applied Sciences, 10(19), 6946. https://doi.org/10.3390/app10196946