Abstract
This article presents elemental analysis of an economically important mineral (chalcopyrite) of local origin. Calibration-free laser-induced breakdown spectroscopy (CF-LIBS) methodology based on the assumption of optically thin plasma and local thermodynamic equilibrium was employed for quantitative analysis. Plasma on the surface of the chalcopyrite target was generated by an Nd:YAG laser beam of wavelength 532 nm, pulse width 5 ns, and operated at repetition rate of 10 Hz. A LIBS2000+ detection system, comprised of five spectrometers, covering the spectral range from 200–720 nm, was used to record the signal of the optical emission from the chalcopyrite plasma. Recorded optical spectrum revealed the presence of Cu and Fe as the major elements while Ca and Na were recognized as the minor elements in the target sample. Quantitative analysis has shown that the relative concentrations of Cu, Fe, and Ca in the sample under study were 58.9%, 40.2%, and 0.9% by weight respectively. However, Na was not quantified due to the unavailability of suitable spectral lines, required for CF-LIBS analysis. Results obtained by CF-LIBS were validated by X-ray fluorescence (XRF) analysis, which showed the presence of five compositional elements viz. Cu, Fe, Si, Se and Ag with weight percentages of 58.1%, 35.4%, 5.7%, 0.7%, and 0.1% respectively. These results endorse the effectiveness of the CF-LIBS technique for quantitative analysis of major elements, however, its usefulness in case of minor and trace elements needs further improvement.
1. Introduction
Chalcopyrite belongs to an economically important class of minerals and looks like gold, it is also known as Fool’s Gold. It is considered as one of the primary and major sources of copper (Cu) production globally [1]. It is a brass-yellow colored sulfide mineral with chemical formula (CuFeS2), and it crystalizes into a tetragonal structure, having metallic luster and high specific gravity [2]. It mainly occurs in metalliferous veins and metamorphic and igneous rocks. Chalcopyrite is among I-III-VI2 type semiconductors and owing to its structure, face-centered tetragonal lattice, it is considered one of the most stable minerals [3]. The superior conduction properties of copper makes it an essential material for the fabrication of wide range of electric equipments such as wiring and motors, as well as craft tools and weapons. Copper concentrate and slag produced during the process of copper extraction from chalcopyrite contain precious elements such as silver (Ag) and gold (Au), which further elevates the economic value of this mineral [4]. Copper is also playing a key role in the development of renewable non-conventional sources of energy such as solar energy. Materials from the chalcopyrite family have found very important applications in the development of high efficiency solar cells because of their high internal quantum efficiencies and adsorption coefficients [5]. Chalcopyrite-based solar cells have achieved a great landmark of the highest power conversion efficiency of about 22.3% [6].
The determination of the elemental composition of a mineral is of prime importance for the identification, classification and extraction of minerals. For this purpose, various elemental analysis techniques, destructive or micro destructive, such as energy dispersive X-ray spectroscopy (EDX), atomic absorption spectroscopy (AAS), X-ray fluorescence (XRF), inductively coupled plasma mass spectrometry (ICP-MS), electron probe micro analyzer with wavelength dispersive spectrometers (EMPA-WDS), and Raman spectroscopy are deployed. With theoretical and experimental advances, the laser-induced breakdown spectroscopy (LIBS) technique has been developed into a powerful alternative and widely applied analytical technique. A few advantages of LIBS over the conventional analytical techniques can be listed, such as simultaneous identification of elements, requirement of nominal or no prior sample preparation, in-situ analysis, capability of analyzing liquid, gas and solid samples, fast response, identification of lighter elements, element identification in real time and low detection limit down to ppm or even better [7,8]. One of the fascinating features of LIBS is its use in the laboratories, industry, and in the field for close-in analysis or at standoff distances for both qualitative as well as quantitative elemental analysis [9]. The cost of a LIBS system depends on the choice of its components such as lasers, spectrometers and the optics but its overall cost is lower than aforementioned analytical techniques [9]. Gaining these benefits makes LIBS a preferable detection method for the field samples.
LIBS involves generation of a transient plasma plume on surface of the target sample by a focused laser radiation of sufficient fluence. The excited atoms in the plasma de-excite to their ground levels by emitting characteristic optical radiation. The spectral line of optical emission from the plasma is unique for each compositional element of the sample and the measurement of this emission spectrum reveals the identity of the corresponding element [10,11]. Geo-materials in large numbers including carbonates, rocks and metals from mixed mineral groups, such as feldspars, beryls, and pyroxenes, were comprehensively studied by employing the LIBS technique [12,13,14,15].
For the purpose of quantitative analysis, calibration and calibration-free LIBS methods were employed as the standard tools for reliable identification of field samples. The calibration method involves the drawing of calibration curves for reference elements and optical emission spectrum of the corresponding element is compared with the curve so drawn [16,17]. Whereas in calibration free-LIBS (CF-LIBS) methodology, the intensity of the spectral lines and the plasma parameters are utilized for quantification [18,19]. In the calibration method, the requirement of many calibration curves and uncertainties related to matrix effect makes it less attractive for analysis of multi-elemental geomaterials [20,21]. Being more theoretical and free from errors associated with the matrix effect, the CF-LIBS technique is considered the most suitable approach for carrying out quantitative analysis of multi elemental materials such as minerals. Previously, the CF-LIBS technique had been adopted for compositional analysis of meteorites and other extraterrestrial objects [22,23]. The quantitative analysis of quartz-bearing limestone using the CF-LIBS technique has been previously reported [24]. Malachite, a copper-bearing mineral, was also quantified using CF-LIBS methodology [25]. The same technique was adopted for the quantification of granite rock [26].
LIBS was applied in near vacuum ultra violet region (VUV) for the identification and classification of sulfide minerals, including pyrite, chalcopyrite, pyrrhotite, barite, sphalerite, calcite, and dolomite present in sulfur bearing drill core samples [27]. A combination of LIBS and Raman spectroscopy was chosen for studying the emission spectra from calcite, gypsum, sulfur, pyrite, and chalcopyrite, both in air and simulated martian atmosphere [28]. Recently, LIBS was employed for quantitative analysis of Cu bearing sulfide minerals including chalcopyrite by using the calibration method and chemometric techniques [29,30].
To the extent of our knowledge, no study exists describing the quantitative analysis of chalcopyrite by CF-LIBS. The objective of this study was to utilize CF-LIBS methodology, which is easier, free from matrix effects and needs no reference sample, unlike the calibration method, to determine the elemental composition of industrially-important mineral chalcopyrite of local origin. This study seems to pave the way for the commissioning of the LIBS technique for the mineral exploration in the country. The largest known copper reserves in Pakistan are located in Baluchistan province [31] and reserves in the area of Neelum valley of Azad Jammu and Kashmir are not well known. This research work will also help in attracting the attention of the mining industry towards copper extraction from these areas.
2. Experimental
2.1. Study Area
A chalcopyrite sample was taken from Salkhala region situated in Neelum valley district of Azad Jammu and Kashmir, Pakistan. This area, on the northern side of the country comprises of two tectonic units: lesser Himalayan crystalline (LHC) and higher Himalayan crystalline (HHC) [32]. Both units are separated by the main central thrust (MCT), characterized by same stratigraphy, and share a common low-grade metamorphic assemblage.
2.2. Sample Preparation
The sample collected from the local area was homogenized by grinded into fine powder form and pressed into a solidified pellet target at pressure of 30 bar with the help of a pellet presser for 20 min. The pellet of diameter 20 mm and thickness 3 mm prepared in this way was used as a target for laser radiation to induce plasma. A portion of the same sample in powder form was utilized for XRF analysis.
2.3. Experimental Arrangement
Details of the experimental arrangement can be found elsewhere [25]. Briefly, a Q switched Nd:YAG laser (Brilliant, Quantel, Les Ulis CEDEX, France) with 532 nm wavelength, 5 ns pulse width and repetition rate of 10 Hz was employed as a source of plasma excitation. This laser system was capable of delivering energy up to 200 mJ. The chalcopyrite pellet was mounted on a x,y,z translational stage and position of laser spot on target was varied in order to avoid crater formation and to reduce the effect of sample heterogeneity. With the help of a quartz lens (f = 20 cm), the laser beam was perpendicularly focused on smooth surface of the chalopyrite target. The diameter of the laser spot on the target surface was 0.55 mm as measured with the help of an optical microscope. Laser pulse energy of 120 mJ corresponding to laser irradiance of 1.0 × 10¹⁰ W/cm2 was used in plasma generation from the target. Thje energy of the laser pulse was measured with the help of a joule-meter (Nova Quantel P/niz01507).
The optical signal from chalcopyrite plasma was registered by collecting radiation from the plasma with the help of an optical fiber of high-OH, core diameter of 600 μm, and collimating lens of 0–45° field of view, and coupling it with the LIBS2000+ (Ocean Optics. Inc., Largo, FL, USA) system comprised of five spectrometers (slit width = 5 µm) which cover the 200 to 720 nm spectral range. Each spectrometer installed in the LIBS2000+ detection system was outfitted with 2048 element linear charge coupled device CCD array with a spectral resolution of ≈ 0.06 nm. Detection system was synchronized with Q-switch of the Nd:YAG laser with the help of digital delay generator (SRS DG 535). Delay time between the firing of the laser pulse and the detection system opening was set at 3 μs to eliminate the contribution of continuum radiation to the desired emission spectrum. Plasma was found to be sufficiently homogeneous for a time window of greater than 2 μs. Data was acquired using single laser shot mode and integration time for detector was 2.1 ms. For the purpose of minimizing statistical errors, output data was averaged for 20 laser shots. The detection system was calibrated in wavelength by recording the well-known emission lines of mercury, argon and neon in the spectral range of 200–720 nm. Spectrometers installed in the LIBS2000+ system were manufacturer-calibrated in efficiency using the DH-2000-CAL standard light source. Data was acquired by all five spectrometers simultaneously and stored by computer with the help of OOILIBS software. The dark signal of the detector was subtracted from the recorded spectrum. The experimental arrangement is shown with the help of a schematic diagram in Figure 1.
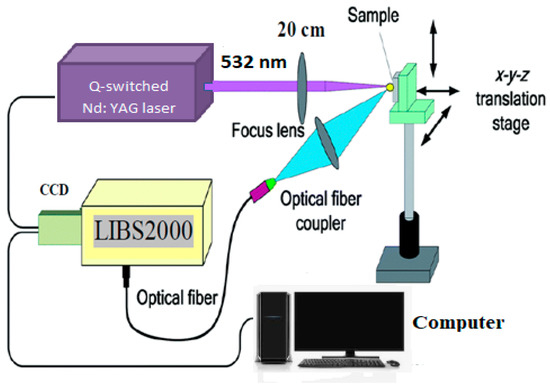
Figure 1.
Schematic arrangement for LIBS2000+ detection system, showing the laser focused beam, plasma plume, and optical routing and detection of emission line from the plasma.
3. Results
3.1. Qualitative Analysis
The recorded optical emission spectrum of the chalcopyrite sample is shown in Figure 2. By comparing the values of the wavelength in units of nm with spectroscopic data available online from the National Institute of Standard and Technology, USA, (NIST), the spectral lines belonging to different elements were identified [33]. It was found that the chalcopyrite spectrum is dominated by the spectral lines of just two elements, Fe and Cu. This result was expected because of the chemical composition of chalcopyrite, i.e., CuFeS2. However, sulfur (S) was not identified in the spectrum, which was not surprising because of the spectral limitation of the detection system. Most of the intense lines of S lie in vacuum ultraviolet (VUV) region, 10–200 nm and these lines fall outside the spectral range of spectrometer used in this study [24]. Iron is known for its busy spectrum, having almost 13,114 lines in the region of 200–700 nm [28]. Thus, it was very difficult to identify each Fe line in the spectrum, however, a large number of Fe lines were identified. Overall, 66 lines emitted from the neutral Fe-I atoms and 9 coming from the singly ionized Fe-II atoms were recognized. The spectral line at 438.58 nm was the strongest line observed for Fe-I in the spectrum. Total of 25 Cu-I lines and 8 Cu-II lines were identified and the spectral line of Cu-I at 521.80 nm was found to be the most intense line in the entire spectrum. In addition to Fe and Cu, the spectrum also contained 5 low-intensity lines of Ca-I and 2 lines of Ca-II, with the most intense line at 397.01 nm, belonging to Ca-II. Minor sodium-D lines at 588.96 nm and 589.54 nm were also noticed. One hydrogen (H) line at 656.42 nm, known as Hα, was identified. This line may have appeared from air contribution or hydrogen content within the sample. All of the identified spectral lines of various elements are listed in Table 1. The presence of any element in a material can be confirmed by appearance of its few strong and persistent lines in optical emission spectrum and these lines can be termed as fingerprints of that element. Figure 3a,b displays a few strong lines belonging to Fe and Cu respectively, which are the fingerprints of these two elements. These lines include Fe-I lines at 438.58 nm and 440.60 nm and Cu-I lines at 510.82, 515.30, and 521.80 nm.
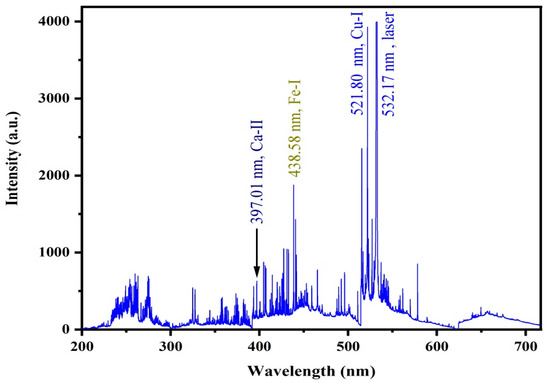
Figure 2.
Optical emission spectrum of chalcopyrite plasma recorded in the spectral range of 200–720 nm.

Table 1.
Identified spectral lines of different elements in emission spectrum of chalcopyrite.
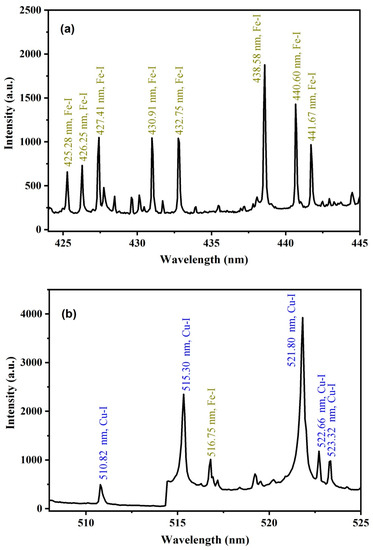
Figure 3.
Optical emission spectra of chalcopyrite plasma in the range of (a) 425–445 nm and (b) 510–525 nm containing the signature lines of Fe and Cu respectively.
3.2. Quantitative Analysis
The CF-LIBS method was adopted for quantification of chalcopyrite sample [19]. Prerequisites for application of this technique include fulfillment of local thermodynamic equilibrium (LTE) condition, optically thin plasma and stoichiometric ablation [18,19].
3.2.1. Electron Temperature
A popular method of drawing a Boltzmann plot was utilized for estimation of the plasma electron temperature. Following expression was used to draw the plot [22]:
In this equation, I, λ, A, g, N(t), U(t), Ek, K, and Te represent integrated line intensity of the transition, wavelength of spectral line, probability of transition, statistical weight of upper level (k), total number density, partition function, energy of upper level, Boltzmann constant and electron temperature, respectively. Electron temperature of the plasma can be extracted from the slope of the straight line, −1/kTe, obtained by plotting ln against the upper level energy Ek. Uncertainty of about ±5%, caused by errors in the measurement of transition probabilities and integrated line intensities, arose in the estimated value of temperature. A Boltzmann plot was drawn by using the spectroscopic data of atomic emission lines of Cu-I at 249.38 nm, 427.38 nm, 515.30 nm, 521.80 nm, and 578.19 nm, as shown in Figure 4. The value of extracted electron temperature (Te) was found to be 11,314 ± 566 K and this value was subsequently used in further calculations.
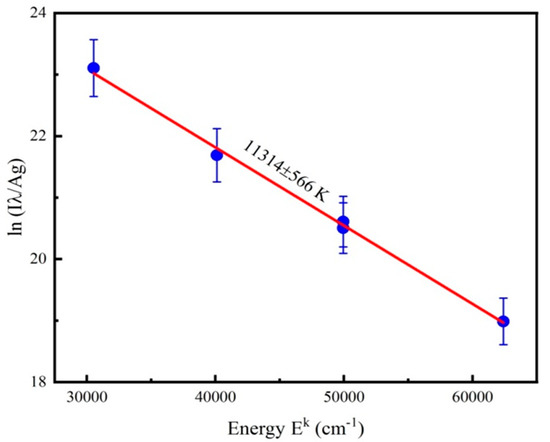
Figure 4.
Boltzmann plot drawn using spectral lines of Cu-I.
3.2.2. Electron Number Density
For determination the electron number density (ne) of the plasma, the Stark broadened line profile technique was utilized for the selected spectral lines, emitted from either atomic or singly ionized atoms. The following simplified expression was used for calculation of ne [34,35]:
Here is the stark broadening parameter, is the value of full width at half maximum (FWHM) of selected spectral line and nr is the reference value of density, which is 1016 for atomic lines and 1017 for singly ionized lines. FWHM values of used lines were calculated by fitting the Lorentzian function and values so obtained were used in Equation (2) after subtracting the instrumental width of 0.06 nm from these values. The stark broadening parameters were taken from reported literature [36]. The lines of Ca-I at 422.85 nm, Ca-II at 397.01 nm, Fe-I at 438.58 nm and Cu-I at 578.19 nm were selected for ne calculations and an average value of 1.01 × 1018 cm−3 was obtained. The stark broadened profile of one of the selected lines, 438.58 nm of Fe-I, is shown in Figure 5.
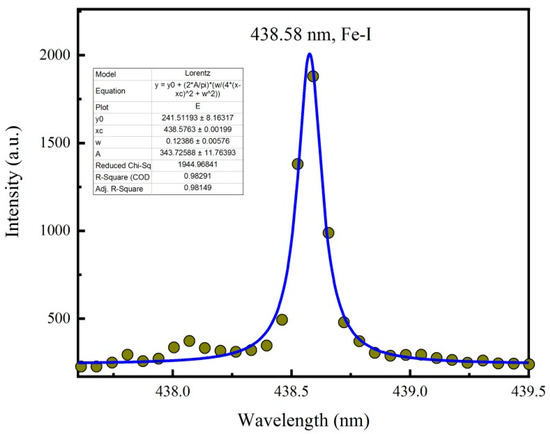
Figure 5.
Stark broadened line profile of Fe-I line at 438.58 nm.
3.2.3. Validity of Local Thermodynamic Equilibrium Assumption
For fulfillment of the conditions of local thermodynamic equilibrium (LTE), the population and depopulation of atomic states must be driven predominantly by electron collisions instead of radiation. To serve this purpose, a sufficient value of ne is required. This threshold value of ne can be estimated from the McWhirter criterion, which provides a necessary condition for existence of LTE [17,37]:
In this expression, Te and ∆E stand for electron temperature and energy difference between the involved energy states expected to be in LTE, respectively. For Fe-I line at 438.58 nm and Cu-I line at 521.80 nm, energy difference between states are ∆E = 2.83 eV and ∆E = 2.37 eV, respectively. For these values of energy difference and plasma temperature of 11,314 ± 566 K, Equation (3) gives ne () ≥ 6.13 × and 2.3 × . The value of experimentally calculated ne is much higher than the estimated values from Equation (3), hence it can be assumed that the condition of LTE exists in the plasma under investigation. This criterion has also been checked for many other lines of Fe, Cu, and Ca, identified in Chalcopyrite spectrum, and found to be fulfilled for all the used spectral lines.
3.2.4. Optically Thin Plasma
The intensity ratio method can be applied for verification of condition for optically thin plasma. For this purpose, the following expression was used [38]:
Here and are the experimentally-calculated intensities of a pair of selected spectral lines and E1 and E2 are corresponding upper level energies of these lines. In this method, a couple of lines having same or closely matched values of upper level energy are selected and the ratio of experimentally determined intensities of the selected lines is taken. Selection of such lines reduces the exponential factor on the right hand side of Equation (4) to unity and the theoretical value of the intensity ratio is found using the spectroscopic data of these lines. A pair of lines of Cu-I at 515.30 nm and 521.80 nm were carefully chosen and the experimental and theoretical intensity ratios of selected lines were found to be 0.48 and 0.54 respectively, which are in close agreement. This result validates the condition of optically thin plasma.
3.2.5. Stoichiometric Ablation
If the value of laser irradiance at the target surface is greater than 109 Wcm−2, then laser ablation can be called stoichiometric [39]. Current experiment was performed at laser irradiance of 1.0 × 10¹⁰ Wcm−2 that was a sufficient value for stoichiometric ablation.
3.2.6. Calibration-Free Analysis
For quantification of the chalcopyrite sample, a few emission lines of the elements identified in the sample were selected. Line selection was made on the basis of criteria given in [19]. The chosen lines of Cu-I, Fe-I, and Ca-I, along with their relevant spectroscopic parameters, are listed in Table 2. No suitable line of Na was found for quantification. The following expression has been used for the calculation of atomic number density of neutral atoms of different elements in plasma:
where is the partition function of the neutral atoms, and is the energy of upper level, and other parameters are the same as already mentioned.
Table 2.
Optical parameters of chosen emission lines of different compositional elements of Chalcopyrite sample used for calibration free analysis.
Number density of singly ionized atoms was estimated using Saha equation [40]:
where, , , and are atomic number density, partition functions of singly ionized atoms at calculated Te, and ionization potential of elements, respectively. Total relative atomic number density of elements was obtained by adding values of as calculated by Equation (6) in values of as calculated by Equation (5).
The relative weight of each element was estimated by multiplying the relative atomic number density of each element with the atomic weight of the corresponding element, i.e., (). The elemental weights so obtained were added together, and then the corresponding sum, (), was used to determine the weight percentage of compositional elements by using the following formula:
Theoretical calculations revealed that relative concentrations of Cu, Fe, and Ca in the chalcopyrite sample were 58.9%, 40.2%, and 0.9% by weight respectively. To validate the quantitative results as obtained using CF-LIBS analysis, X-ray fluorescence (XRF) analysis was performed on the same sample. Before analysis of multi-elemental chalcopyrite mineral, the energy calibration of the equipment was carried out using standard material JSX-3200. The XRF analysis showed the presence of five compositional elements in the investigated sample viz. Cu, Fe, Si, Se, and Ag, with weight percentages of 58.1%, 35.4%, 5.7%, 0.7%, and 0.1% respectively. To compare quantitative results of CF-LIBS results with those obtained using XRF, the concentration of sulfur in XRF analysis was ignored. Results obtained with CF-LIBS and XRF are presented in Figure 6.
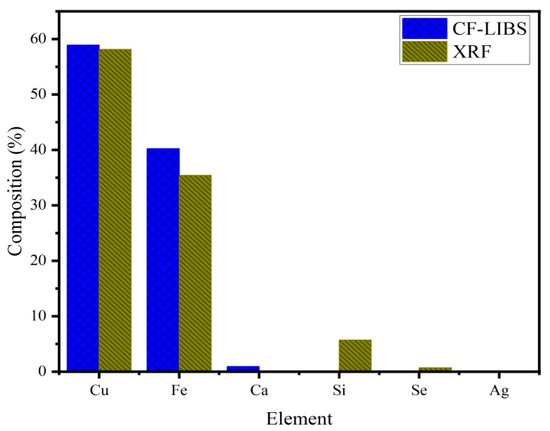
Figure 6.
Elemental composition of Chalcopyrite sample measured with CF-LIBS and XRF techniques.
4. Discussion
Chalcopyrite is one of the economically important minerals, not only because of its copper content, but also due to presence of other precious elements as impurities such as Au, Ag, Se, and Ti [41,42]. In XRF analysis, Si was detected with a weight percentage of 5.7%, while Se and Ag were identified as minor elements with concentrations of about 0.7% and 0.1% by weight. However, these elements could not be spotted in the LIBS spectrum. Similarly, Ca was detected with LIBS and quantified as 0.9% by weight, whereas it could not be measured by XRF. This difference in results obtained by these two techniques can be attributed to variation in concentration of different elements at various points of the sample surface. To reduce this inhomogeneity, the sample was grinded and pressed into pellet form, but it was still very hard to remove it completely. In addition, in case of minor elements such as Se and Ag, it is possible that concentrations of these elements in the chalcopyrite sample will be lower than the limit of detection of the LIBS setup used in this experiment. However, the CF-LIBS technique proved to be effective in measuring the concentration of major elements, Cu and Fe, with reasonably good accuracy. To improve the sensitivity of LIBS, different techniques such as microwave-assisted LIBS, magnetic field-assisted LIBS, and the use of double pulse, resonant laser, spark discharge, and long pulse lasers can be employed. Utilizing these techniques can help in making CF-LIBS a suitable tool for elemental analysis of geological materials of unknown elemental composition in significantly low concentrations.
Copper concentrations of about 58% by weight, as confirmed by both CF-LIBS and XRF analysis, reveals that the chalcopyrite sample analyzed is a high-grade Cu bearing mineral, which is desirable in the mineral industry. The presence of Ag and Se in trace amounts enhances further the economic value of chalcopyrite found in the area of Neelum valley. LIBS has the ability to show excellent quantitative results using calibration methods, provided the availability of matrix-matched reference materials. Mostly, in case of geological samples, reference materials are not available, and this fact hinders the use of the calibration method for quantification of geological sample of unknown composition [43]. In this scenario, the CF-LIBS method appears to be a suitable and effective alternative to the calibration method. In some previous studies, the CF-LIBS method was utilized for measurement of elemental composition of geological samples such as limestone, granite, malachite, and nephrite, and results were compared with standard techniques such as energy dispersive X-ray spectroscopy (EDX), X-ray fluorescence (XRF), and laser ablation-time of flight-mass spectrometer (LA-TOF-MS) [24,25,26,44,45]. In all of these studies, quantitative results obtained with CF-LIBS showed reasonable agreement with the standard analytical techniques. Hence, it can be concluded that without the availability of a suitable reference material, CF-LIBS analysis of multi-elemental minerals can still give very good quantitative results, and the method can be used for real applications in mineral extraction and exploration.
5. Conclusions
Compositional analysis of chalcopyrite, a primary ore of copper, of local origin, was performed using calibration-free laser-induced breakdown spectroscopy (CF-LIBS) techniques. Plasma parameters such as electron temperature and number density were calculated, and conditions of optically thin plasma and local thermodynamic equilibrium were verified, which were perquisites of the CF-LIBS technique. The LIBS spectrum revealed the presence of four elements viz., Cu, Fe, Ca, and Na. Quantitative analysis gave the relative concentrations of Cu, Fe, and Ca as 58.9%, 40.2%, and 0.9% by weight respectively. X-ray fluorescence (XRF) showed the presence of five compositional elements viz. Cu, Fe, Si, Se, and Ag, with weight percentages of 58.1%, 35.4%, 5.7%, 0.7%, and 0.1% respectively. A comparison of the results obtained using CF-LIBS and XRF techniques displayed that quantitative results of major elements of Cu and Fe were in close agreement, whereas the techniques differed in qualitative and quantitative results for minor elements. This result shows the effectiveness of CF-LIBS methodology in the quantification of at least major elements of multi-elemental geological samples without the requirement of reference material and resorting to the tedious and time-consuming calibration method. In general, this application of the CF-LIBS technique can be extended for quantitative analysis of a range of multi-elemental samples. This research work might be useful for scientists and engineers working in the areas of geology, mineralogy, chemistry, and spectroscopy.
Author Contributions
Conceptualization, M.H., S.A.A. and A.A.; methodology, A.A.; validation, T.M.K.; formal analysis, M.H., S.A.A. and A.A.; investigation, M.H., S.A.A. and A.A.; resources, M.H. and M.R.I.F.; data curation, A.A., N.H.; writing—original draft preparation, M.H., S.A.A. and A.A.; writing—review and editing, M.R., T.M.K., P.A., M.U.K.; visualization, P.A., M.U.K.; supervision, M.H. and S.A.A.; project administration, M.H., S.A.A. and M.R.I.F.; funding acquisition, M.R.I.F. All authors have read and agreed to the published version of the manuscript.
Funding
This work was supported by the Research Universiti Grant, Universiti Kebangsaan Malaysia, Geran Universiti Penyelidikan (GUP), code: 2018-134.
Acknowledgments
We are extremely thankful to Raheel Ali, Quaid-i-Azam University Islamabad for providing laboratory facility at Atomic and molecular Physics Laboratory to perform this experiment. This work was supported by the Research Universiti Grant, Universiti Kebangsaan Malaysia, Geran Universiti Penyelidikan (GUP), code: 2018-134.
Conflicts of Interest
The authors declare that they have no conflict of interest.
References
- Nesse, W.D. Introduction to Mineralogy; Oxford University Press: Oxford, UK, 2000; pp. 1–10. [Google Scholar]
- Baba, A.A.; Ayinla, K.I.; Adekola, F.A.; Ghosh, M.K.; Ayanda, O.S.; Bale, R.B.; Sheik, A.R.; Pradhan, S.R. A review on novel techniques for chalcopyrite ore processing. Int. J. Min. Eng. Miner. Process. 2012, 1, 1–16. [Google Scholar] [CrossRef]
- Tao, H.; Dongwei, L. Presentation on mechanisms and applications of chalcopyrite and pyrite bioleaching in biohydrometallurgy—A presentation. Biotechnol. Rep. 2014, 4, 107–119. [Google Scholar] [CrossRef] [PubMed]
- Muthumariappan, S.; David, S.A. Precious metal content in copper concentrate and slag. Int. J. Eng. Res. Manag. Technol. 2019, 9, 3493–3501. [Google Scholar]
- Guo, W.; Liu, B. Liquid-phase pulsed laser ablation and electrophoretic deposition for chalcopyrite thin-film solar cell application. Acs. Appl. Mater. Interfaces 2012, 4, 7036–7042. [Google Scholar] [CrossRef]
- Kamada, R.; Yagioka, T.; Adachi, S.; Handa, A.; Tai, K.F.; Kato, T.; Sugimoto, H. New world record Cu (In, Ga)(Se, S) 2 thin film solar cell efficiency beyond 22%. In Proceedings of the 43rd Photovoltaic Specialists Conference, Portland, OR, USA, 5–10 June 2016; pp. 1287–1291. [Google Scholar]
- Radziemski, L.; Cremers, D. A brief history of laser-induced breakdown spectroscopy: From the concept of atoms to LIBS. Spectrochim. Acta Part B At. Spectrosc. 2013, 87, 3–10. [Google Scholar] [CrossRef]
- Rusak, D.A.; Castle, B.C.; Smith, B.W.; Winefordner, J.D. Fundamentals and applications of laser-induced breakdown spectroscopy. Crit. Rev. Anal. Chem. 1997, 27, 257–290. [Google Scholar] [CrossRef]
- Hark, R.R.; Harmon, R.S. Geochemical fingerprinting using LIBS. In Laser-Induced Breakdown Spectroscopy; Springer: Berlin/Heidelberg, Germany, 2014. [Google Scholar]
- Ying, M.; Xia, Y.; Sun, Y.; Zhao, M.; Ma, Y.; Liu, X.; Li, Y.; Hou, X. Plasma properties of a laser-ablated aluminum target in air. Laser Part. Beams. 2003, 21, 97–101. [Google Scholar] [CrossRef]
- Fortes, F.J.; Moros, J.; Lucena, P.; Cabalín, L.M.; Laserna, J.J. Laser-induced breakdown spectroscopy. Anal. Chem. 2013, 85, 640–669. [Google Scholar] [CrossRef]
- Sebakhy, K.O.; Vitale, G.; Pereira-Almao, P.A. Dispersed Ni-Doped Aegirine Nanocatalysts for the Selective Hydrogenation of Olefinic Molecules. ACS Appl. Nano Mater. 2018, 1, 6269–6280. [Google Scholar] [CrossRef]
- Harmon, R.S.; Russo, R.E.; Hark, R.R. Applications of laser-induced breakdown spectroscopy for geochemical and environmental analysis: A comprehensive review. Spectrochim. Acta Part B At. Spectrosc. 2013, 87, 11–26. [Google Scholar] [CrossRef]
- Harmon, R.S.; Remus, J.; McMillan, N.J.; McManus, C.; Collins, L.; Gottfried, J.L., Jr.; DeLucia, F.C.; Miziolek, A.W. LIBS analysis of geomaterials: Geochemical fingerprinting for the rapid analysis and discrimination of minerals. J. Appl. Geochem. 2009, 24, 1125–1141. [Google Scholar] [CrossRef]
- McMillan, N.J.; Harmon, R.S.; De Lucia, F.C.; Miziolek, A.M. Laser-induced breakdown spectroscopy analysis of minerals: Carbonates and silicates. Spectrochim. Acta Part B At. Spectrosc. 2007, 62, 1528–1536. [Google Scholar] [CrossRef]
- Gonzcález, A.; Ortiz, M.; Campos, J. Determination of sulfur content in steel by laser-produced plasma atomic emission spectroscopy. Appl. Spectrosc. 1995, 49, 1632–1635. [Google Scholar] [CrossRef]
- Sabsabi, M.; Cielo, P. Quantitative analysis of aluminum alloys by laser-induced breakdown spectroscopy and plasma characterization. Appl. Spectrosc. 1995, 49, 499–507. [Google Scholar] [CrossRef]
- Ciucci, A.; Corsi, M.; Palleschi, V.; Rastelli, S.; Salvetti, A.; Tognoni, E. New procedure for quantitative elemental analysis by laser-induced plasma spectroscopy. Appl. Spectrosc. 1999, 53, 960–964. [Google Scholar] [CrossRef]
- Giacomo, A.D.; Aglio, M.D.; Pascale, O.D.; Longo, S.; Capitelli, M. Laser induced breakdown spectroscopy on meteorites. Spectrochim. Acta Part B At. Spectrosc. 2007, 62, 1606–1611. [Google Scholar] [CrossRef]
- Pořízka, P.; Demidov, A.; Kaiser, J.; Keivanian, J.; Gornushkin, I.; Panne, U.; Riedel, J. Laser-induced breakdown spectroscopy for in situ qualitative and quantitative analysis of mineral ores. Spectrochim. Acta Part B At. Spectrosc. 2014, 101, 155–163. [Google Scholar] [CrossRef]
- Meng, D.; Zhao, N.; Ma, M.; Fang, L.; Gu, Y.; Jia, Y.; Liu, J.; Liu, W. Application of a mobile laser-induced breakdown spectroscopy system to detect heavy metal elements in soil. Appl. Opt. 2017, 56, 5204–5210. [Google Scholar] [CrossRef]
- Thompson, J.R.; Wiens, R.C.; Barefield, J.E.; Vaniman, D.T.; Newsom, H.E.; Clegg, S.M. Remote laser-induced breakdown spectroscopy analyses of Dar al Gani 476 and Zagami Martian meteorites. J. Geophys. Res. Planets 2006, 111, E5. [Google Scholar] [CrossRef]
- Aglio, M.D.; Giacomo, A.D.; Gaudiuso, R.; Pascale, O.D.; Senesi, G.S.; Longo, S. Laser Induced Breakdown Spectroscopy applications to meteorites: Chemical analysis and composition profiles. Geochim. Cosmochim. Acta 2010, 74, 7329–7339. [Google Scholar]
- Fahad, M.; Farooq, Z.; Abrar, M. Comparative study of calibration-free laser-induced breakdown spectroscopy methods for quantitative elemental analysis of quartz-bearing limestone. Appl. Opt. 2019, 58, 3501–3508. [Google Scholar] [CrossRef] [PubMed]
- Hafeez, M.; Abbasi, S.A.; Rafique, M.; Hayder, R.; Sajid, M.; Iqbal, J.; Ahmad, N.; Shahida, S. Calibration-free laser-induced breakdown spectroscopic analysis of copper-rich mineral collected from the Gilgit-Baltistan region of Pakistan. Appl. Opt. 2020, 59, 68–76. [Google Scholar] [CrossRef] [PubMed]
- Umar, Z.A.; Ahmed, N.; Ahmed, R.; Liaqat, U.; Baig, M.A. Elemental composition analysis of granite rocks using LIBS and LA-TOF-MS. Appl. Opt. 2018, 57, 4985–4991. [Google Scholar] [CrossRef] [PubMed]
- Kaski, S.; Häkkänen, H.; Tommola, J.K. Sulfide mineral identification using laser-induced plasma spectroscopy. Miner. Eng. 2003, 16, 1239–1243. [Google Scholar] [CrossRef]
- Sharma, S.K.; Misra, A.K.; Lucey, P.G.; Wiens, R.C.; Clegg, S.M. Combined remote LIBS and Raman spectroscopy at 8.6 m of sulfur-containing minerals, and minerals coated with hematite or covered with basaltic dust. Spectrochim. Acta Part A Mol. Biomol. Spectrosc. 2007, 68, 1036–1045. [Google Scholar] [CrossRef]
- Haddad, J.E.; Filho, E.S.D.L.; Vanier, F.; Harhira, A.; Padioleau, C.; Sabsabi, M.; Wilkie, G.; Blouin, A. Multiphase mineral identification and quantification by laser-induced breakdown spectroscopy. Miner. Eng. 2019, 134, 281–290. [Google Scholar] [CrossRef]
- Álvarez, J.; Velásquez, M.; Myakalwar, A.K.; Sandoval, C.; Fuentes, R.; Castillo, R.; Sbarbaro, D.; Yáñez, J. Determination of copper-based mineral species by laser induced breakdown spectroscopy and chemometric methods. J. Anal. At. Spectrom. 2019, 34, 2459–2468. [Google Scholar] [CrossRef]
- Shah, S.A.H. Strategy for Mineral Sector Development in Pakistan. Ministry of Planning; Development & Reform Government of Pakistan: Islamabad, Capital Territory, Pakistan, 2018; pp. 1–24. [Google Scholar]
- Malik, R.H.; Schouppe, M.; Fontan, D.; Verkaeren, J.; Martinotti, G.; Shaukat Ahmed, K.H.; Qureshi, S. Geology of the Neelum valley, district Muzaffarabad, Azad Kashmir, Pakistan. Geol. Bull. Univ. Peshawar. 1996, 29, 91–111. [Google Scholar]
- National Institute of Standards and Technology, NIST Atomic Spectra Database Lines Form. Available online: https://physics.nist.gov/PhysRefData/ASD/lines_form.html (accessed on 9 June 2020).
- Zeng, X.; Mao, S.S.; Liu, C.; Mao, X.; Greif, R.; Russo, R.R. Plasma diagnostics during laser ablation in a cavity. Spectrochim. Acta Part B At. Spectrosc. 2003, 58, 867–877. [Google Scholar] [CrossRef]
- Colon, C.; Hatem, G.; Verdugo, E.; Ruiz, P.; Campos, J. Measurement of the Stark broadening and shift parameters for several ultraviolet lines of singly ionized aluminum. J. Appl. Phys. 1993, 73, 4752–4758. [Google Scholar] [CrossRef]
- Stark Broadening Parameters for Neutral and Singly Charged Ions: Helium through Calcium and Cesium. Available online: https://griem.obspm.fr/ (accessed on 4 May 2020).
- Aguilera, J.A.; Aragon, C.A. Comparison of the temperatures and electron densities of laser-produced plasmas obtained in air, argon, and helium at atmospheric pressure. J. Appl. Phys. A 1999, 69, S475–S478. [Google Scholar] [CrossRef]
- Unnikrishnan, V.K.; Alti, K.; Kartha, V.B.; Santhosh, C.; Gupta, G.P.; Suri, B.M. Measurements of plasma temperature and electron density in laser-induced copper plasma by time-resolved spectroscopy of neutral atom and ion emissions. Pramana 2010, 74, 983–993. [Google Scholar] [CrossRef]
- Chan, W.T.; Russo, R.E. Study of laser-material interactions using inductively coupled plasma-atomic emission spectrometry. Spectrochim. Acta Part B At. Spectrosc. 1991, 46, 1471–1486. [Google Scholar] [CrossRef]
- Capitelli, M.; Casavola, A.; Colonna, G.; Giacomo, A.D. Laser-induced plasma expansion: Theoretical and experimental aspects. Spectrochim. Acta Part B At. Spectrosc. 2004, 59, 271–289. [Google Scholar] [CrossRef]
- mindate.org. Available online: https://www.mindat.org/min-955.html (accessed on 28 August 2020).
- Szymanowski, J. Copper hydrometallurgy and extraction from chloride media. J. Radioanal. Nucl. Chem. 1996, 28, 183–194. [Google Scholar] [CrossRef]
- Harmon, R.S.; Lawley, C.J.; Watts, J.; Harraden, C.L.; Somers, A.M.; Hark, R.R. Laser-Induced Breakdown Spectroscopy—An Emerging Analytical Tool for Mineral Exploration. Minerals 2019, 9, 718. [Google Scholar] [CrossRef]
- Abbasi, S.A.; Rafique, M.; Mir, A.A.; Kearfott, K.J.; Khan, S.U.D.; Khan, S.U.D.; Khan, T.M.; Iqbal, J. Quantification of elemental composition of Granite Gneiss collected from Neelum Valley using calibration free laser-induced breakdown and energy-dispersive X-ray spectroscopy. J. Radiat. Res. Appl. 2020, 13, 362–372. [Google Scholar] [CrossRef]
- Umar, Z.A.; Liaqat, U.; Ahmed, R.; Baig, M.A. Classification of nephrite using calibration-free laser induced breakdown spectroscopy (CF–LIBS) with comparison to laser ablation–time-of-flight–mass spectrometry (LA–TOF–MS). Anal. Lett. 2020, 53, 203–216. [Google Scholar] [CrossRef]
© 2020 by the authors. Licensee MDPI, Basel, Switzerland. This article is an open access article distributed under the terms and conditions of the Creative Commons Attribution (CC BY) license (http://creativecommons.org/licenses/by/4.0/).