Article

Verification of an Accommodative Response for Depth Measurement of Floating Hologram Using a Holographic Optical Element

1
Department of Plasma Bio-Display, Kwangwoon University, Seoul 01897, Korea
2
Spatial Computing Convergence Center, Kwangwoon University, Seoul 01897, Korea
3
Graduate School of Smart Convergence, Kwangwoon University, Seoul 01897, Korea
4
Ingenium College, Kwangwoon University, Seoul 01897, Korea
*
Author to whom correspondence should be addressed.
Appl. Sci. 2020, 10(19), 6788; https://doi.org/10.3390/app10196788
Submission received: 31 August 2020 / Revised: 23 September 2020 / Accepted: 24 September 2020 / Published: 28 September 2020
(This article belongs to the Collection Optical Design and Engineering)

Abstract

:
Floating holograms using holographic optical element screens differ from existing systems because they can float 2D images in the air and provide a sense of depth. Until now, the verification of such displays has been conducted only on the system implementation, and only the diffraction efficiency and angle of view of the hologram have been verified. Although such displays can be directly observed with the human eye, the eye’s control ability has not been quantitatively verified. In this study, we verified that the focus of the observer coincided with the appropriate depth value determined with experiments. This was achieved by measuring the amount of control reaction from the perspective of the observer on the image of the floating hologram using a holographic optical element (HOE). An autorefractor was used, and we confirmed that an image with a sense of depth can be observed from the interaction of the observer’s focus and convergence on the 2D floating image using a HOE. Thus, the realization of content with a sense of depth of 2D projected images using a HOE in terms of human factors was quantitatively verified.

1. Introduction

When a floating hologram is seen by an observer using a reflector, it appears as if a 2D image is floating in the air. This is also called a projection hologram, and is used not only for concerts and musical performances, but also in augmented reality (AR) systems for fighters and in head-up display (HUD) systems for automobiles [1]. A floating hologram uses a half-mirror system [2]. However, this system has a limitation in image size, as large floating holograms must have a screen that is equal to the display size. Thus, it is difficult to implement a sense of depth because the screen must be projected from a long distance from the half mirror, which is also an inevitable part of the system’s enlargement [3]. This limitation can be solved with a holographic optical element (HOE) such as a holographic lens, which is developed using holography. A HOE is recorded by using two laser beams, i.e., an object beam and a reference beam, which interfere in the volume of the holographic film. During recording, the object beam is shaped by introducing the lens on the beam path. During reconstruction by illumination with the reference beam, a holographic lens reproduces the refractive power of a lens used in the holographic recording. A system that projects 2D images using a HOE is being studied in companies, institutions, and schools. However, such systems are limited in terms of implementation, and there is currently no system that verifies and evaluates the system from a human factor perspective. To determine this human factor perspective, we attempted to verify the depth of a floating hologram using a HOE. We estimated the change in lens thickness that happens when a person sees an object. This verification meant that the content of focal imaging using a HOE quantitatively verified the control ability of the human eye.

2. Background Theory

The human visual system relies on various factors, such as depth, to perceive the shape of a real object’s three-dimensional (3D) effect. Depth perception refers to obtaining a perception of the distance from the front to the back of a 3D solid. The use of the difference in vision between the eyes to perceive the 3D effect of an object is called stereoscopic vision [4].
In general, there are a number of factors influencing the 3D perception of objects in space. One can perceive depth with the image generated by two eyes and that generated by one eye. When both eyes look at an object, the vision function is automatically adjusted to recognize the distance to the target object. With this recognition of the absolute distance, the functions of accommodation and convergence act, resulting in a natural state in which the same 3D image is obtained.

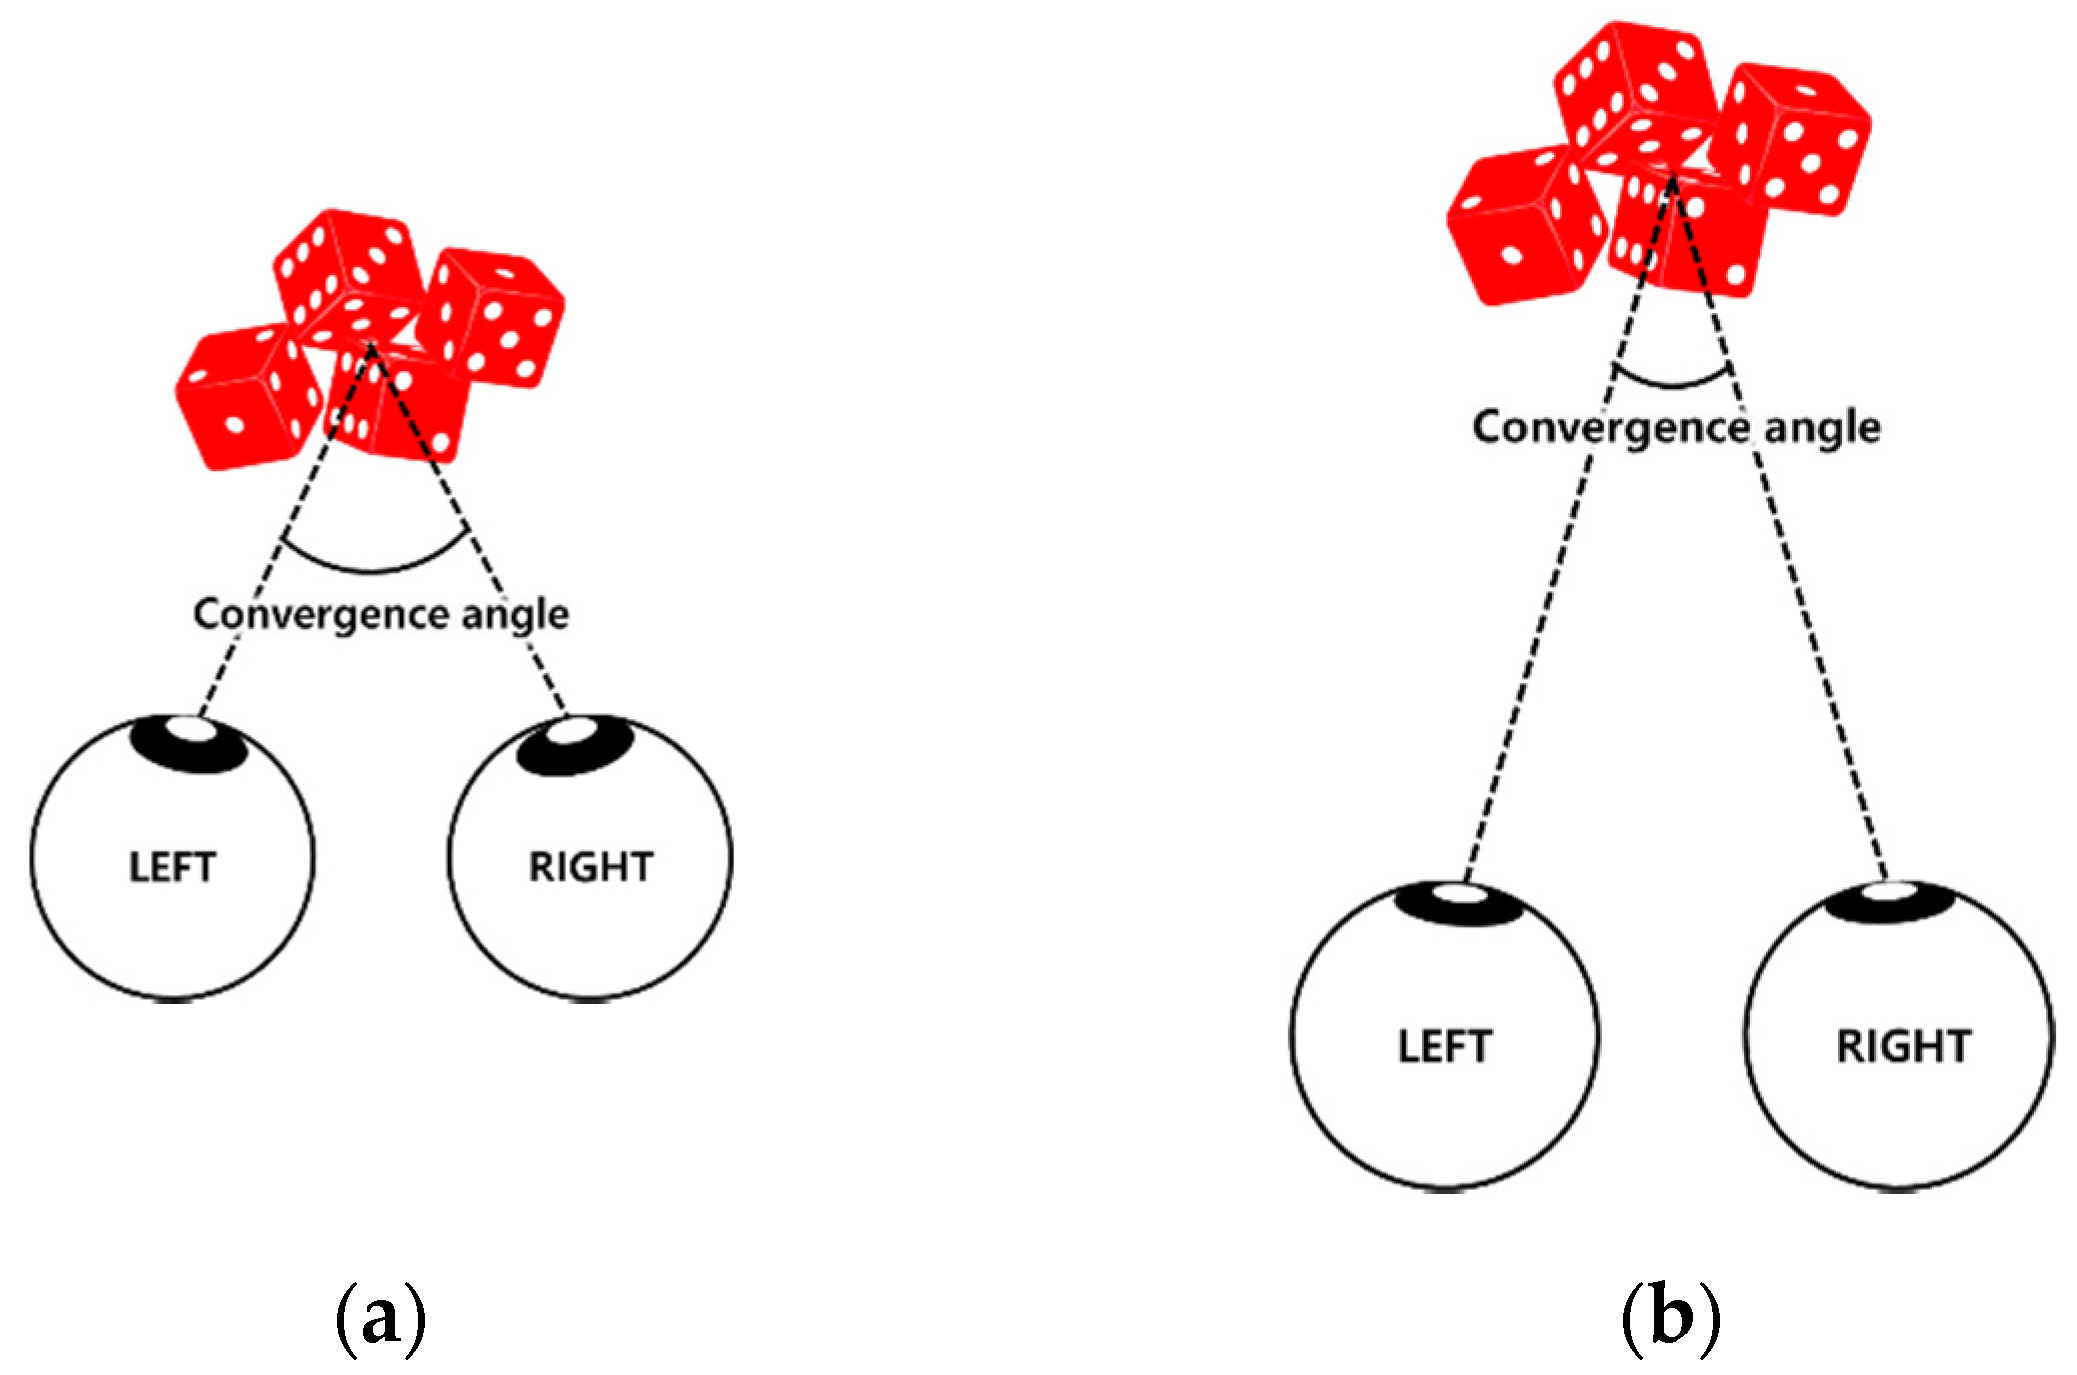
2.1. Convergence Response

Since the structure of the human eye provides a range of vision of up to approximately 6 cm to the left and the right, it allows for the perception of depth. The main factors affecting depth perception are binocular disparity and vergence [5]. Eye movement changes according to the binocular function based on the focus adjustment and the absolute distance to the actual object; moreover, the relative distance can also be recognized. Figure 1a shows that the angle of vergence of both eyes increases when viewing a nearby object. Figure 1b indicates that there is a decrease in the convergence angle when viewing a distant object [6,7].

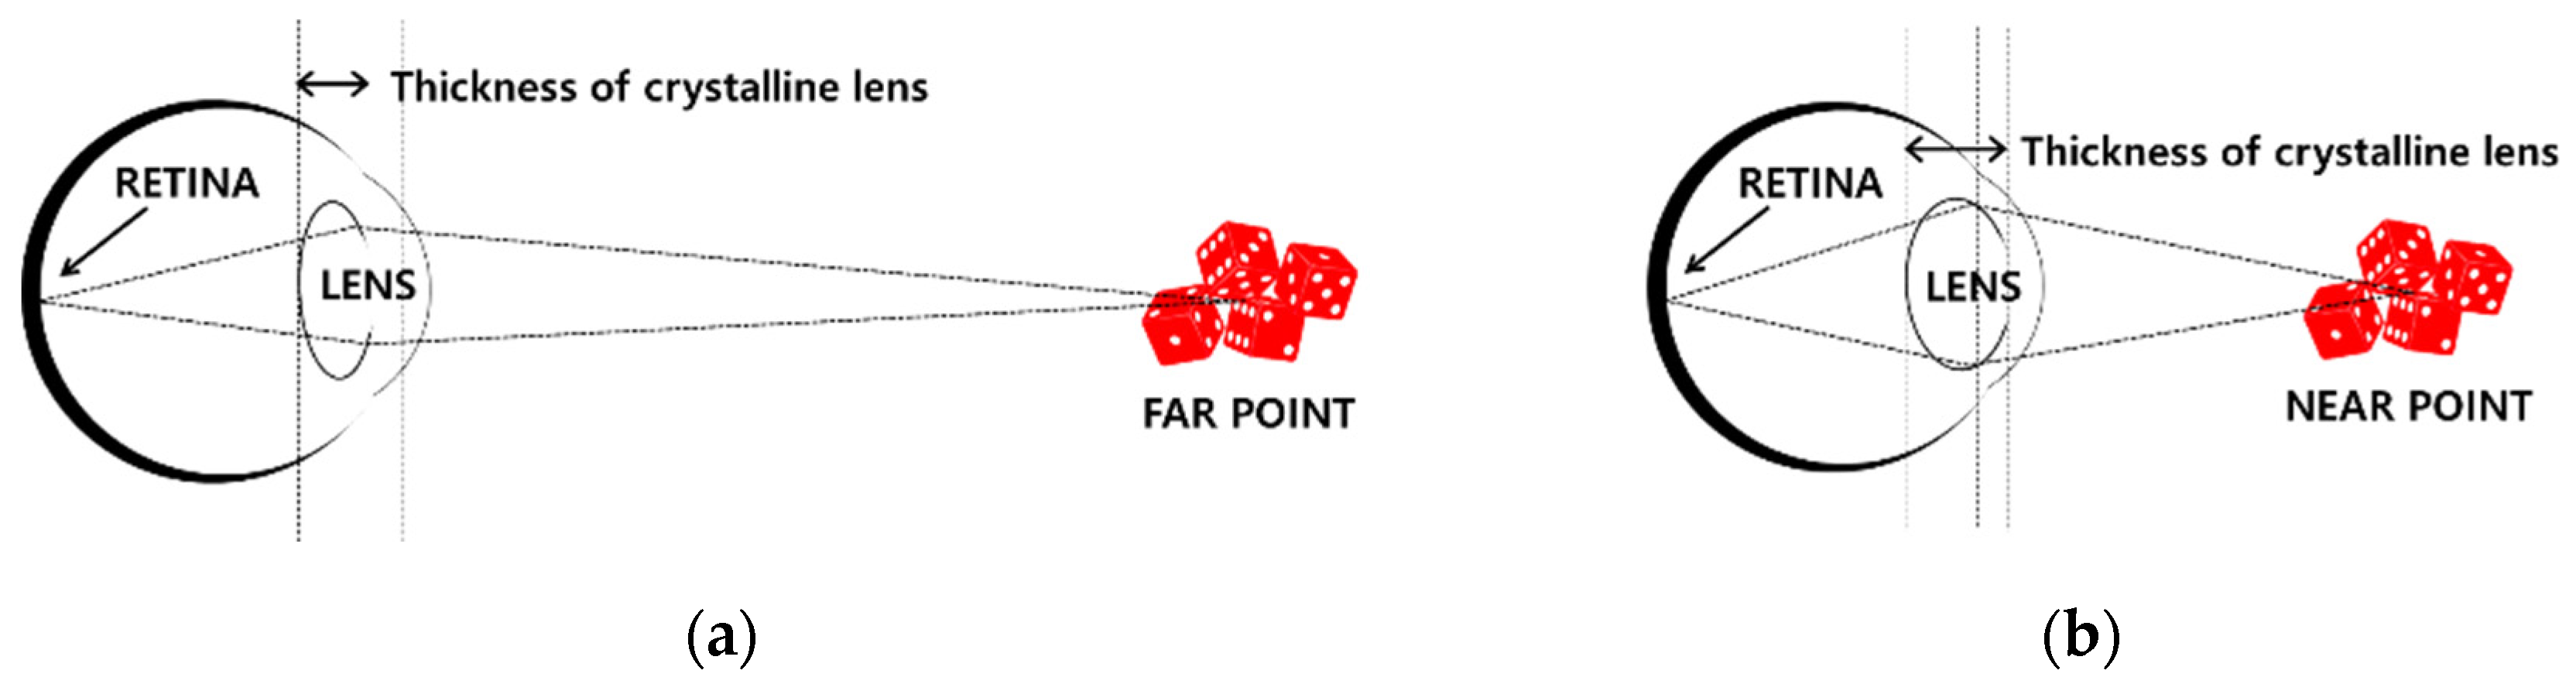
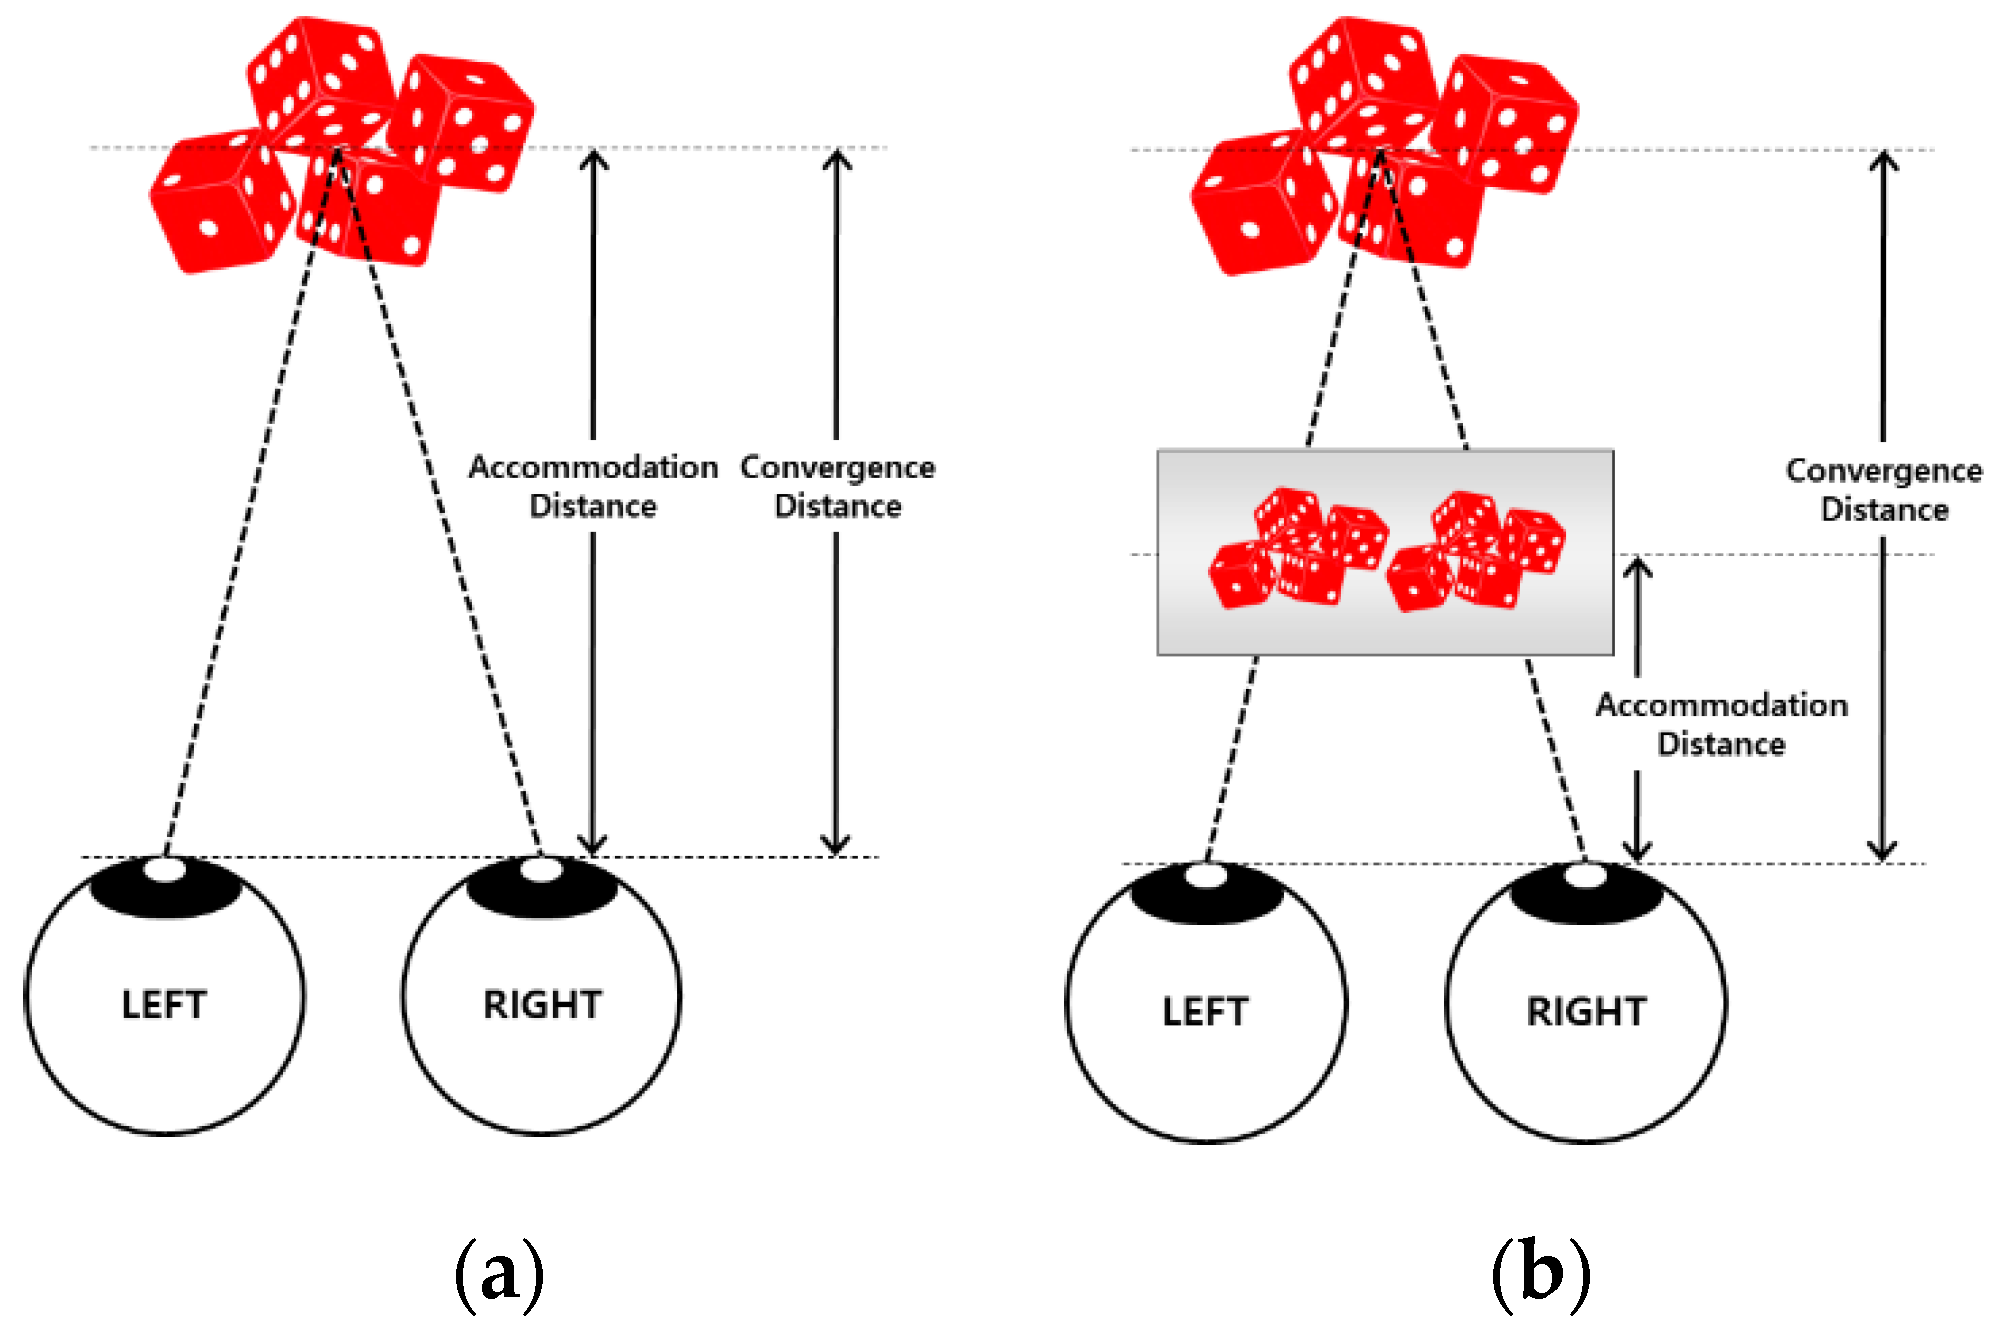
2.2. Accommodation Response

When a person looks at an object, the eyes focus on a specific point and create a clear image, and objects before and after the target object are perceived as blurred such that the relative position from the object can be known [8]. That is, the focus of the lens is automatically adjusted to create a clear image, and this change in focus occurs due to one eye, not two eyes. This is called focusing. As shown in Figure 2, at close range, the ciliary muscle contracts, the ciliary body relaxes, and the lens becomes thick. When viewed from farther away, the ciliary muscle relaxes, the ciliary body contracts, and the lens becomes thinner [9].
The control and convergence responses are closely related: the control reaction causes the convergence reaction, and the convergence reaction causes the control reaction [10]. All objects that are in focus naturally exist in the spatial domain and are expressed [11]. However, stereoscopic 3D technologies do not work because they are closely related to this focus control and congestion response. As shown in Figure 3, the image is clearly visible, but not the distance; thus, the viewer should fix the focus according to the depth of the real object by focusing on a fixed distance. Eventually, in a stereoscopic 3D image, the image appears blurred on the viewer’s retina. As a result, the human visual system operates to refocus on the image that is not clear because of the focus control function; thus, the motion to automatically focus on the object of interest and the motion to refocus on a clear image are continuous. This causes repetitive motion, resulting in eye strain [12,13,14,15].

3. Materials and Methods

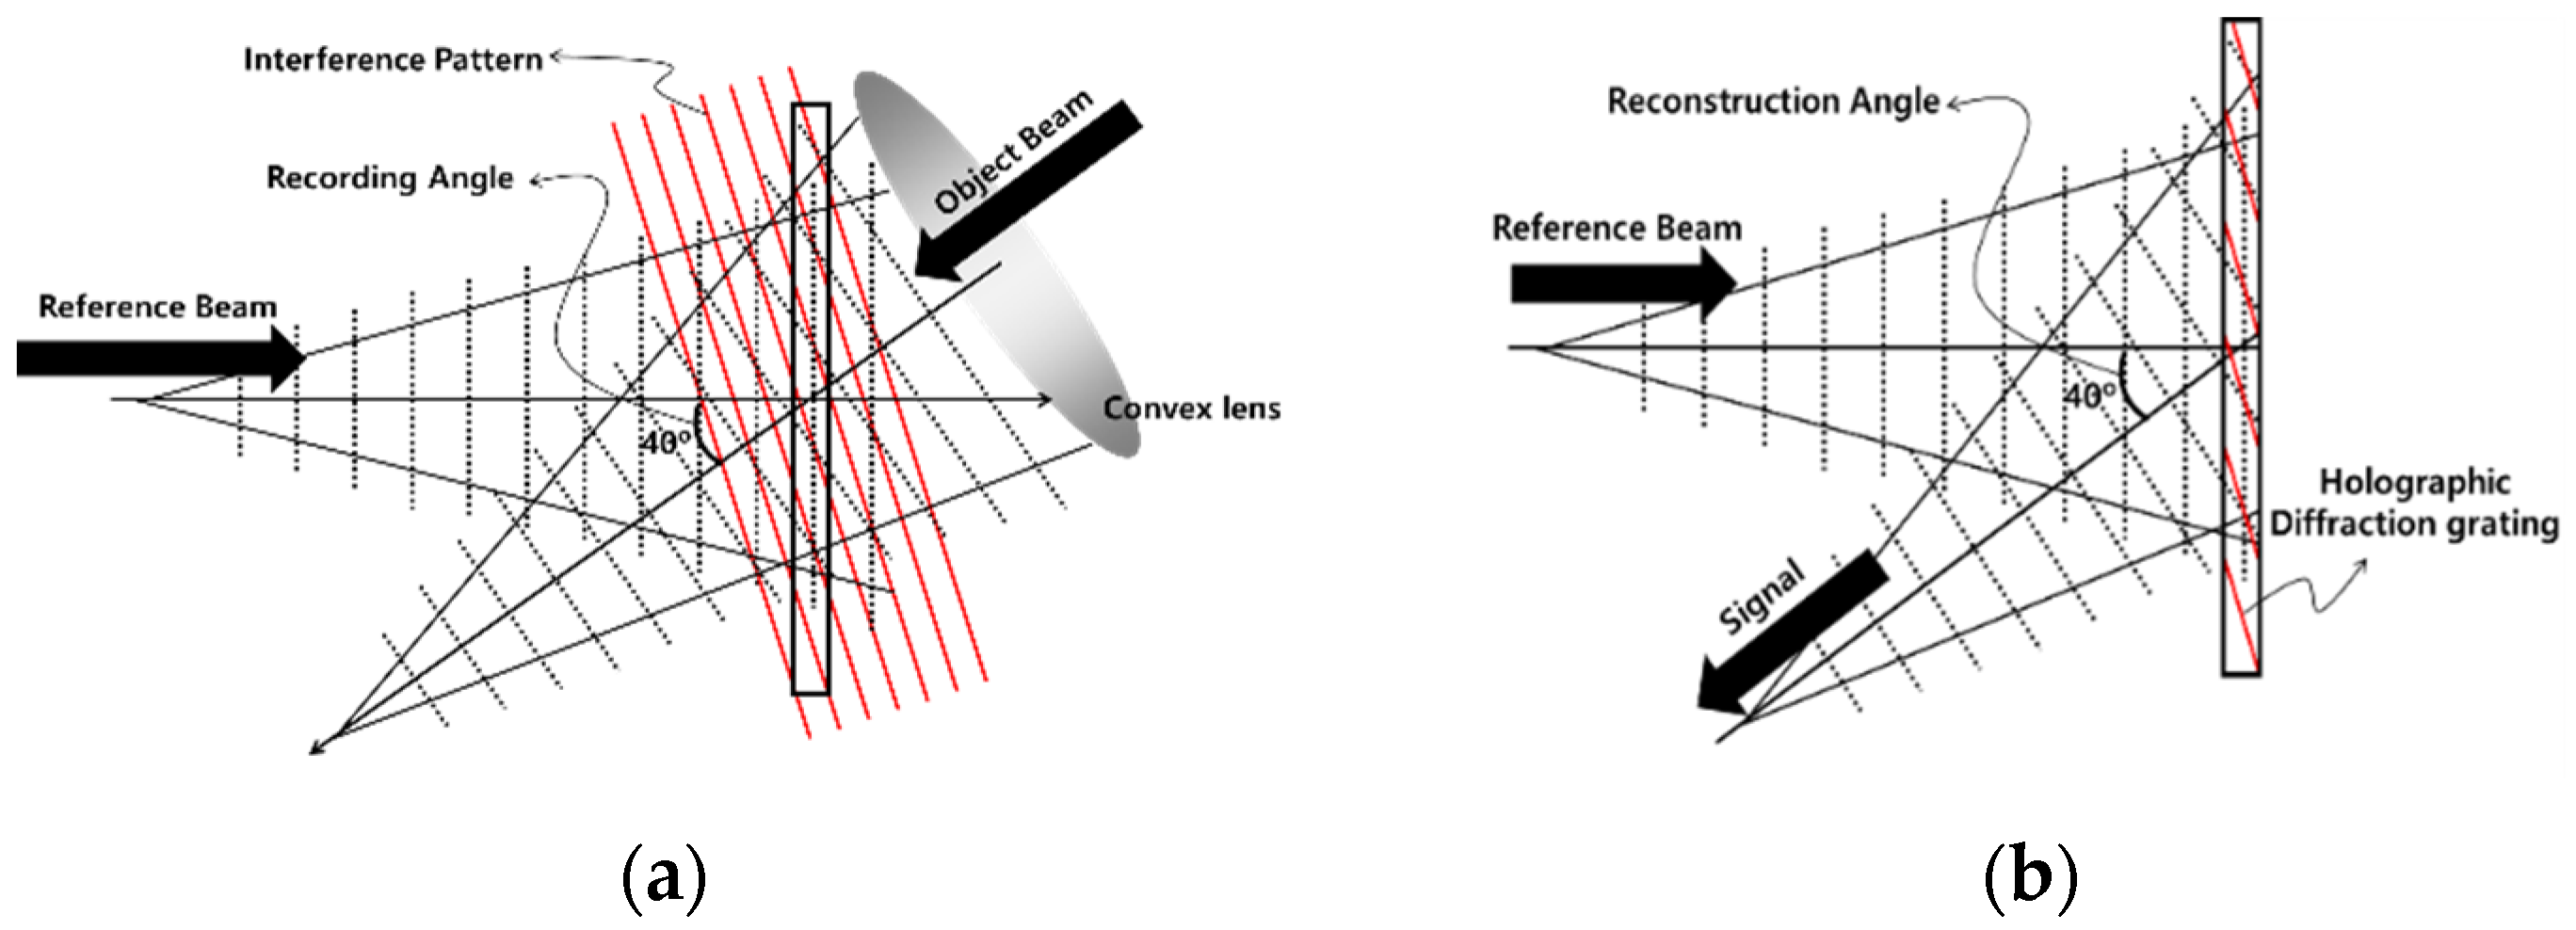
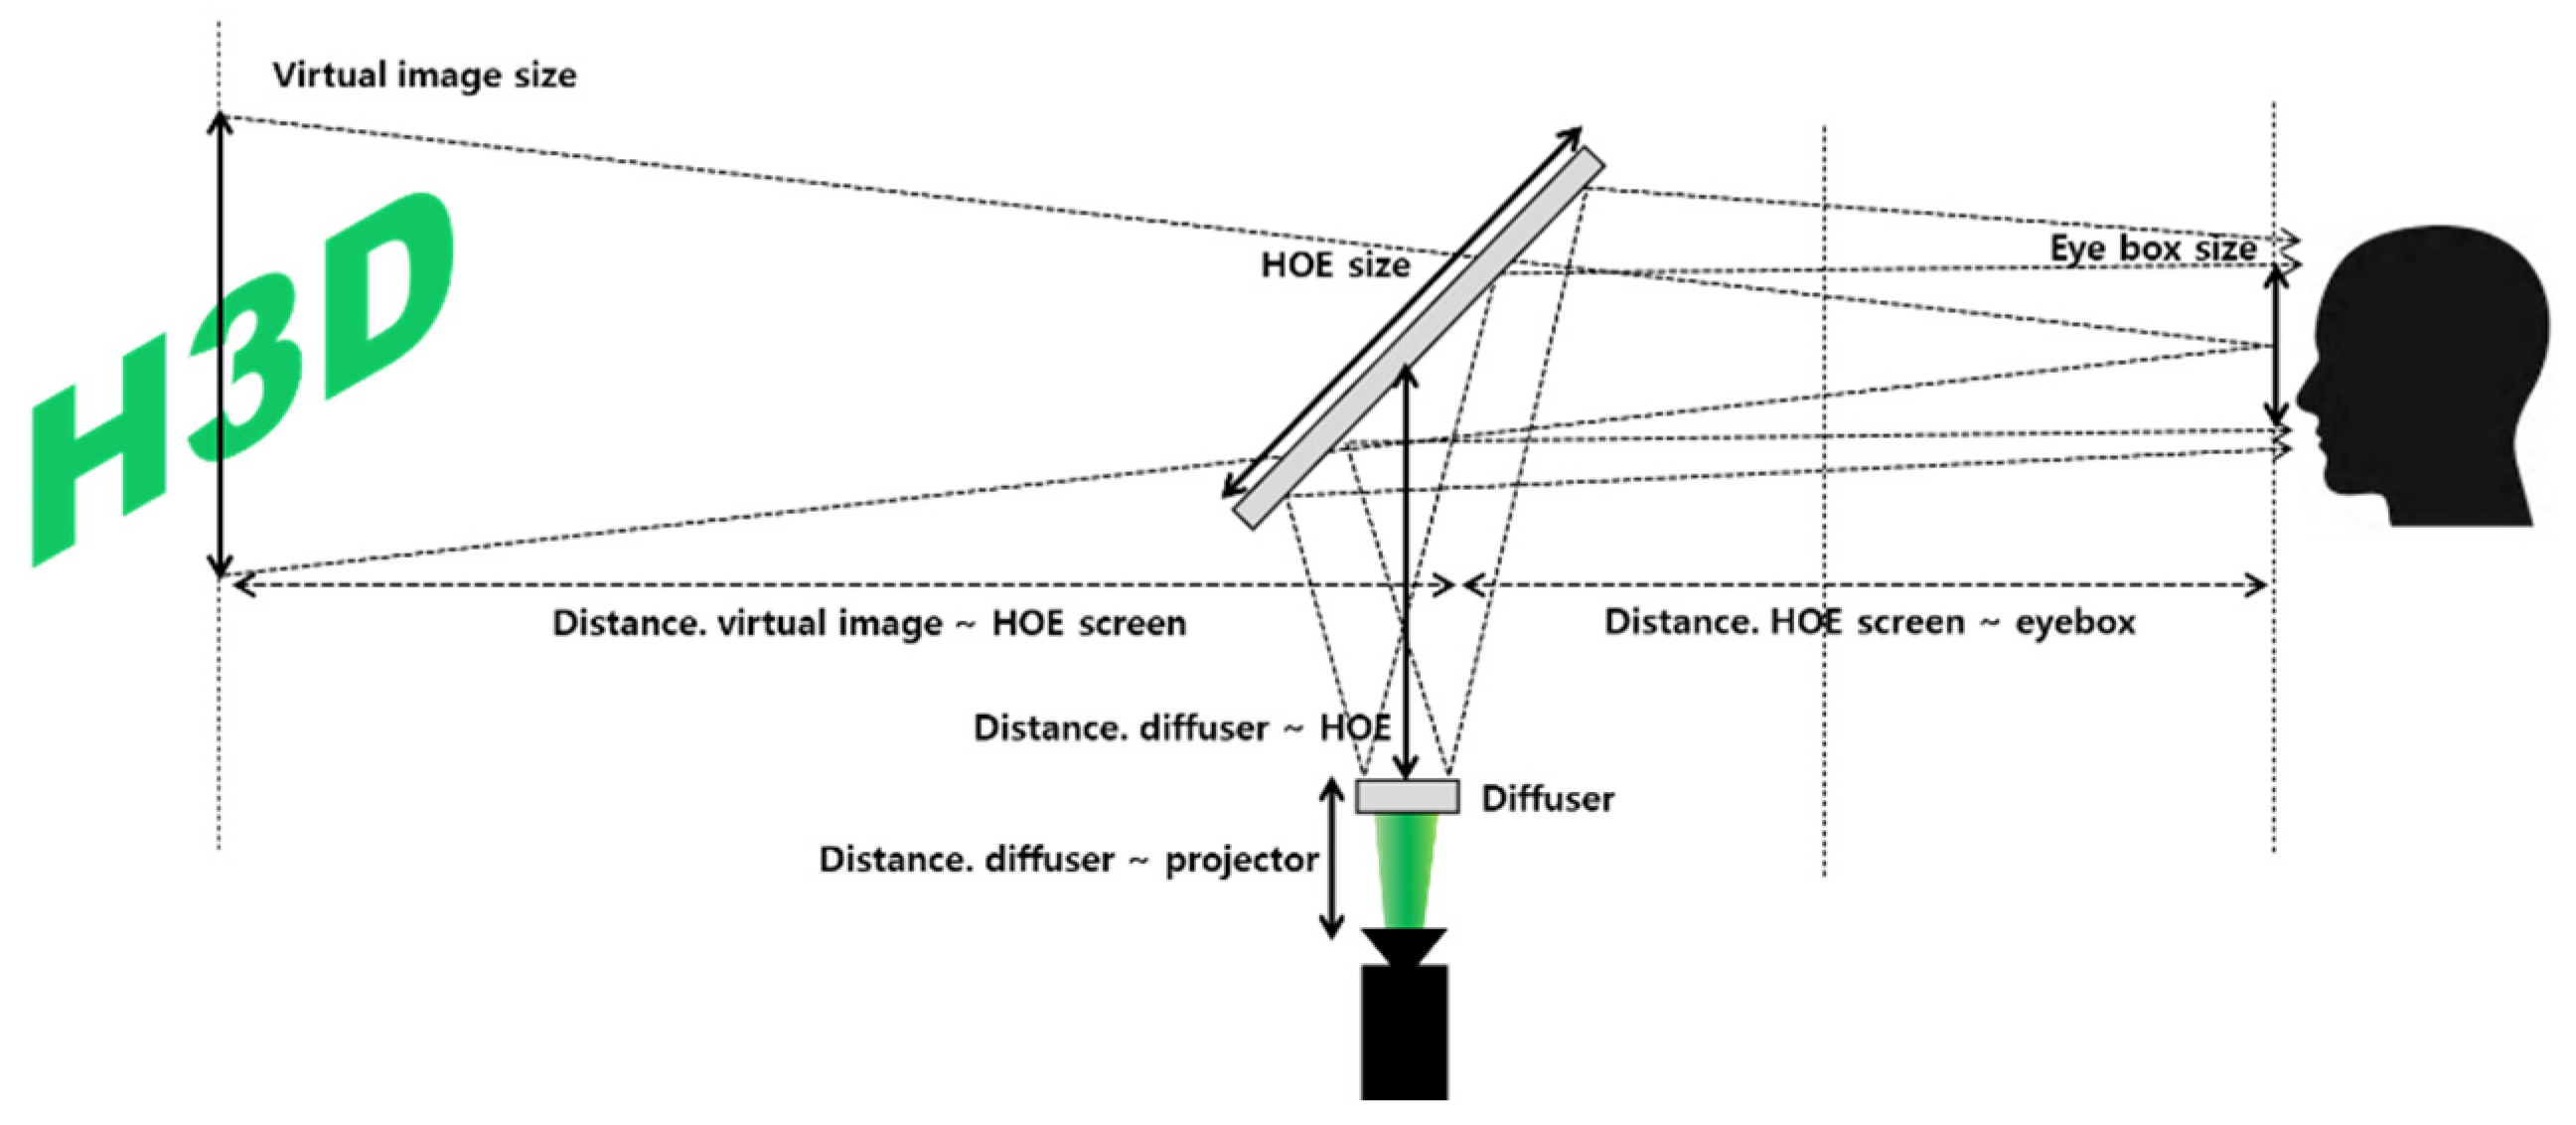
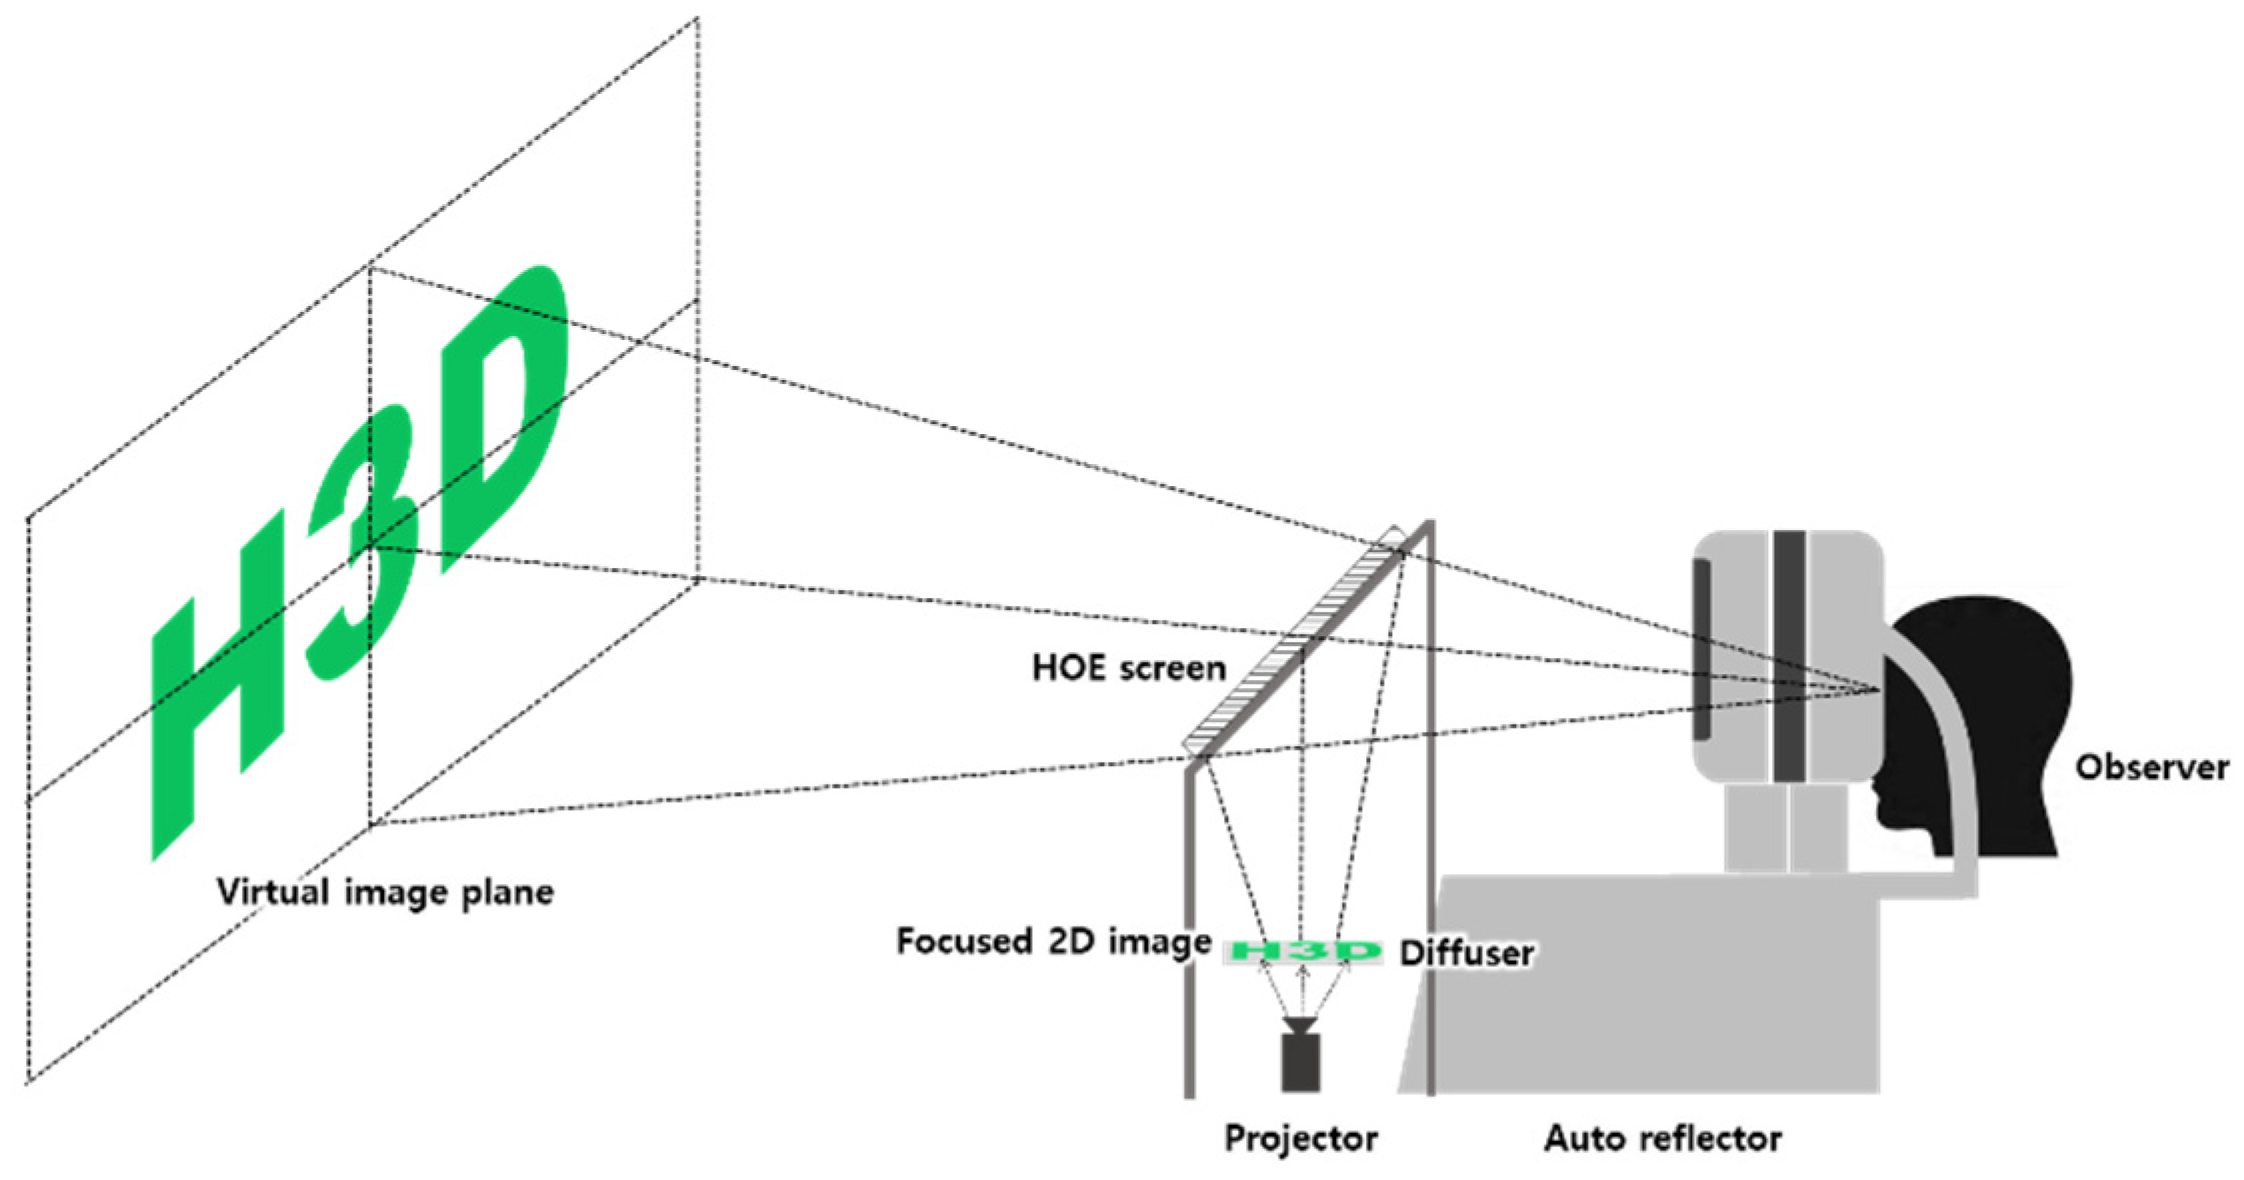
3.1. Design of a Floating Hologram System Using a HOE

Figure 4 shows the recording stage of a holographic lens using reflection-mode geometry and its reconstruction stage. At the recording stage in Figure 4a, the HOE was developed by exposing the holographic film with two beams incident on the film from opposite sides. The developed HOE is an optical device that reproduces the signal light beam by illuminating it with the reference light beam, as shown in Figure 4b. The HOE has the transmission characteristics required in augmented reality (AR) and the characteristics of an optical element for image expression [16,17,18,19,20,21].
Figure 5 shows the design of a 2D projection system using the HOE. The HOE can replace the existing aspherical concave mirror, providing a relatively free optical path design. Because it is transparently arranged to project the external environment, the observer can see a reality in which the external environment and the AR image are mixed [22].

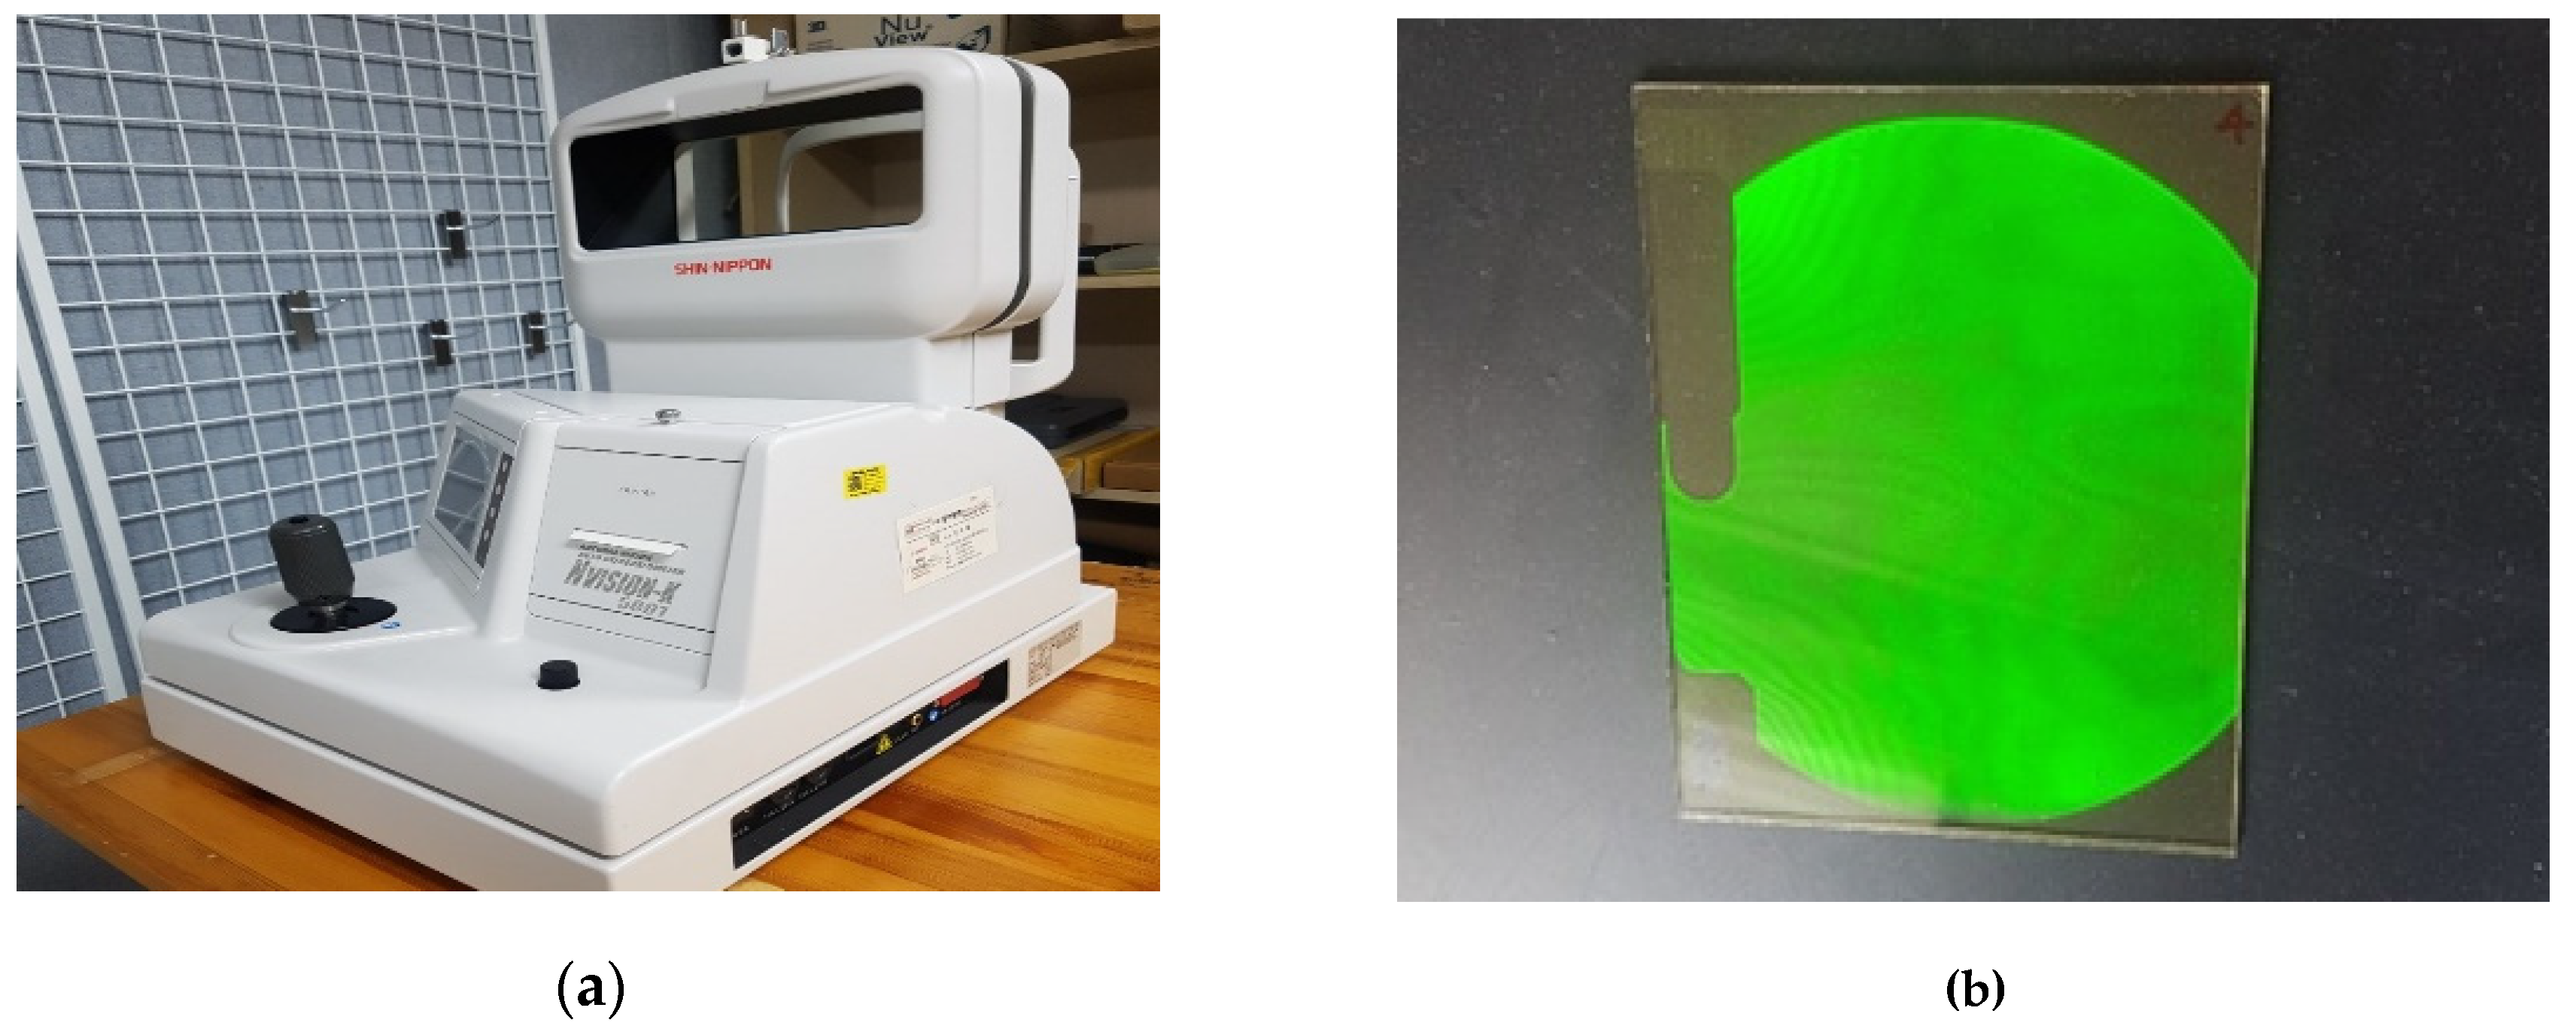
3.2. Materials to Measure the Accommodative Response

In this study, the control response in the binocular state was measured using a Shin-Nippon N-vision K5001 autorefractor [23]. An autorefractor is a computer-controlled measuring machine commonly used during eye examinations to objectively measure a patient’s refractive error. With the N-vision K5001 wide-view window, the subject can be seen naturally with both eyes, thereby easing measurement collection. Figure 6 shows such a system. An environment where the observer naturally sees the image with human eyes and how the human eye changes when observing the content was measured by combining an open-type autorefractor and a 2D projection display system using a HOE.

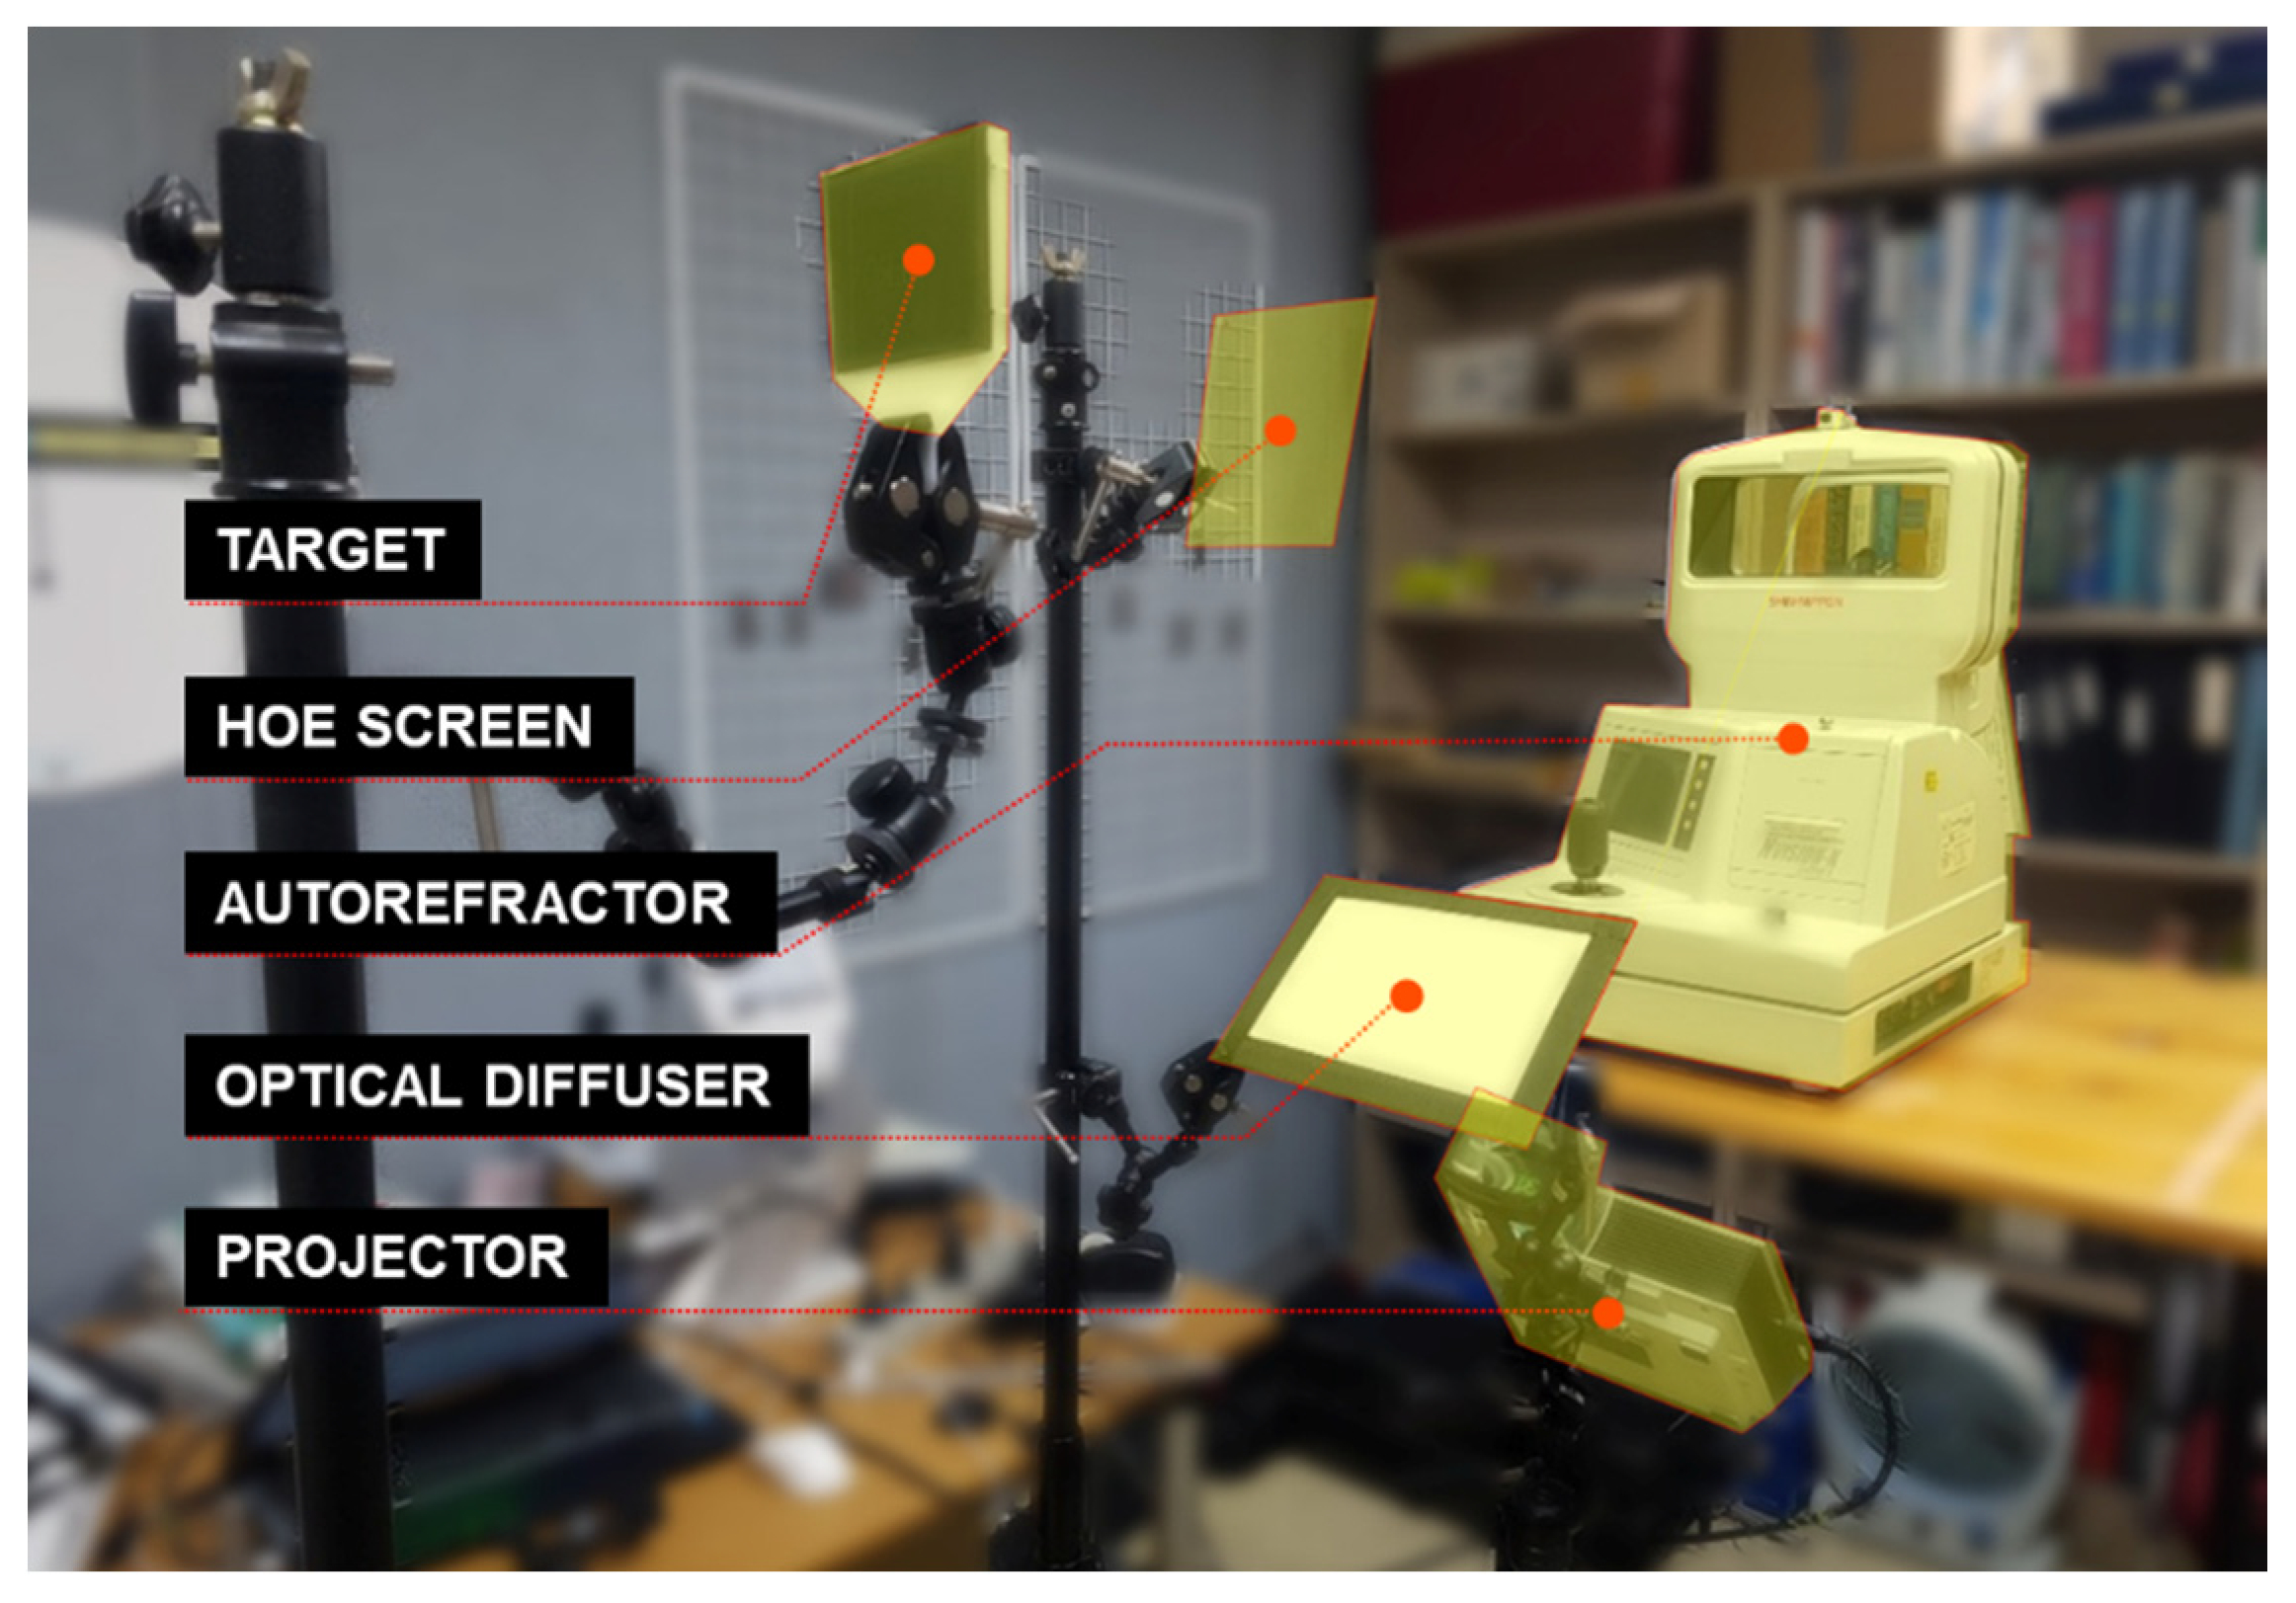
3.3. Experiment Design

Two experimental configurations were used to test this hypothesis. The first configuration was the depth of the content located according to the actual optical design. To check whether the augmented content was reproduced with an appropriate depth and size, a marker was set up at the depth where the augmented 2D projected image was reproduced using a camera, and the focus was placed on the same plane. In the second setup, the N-vision K5001 autorefractor, as shown Figure 7a, was placed to enable the viewer to see it at a distance of 0.67 D diopter, which was the distance the actual content was augmented. After projecting an image at a location that satisfied the initial conditions for recording the HOE, the control response of the eye to the observer was measured.
The HOE was manufactured as a screen that functioned as a convex lens with a focal length of 500 mm using the reflective hologram recording method, as shown Figure 7b. The material used was silver halide of U08C holographic film. Holograms were recorded using a monochromatic light with a wavelength of 532 nm [24,25,26]. The parameters of the floating hologram system using the HOE screen are listed in Table 1.
Figure 8 shows the entire system of acoustic response measurement using the HOE. At the time of measurement, the comparison target group was measured using an actual target and a virtual image was reproduced using the HOE screen. Shin-Nippon’s N-vision K5001 autorefractor was used as a control force-measuring instrument, currently used in ophthalmology to measure the thickness change of the lens in real time. Accordingly, the amount of control reaction of the eye was measured by comparing the actual target and the virtual image reproduced using the HOE screen.

4. Results and Discussion

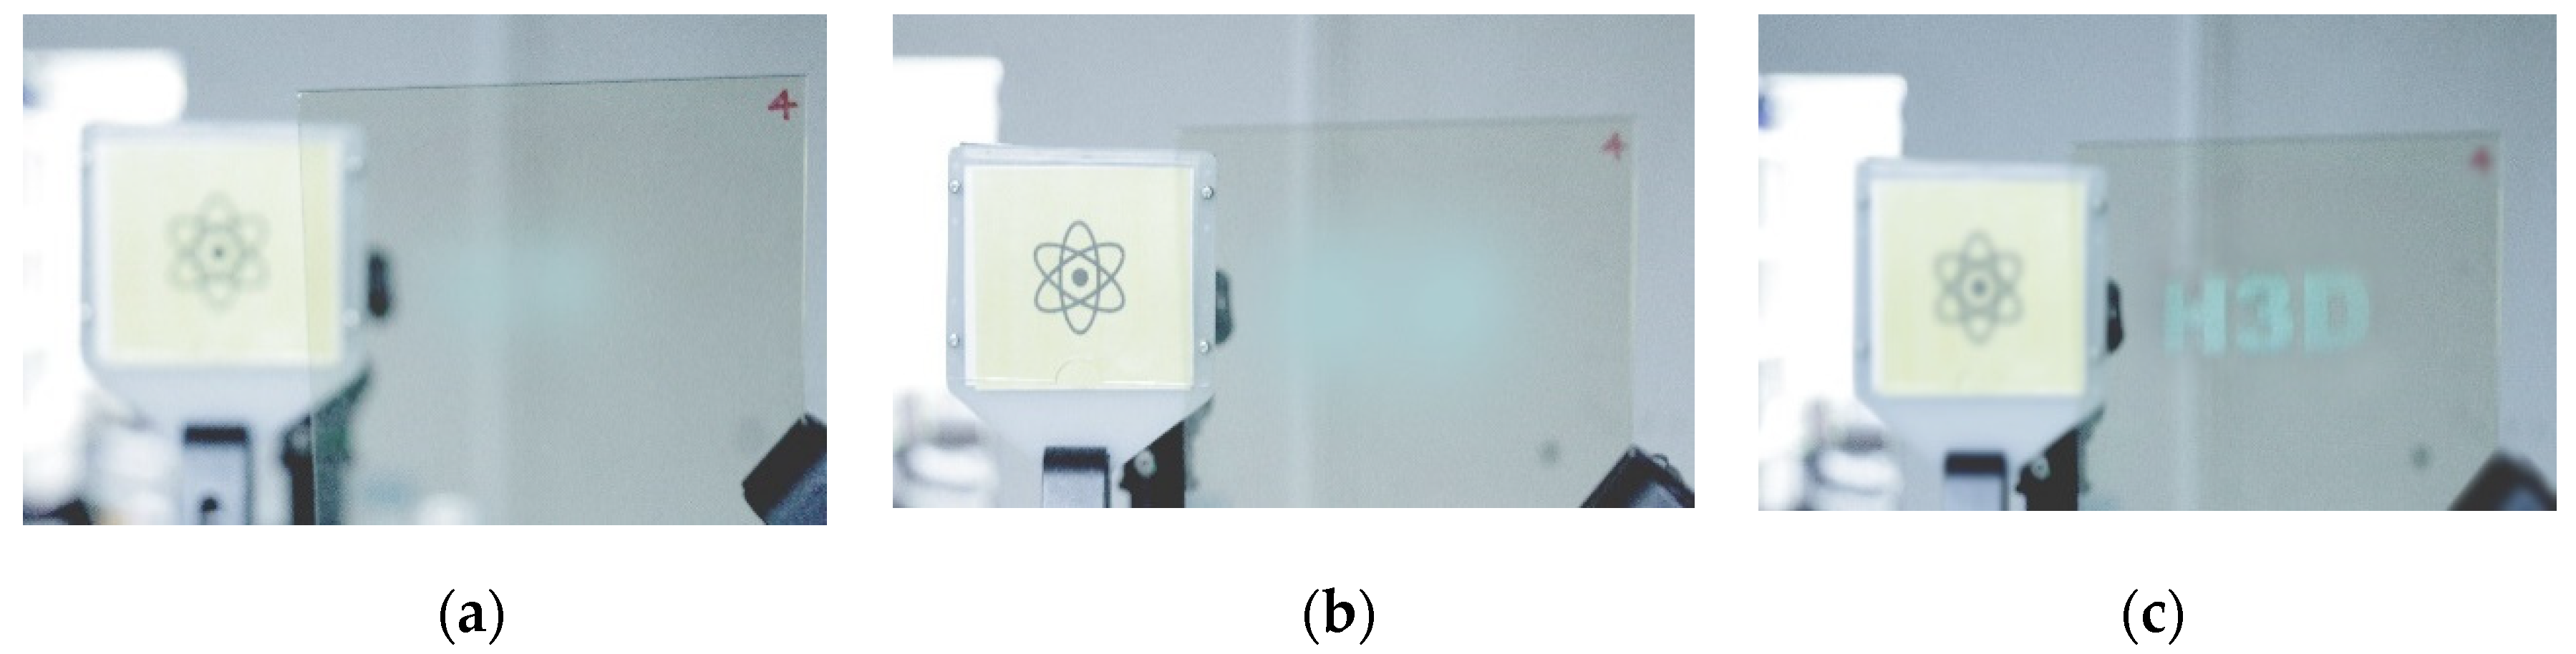
4.1. Measuring the Depth of a Floating 2D Image

We needed to confirm that the virtual image was floating at 150 cm, as the initial optical was designed. The marker was placed at 150 cm and the camera was used to focus on the marker. We verified that the virtual image was clearly visible at 150 cm. In Figure 9a, the camera was focused on the HOE plane. In this case, both the marker 100 cm away and the floated virtual image 150 cm away were out of focus. In Figure 9b, the camera was focused on the marker, and Figure 9c is the result of the camera focusing on the virtual image display. Through this process, verification that the virtual image was floating at 150 cm was acquired by focusing the camera.

4.2. Measurement Results of the Accommodative Responses

Qualitative and weak variables were used to analyze the difference in the average between groups using a paired t-test. SPSS Ver.18.0 for Windows was used for data analysis. The paired t-test method is a statistical method that measures two variables within a group to determine whether there is a difference in means. A large t-value means that there is a high possibility of a difference in means. In addition, if the p-value is less than 0.05, it can be interpreted that the difference between the means of the two groups is significant. If the p-value value is greater than 0.05, it can be interpreted that the difference between the means of the two groups is not significant. Parametric statistics, which analyze the population probability distribution assuming a normal distribution, were used to compare the amount of controlled reaction in each environment [27]. In general, parametric statistics are used for data that are continuous variables and have a large number of samples. The parametric statistics should therefore have a sample of at least 30 people. The regulated response of 30 participants was measured in this experiment [28,29].

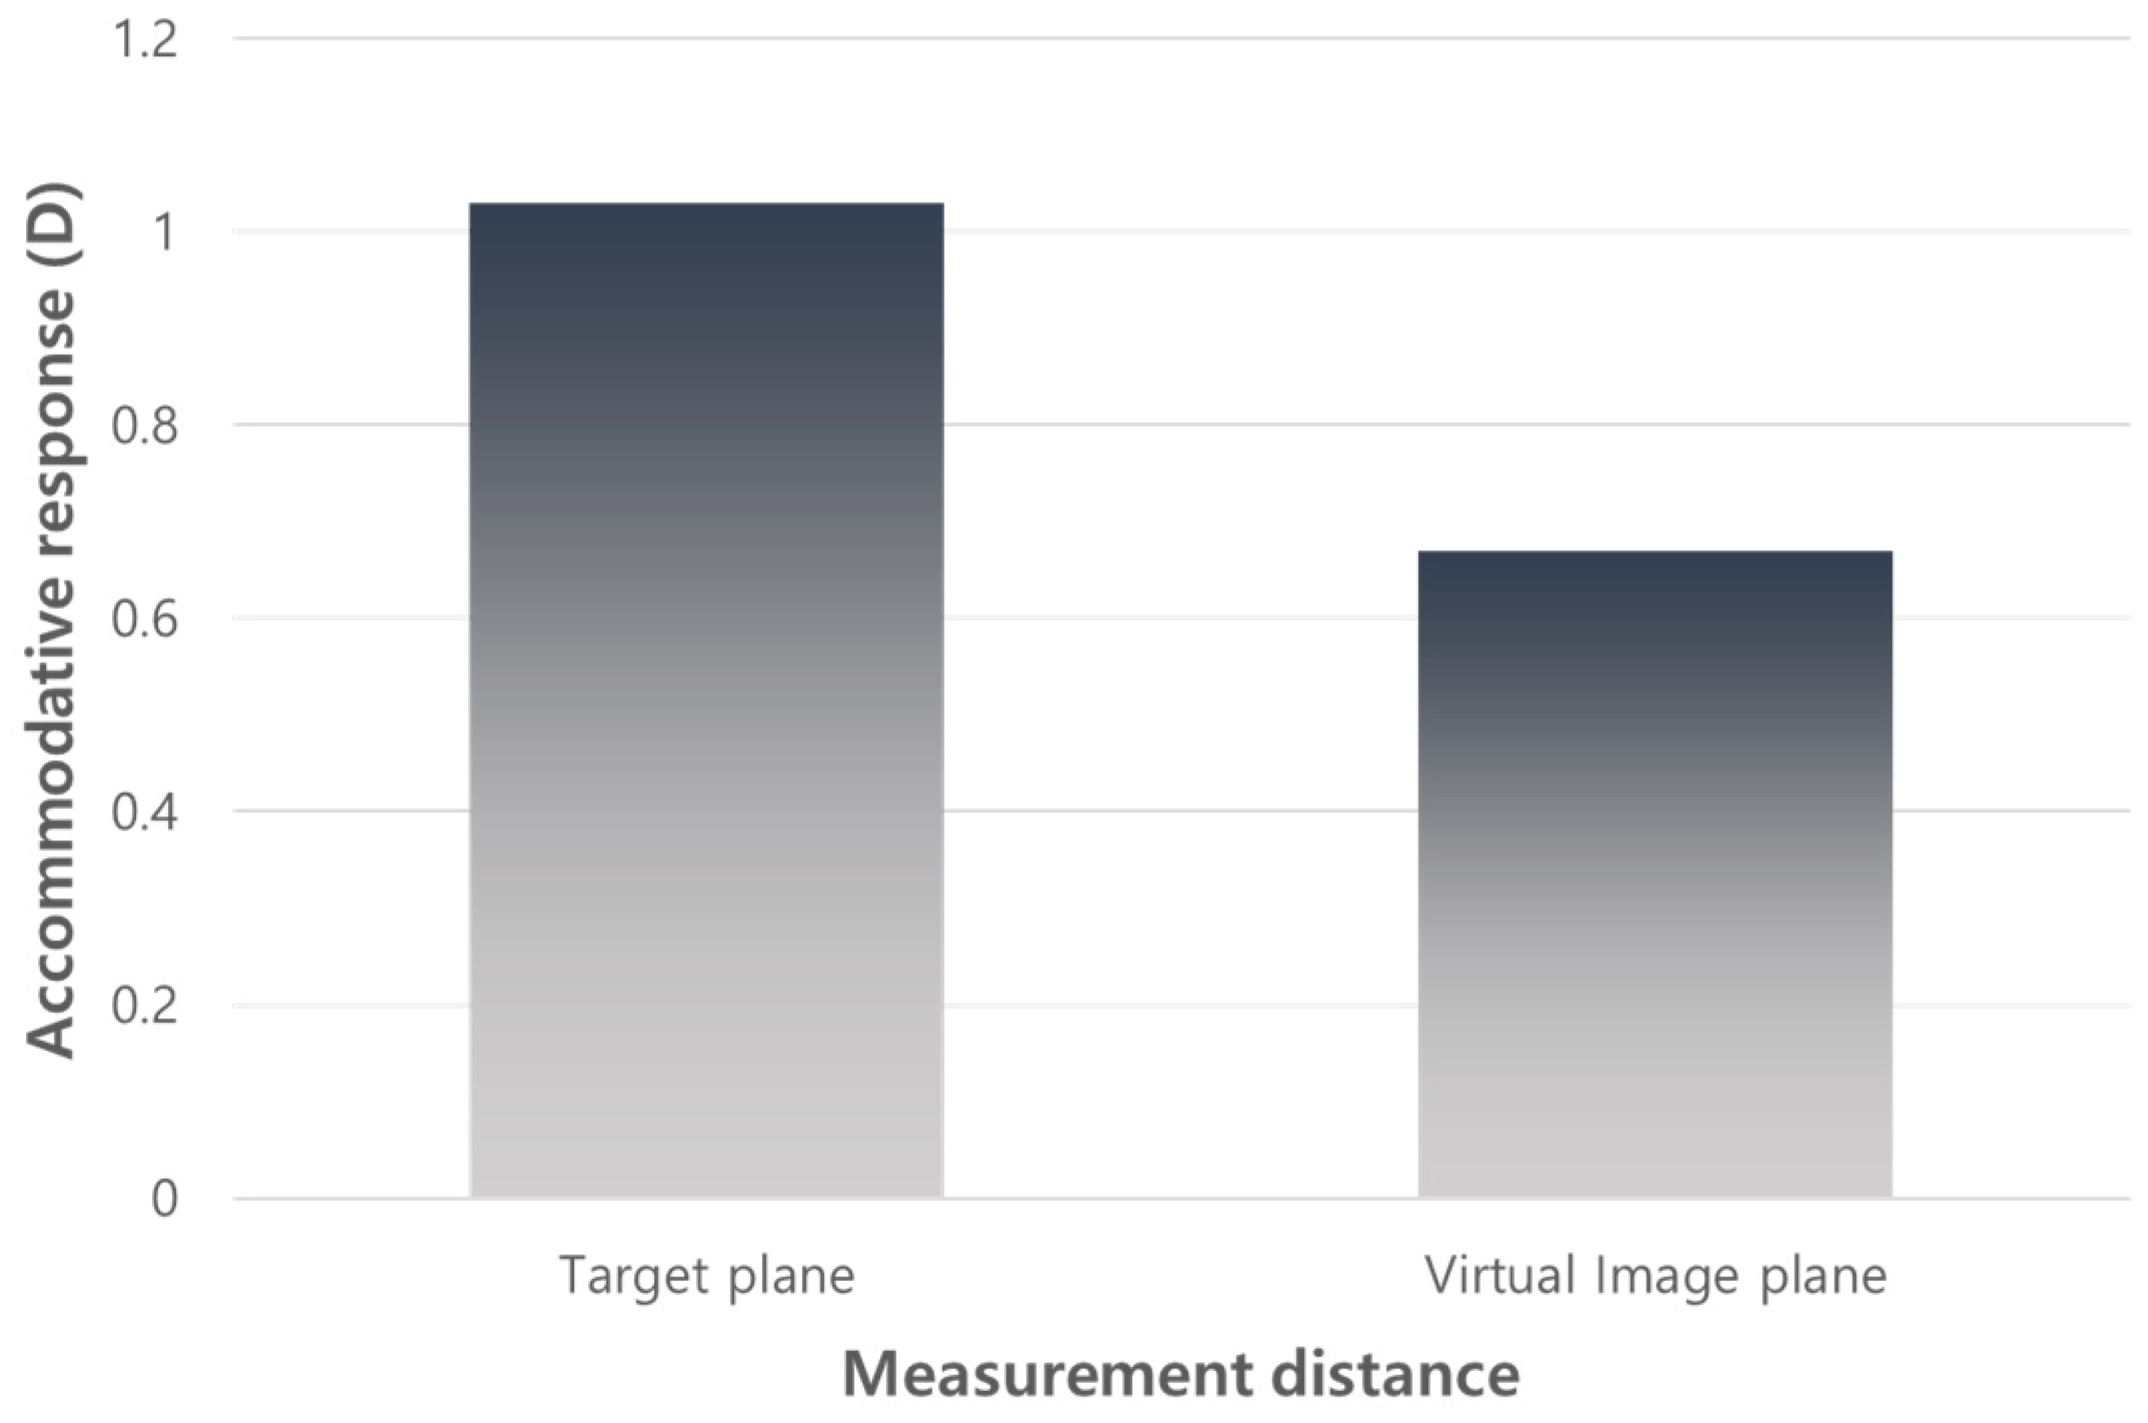
4.2.1. Comparison Results of the Control Reaction between the Target Position of 1.00 D and the Virtual Image Plane

N-vision K5001 was used to measure and compare the amount of modulated response between the 1.00 D (100 cm) real stimulus and the holographic stimulus (Table 2). When the modulatory responses to the 1.00 D stimulus and to the stimulus at the virtual image position were compared, a higher result for the first one was obtained. The significant probability value was less than 0.05, which implied that the difference in the means of the two result diopters was significant. Therefore, the difference between the two values was statistically significant and the two result values in the first experiment meant a statistically different value.

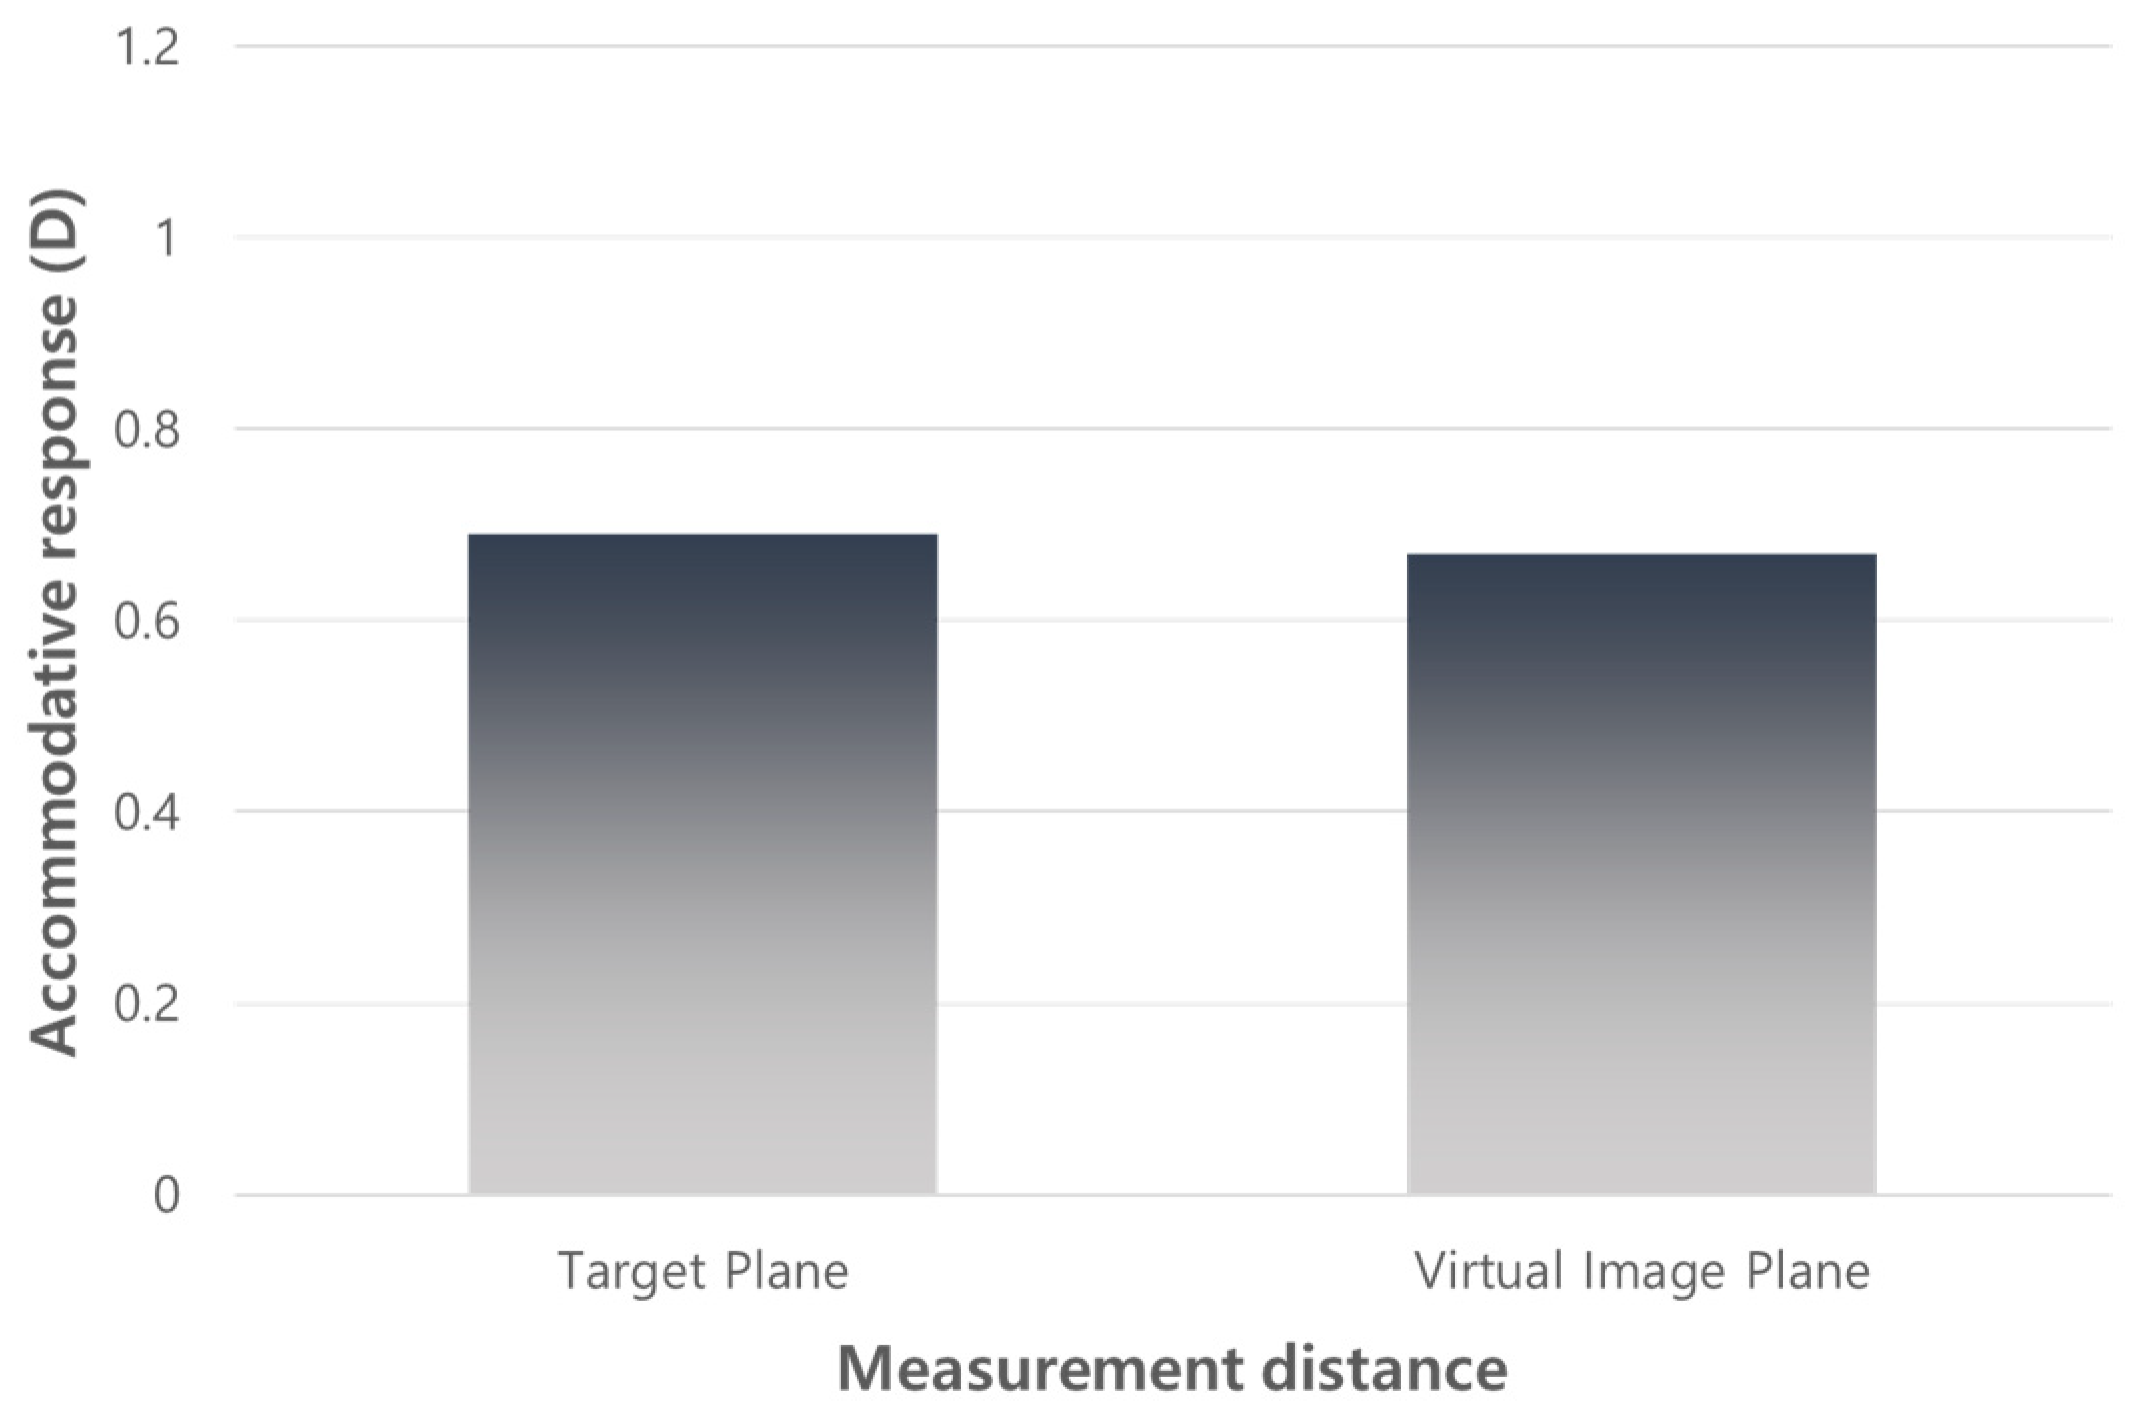
4.2.2. Comparison Results of the Control Reaction between the Target Position of 0.67 D and the Virtual Image Plane

N-vision K5001 was used to measure and compare the amount of modulated response between the 0.67 D (150 cm) real stimulus and the holographic stimulus (Table 3). The first and second values were found to have similar diopter values when the modulatory responses to the 0.67 D stimulus were compared to the stimulus at the virtual image position. The significant probability value was higher than 0.05, which meant that the difference between the means of the two resulting diopters was not significant. Therefore, the difference between the two values was not statistically significant and the two result values in the second experiment were statistically the same.

5. Conclusions

This study proposed a method to measure the depth of the reconstruction image of the floating hologram system using a HOE by measuring accommodation response. Figure 10 and Figure 11 show the result of observing the control response to the real target and the virtual image plane at 100 cm and 150 cm, respectively. As seen in Figure 10, the results of the experiment showed that the congestion of the accommodative response and the mismatch of the control occurred at a distance of 1.00 D, which was a target located 50 cm closer than the reconstruction image in the virtual image plane. Figure 11 shows the result of observing the accommodative response after placing the actual target at a distance of 0.67 D, which was the same distance as the virtual image plane. The results of this experiment confirmed that the experimenters focused on the virtual image at a distance of 0.67 D (150 cm), which the location designed for the initial design using a HOE. This confirmed that the visual image depth identified by the camera was the same as the visual image depth measured by the acoustic response of the eye. The experimental results confirmed that when the augmented virtual image of the floating hologram produced through the HOE screen was observed by the human eye, the accommodative response due to the adjustment of the thickness of the lens was consistent with the image restoration position, such as the optical design value. This indicated that the floating hologram system fabricated using the HOE screen could provide an observer with a natural and deep 3D image.

Author Contributions

All the authors have made substantial contributions regarding the conception and design of the work, and the acquisition, analysis and interpretation of the data. Specifically, conceptualization, L.H. and S.L.; methodology, S.H.; formal analysis, P.G.; validation, J.L. and L.H.; investigation, S.K. All authors have read and agreed to the published version of the manuscript.

Funding

This research was supported by the Ministry of Science and ICT (MSIT), Korea, under the Information Technology Research Center (ITRC) support program (IITP-2020-0-01846) supervised by the Institute of Information & Communications Technology Planning & Evaluation (IITP).

Conflicts of Interest

The authors declare that there are no conflicts of interest.

References

  1. Thomas, W.; Frey, H.; Jean, P. Virtual HUD using an HMD. Helmet- and Head-Mounted Displays VI. Proc. SPIE Int. Soc. Opt. Eng. 2001, 4361, 251–262. [Google Scholar]
  2. Choi, P.H.; Choi, Y.H.; Park, M.S.; Lee, S.H. Non-glasses Stereoscopic 3D Floating Hologram System using Polarization Technique. Inst. Internet Broadcasting Commun. 2019, 8, 18–23. [Google Scholar]
  3. Toshiaki, Y.; Nahomi, M.; Kazuhisa, Y. Holographic Pyramid Using Integral Photography. In Proceedings of the 2nd World Congress on Electrical Engineering and Computer Systems and Science, Budapest, Hungary, 16–17 August 2016; MHCI 109. pp. 16–17. [Google Scholar]
  4. Reichelt, S.; Haussler, R.; Fütterer, G.; Leister, N. Depth cues in human visual perception and their realization in 3D displays. SPIE Proc. 2010, 7690, 111–112. [Google Scholar]
  5. De Silva, V.; Fernando, A.; Worrall, S.; Arachchi, H.K.; Kondoz, A. Sensitivity analysis of the human visual system for depth cues in stereoscopic 3-D displays. IEEE Trans. Multimed. 2011, 13, 498–506. [Google Scholar] [CrossRef]
  6. Owens, D.A.; Mohindra, I.; Held, R. The Effectiveness of a Retinoscope Beam as an Accommodative Stimulus. Investig. Ophthalmol. Vis. Sci. 1980, 19, 942–949. [Google Scholar]
  7. Avudainayagam, K.V.; Avudainayagam, C.S. Holographic multivergence target for subjective measurement of the astigmatic error of the human eye. Opt. Lett. 2007, 32, 1926–1928. [Google Scholar] [CrossRef] [PubMed]
  8. Ciuffreda, K.J.; Kruger, P.B. Dynamics of human voluntary accommodation. Am. J. Optom. Physiol. 1988, 65, 365–370. [Google Scholar] [CrossRef] [PubMed]
  9. Cacho, P.; Garcia, A.; Lara, F.; Segui, M.M. Binocular acommodative facilty testing reliabilty. Optom. Vis. 1992, 4, 314–319. [Google Scholar]
  10. Bharadwaj, S.R.; Candy, T.R. Acommodative and vergence responses to conflicting blur and disparity stimuli during development. J. Vis. 2009, 9, 1–18. [Google Scholar] [CrossRef] [Green Version]
  11. Iribarren, R.; Fornaciari, A.; Hung, G.K. Effect of cumulative near work on accommodative facility and asthenopia. Int. Ophthalmol. 2001, 24, 205–212. [Google Scholar] [CrossRef]
  12. Rosenfield, M.; Ciufreda, K.J. Effect of surround propinquity on the open-loop accommodative response. Investig. Ophthalmol. Vis. Sci. 1991, 32, 142–147. [Google Scholar]
  13. Rosenfield, M.; Ciufreda, K.J.; Hung, G.K.; Gilmartin, B. Tonic accommodation: A review. I. Basic aspects. Ophthalmic Physiol. Opt. 1993, 13, 266–284. [Google Scholar] [CrossRef] [PubMed]
  14. McBrien, N.A.; Millodot, M. The relationship between tonic accommodation and refractive error. Investig. Ophthalmol. Vis. Sci. 1987, 28, 997–1004. [Google Scholar]
  15. Krumholz, D.M.; Fox, R.S.; Ciuffreda, K.J. Short-term changes in tonic accommodation. Investig. Ophthalmol. Vis. Sci. 1986, 27, 552–557. [Google Scholar]
  16. Nadezhda, V.; Pavel, S. Application of Photopolymer Materials in Holographic Technologies. Polymers 2019, 11, 2020. [Google Scholar]
  17. Zhang, H.; Deng, H.; He, M.; Li, D.; Wang, Q. Dual-View Integral Imaging 3D Display Based on Multiplexed Lens-Array Holographic Optical Element. Appl. Sci. 2019, 9, 3852. [Google Scholar] [CrossRef] [Green Version]
  18. Maria, A.F.; Valerio, S.; Giuseppe, C. Volume Holographic Optical Elements as Solar Concentrators: An Overview. Appl. Sci. 2019, 9, 193. [Google Scholar]
  19. Liu, J.P.; Tahara, T.; Hayasaki, Y.; Poon, T.C. Incoherent Digital Holography: A Review. Appl. Sci. 2018, 8, 143. [Google Scholar] [CrossRef] [Green Version]
  20. Reid, V.; Adam, R.; Elvis, C.S.C.; Terry, M.P. Hologram stability evaluation for Microsoft HoloLens. Int. Soc. Opt. Photonics. 2017, 10136, 1013614. [Google Scholar]
  21. Oh, J.Y.; Park, J.H.; Park, J.M. Virtual Object Manipulation by Combining Touch and Head Interactions for Mobile Augmented Reality. Appl. Sci. 2019, 9, 2933. [Google Scholar] [CrossRef] [Green Version]
  22. Takeda, T.; Hashimoto, K.; Hiruma, N.; Fukui, Y. Characteristics of accommodation toward aparent depth. Vis. Res. 1999, 39, 2087–2097. [Google Scholar] [CrossRef] [Green Version]
  23. Davies, L.N.; Mallen, E.A.; Wolffsohn, J.S.; Gilmartin, B. Clinical evaluation of the Shin-Nippon NVision-K5001/Grand Seiko WR-5100K autorefractor. Optom. Vis. Sci. 2003, 80, 320–324. [Google Scholar] [CrossRef] [PubMed]
  24. Gentet, P.; Gentet, Y.; Lee, S.H. Ultimate 04 the new reference for ultra-realistic color holography. In Proceedings of the Emerging Trends Innovation in ICT(ICEI), 2017 International Conference on IEEE, Yashada, Pune, 3–5 February 2017; pp. 162–166. [Google Scholar]
  25. Gentet, P.; Gentet, Y.; Lee, S.H. New LED’s wavelengths improve drastically the quality of illumination of pulsed digital holograms. In Proceedings of the Digital Holography and Three-Dimensional Imaging, JeJu Island, Korea, 29 May–1 June 2017; p. 209. [Google Scholar]
  26. Lee, J.H.; Hafeez, J.; Kim, K.J.; Lee, S.H.; Kwon, S.C. A Novel Real-Time Match-Moving Method with HoloLens. Appl. Sci. 2019, 9, 2889. [Google Scholar] [CrossRef] [Green Version]
  27. Moses, L.E. Non-parametric statistics for psychological research. Psychol. Bull. 1952, 49, 122–143. [Google Scholar] [CrossRef] [PubMed]
  28. Andrew, J.K. Parametric versus non-parametric statistics in the analysis of randomized trials with non-normally distributed data. BMC Med. Res. Methodol. 2005, 5, 35. [Google Scholar]
  29. Davison, M.L.; Sharma, A.R. Parametric statistics and levels of measurement. Psychol. Bull. 1988, 104, 137–144. [Google Scholar] [CrossRef]
Figure 1. Convergence angle of human eye: (a) wide; (b) narrow.
Applsci 10 06788 g001
Figure 2. Changing thickness of the lens of the human eye: (a) looking at far point; (b) looking at near point.
Applsci 10 06788 g002
Figure 3. Accommodation and convergence distances: (a) agreement; (b) disagreement.
Applsci 10 06788 g003
Figure 4. Holographic optical element (HOE) recording and reconstruction: (a) recording; (b) reconstruction.
Applsci 10 06788 g004
Figure 5. Floating hologram system using a HOE.
Applsci 10 06788 g005
Figure 6. Measurement system using autorefractor for floating hologram system with a HOE.
Applsci 10 06788 g006
Figure 7. Main device for measuring accommodative response: (a) autorefractor, and (b) HOE screen.
Applsci 10 06788 g007
Figure 8. Real system model for accommodative response measurement.
Applsci 10 06788 g008
Figure 9. Focal plane distance measurement: (a) HOE plane (500 mm); (b) target plane (1000 mm); and (c) virtual image plane (1500 mm).
Applsci 10 06788 g009
Figure 10. Comparison of accommodative response of target (1.00 D) and virtual image planes.
Applsci 10 06788 g010
Figure 11. Comparison of accommodative response of target (0.67 D) and virtual image planes.
Applsci 10 06788 g011
Table 1. Specifications of a floating hologram projection system using HOE.
IndexValue
Recording materialU08C
Focal length of HOE500 mm
Size of HOE screen100 mm × 125 mm
Wavelength532 mm
ResolutionOver 1000 line/mm
Diffraction efficiency48.50%
Distance: Virtual image–HOE screen3000 mm
Distance: Diffuser–HOE screen430 mm
Distance: HOE screen–eye box500 mm
Distance: Projector–diffuser300 mm
Table 2. Comparison of control reaction between 1.00 D and virtual image.
Mean ± SDMDtp-Value
TargetVirtual Image−0.36−8.335p < 0.001
(1.03 ± 1.01)(0.67 ± 1.02)
Unit: D, SD: standard deviation, MD: mean difference.
Table 3. Comparison of controlled reaction amount between 0.67 D and virtual image.
Mean ± SDMDtp-Value
TargetVirtual Image−0.021.2250.311
(0.69 ± 1.03)(0.67 ± 1.37)
Unit: D, SD: standard deviation, MD: mean difference.

