Deformation Characteristics of the Shear Zone and Movement of Block Stones in Soil–Rock Mixtures Based on Large-Sized Shear Test

Abstract
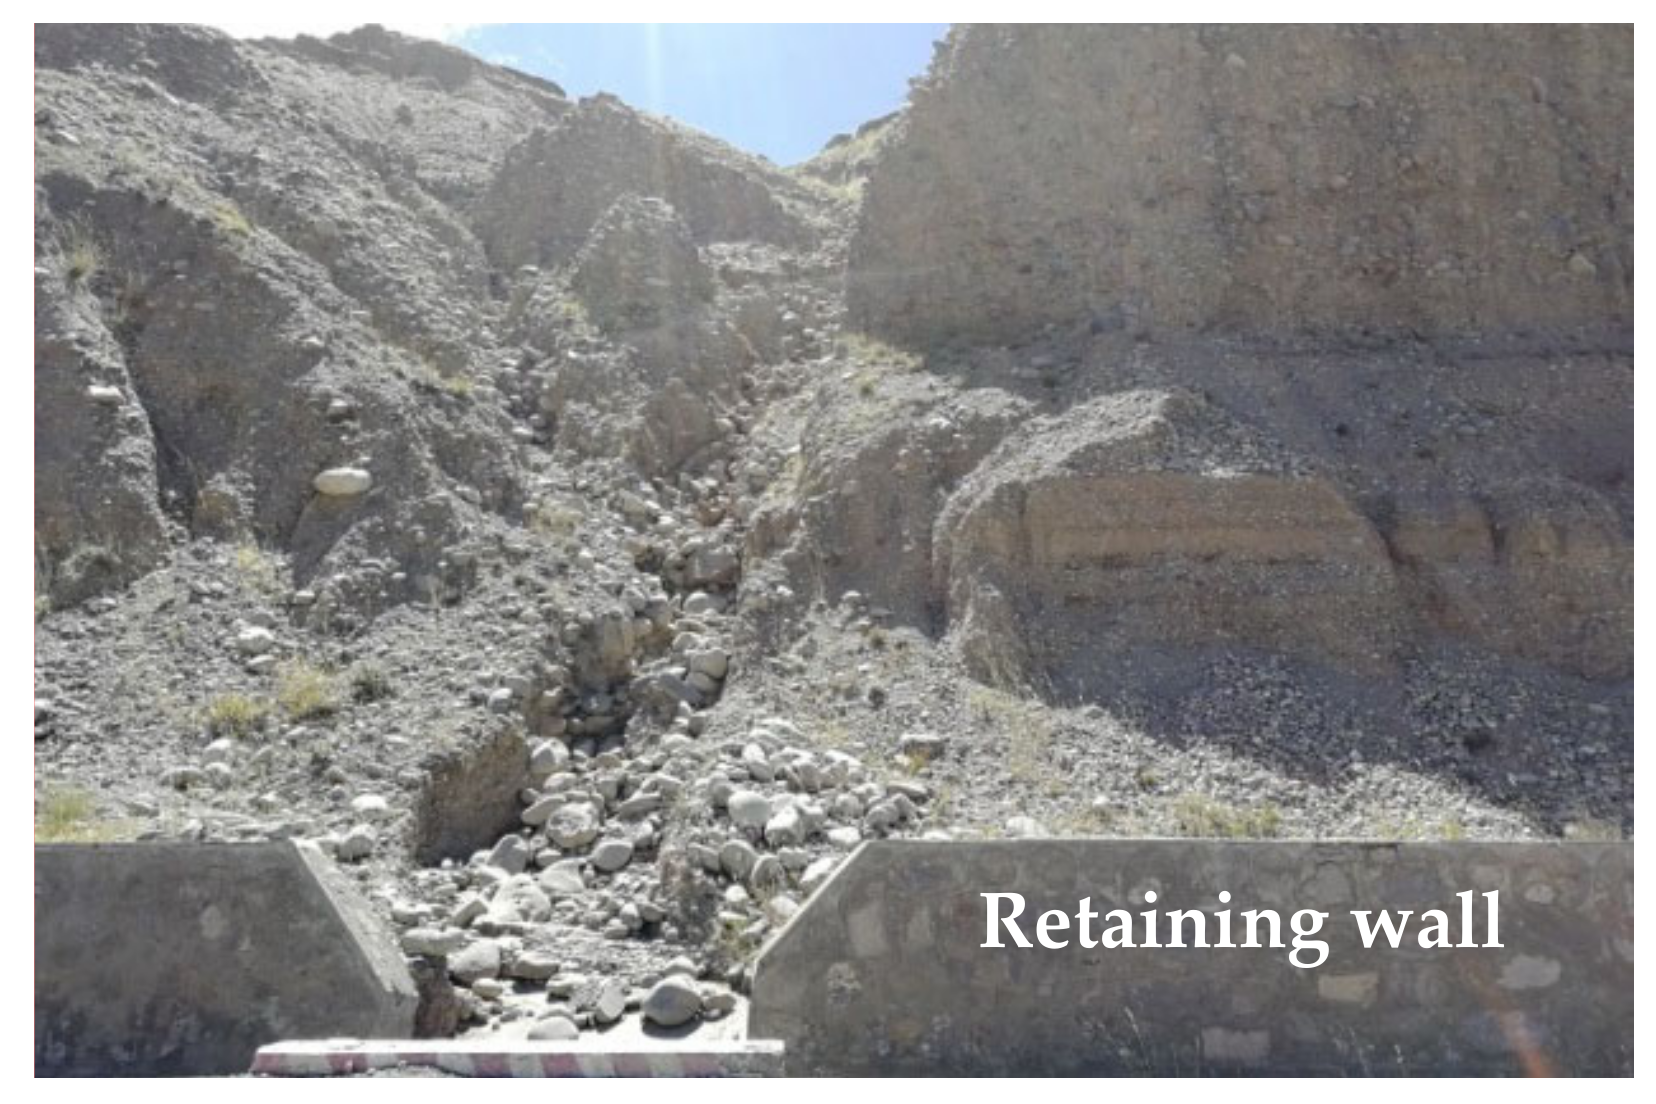
1. Introduction
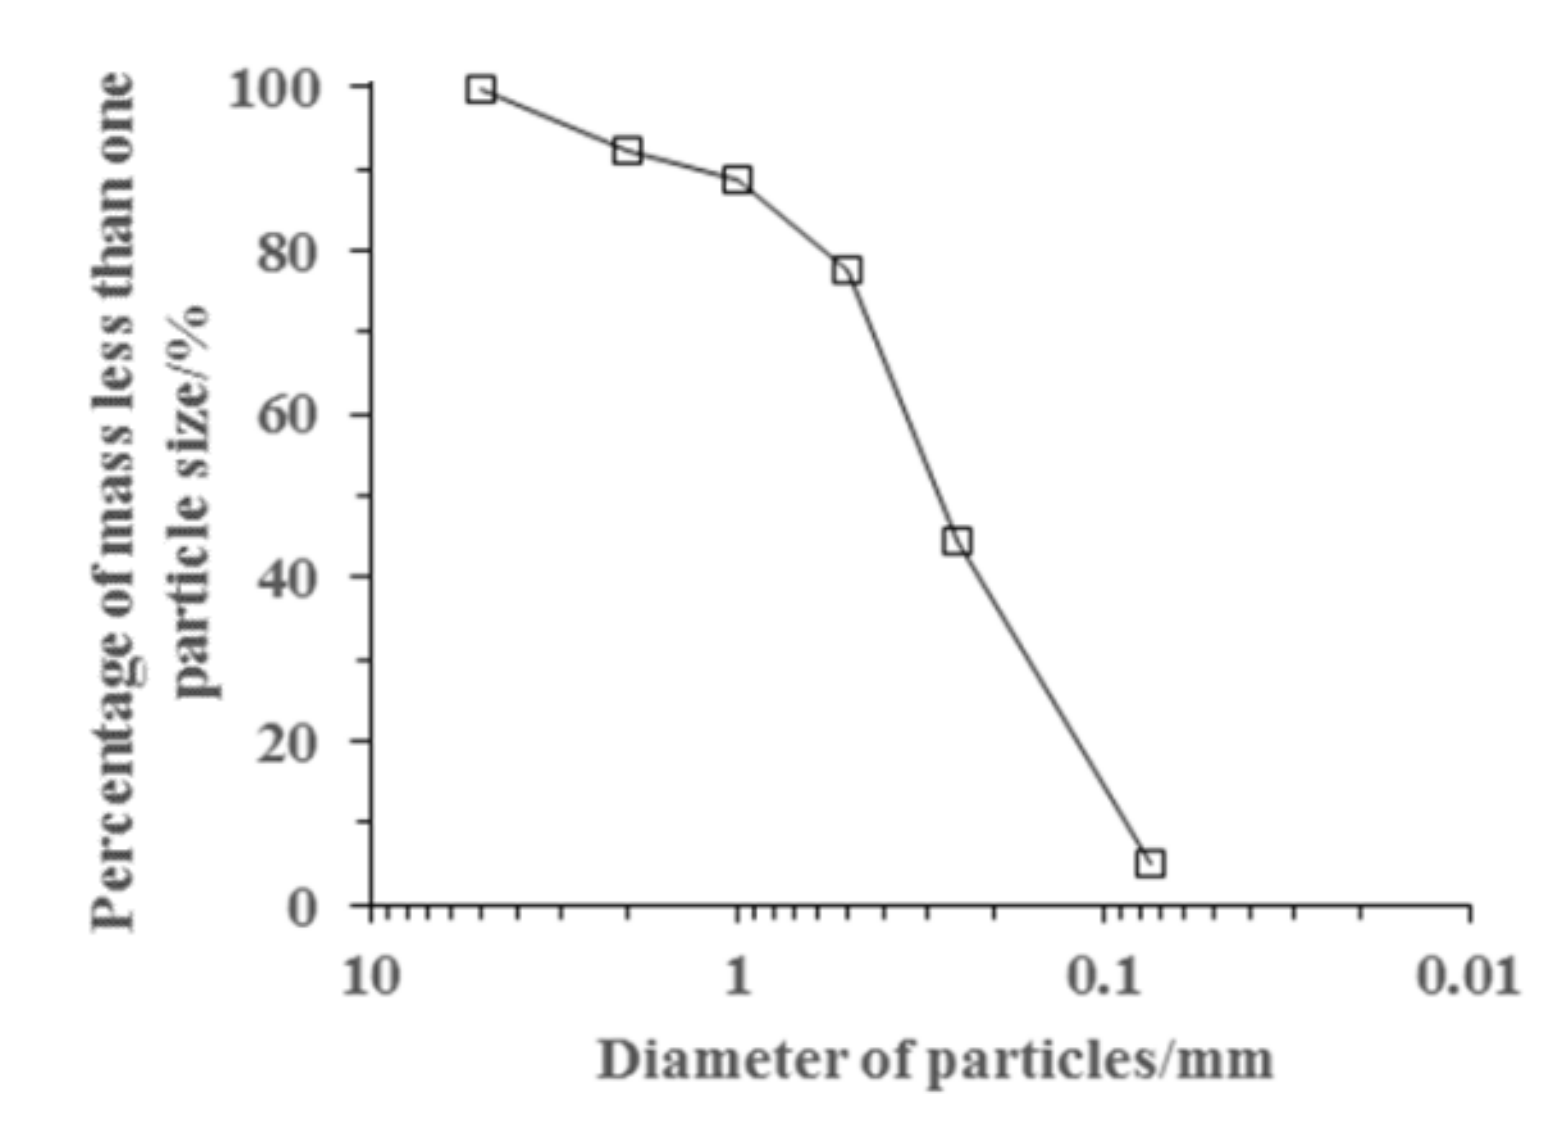
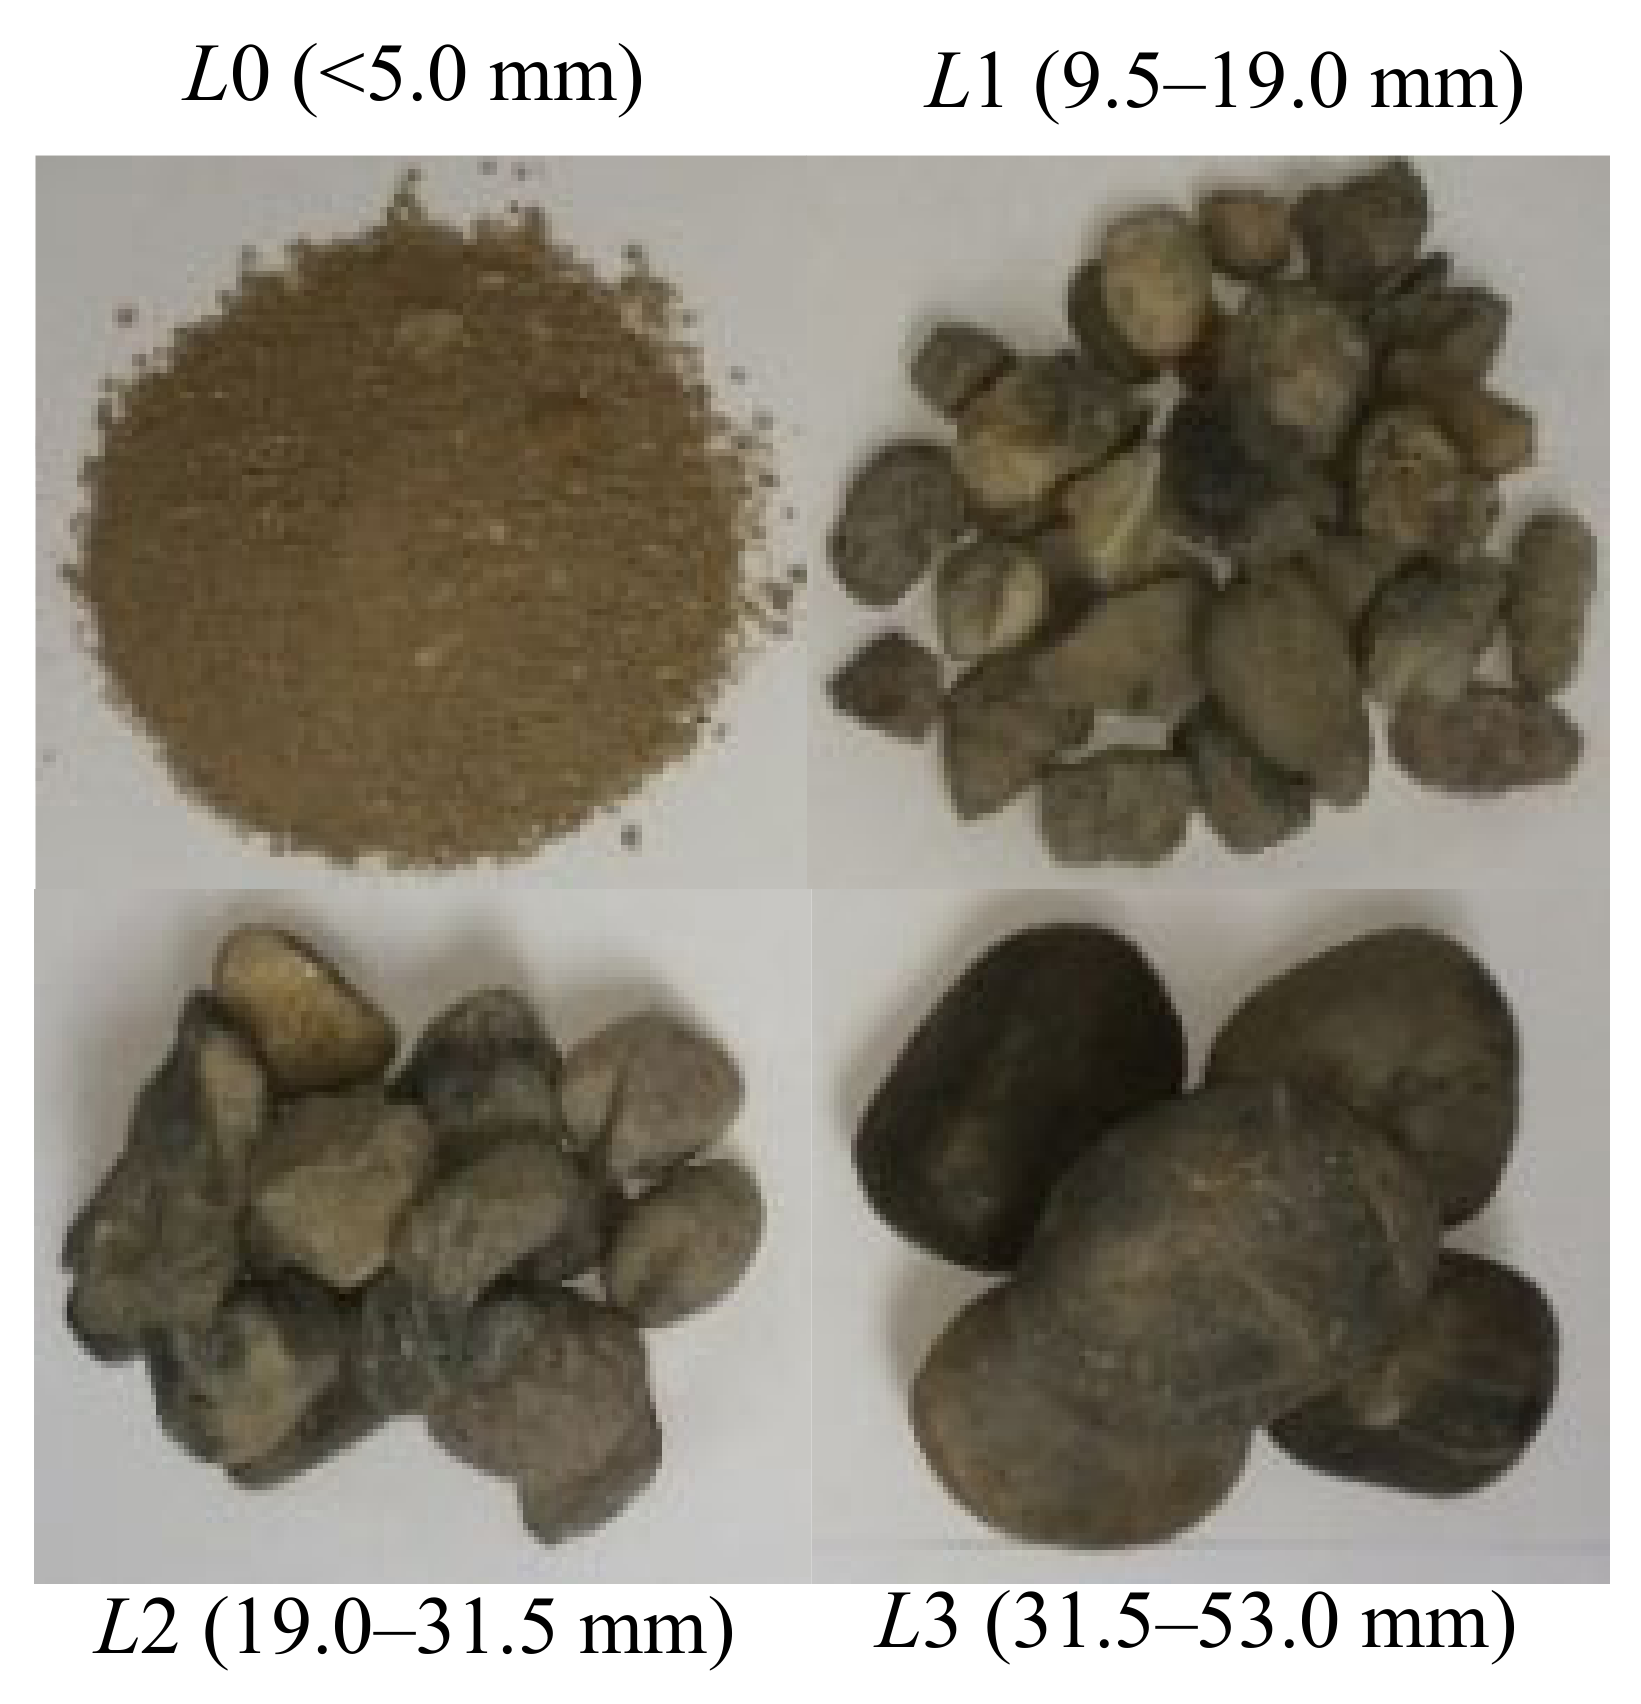
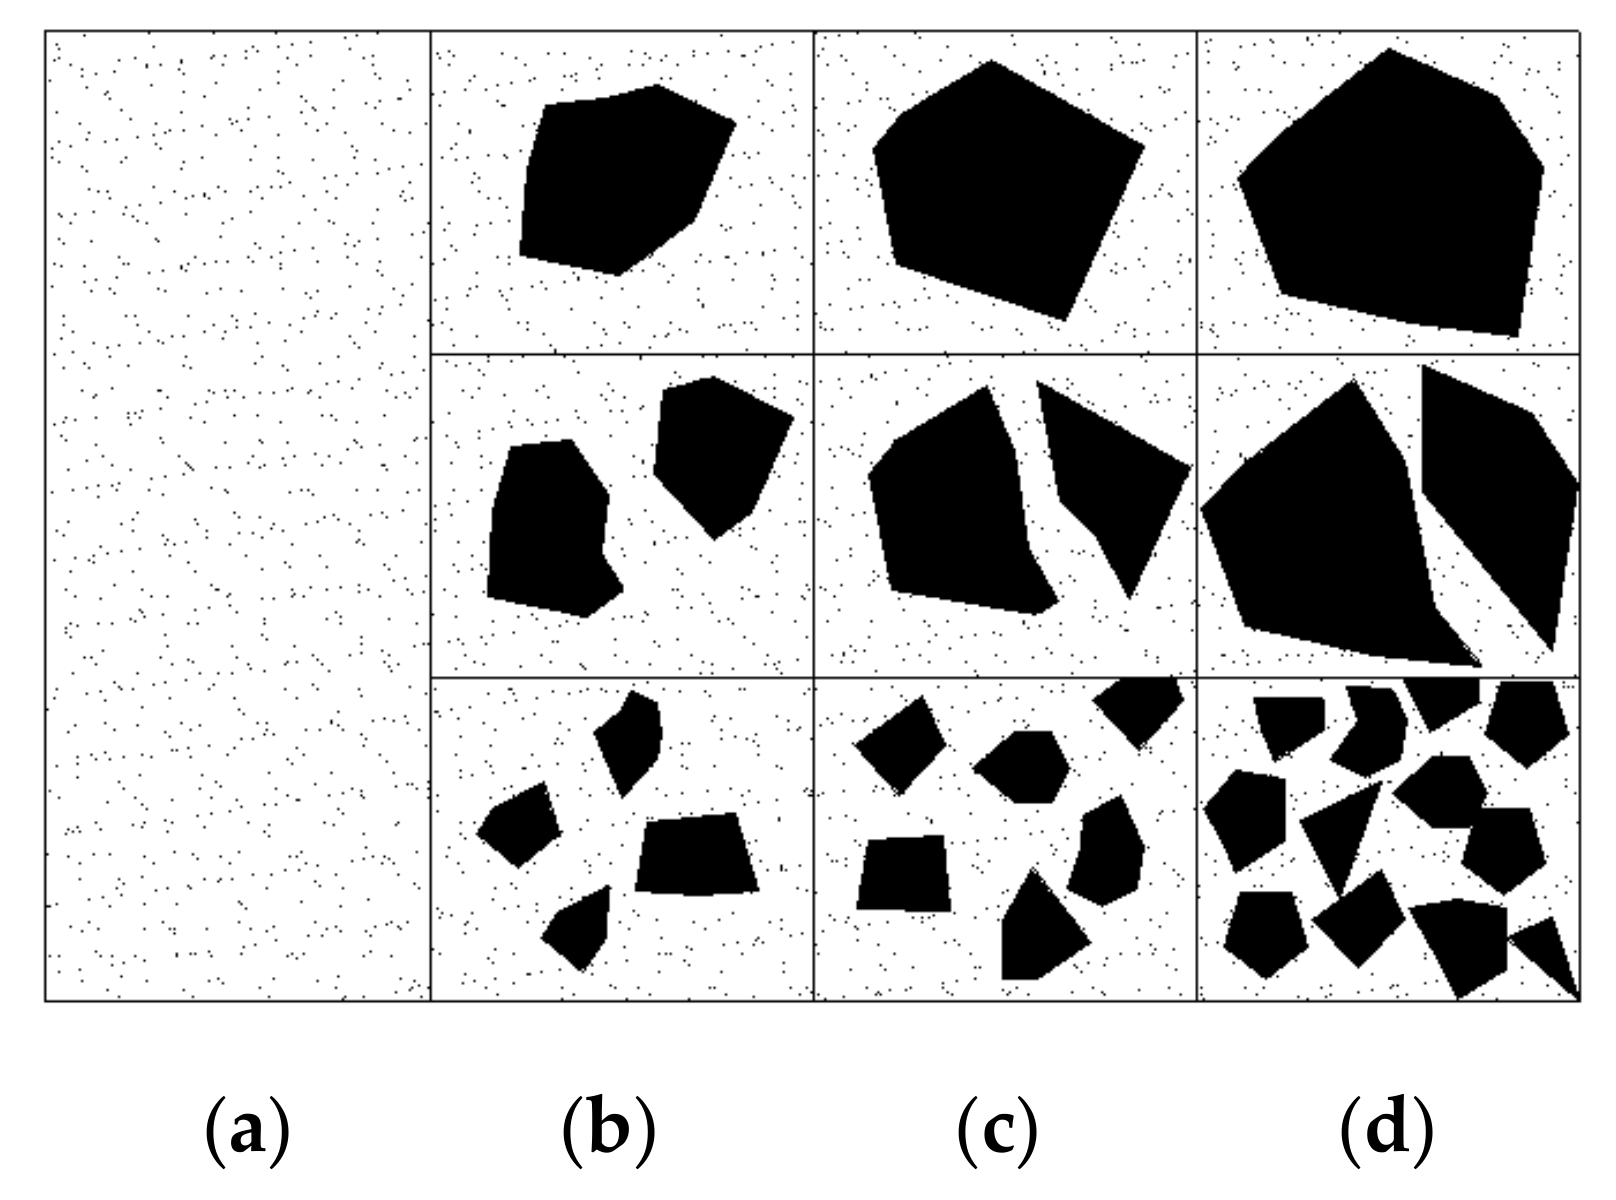
2. Test Specimen Preparation
3. Methodology
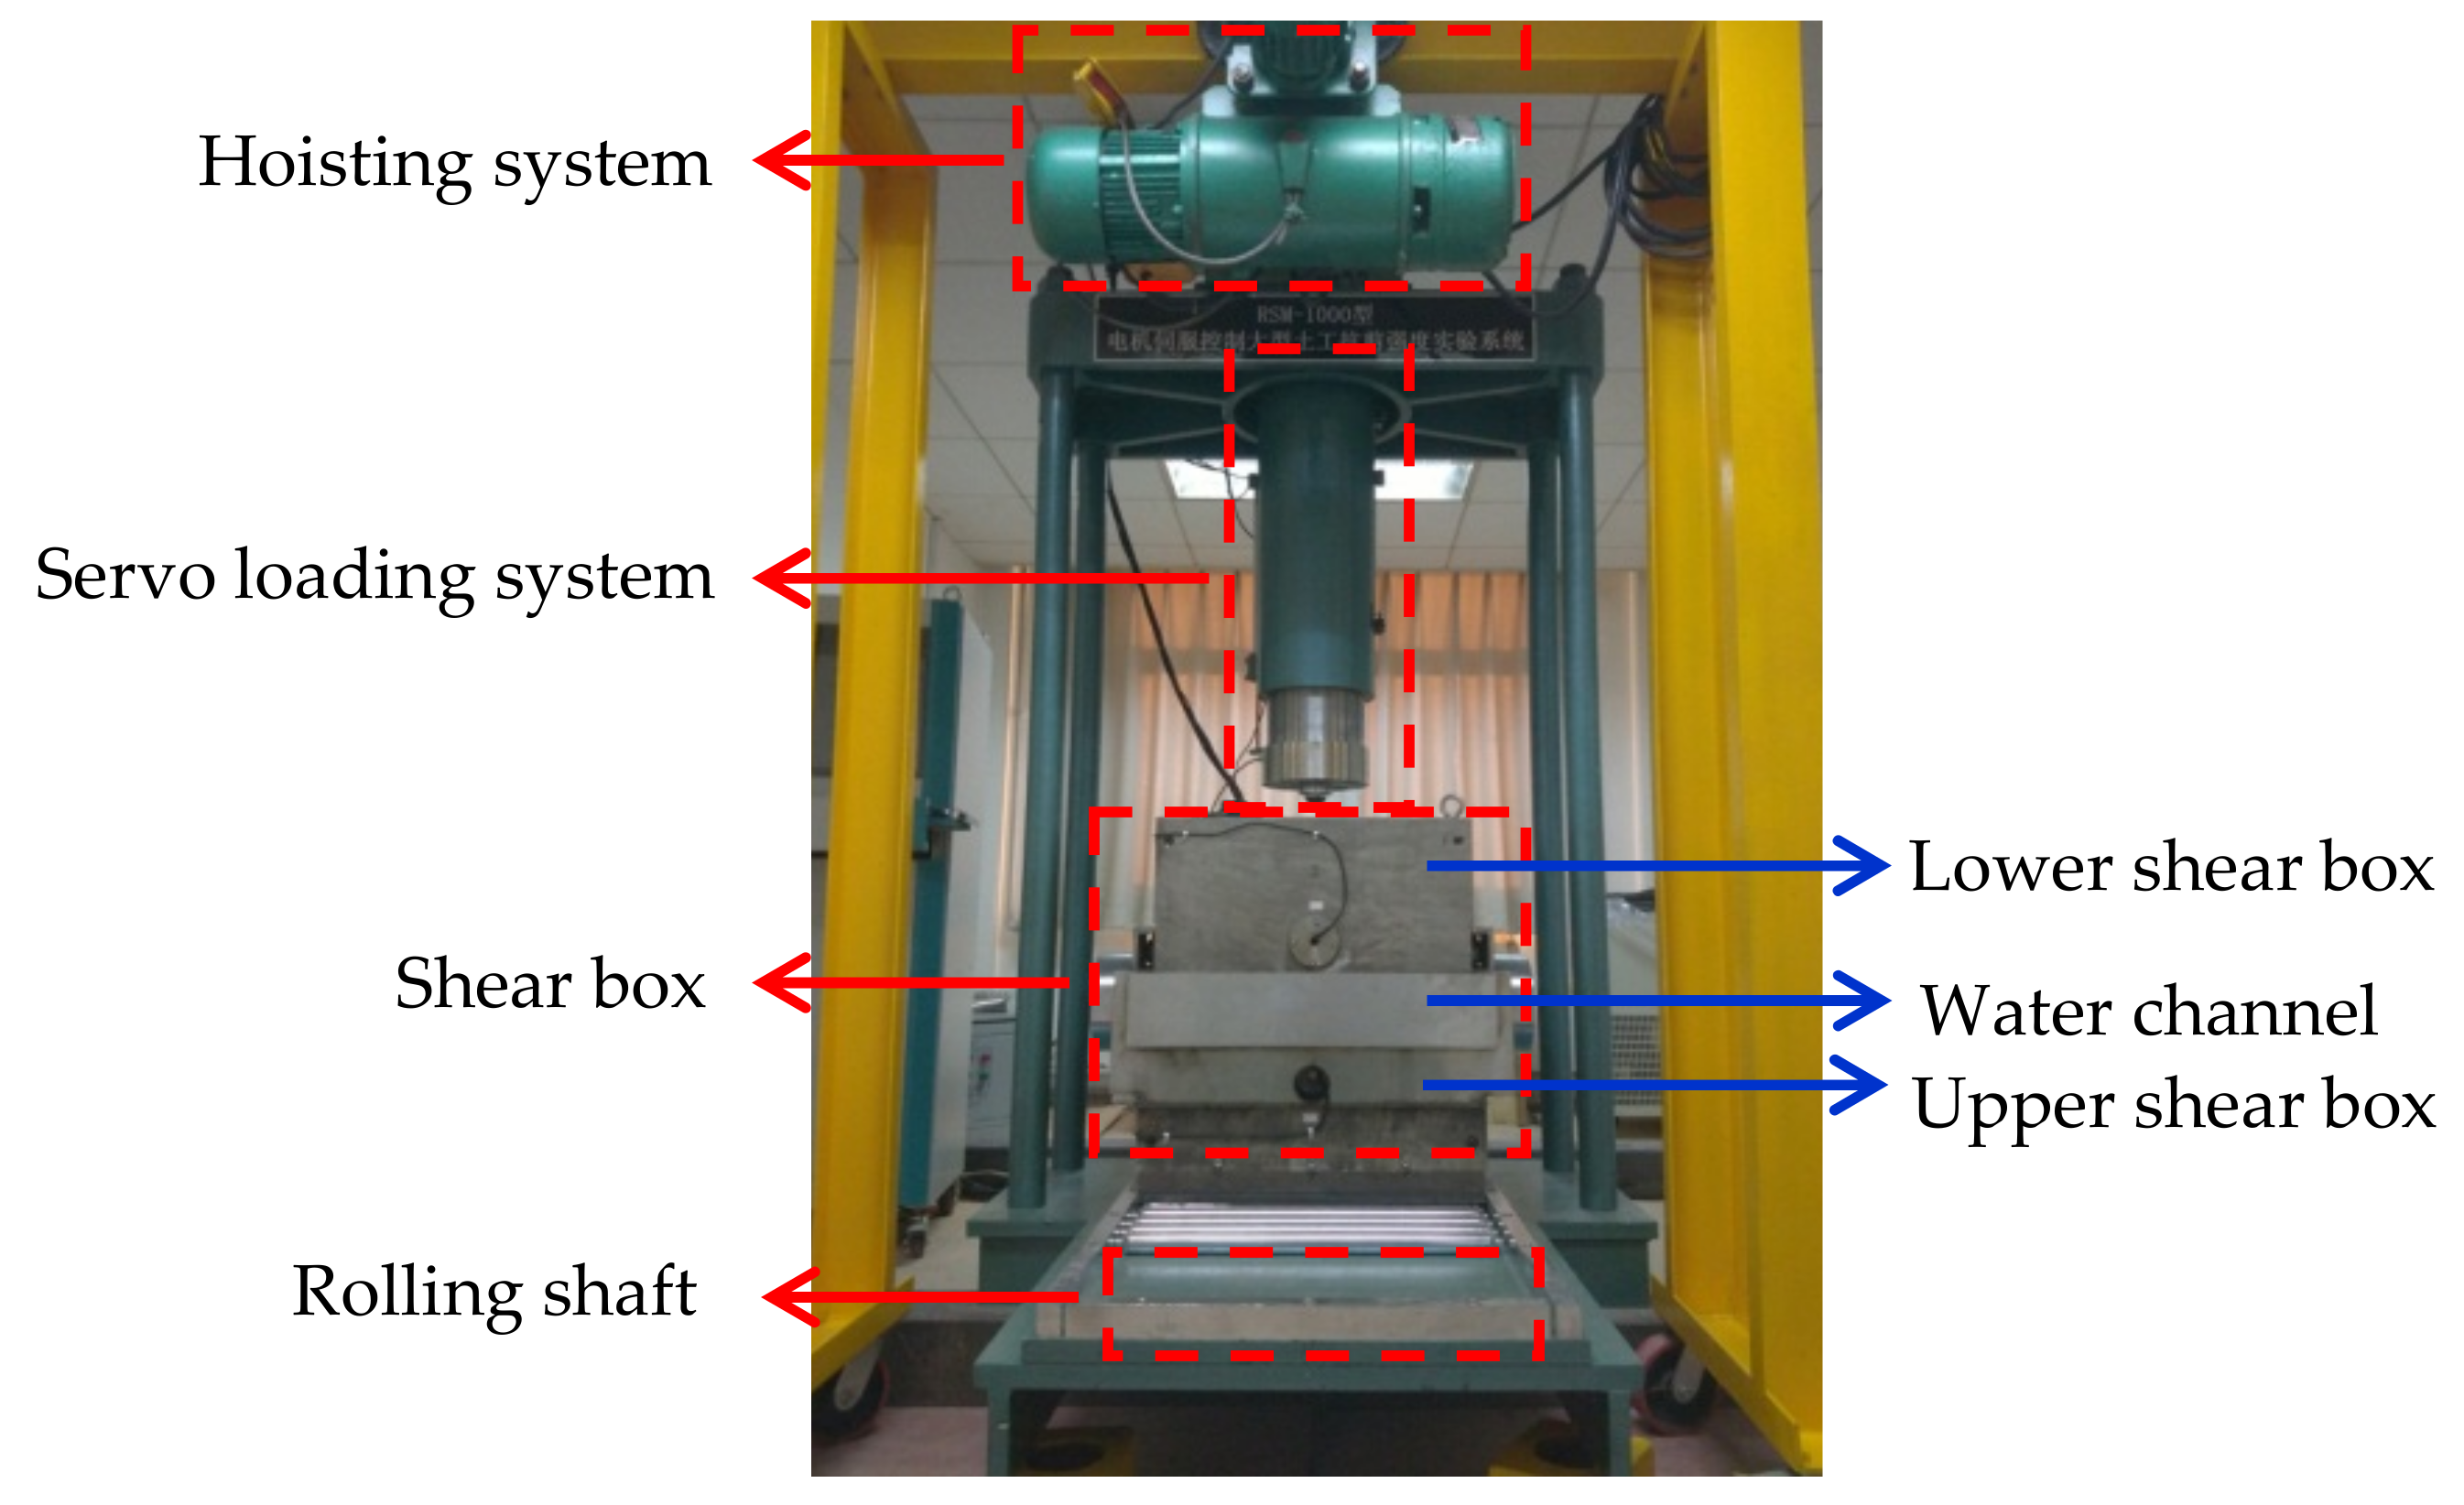
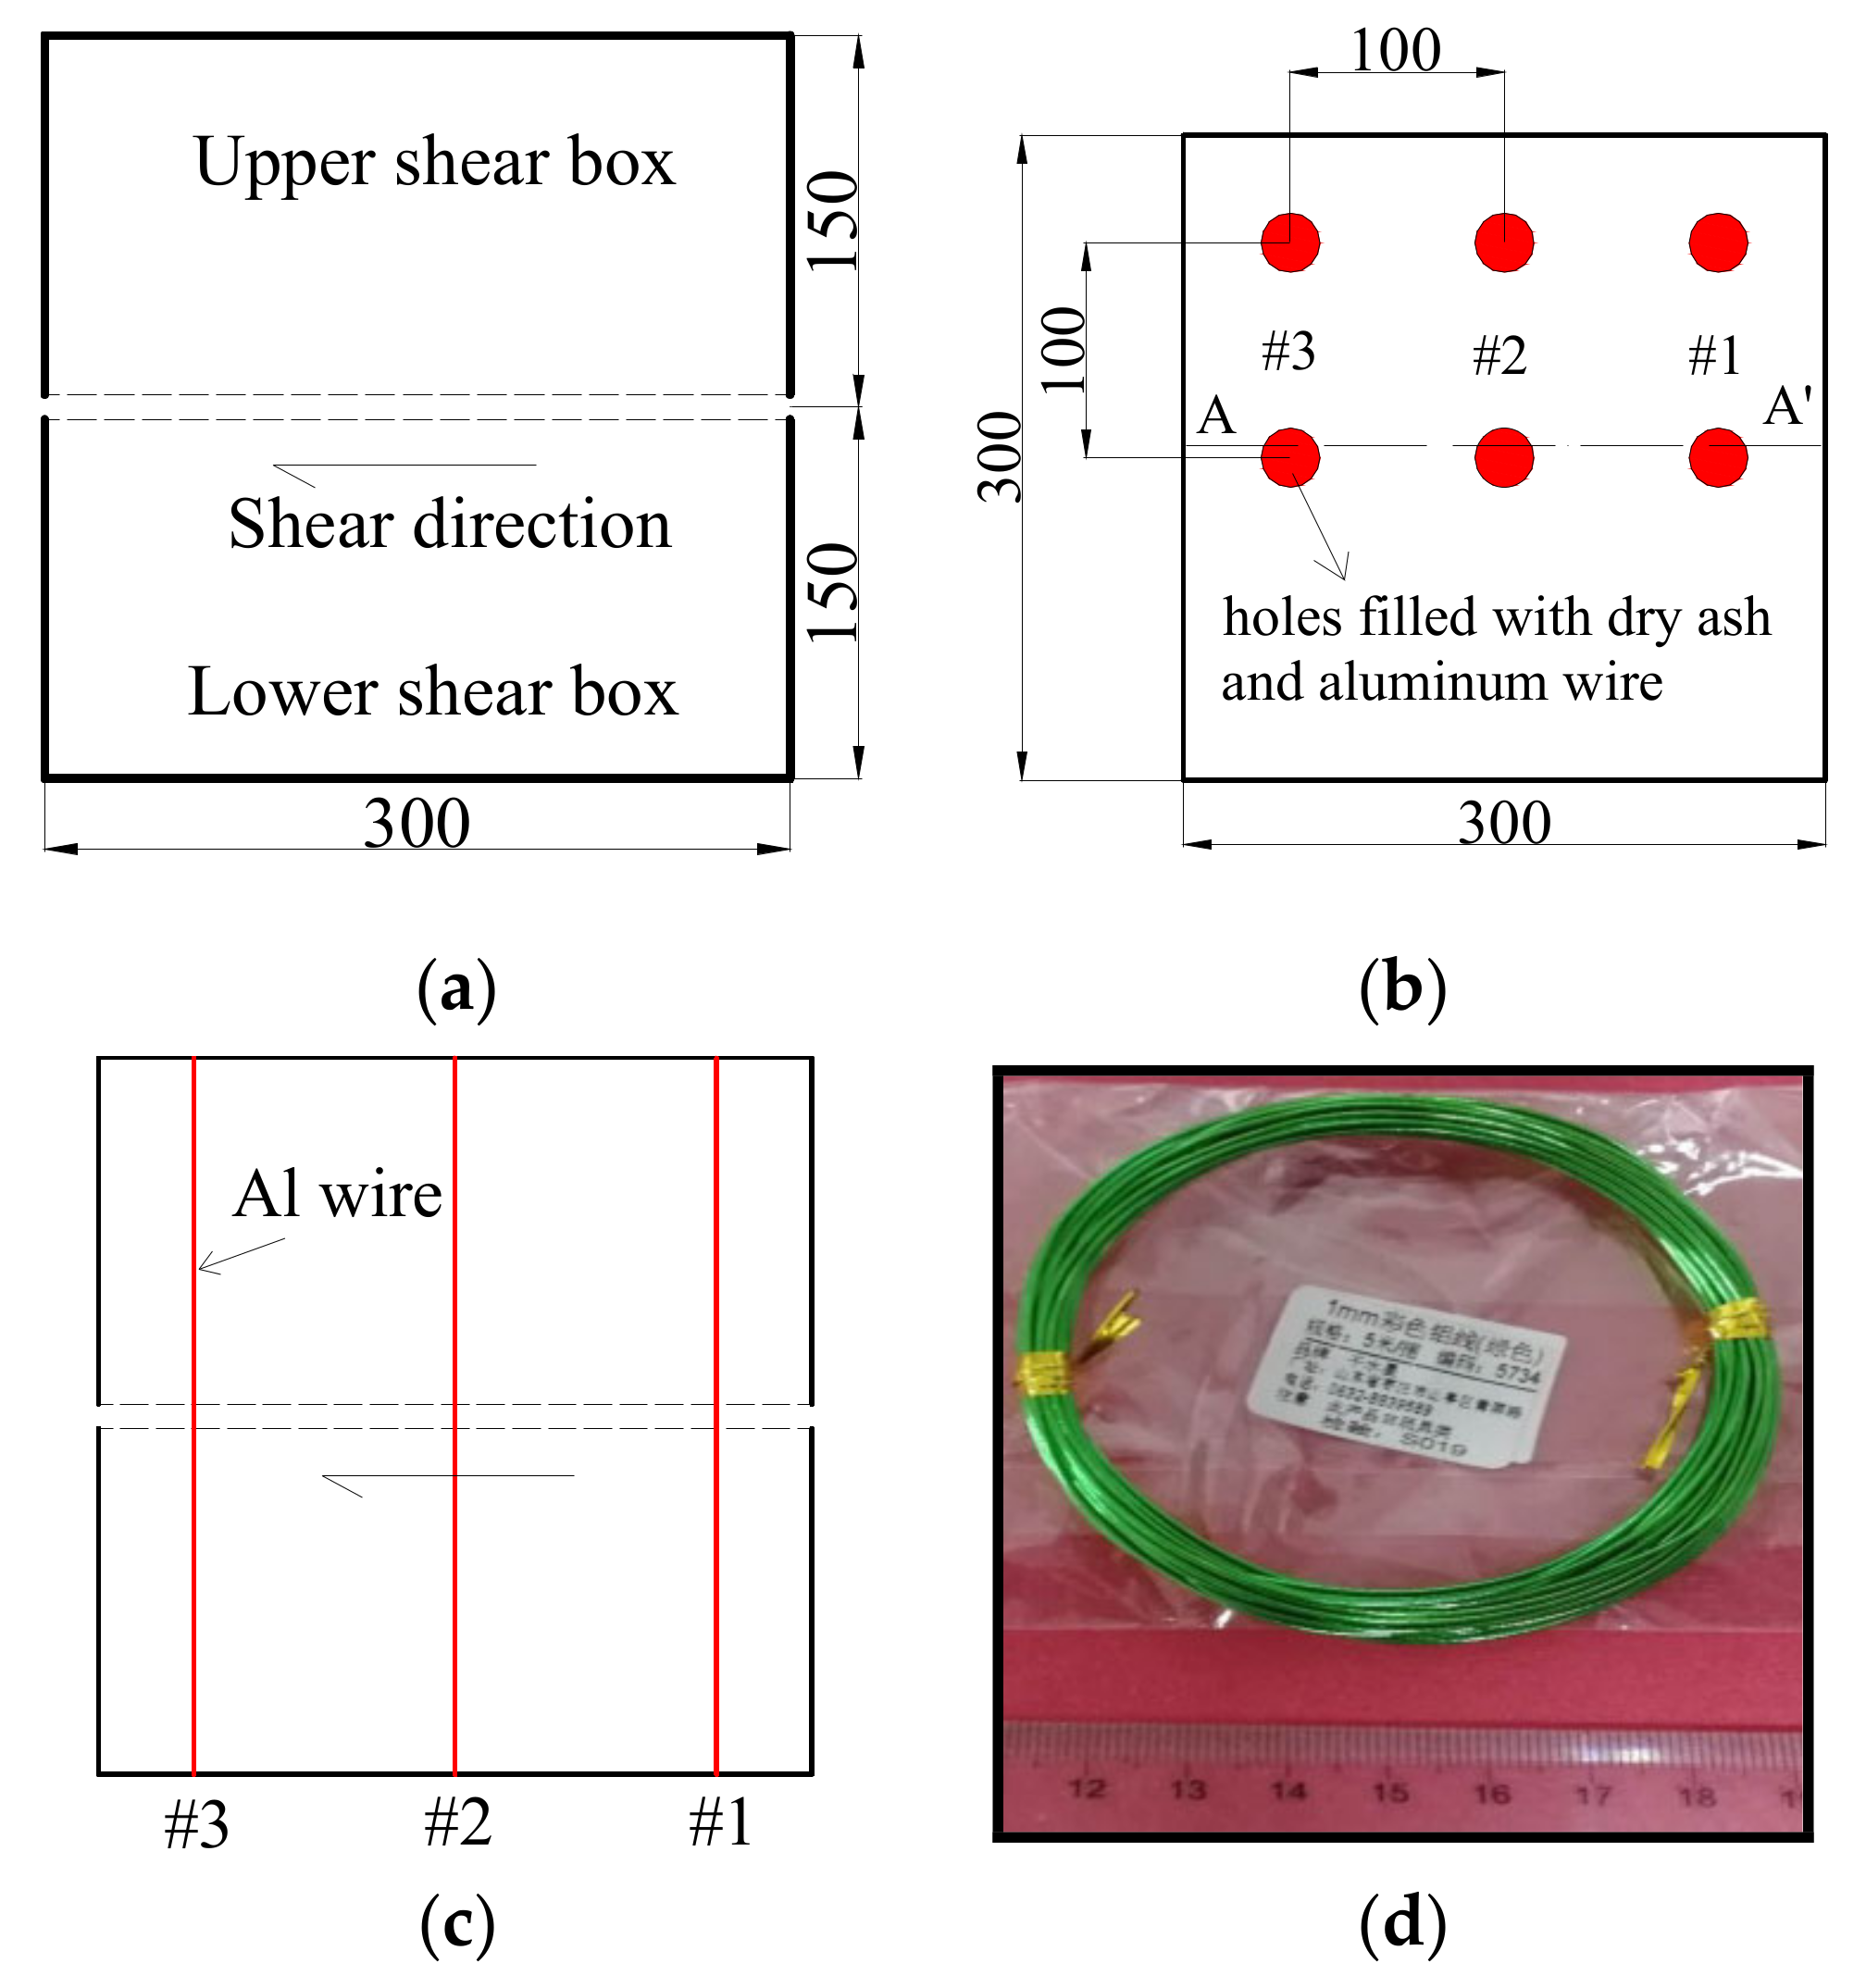
3.1. Large-Sized Shear Test Apparatus
3.2. Test Design
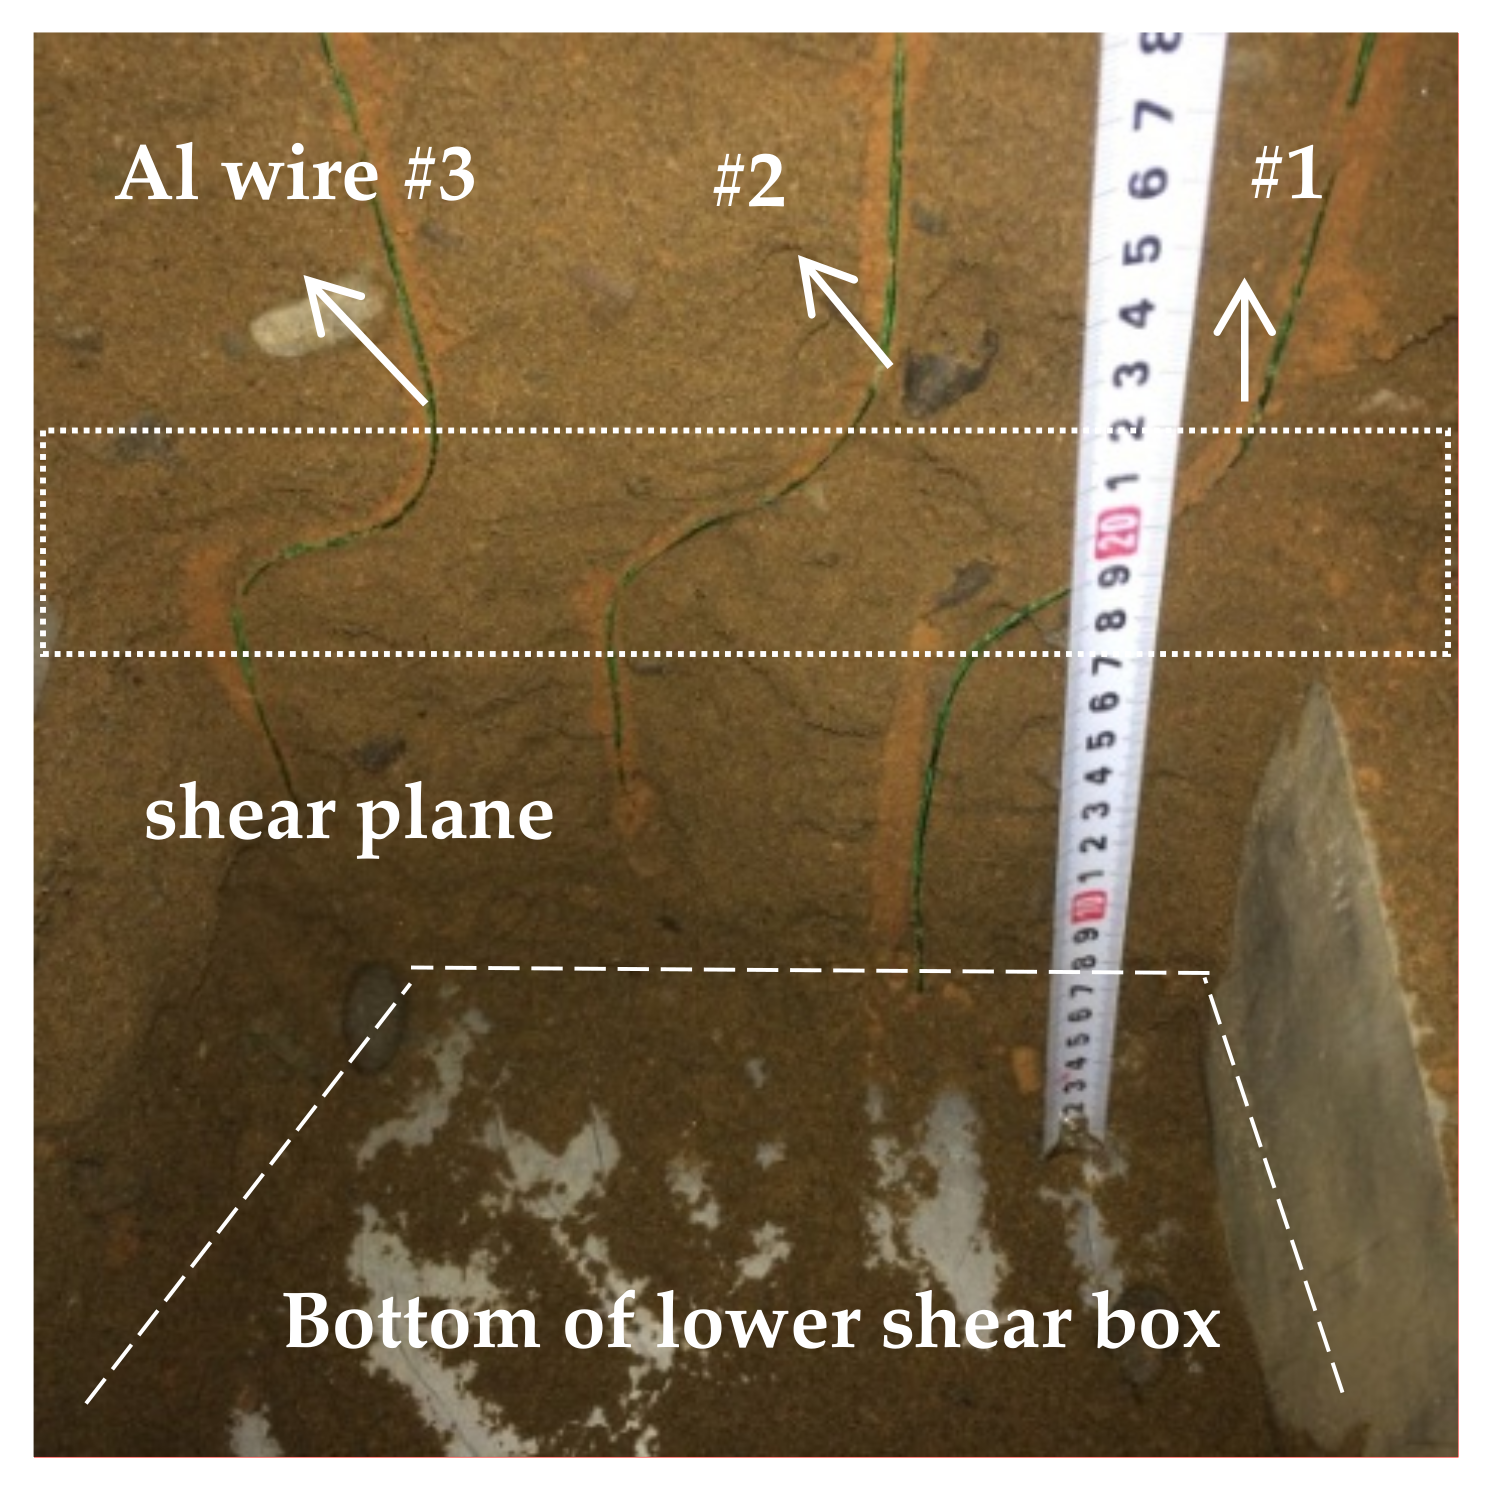
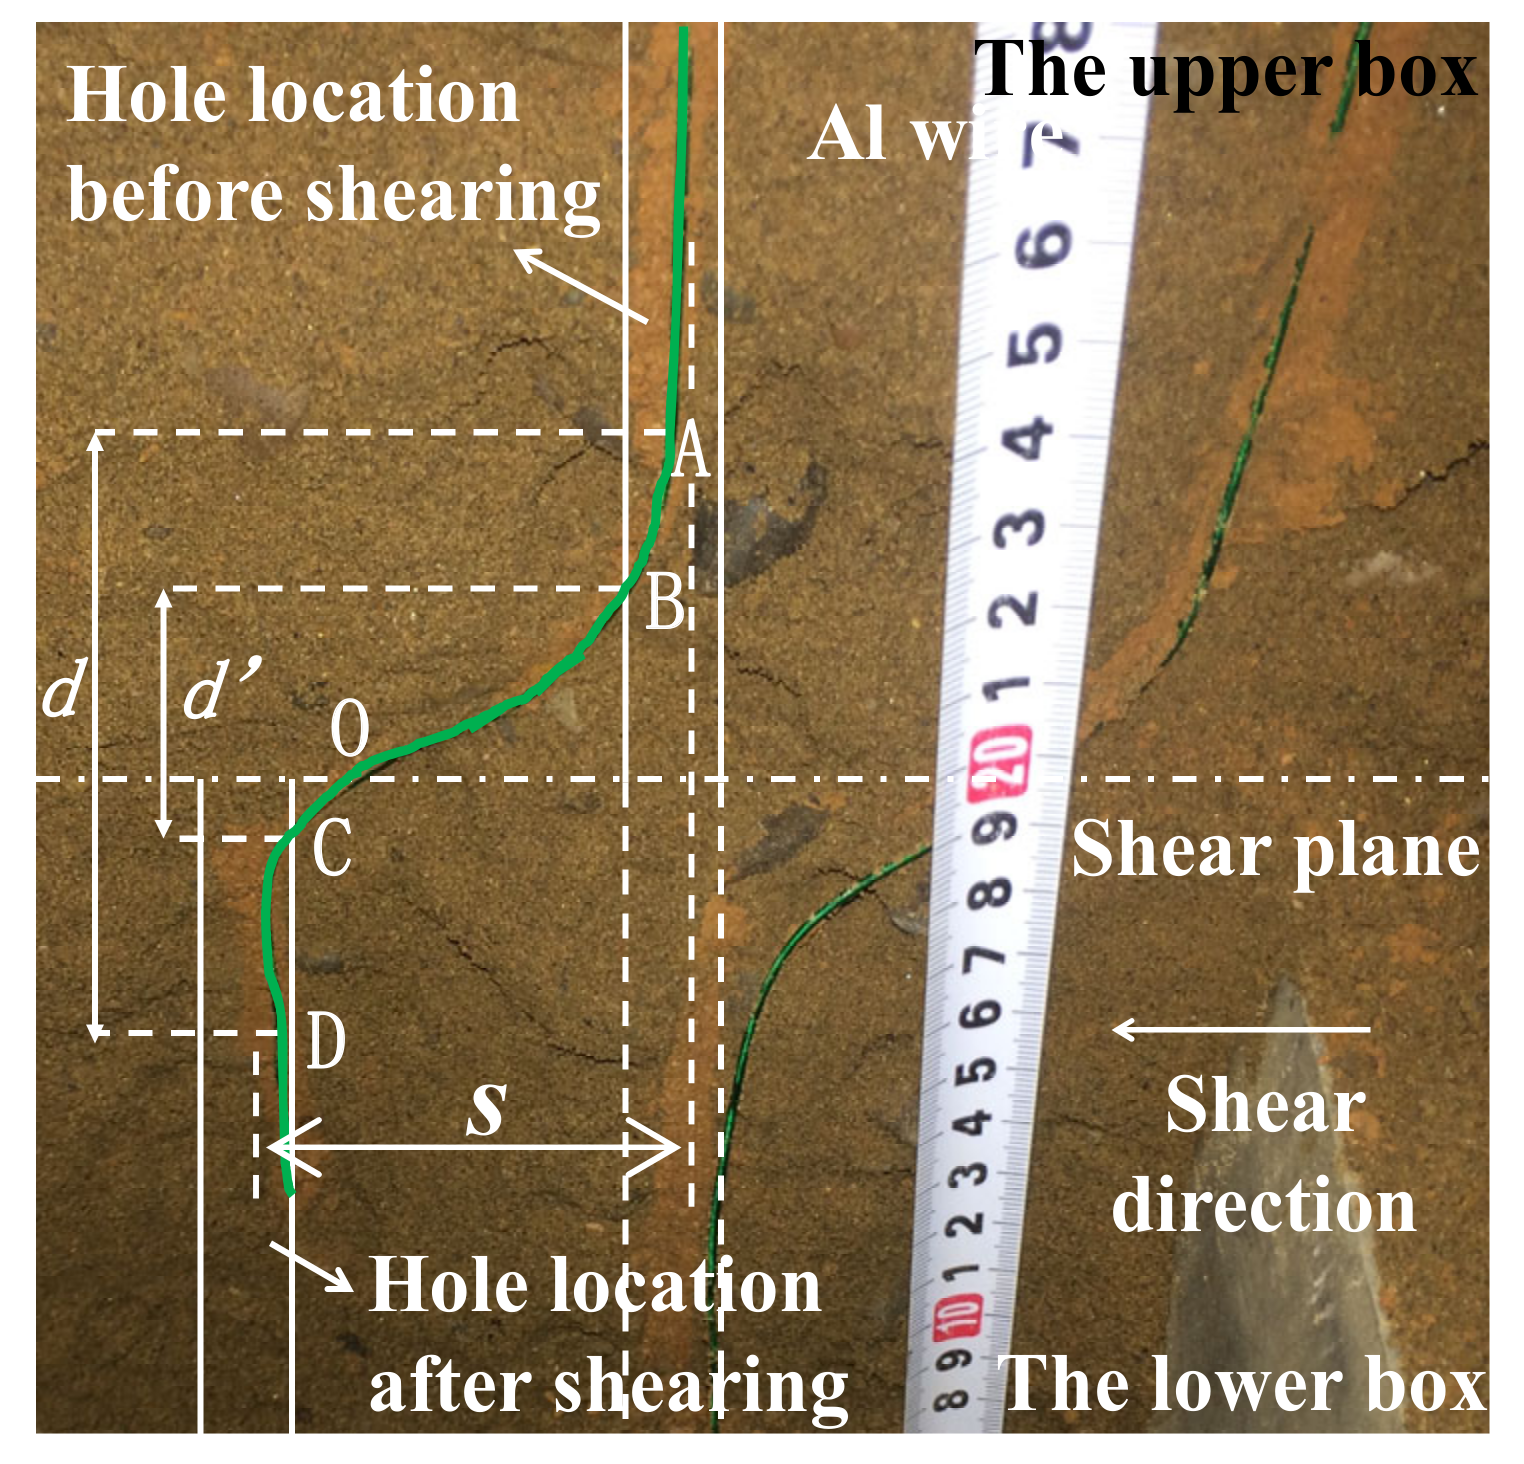
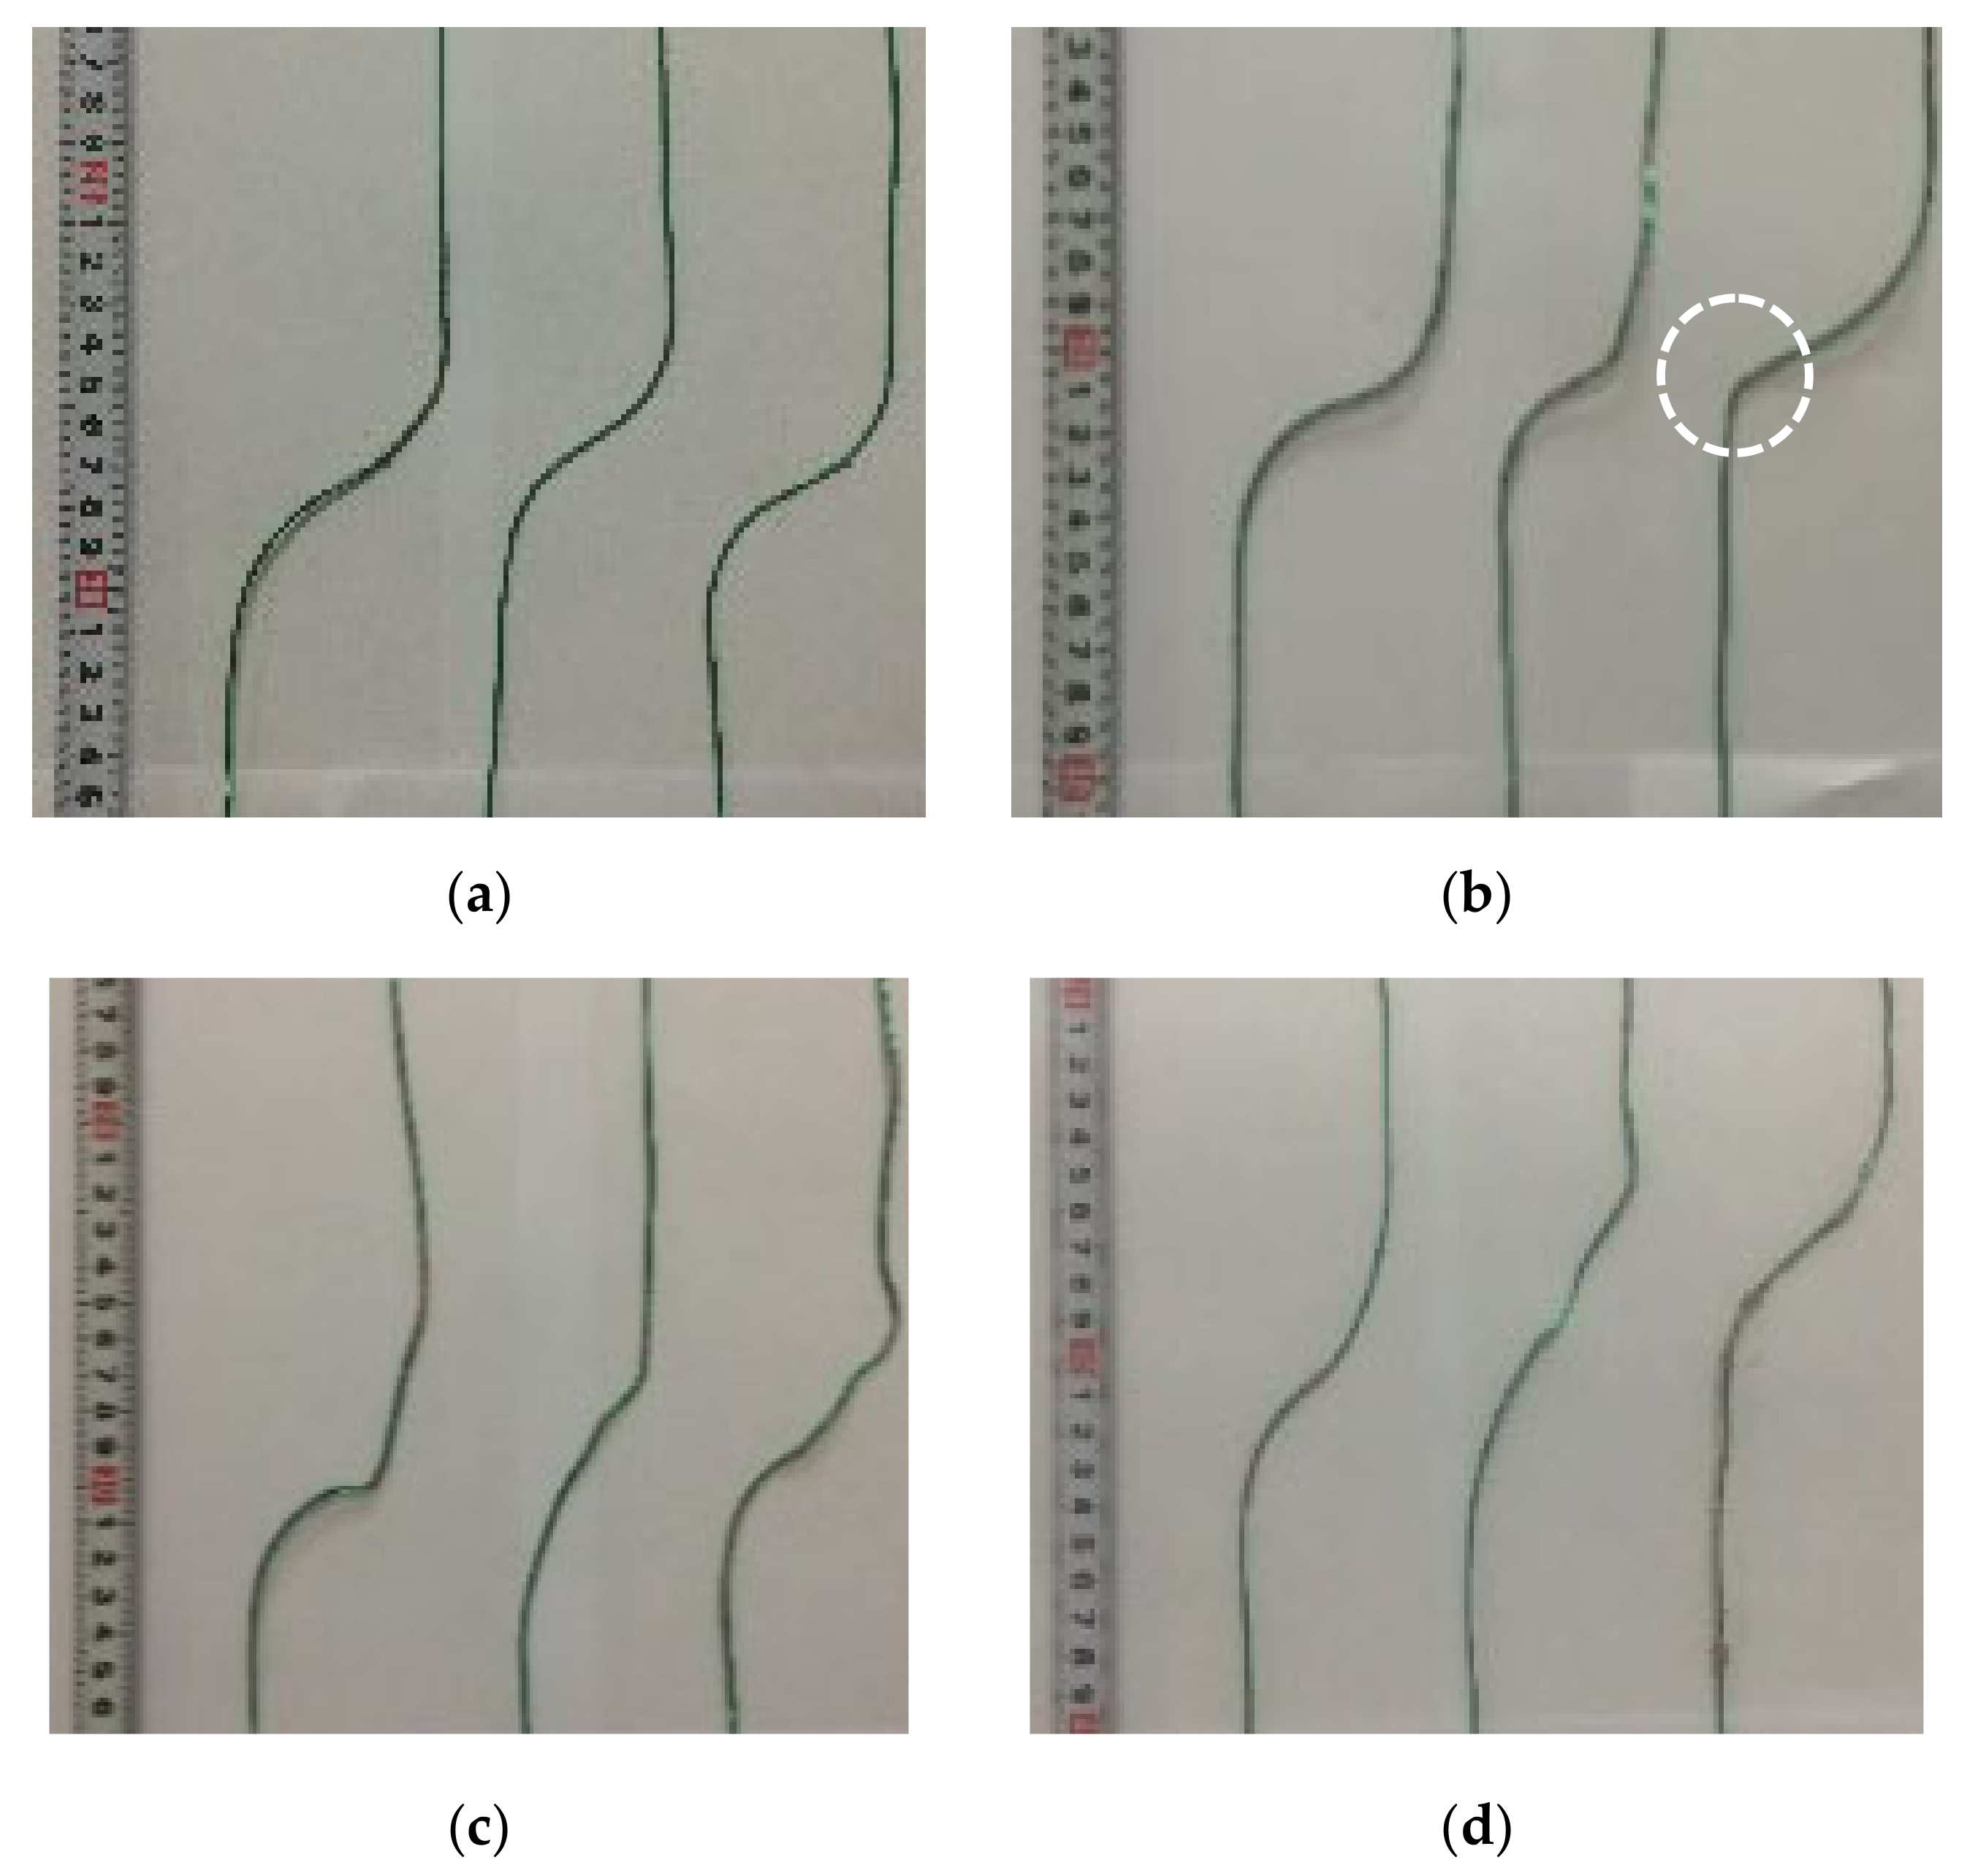
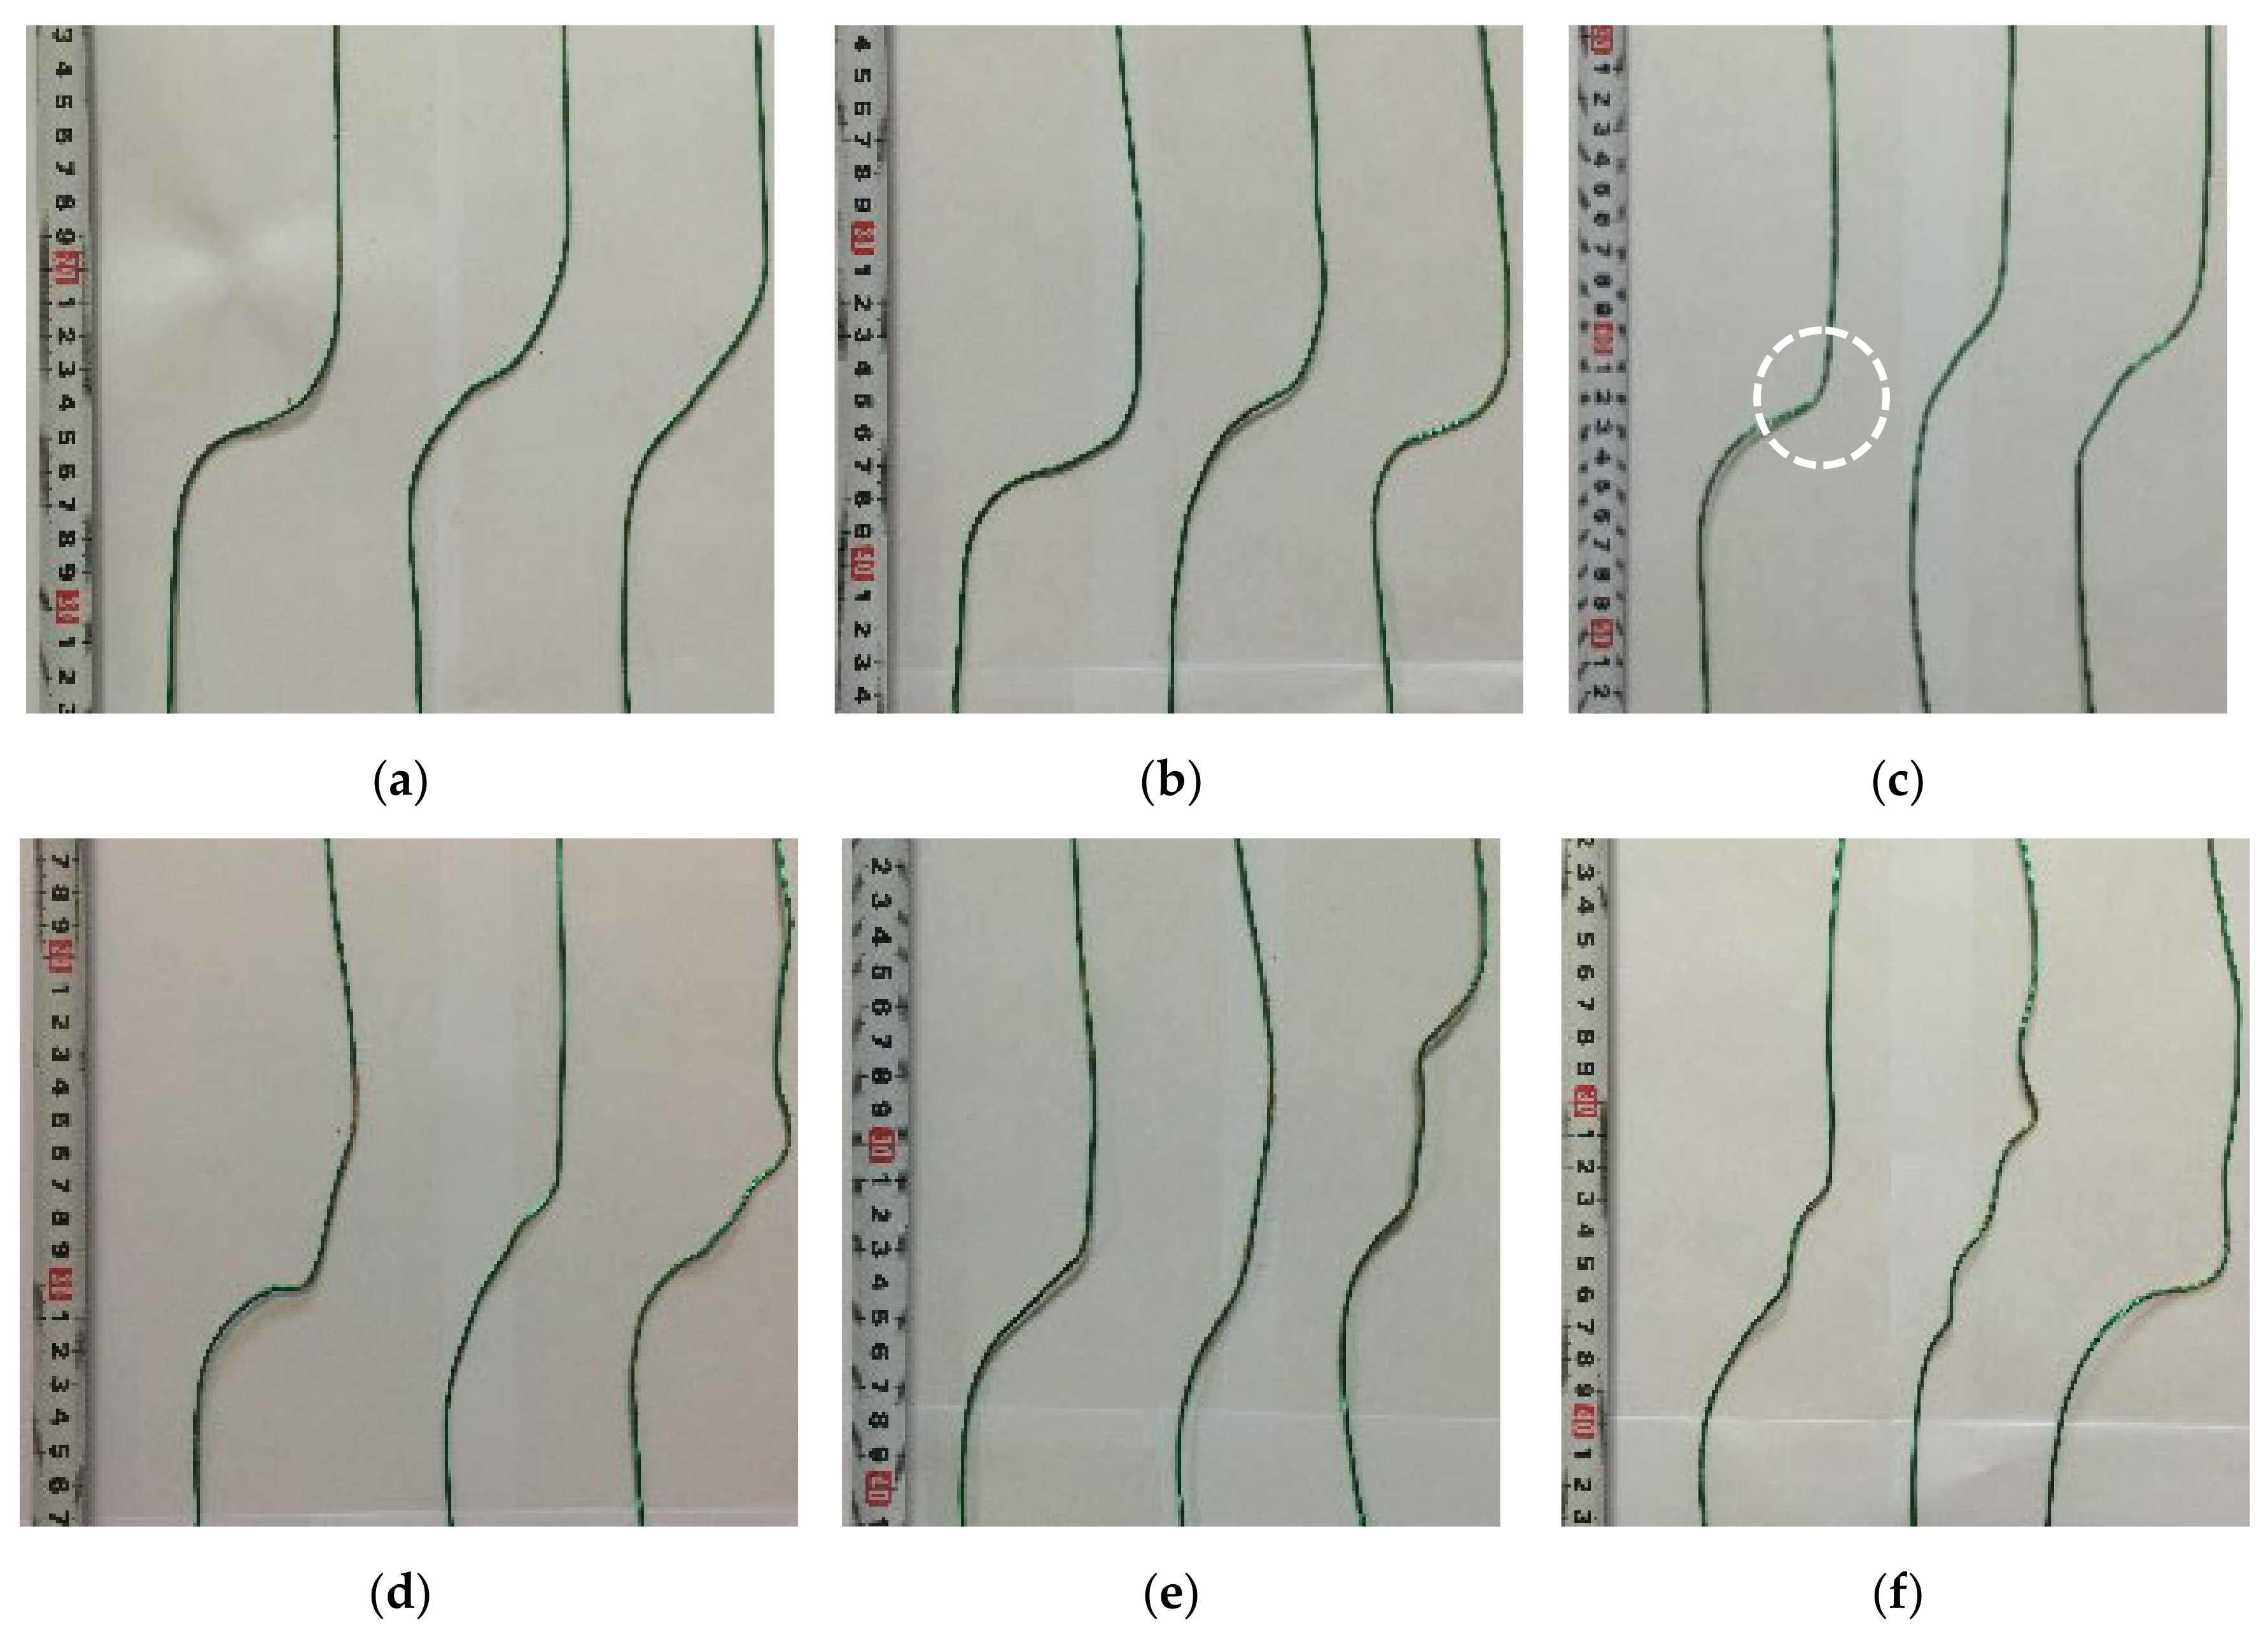
3.3. Shear Deformation Monitoring Method
3.4. Test Procedure
4. Results
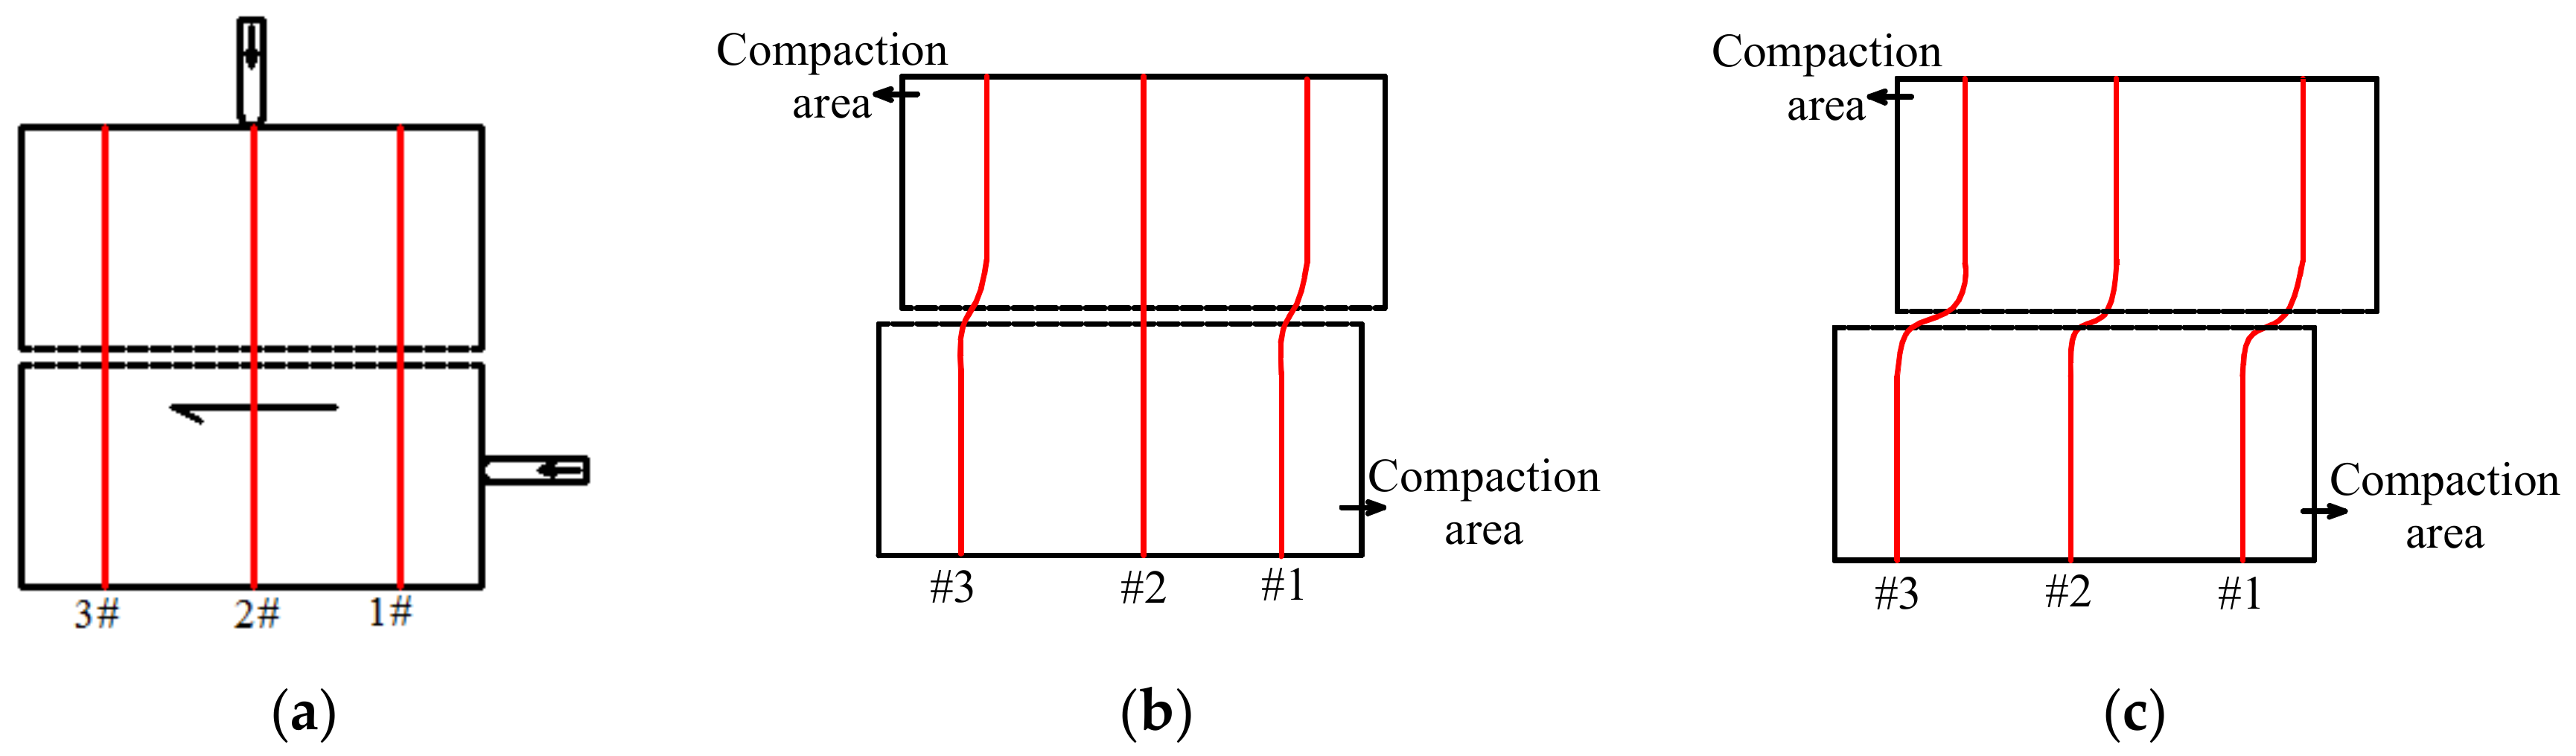
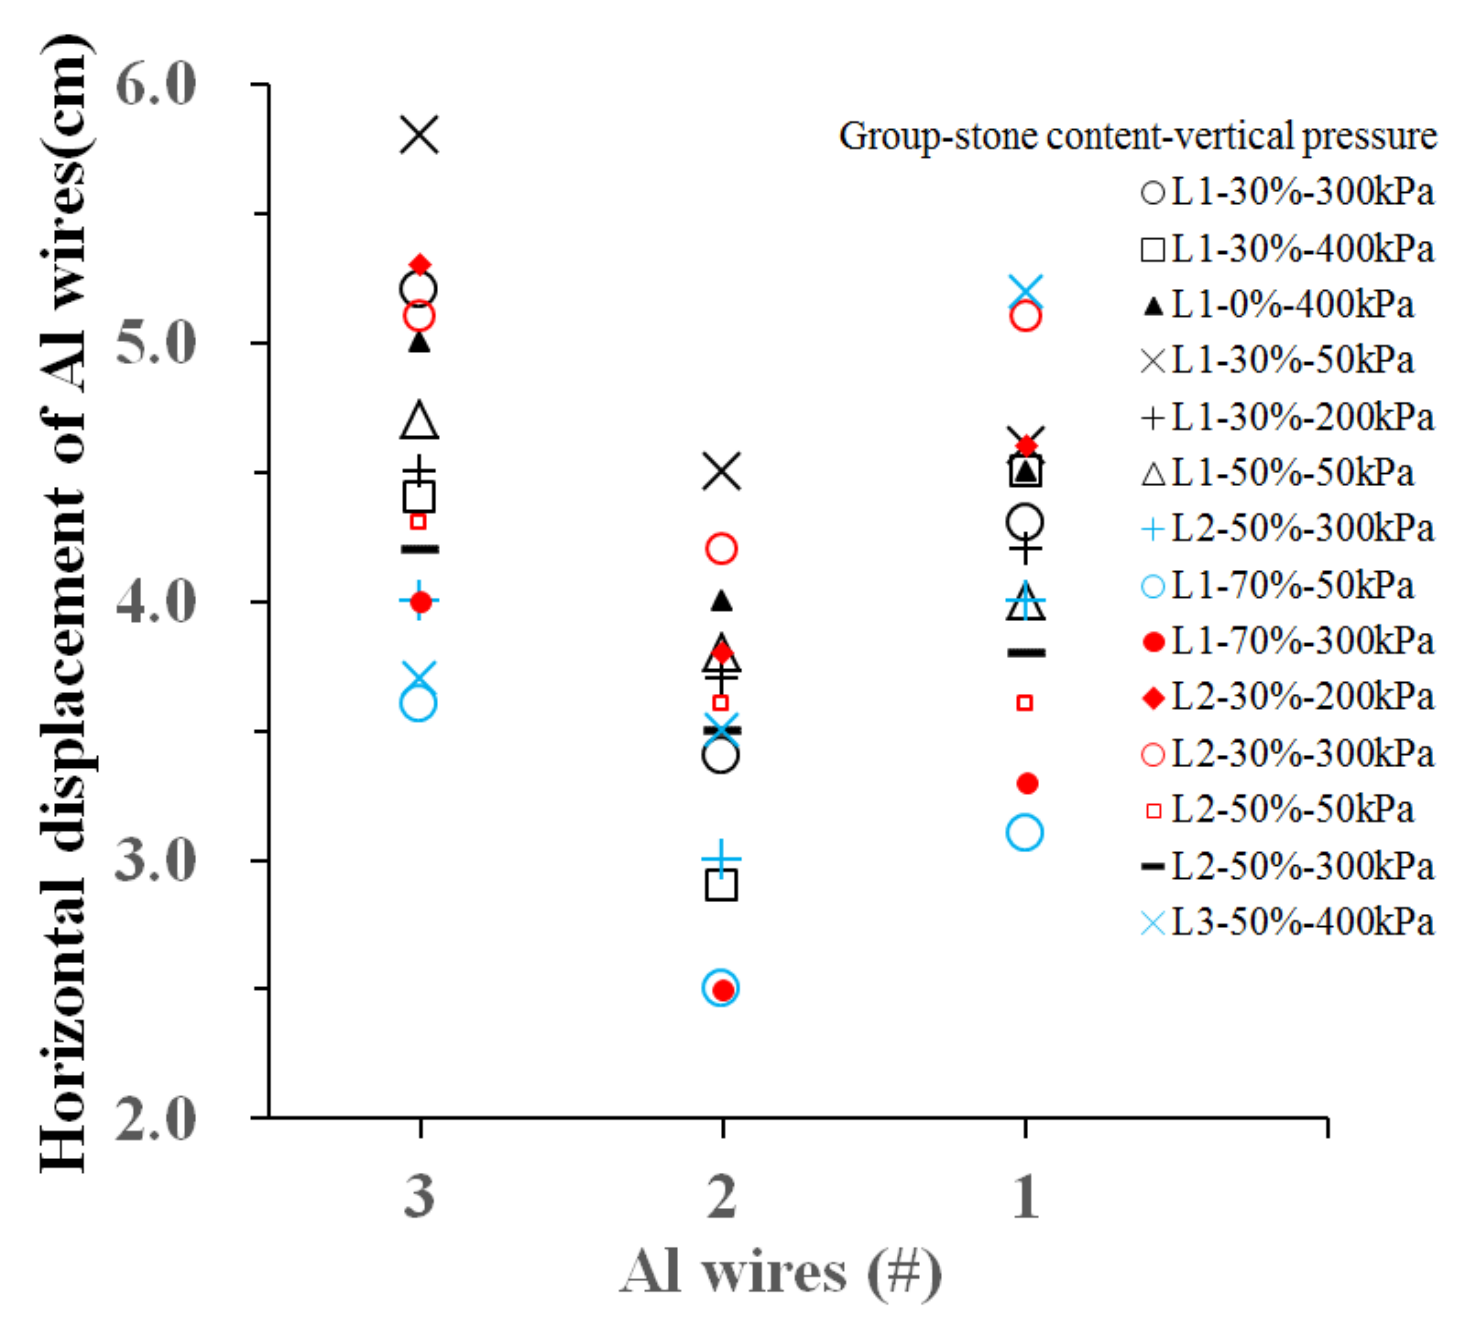
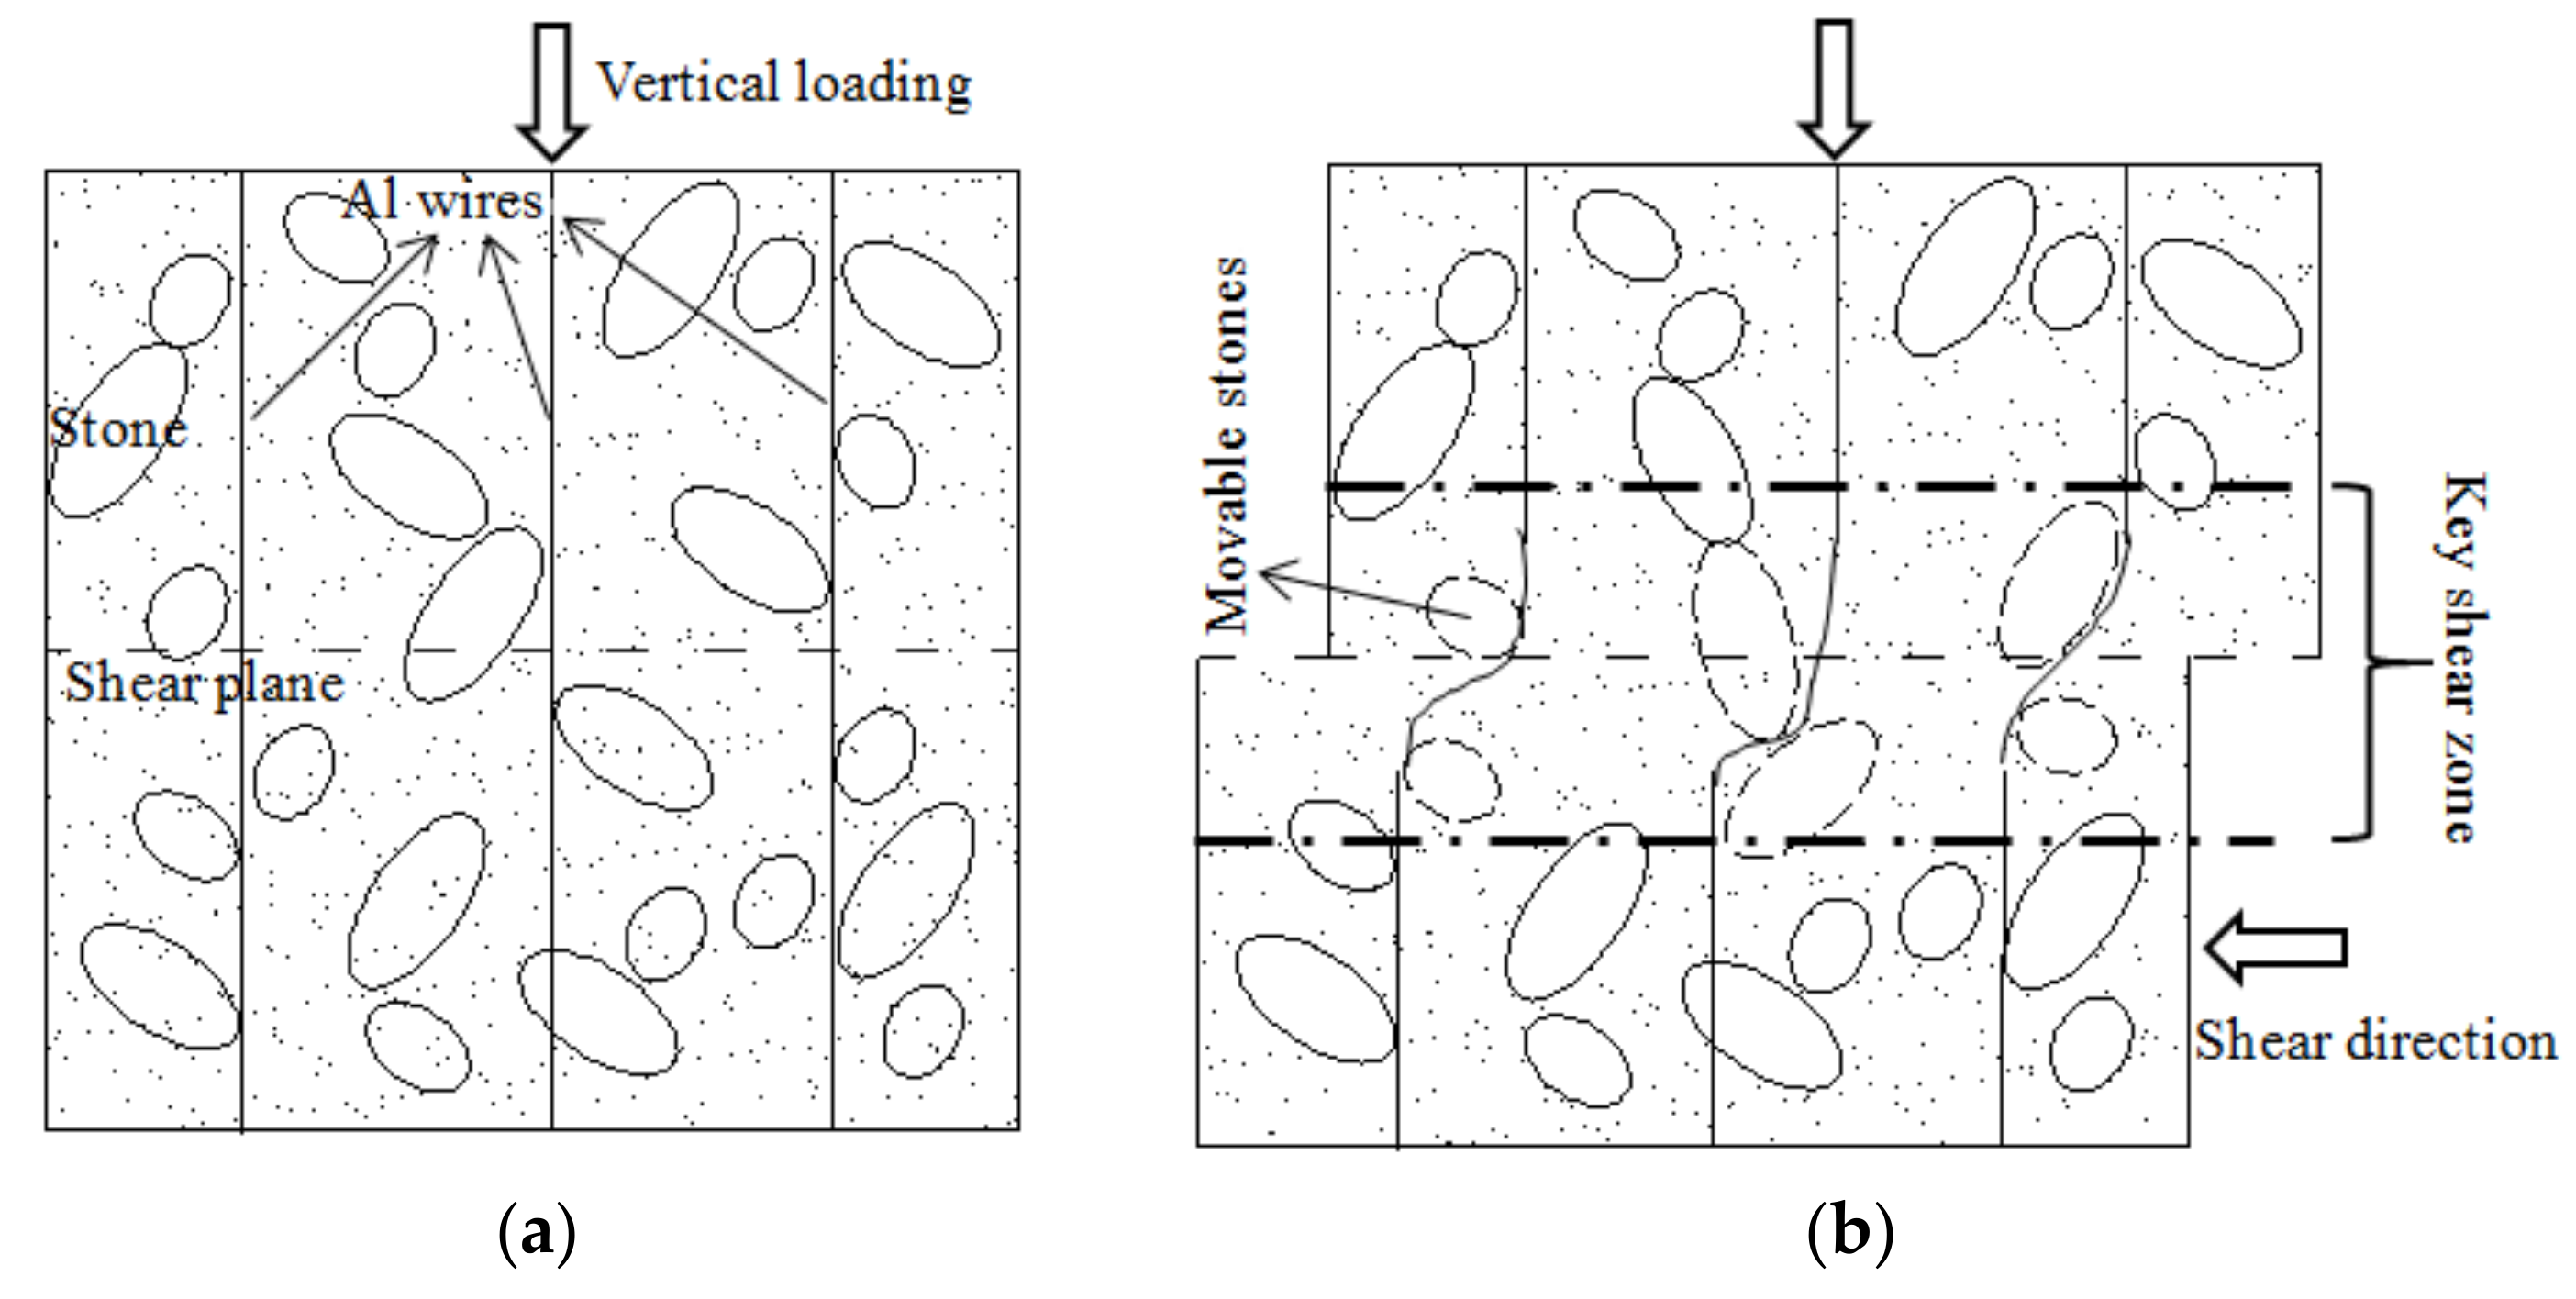
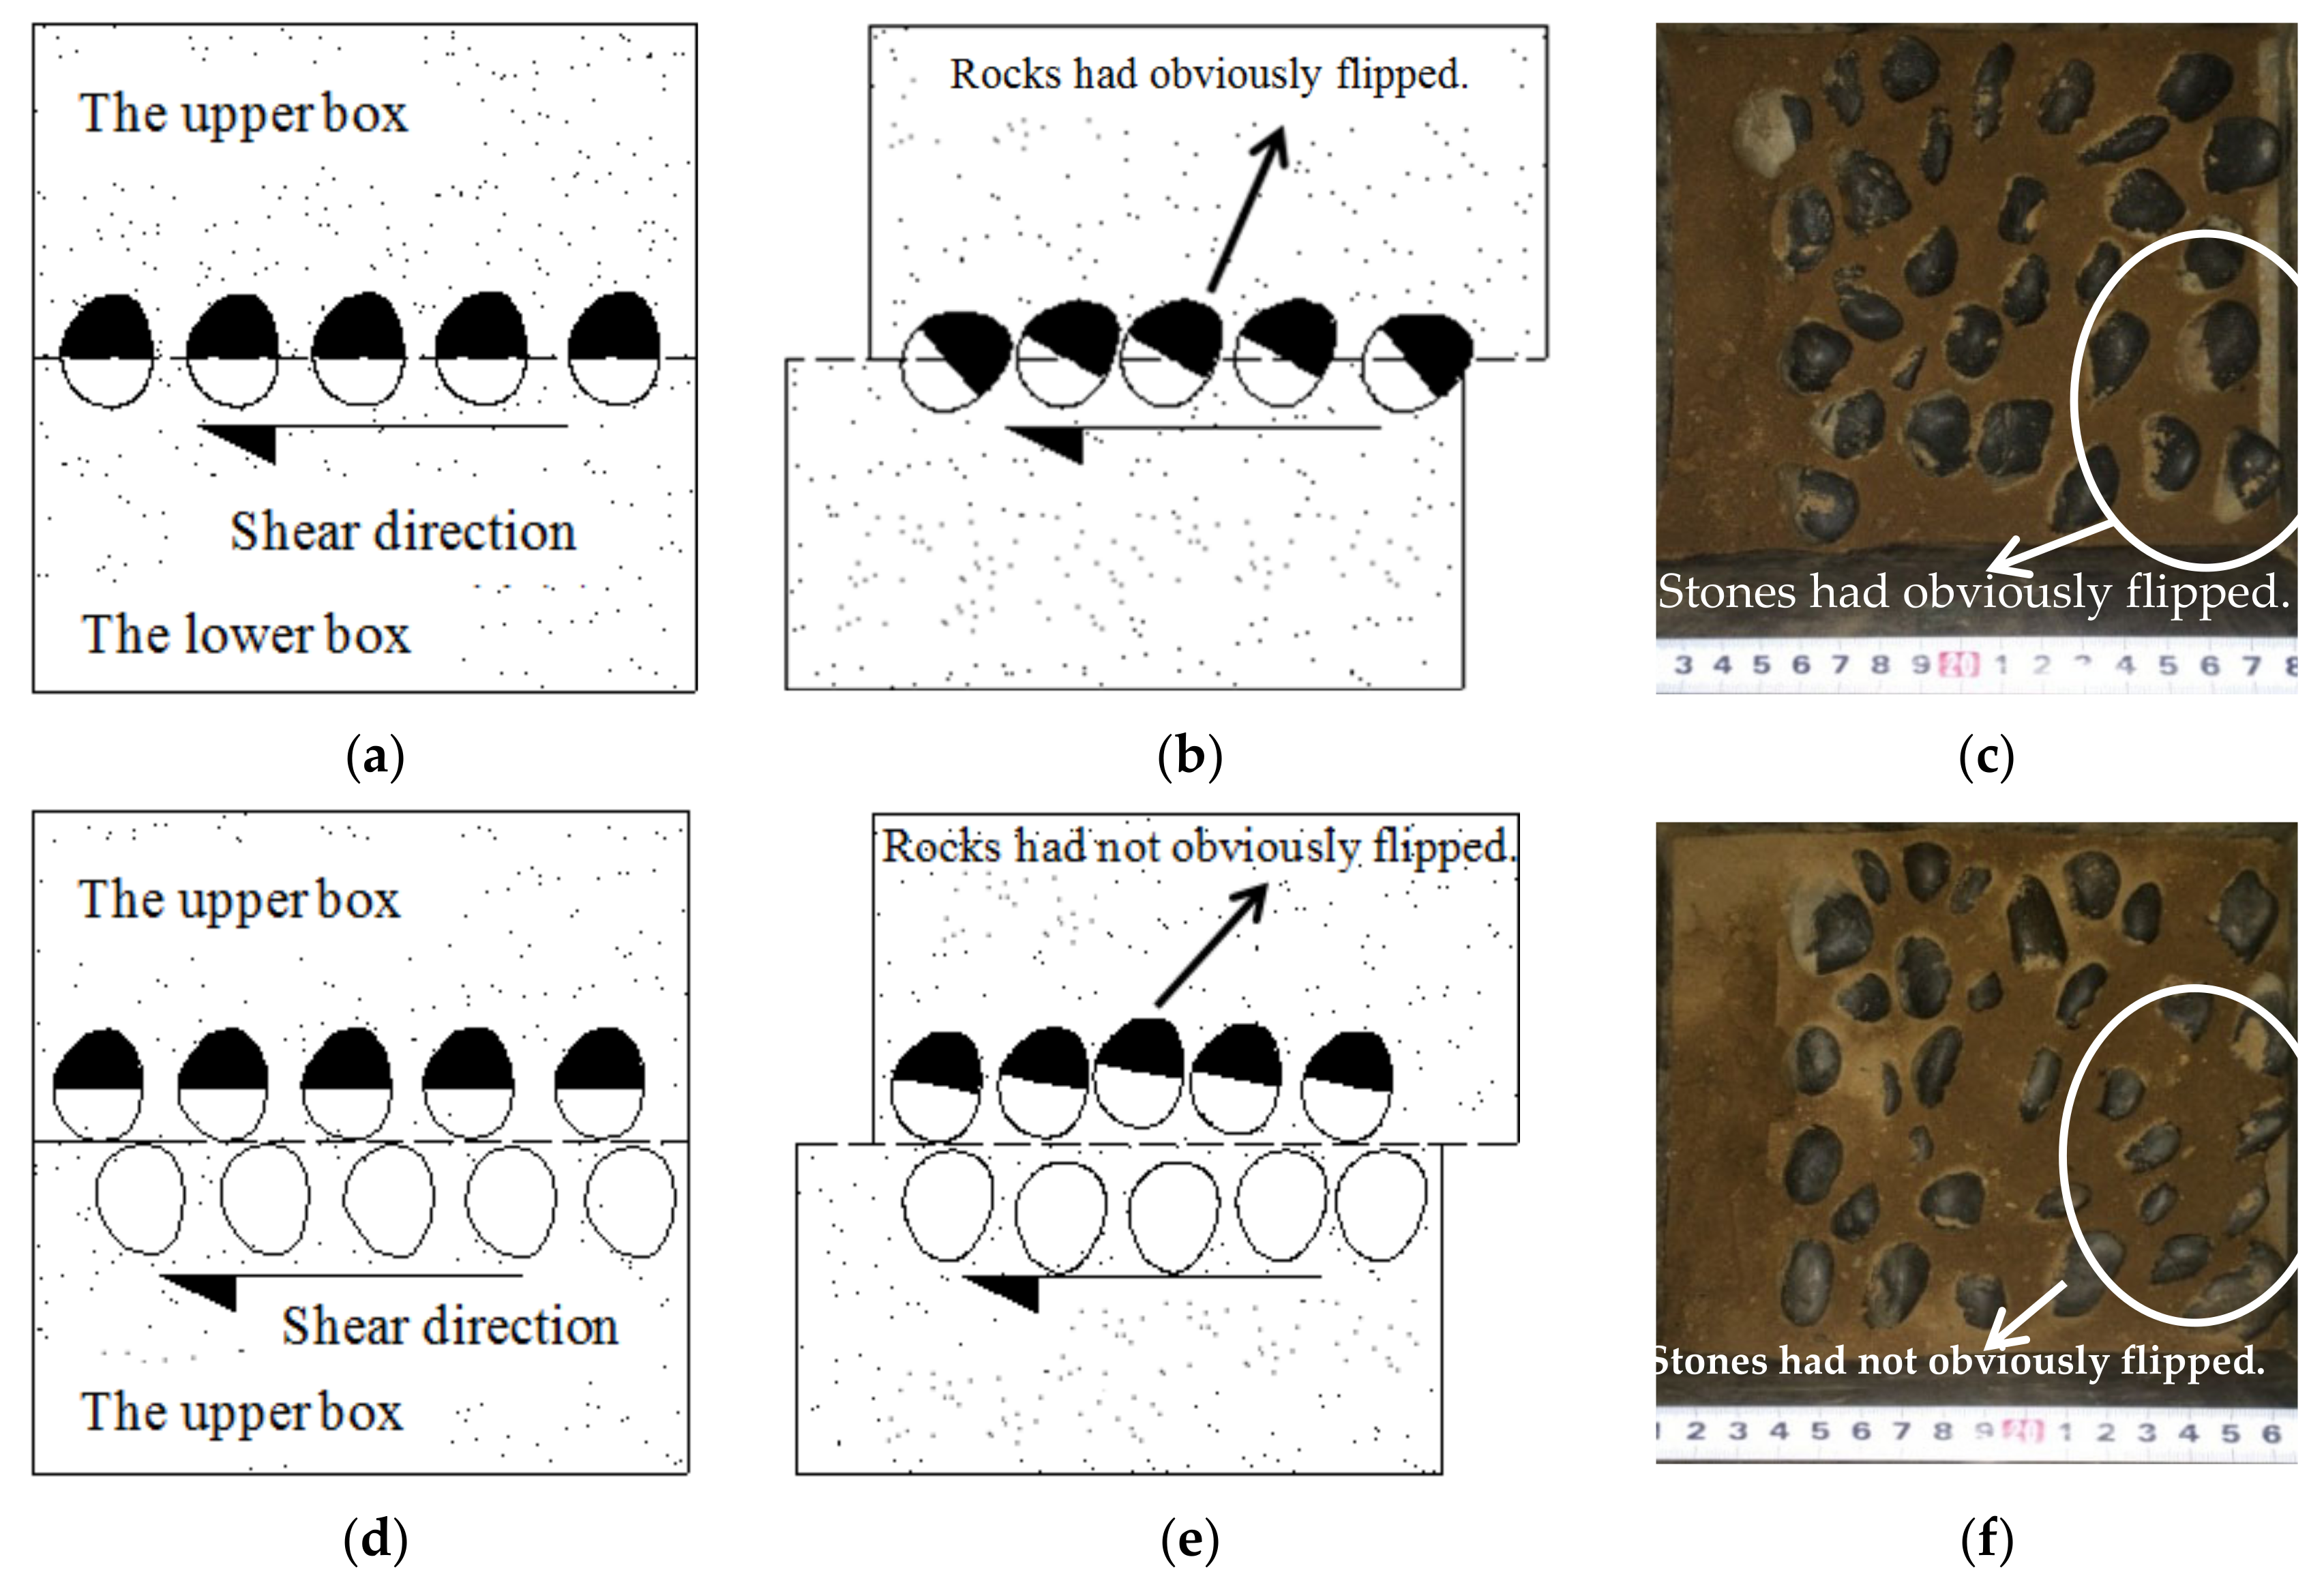
4.1. Analysis of the Deformation Characteristics of Al Wires
4.2. Analysis of Shear Deformation Characteristics
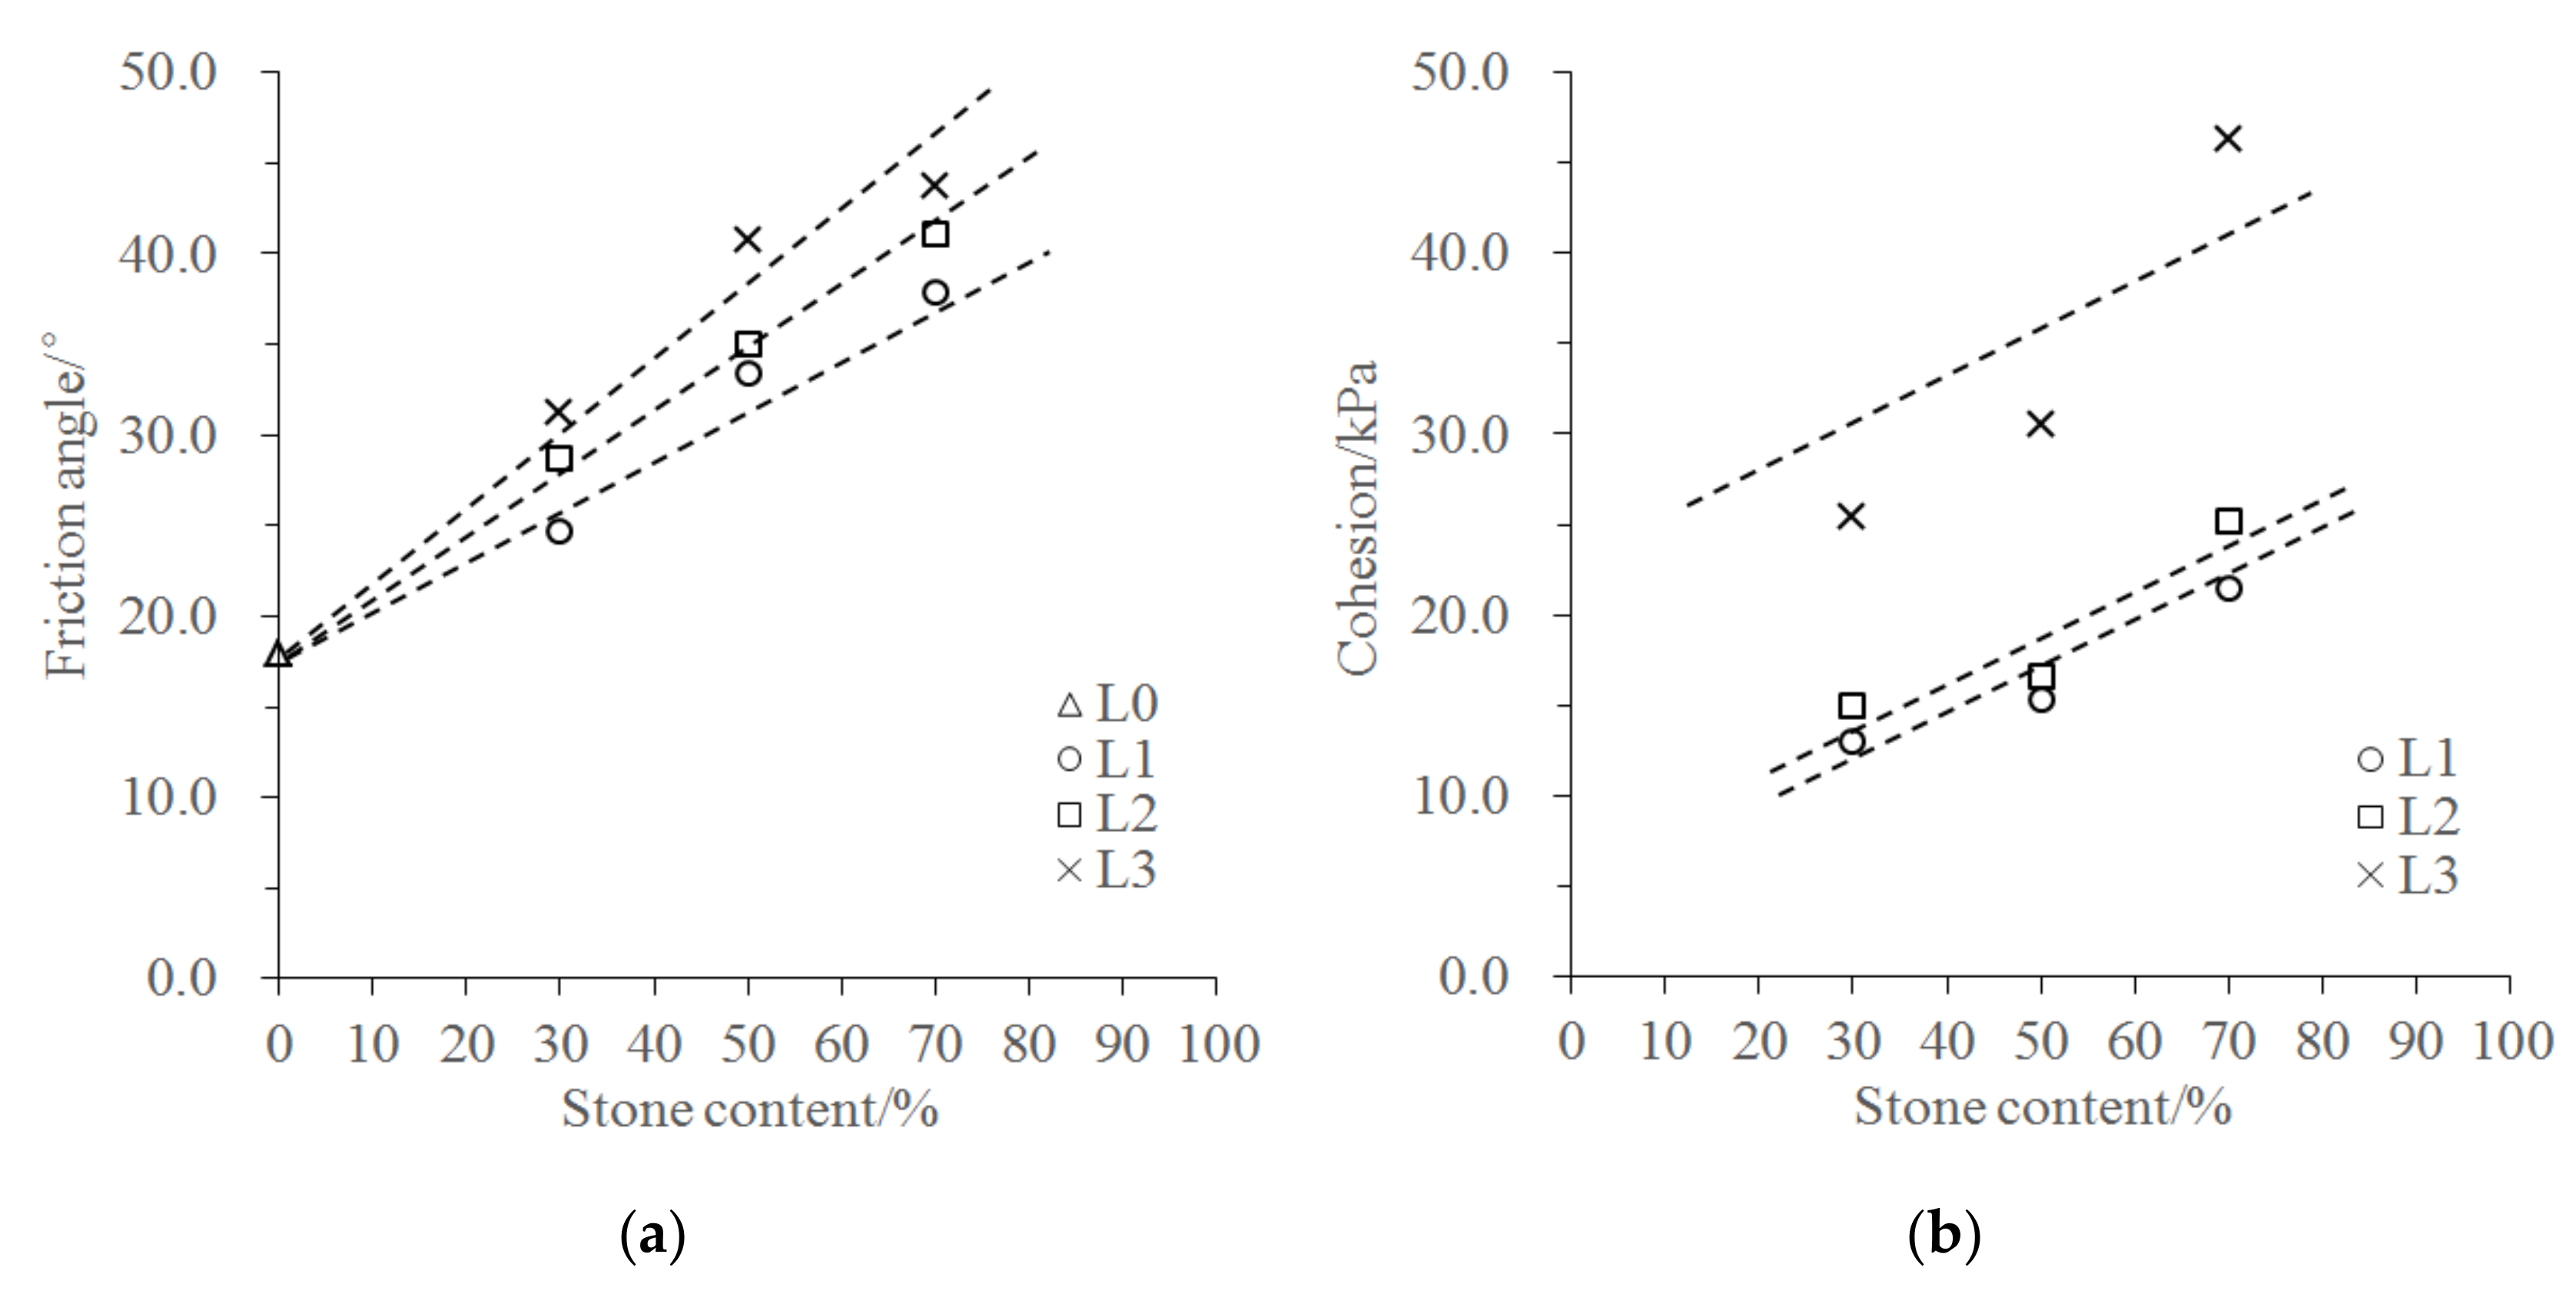
4.3. Parameters of the Shear Strength
5. Discussion
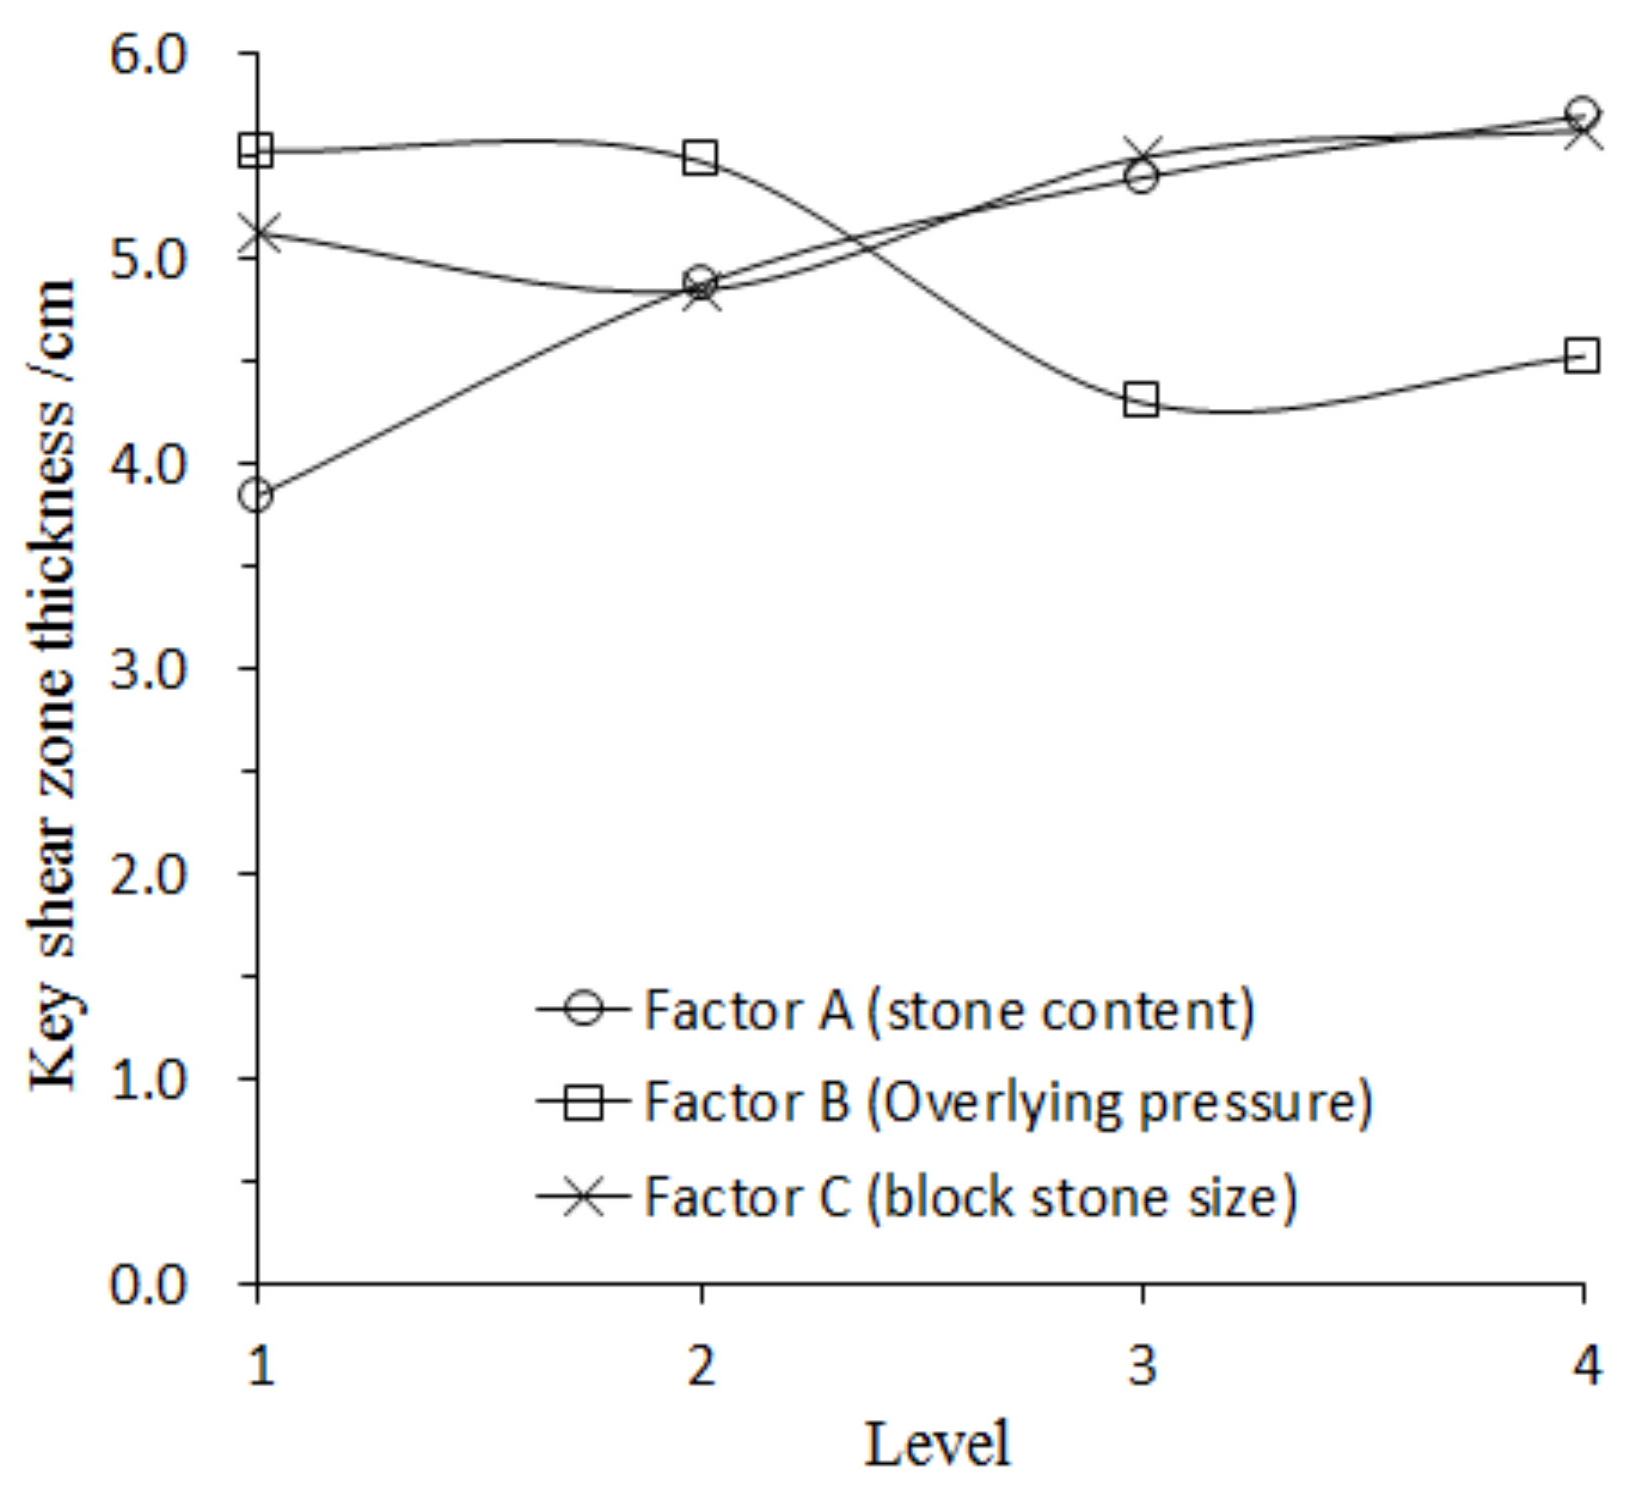
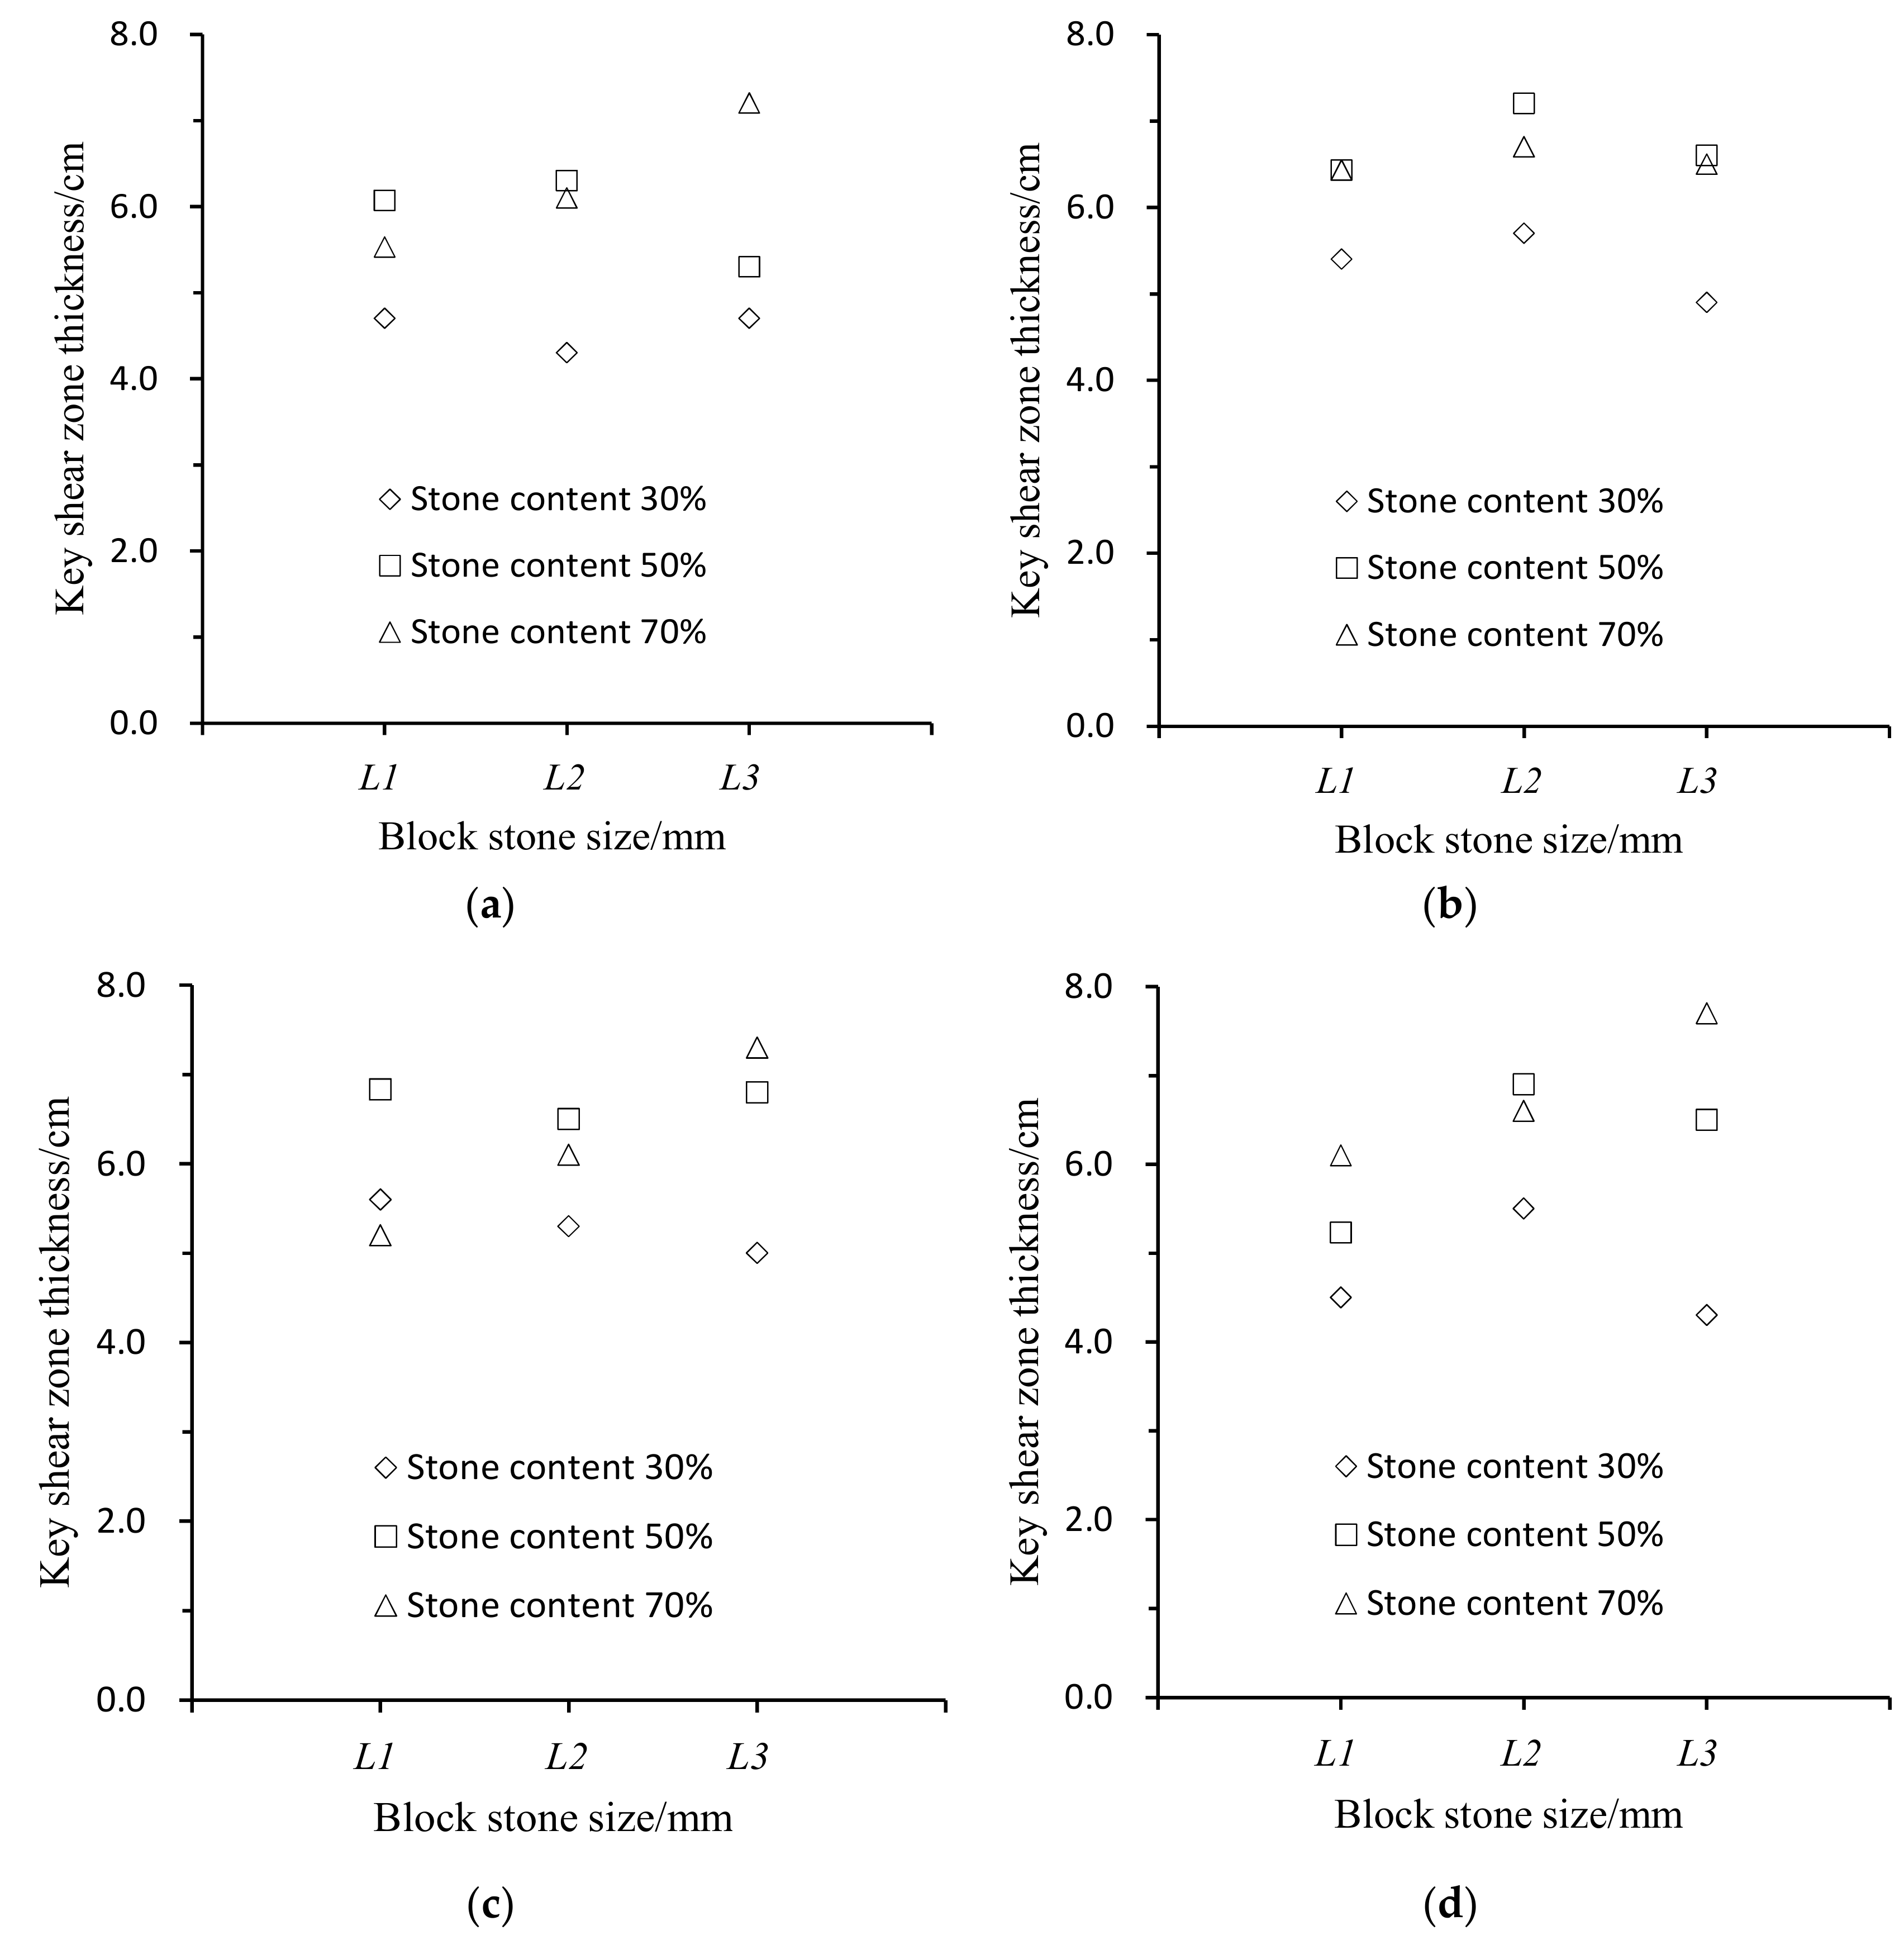
5.1. Range Analysis of the Key Shear Zone Thickness
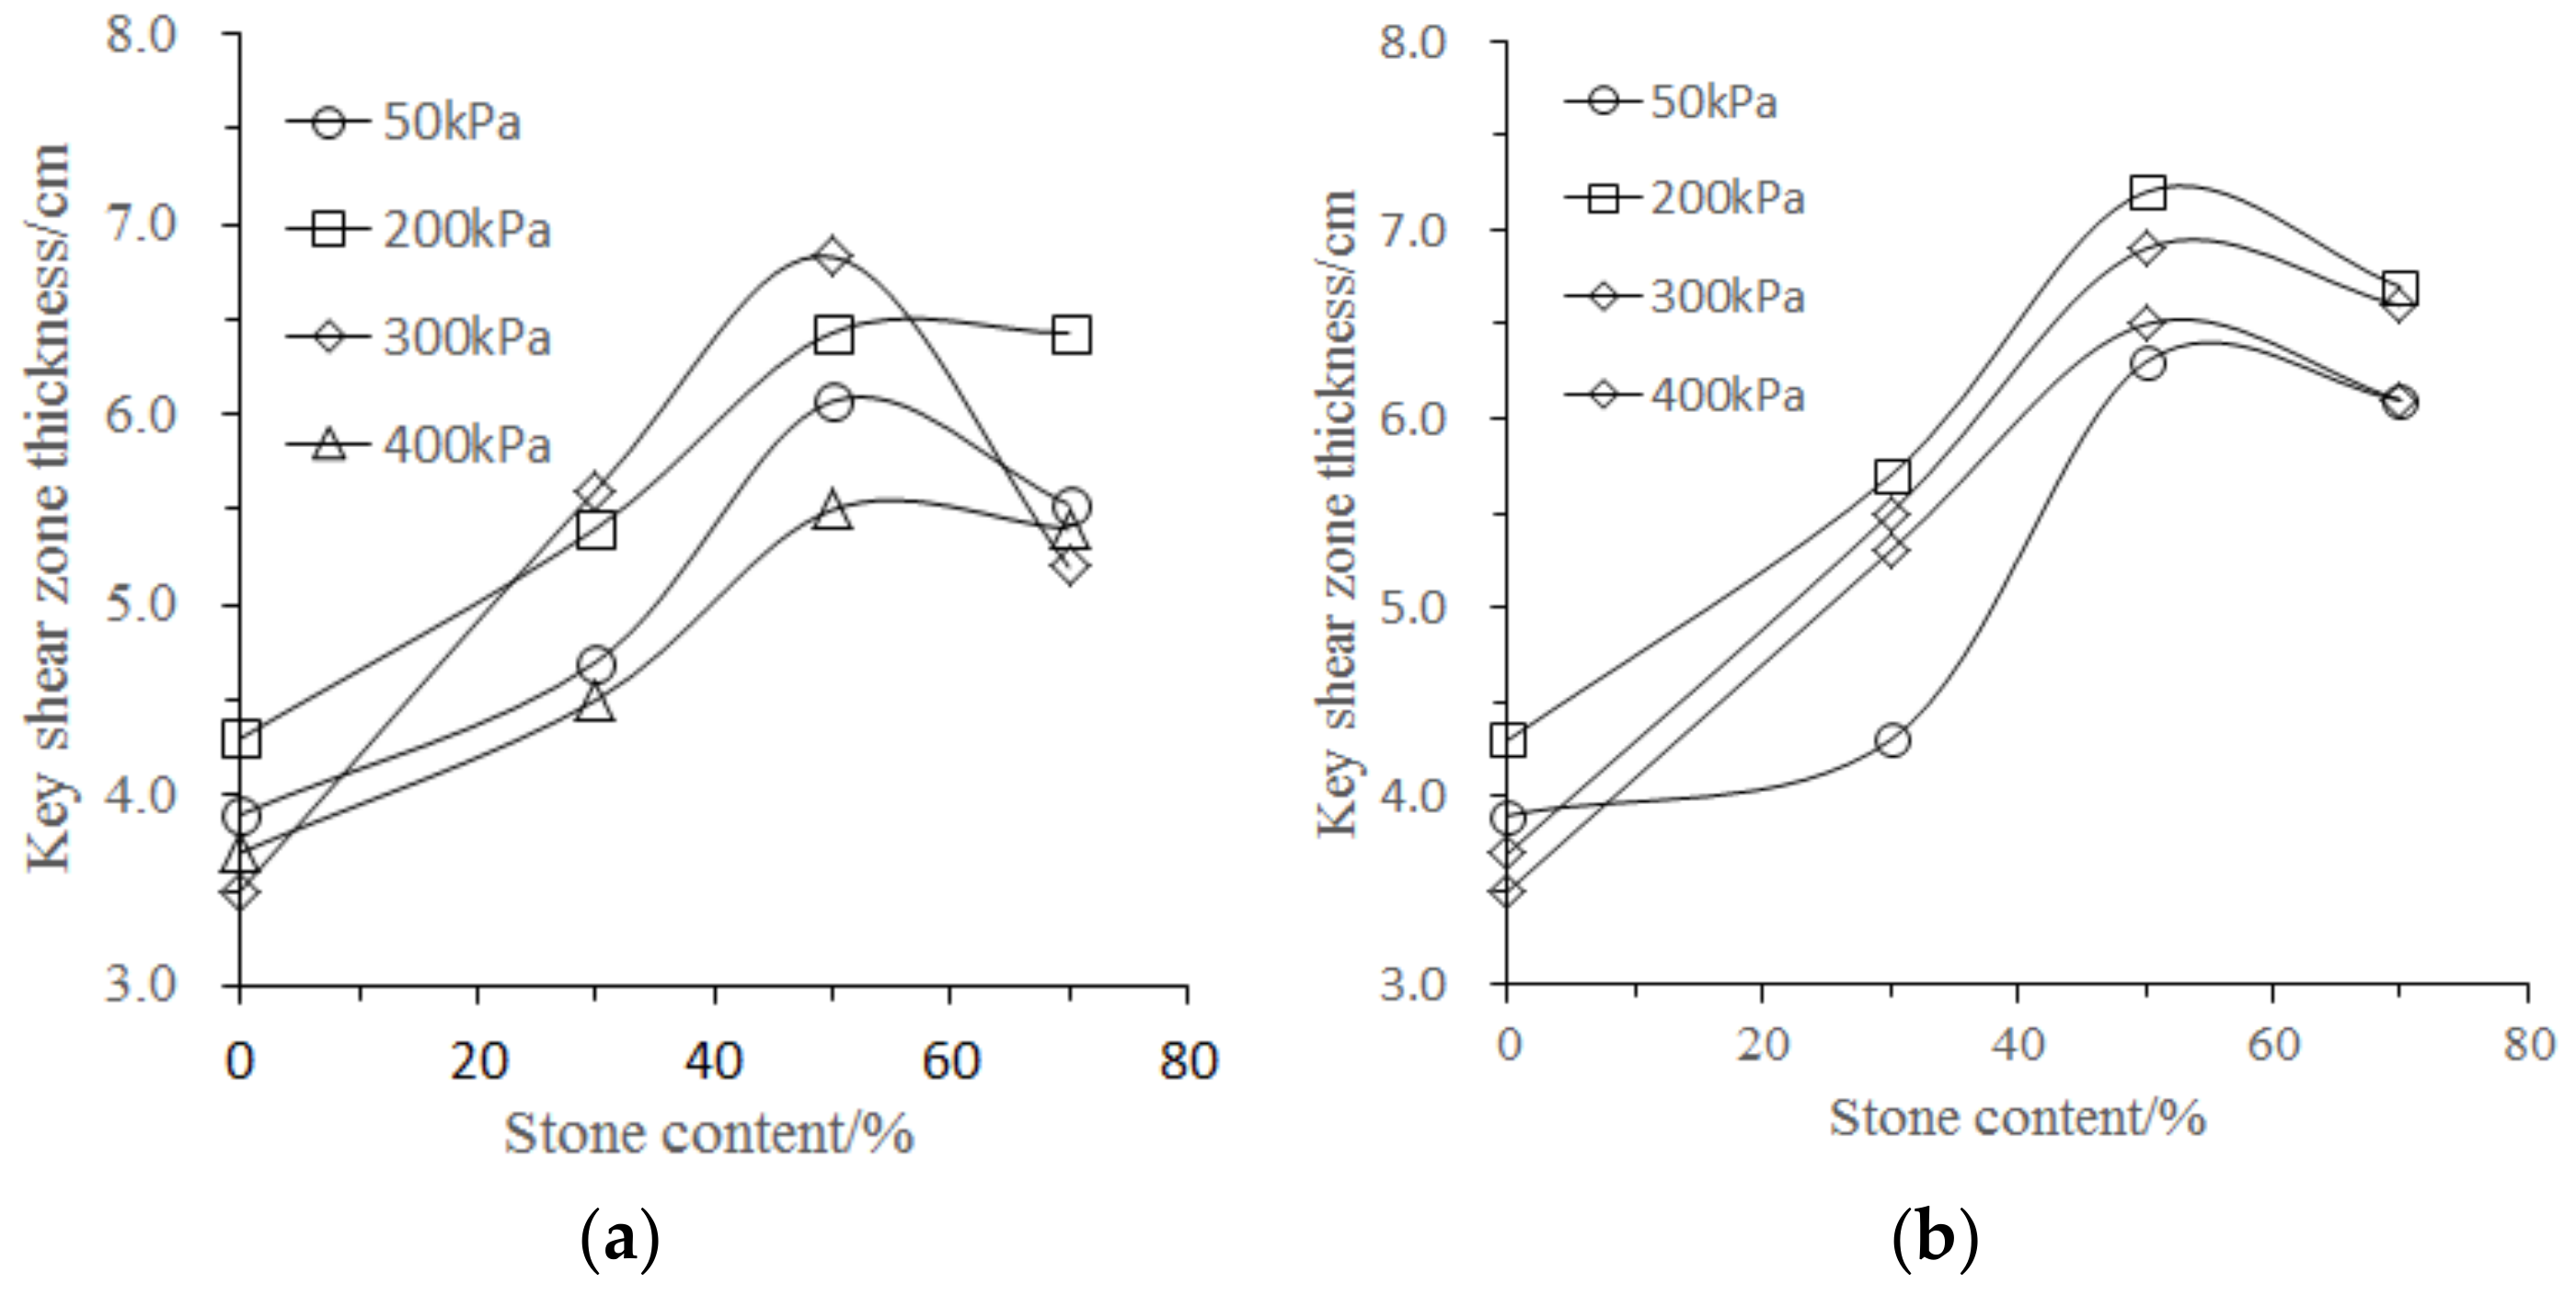
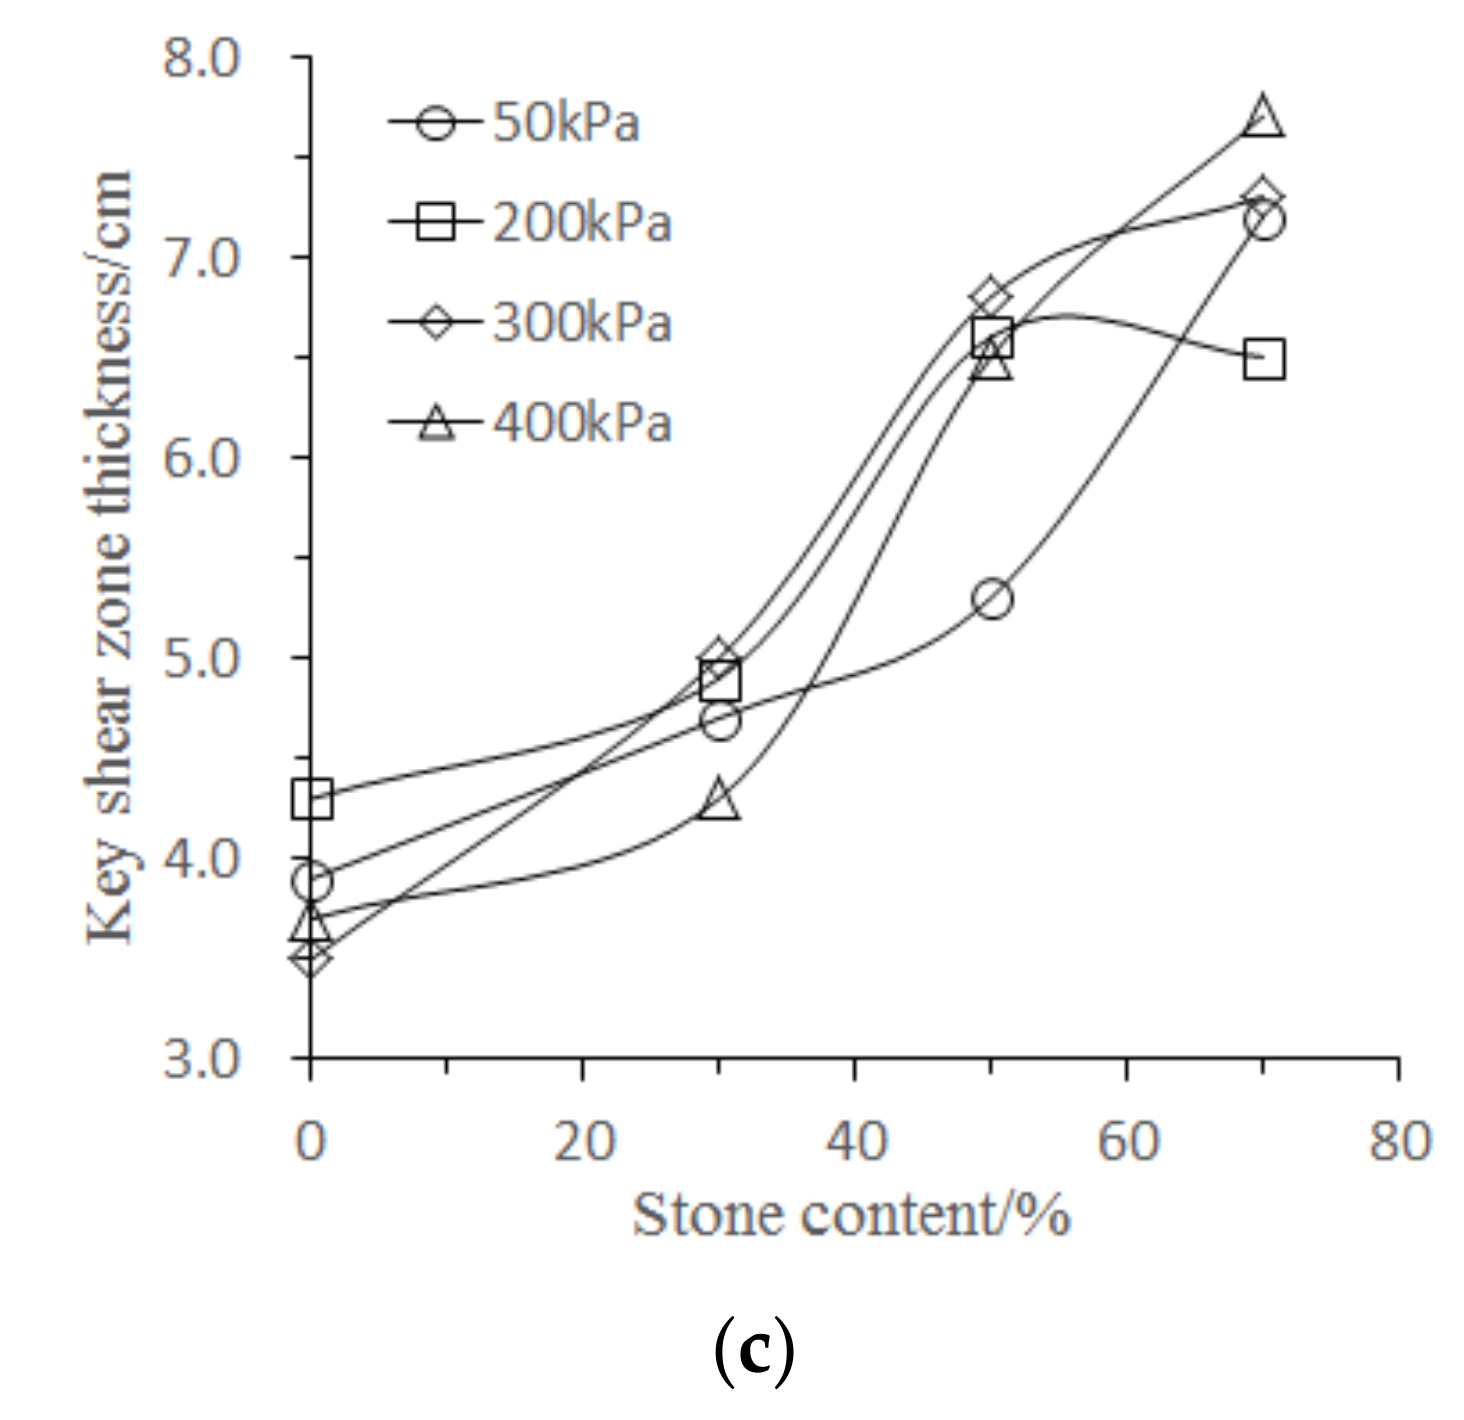
5.2. Influence of Stone Content on the Key Shear Zone Thickness
5.3. Influence of Block Size on the Key Shear Zone Thickness
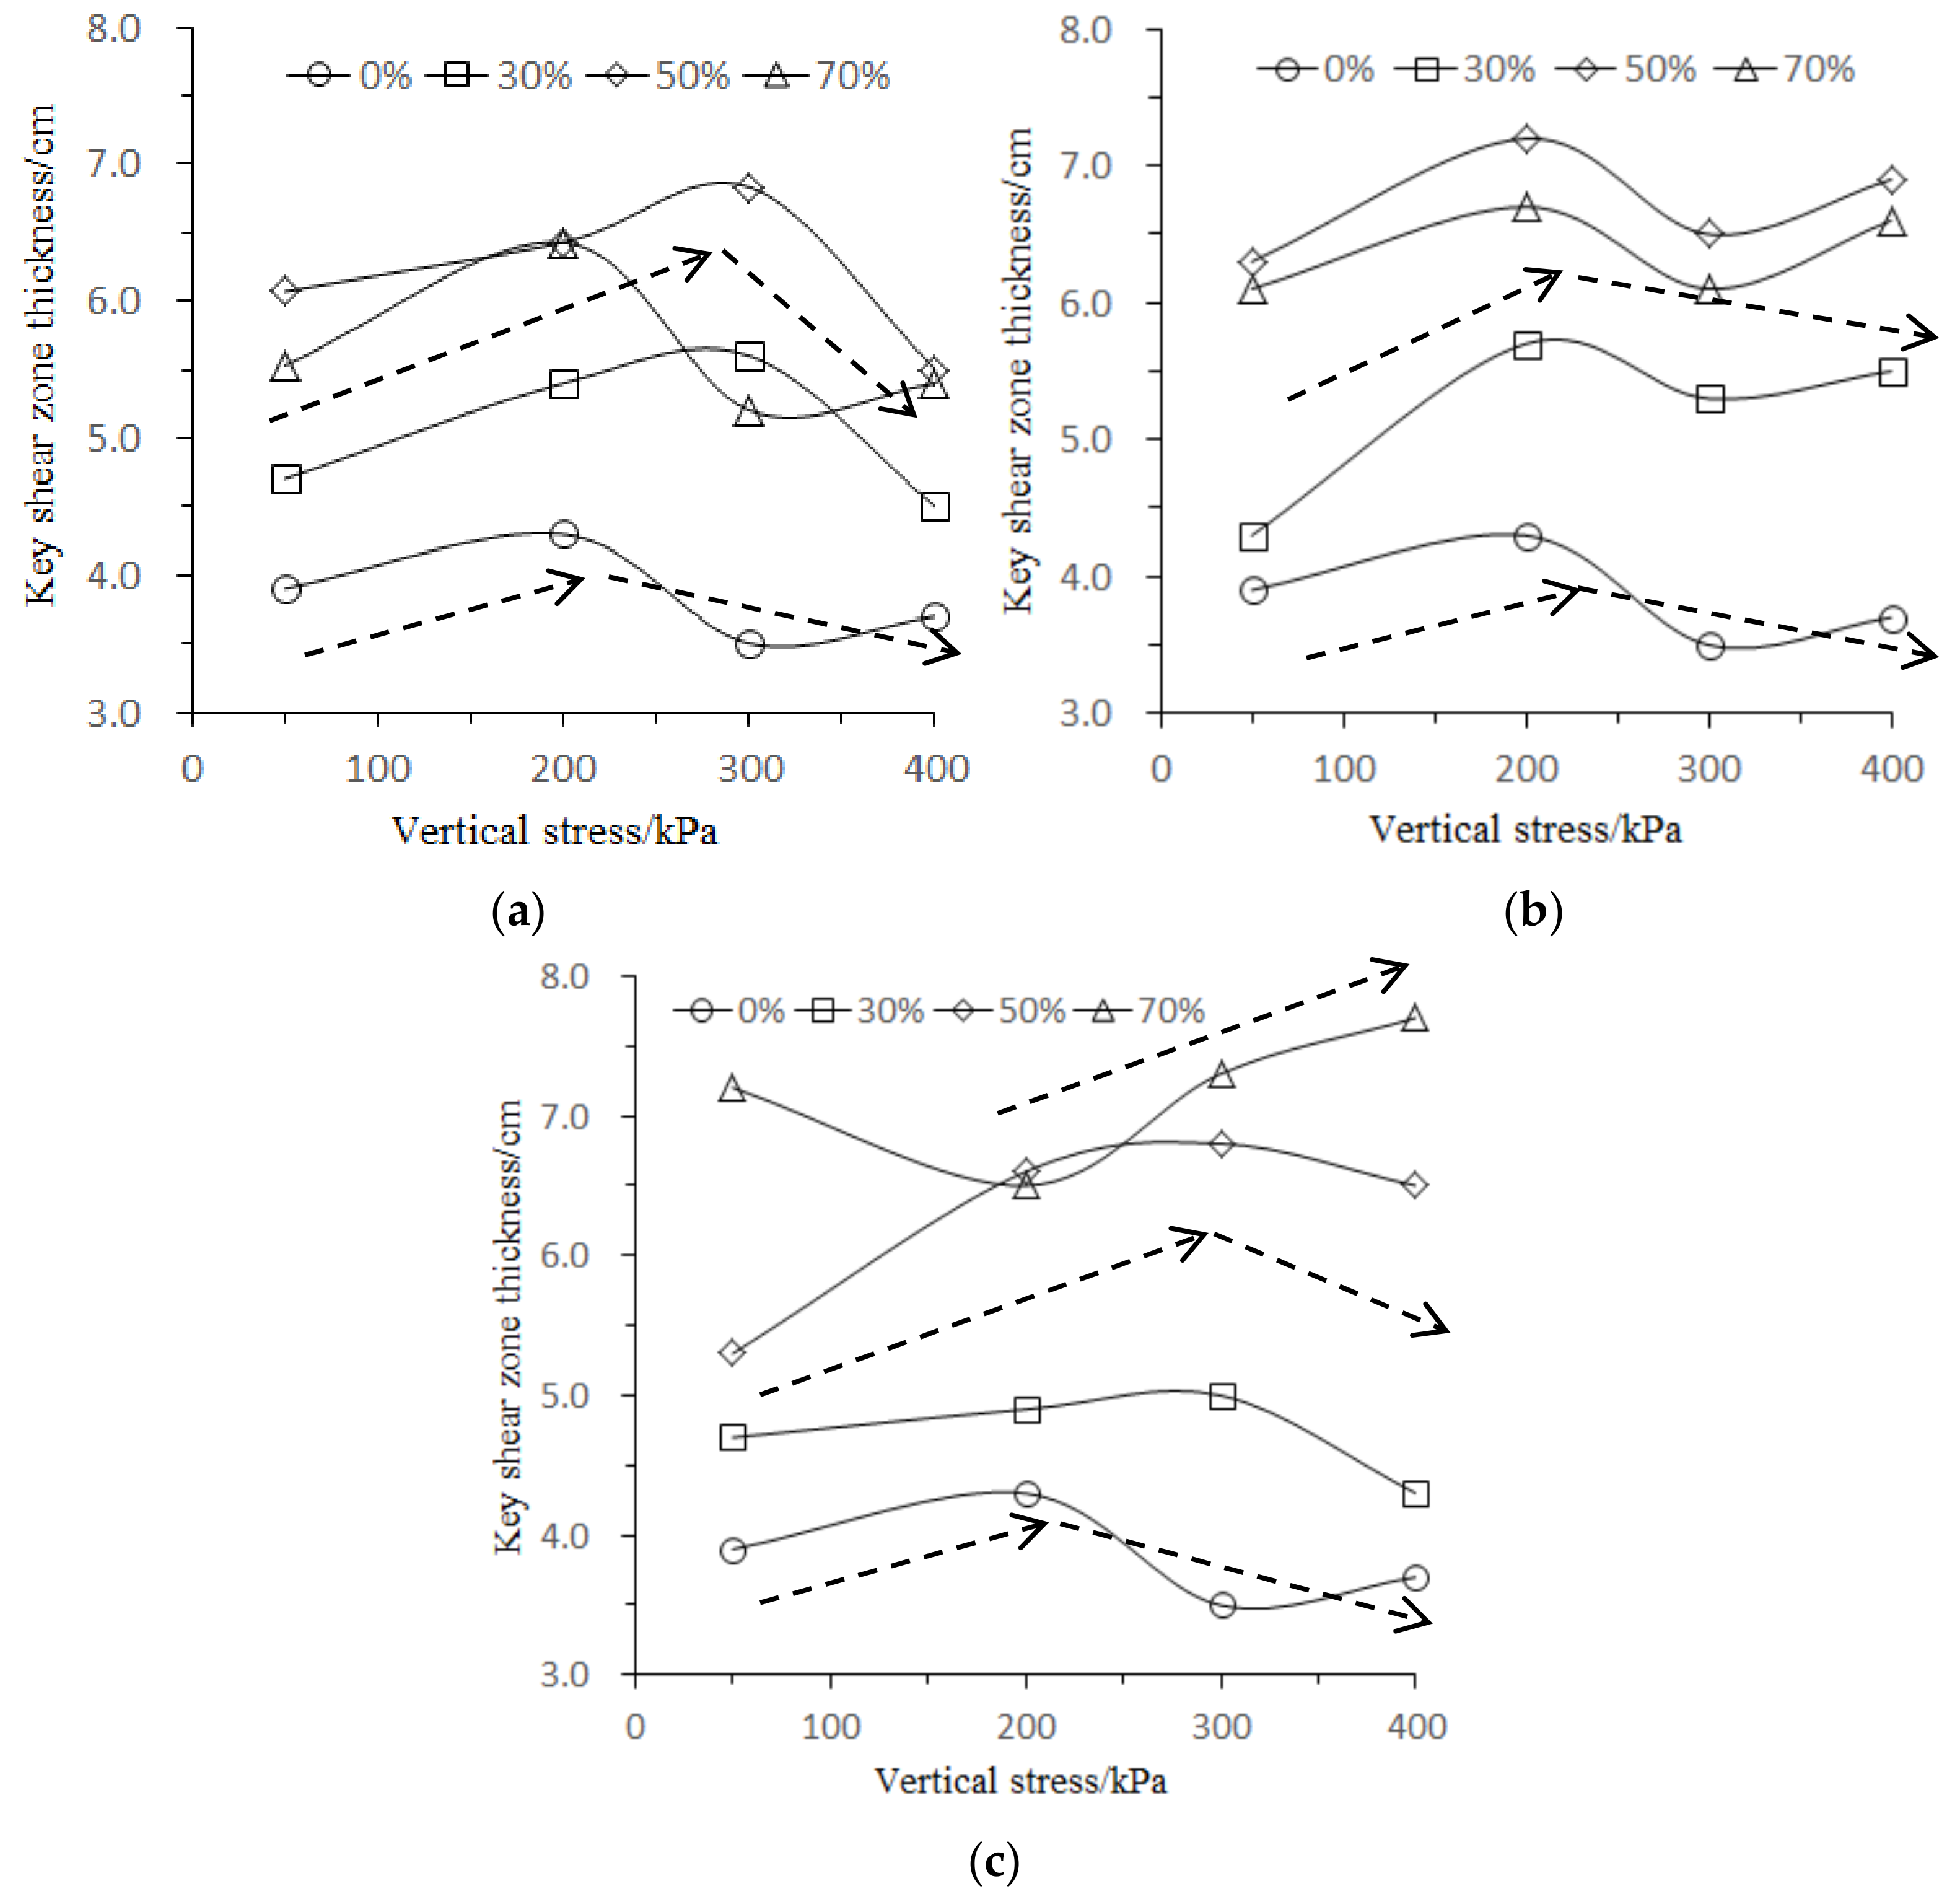
5.4. Influence of Vertical Pressure on the Key Shear Zone Thickness
6. Conclusions
- The combination of Al wires and dry ash could be used to measure the deformation of the shear zone directly in large-sized direct shear tests of SRM;
- The stone contents 30% and 70% were two critical thresholds to determine the deformation characteristics of SRM;
- The stone content had the greatest effect on the thickness of the key shear zone; the vertical pressure was second, and then the block stone size;
- Under the conditions of high stone content (70%) and large particle size (group L3), the block stones distributed near the shear plane were dominated by dilatancy and generated extrusion, angular shear, and dislocation redistribution with changes in the shear deformation;
- The failure mode of SRM could be generalized as a process of gradual expansion and destruction caused by compaction at the top, creep at the toe, and then shearing rupture in the middle of the slope;
- The possibility to excavate the samples along a vertical face was clear evidence of the strengthening effects of the negative pore water pressures of samples.
Author Contributions
Funding
Conflicts of Interest
References
- You, X.H.; Tang, J.S. Research on horizonal push-shear in-situ test of soil and rock-mixture. Chin. J. Rock Mech. Eng. 2002, 21, 1537–1540. [Google Scholar]
- Xia, J.W.; Guo, H.Z. Study on landslide distribution characteristics and main control factors in the upper Yangtze river. Hydrogeol. Eng. Geol. 1997, 1, 19–32. [Google Scholar]
- Wen, B.P.; Aydin, A.; Aydin, N.S.D.; Li, Y.R.; Chen, H.Y.; Xiao, S.D. Residual strength of slip zones of large landslides in the Three Gorges area, China. Eng. Geol. 2007, 93, 82–98. [Google Scholar] [CrossRef]
- Medley, E.; Goodman, R.E. Estimating the block volumetric proportion of melanges and similar block-in-matrix rocks (bimrocks). In Proceeding of the 1st North American Rock Mechanics Conference (NARMS), Austin, TX, USA, 20 February 1994; Balkema: Rotterdam, The Netherlands, 1994; pp. 851–858. [Google Scholar]
- Indrawan, I.G.B.; Rahardjo, H.; Leong, E.C. Effects of coarse-grained materials on properties of residual soil. Eng. Geol. 2006, 82, 154–164. [Google Scholar] [CrossRef]
- Rahardjo, H.; Indrawan, I.G.B.; Leong, E.C.; Yong, W.K. Effects of coarse-grained material on hydraulic properties and shear strength of top soil. Eng. Geol. 2008, 101, 165–173. [Google Scholar] [CrossRef]
- Uday, K.V.; Padmakumar, G.P.; Singh, D.N. Some studies on morphology of the coarse-grained soils. Eng. Geol. 2013, 152, 48–55. [Google Scholar] [CrossRef]
- Zhang, L.H.; Ma, W.; Yang, C.S.; Yuan, C. Investigation of the pore water pressures of coarse-grained sandy soil during open-system step-freezing and thawing tests. Eng. Geol. 2014, 181, 233–248. [Google Scholar] [CrossRef]
- Sundell, J.; Rosén, L.; Norberg, T.; Haaf, E. A probabilistic approach to soil layer and bedrock-level modeling for risk assessment of groundwater drawdown induced land subsidence. Eng. Geol. 2016, 203, 126–139. [Google Scholar] [CrossRef]
- Macaulay, D.B.; Bouazza, A.; Singh, R.M.; Wang, B.; Ranjith, P.G. Thermal conductivity of soils and rocks from the Melbourne (Australia) region. Eng. Geol. 2017, 164, 131–138. [Google Scholar] [CrossRef]
- Rocchia, I.; Coopb, M.R.; Maccarini, M. The effects of weathering on the physical and mechanical properties of igneous and metamorphic saprolites. Eng. Geol. 2017, 231, 56–67. [Google Scholar] [CrossRef]
- Vallejo, L.E.; Mawby, R. Porosity influence on the shear strength of granular material-clay mixtures. Eng. Geol. 2000, 58, 125–136. [Google Scholar] [CrossRef]
- Wu, P.K.; Matsushima, K.; Tatsuoka, F. Effects of specimen size and someother factors on the strength and deformation of granular soil in direct sheartests. ASTM Geotech. Test. J. 2008, 31, 45–64. [Google Scholar]
- Xiao, J.H.; Luo, Z.; Martin, J.R., II; Gong, W.P.; Wang, L. Probabilistic geotechnical analysis of energy piles in granular soils. Eng. Geol. 2016, 209, 119–127. [Google Scholar] [CrossRef]
- Hu, W.; Scaringi, G.; Xu, Q.; Pei, Z.; Van-Asch, W.J.; Hicher, P.Y. Sensitivity of the initiation and runout of flowslides in loose granular deposits to the content of small particles: An insight from flume tests. Eng. Geol. 2017, 231, 34–44. [Google Scholar] [CrossRef]
- Pegah, E.; Liu, H.B.; Dastanboo, N. Evaluation of the lateral earth pressure coefficients at-rest in granular soil deposits using the anisotropic components of S-wave velocity. Eng. Geol. 2017, 230, 55–63. [Google Scholar] [CrossRef]
- Sun, Y.F.; Xiao, Y. Fractional order plasticity model for granular soils subjected to monotonic triaxial compression. Int. J. Solids Struct. 2017, 118–119, 224–234. [Google Scholar] [CrossRef]
- Chang, W.J.; Phantachang, T. Effects of gravel content on shear resistance of gravelly soils. Eng. Geol. 2016, 207, 78–90. [Google Scholar] [CrossRef]
- Dong, H.; Huang, R.Q.; Gao, Q.F. Rainfall infiltration performance and its relation to mesoscopic structural properties of a gravelly soil slope. Eng. Geol. 2017, 230, 1–10. [Google Scholar] [CrossRef]
- Kokusho, T.; Hara, T.; Hiraoka, R. Undrained shear strength of granular soils with different particle gradations. J. Geotech. Geoenviron. Eng. 2004, 130, 621–629. [Google Scholar] [CrossRef]
- Chen, H.; Wan, J.P. The effect of orientation and shape distribution of gravel on slope angles in central Taiwan. Eng. Geol. 2004, 72, 19–31. [Google Scholar] [CrossRef]
- Zhou, Z.; Fu, H.L.; Liu, B.C. Experimental study of the permeability of soil-rock-mixture. J. Hunan Univ. Nat. Sci. 2006, 33, 25–28. [Google Scholar]
- Wang, X. Research on Influence Factors of Mechanics Characteristics and Failure Mechanism of Soil-Rock Mixture. Master’s Thesis, Yangtze River Scientific Research Institute, Wuhan, China, 2010. [Google Scholar]
- Holtz, W.G.; Lowitz, C.W. Compaction Characteristics of Gravelly Soils. Spec. Tech. Publ. ASTM 1957, 232, 70–83. [Google Scholar]
- Patwardhan, A.S.; Rao, J.S.; Gaidhane, R.B. Interlocking effects and shearing resistance of boulders and large size particles in a matrix of fines on the basis of large scale direct shear tests. In Proceedings of the 2nd Southeast Asian Conference on Soil Mechanics, Singapore, 15 May 1970; pp. 265–273. [Google Scholar]
- Vallejo, L.E.; Zhou, Y. The mechanical properties of simulated soil–rock mixtures. In Proceedings of the 13th International Conference on Soil Mechanics and Foundations Engineering, New Delhi, India, 5–10 January 1994; pp. 365–368. [Google Scholar]
- Casagli, N.; Ermini, L.; Rosati, G. Determining grain size distribution of the material composing landslide dams in the Northern Apennines: Sampling and processing methods. Eng. Geol. 2003, 69, 83–97. [Google Scholar] [CrossRef]
- Enomoto, T.; Qureshi, O.H.; Sato, T.; Koseki, J. Strength and deformation characteristics and small strain properties of undisturbed gravelly soils. Soils Found. 2013, 53, 951–965. [Google Scholar] [CrossRef]
- Li, C.S.; Zhang, D.; Wang, H.X. 3D mesh generation for soil-rock mixture based CT scanning. Rock Soil Mech. 2014, 35, 2731–2736. [Google Scholar]
- Zhang, S.; Tang, H.M.; Zhan, H.B.; Lei, G.P.; Cheng, H. Investigation of scale effect of numerical unconfined compression strengths of virtual colluvial-deluvial soil-rock mixture. Int. J. Rock Mech. Min. Sci. 2015, 77, 208–219. [Google Scholar] [CrossRef]
- Wang, Y.; Li, X.; Zheng, B. Stress-strain behavior of soil-rock mixture at medium strain rates-Response to seismic dynamic loading. Soil Dyn. Earthq. Eng. 2017, 93, 7–17. [Google Scholar] [CrossRef]
- Li, X.R. Experimental Study on Deformation Characteristics of Earth-Rock Aggregate. Master’s Thesis, Dalian University of Technology, Dalian, China, 2012. [Google Scholar]
- Zhang, Z.L.; Xu, W.J.; Xia, W.; Zhang, H.Y. Large-scale in-situ test for mechanical characterization of soil- rock mixture used in an embankment dam. Int. J. Rock Mech. Min. Sci. 2016, 86, 317–322. [Google Scholar] [CrossRef]
- Simoni, A.; Houlsby, G.T. The direct shear strength and dilatancy of sand-gravel mixtures. Geotech. Geol. Eng. 2006, 24, 523–549. [Google Scholar] [CrossRef]
- Khalkhali, A.B.; Mirghasemi, A.A. Numerical and experimental direct shear tests for coarse-grained soils. Particuology 2009, 7, 83–91. [Google Scholar] [CrossRef]
- Zhou, Q.; Shen, H.H.; Helenbrook, B.T.; Zhang, H.W. Scale dependence of direct shear tests. Chin. Sci. Bull. 2009, 54, 4337–4348. [Google Scholar] [CrossRef]
- Fu, W.X.; Zheng, X.; Lei, X.Z.; Deng, J.H. Using a modified direct shear apparatus to explore gap and size effects on shear resistance of coarse-grained soil. Particuology 2015, 23, 82–89. [Google Scholar] [CrossRef]
- Coli, N.; Berry, P.; Boldini, D. In situ non-conventional shear tests for the mechanical characteristics of a bimrock (BimTest). Int. J. Rock Mech. Min. Sci. 2011, 48, 95–102. [Google Scholar] [CrossRef]
- Xu, W.J.; Xu, Q.; Hu, R.L. Study on the shear strength of Soil–rock mixture by large scale direct shear test. Int. J. Rock Mech. Min. Sci. 2011, 48, 1235–1247. [Google Scholar]
- Miller, E.A.; Sowers, G.F. The strength characteristics of soil-aggregate mixture. Highw. Res. Board Bull. 1957, 183, 16–23. [Google Scholar]
- Cook, B.D. The effect of stone content, size, and shape on the engineering properties of a compacted silty clay. Bull. Assoc. Eng. Geol. 1990, 27, 245–253. [Google Scholar]
- Tian, H.N.; Jiao, Y.Y.; Wang, H. Research on biaxial test of mechanical characteristics on soil-rock aggregate (SRA) based on particle flow code simulation. Chin. J. Rock Mech. Eng. 2015, 34, 3564–3573. [Google Scholar]
- Wang, J.; Dove, J.E.; Gutierrez, M.S. Discrete-continuum analysis of shear banding in the direct shear test. Géotechnique 2007, 57, 513–526. [Google Scholar] [CrossRef]
- Ding, X.L.; Li, Y.; Wang, X. Particle flow modeling mechanical properties of soil and rock mixtures based on digital image. Chin. J. Rock Mech. Eng. 2010, 29, 487–494. [Google Scholar]
- Jia, X.M.; Chai, H.J.; Zheng, Y.R. Mesomechanics research of large direct shear test on soil and rock aggregate mixture with particle flow code simulation. Rock Soil Mech. 2010, 31, 2695–2703. [Google Scholar]
- Potts, D.M.; Dounias, G.T.; Vaughan, P.R. Finite element analysis of the direct shear box test. Geotechnique 1987, 37, 11–23. [Google Scholar] [CrossRef]
- Xu, W.J.; Yue, Z.Q.; Hu, R.L. Study on the mesostructure and mesomechanical characteristics of the soil–rock mixture using digital image processing based finite element method. Int. J. Rock Mech. Min. Sci. 2008, 45, 749–762. [Google Scholar] [CrossRef]
- Xu, W.J.; Wang, S.; Zhang, H.Y.; Zhang, Z.L. Discrete element modeling of a soil-rock mixture used in an embankment dam. Int. J. Rock Mech. Min. Sci. 2016, 86, 141–156. [Google Scholar] [CrossRef]
- Xu, Q.; Huang, R.Q.; Cheng, Q.G. Study on soil properties in sliding zone of XIETAN landslide on the three- gorges reservoir. J. Eng. Geol. 2003, 11, 354–359. [Google Scholar]
- Yu, Q.Q. Characteristic analysis and stability evaluation of landslide in Yunnan. Gansu Water Resour. Hydropower Technol. 2016, 52, 38–46. [Google Scholar]
- Han, J.; Wang, J.; Tian, J. Features and formation mechanism of the landslide at TIANGONSI temple in Yaan. J. Geol. Hazards Environ. Preserv. 2015, 26, 3–8. [Google Scholar]
- Ye, Q.Y. Borehole inclinometer analysis of landslide in Jiuyu. Highw. Eng. 2017, 3, 112–114. [Google Scholar]
- Wang, Y.P.; Xiao, H.Q.; Liu, C. Investigation and study of slope land slide of Minjiang. J. Yibin Univ. 2017, 6, 1–6. [Google Scholar]
- Li, W.; Wang, F.F. Stability analysis of landslide occurring in Fenghuangshan mountain of Tongguan county. Geol. Shanxi 2017, 1, 79–82. [Google Scholar]
- Wu, Y.F. Study on Deformation and Failure Mechanism of Landslide of the Soil-rock Mixture in the Qin-ba Mountain. Master’s Thesis, Chang’an University, Xi’an, China, 2012. [Google Scholar]
- Teng, H.W. Analysis of cause and treatment of landslide in Pu’ge county. Gansu Water Resour. Hydropower Technol. 2017, 53, 22–25. [Google Scholar]
- Li, S.; Li, Z.H.; Pang, Z.G. Developing and deforming characteristics of Banensi land slide in Phoenix mountain of Lanzhou City. J. Lanzhou Univ. Nat. Sci. 2015, 5, 790–796. [Google Scholar]
- Teng, Y.J.; Huang, X.L.; Wang, S.G. Code for Design of Building Foundation; GB50007-2011; PRC National Standard; China Building Industry Press: Beijing, China, 2012. [Google Scholar]
- Chandler, R.J. The inclination of talus, Arctic talus terraces, and other slopes composed of granular materials. J. Geol. 1973, 81, 1–14. [Google Scholar] [CrossRef]
- Lindquist, E.S. The Strength and Deformation Properties of Mélange. Ph.D. Thesis, University of California, Berkeley, CA, USA, 1994. [Google Scholar]
- Lu, J.W.; Zhong, M.Q.; Zhang, Y.M. JGJ52-2006 Standard of Sand, Stone Quality for Ordinary Concrete and Inspection Method; National Standard of Peoples Republic of China (NSPRC); China Standards Press: Beijing, China, 2007. [Google Scholar]
- Li, Z.Q.; Wang, W.; Shi, S.Q. A Test Method for Shear Strength of Landslide and Deformation of Shear Band. China Patent ZL2015103594909, 29 July 2017. [Google Scholar]
- Marsal, R.J. Mechanical Properties of Rockfill, Embankment Dam Engineering; Wiley: New York, NY, USA, 1973; pp. 109–200. [Google Scholar]
- Sheng, S.X.; Dou, Y.; Tao, X.Z. Test Methods of Soils; SL237-1999; Ministry of Water Resources of PRC Experimental Standard, Water Power Press: Beijing, China, 1999.
- Jin, L.; Zeng, Y.W. Particle flow simulation for effects of rock block shape on mechanical behavior of soil-rock mixture. Chin. J. Comput. Mech. 2016, 33, 753–759. [Google Scholar]
- Zhu, J.L. Analysis of characteristics and stability of Pianyanzi landslide in Sandun town, Xuanhan County. Subgrade Eng. 2013, 5, 176–180. [Google Scholar]
- Ouyang, Z.H.; Li, S.H.; Dai, Z.H. Study on the influence of block to the mechanism of soil mixture. J. Exp. Mech. 2010, 25, 61–67. [Google Scholar]
- Sun, R.H. Applied Mathematical Statistics, 3rd ed.; Science Press: Beijing, China, 2017. [Google Scholar]


| Location | Landslide Name | Composition | Sliding Zone Thickness, h (m) | Sliding Body Thickness, h’ (m) | h/h’ (%) | Reference |
|---|---|---|---|---|---|---|
| Mengla County in Yunnan | H1 landslide | Crushed stone and clay | 0.4~0.7 | 3.0 | 13.3~23.3 | [49] |
| Ya’an City in Sichuan | Tiangongsi landslide | Silty clay with pebbles | 0.3~0.5 | 4.0 | 7.5~12.5 | [50] |
| Guixi City in Guangxi | Jiuxu landslide | Clay, gravel, and weathered rock | 0.3~4.0 | 13.3 | 2.3~30.1 | [51] |
| Minjiang in Sichuan | H1 landslide | Pebbly silty clay | 0.1~0.55 | 5.2 | 1.9~10.6 | [52] |
| Tongguan County in Shanxi | Fenghuang mountain H2 landslide | Loess | <0.5 | 6.5 | <7.7 | [53] |
| Ankang City in Shanxi | Ziyang landslide | Clay with gravel | 0.5~1.0 | 6.0 | 8.3~16.7 | [54] |
| Puge City in Sichuan | Dacao Village landslide | Silt with gravel | 0.4~1.5 | 7.0 | 5.7~21.4 | [55] |
| Lanzhou City in Gansu | Bao’ensi landslide | Silt, mudstone fragments with sandstone detritus | 0.2~1.0 | 16.4 | 1.2~6.1 | [56] |
| Xuanhan County in Sichuan | Pianyanzi landslide | Silty clay with weathered mudstone and sandstone fragments | 0.5~1.2 | 12.0 | 4.2~10.0 | [57] |
| Stone Size (mm) | Stone Content (%) | Vertical Stress (kPa) | Shear Strength | ||||||||
|---|---|---|---|---|---|---|---|---|---|---|---|
| 50 | 200 | 300 | 400 | c (kPa) | φ (°) | ||||||
| d’ (cm) | d (cm) | d’ (cm) | d (cm) | d’ (cm) | d (cm) | d’ (cm) | d (cm) | ||||
| L0 (<5.0) | 0 | 3.9 | 5.1 | 4.3 | 5.5 | 3.5 | 4.6 | 3.7 | 5.0 | 33.3 | 17.9 |
| L1 (9.5–19.0) | 30 | 4.7 | 6.2 | 5.4 | 7.1 | 5.6 | 7.5 | 4.5 | 6.2 | 13.0 | 24.7 |
| 50 | 6.1 | 6.8 | 6.4 | 7.9 | 6.8 | 9.1 | 5.2 | 6.6 | 15.3 | 33.4 | |
| 70 | 5.5 | 7.3 | 6.4 | 8.6 | 5.2 | 7.3 | 6.1 | 9.4 | 31.5 | 37.9 | |
| L2 (19.0–31.5) | 30 | 4.3 | 6.1 | 5.7 | 7.2 | 5.3 | 6.5 | 5.5 | 7.0 | 15.0 | 28.7 |
| 50 | 6.3 | 7.9 | 7.2 | 9.1 | 6.5 | 8.3 | 6.9 | 8.8 | 16.6 | 35.0 | |
| 70 | 6.1 | 7.5 | 6.7 | 8.5 | 6.1 | 8.3 | 6.6 | 7.7 | 25.2 | 41.0 | |
| L3 (31.5–53.0) | 30 | 4.7 | 7.2 | 4.9 | 7.5 | 5.0 | 6.7 | 4.3 | 7.1 | 25.5 | 31.2 |
| 50 | 5.3 | 6.6 | 6.6 | 8.3 | 6.8 | 8.2 | 6.5 | 7.5 | 30.5 | 40.7 | |
| 70 | 7.2 | 8.2 | 6.5 | 7.4 | 7.3 | 9.2 | 7.7 | 8.9 | 46.4 | 43.7 | |
| Factors | Stone Content (%) A | Vertical Pressure (kPa) B | Block Stone Size (mm) C | |
|---|---|---|---|---|
| Levels | ||||
| 1 | 0 | 50 | 0 | |
| 2 | 30 | 200 | L1 (9.5–19.0) | |
| 3 | 50 | 300 | L2 (19.0–31.5) | |
| 4 | 70 | 400 | L3 (31.5–53.0) | |
| Number | Factors | Key Shear Zone Thickness (cm) | ||
|---|---|---|---|---|
| A | B | C | ||
| 1 | 1 (0) | 1 (50) | 1 (0) | 3.9 |
| 2 | 1 (0) | 2 (200) | 2 (L1) | 4.3 |
| 3 | 1 (0) | 3 (300) | 3 (L2) | 3.5 |
| 4 | 1 (0) | 4 (400) | 4 (L3) | 3.7 |
| 5 | 2 (30) | 1 (50) | 2 (L1) | 4.7 |
| 6 | 2 (30) | 2 (200) | 1 (0) | 4.3 |
| 7 | 2 (30) | 3 (300) | 4 (L3) | 5.0 |
| 8 | 2 (30) | 4 (400) | 3 (L2) | 5.5 |
| 9 | 3 (50) | 1 (50) | 3 (L2) | 6.3 |
| 10 | 3 (50) | 2 (200) | 4 (L3) | 6.6 |
| 11 | 3 (50) | 3 (300) | 1 (0) | 3.5 |
| 12 | 3 (50) | 4 (400) | 2 (L1) | 5.2 |
| 13 | 4 (70) | 1 (50) | 4 (L3) | 7.2 |
| 14 | 4 (70) | 2 (200) | 3 (L2) | 6.7 |
| 15 | 4 (70) | 3 (300) | 2 (L1) | 5.2 |
| 16 | 4 (70) | 4 (400) | 1 (0) | 3.7 |
| ?K1 | 3.85 | 5.53 | 5.13 | ∑ = 79.3 |
| ?K2 | 4.88 | 5.48 | 4.85 | |
| ?K3 | 5.40 | 4.30 | 5.50 | |
| ?K4 | 5.70 | 4.53 | 5.63 | |
| Rj | 1.85 | 1.23 | 0.78 | |
© 2020 by the authors. Licensee MDPI, Basel, Switzerland. This article is an open access article distributed under the terms and conditions of the Creative Commons Attribution (CC BY) license (http://creativecommons.org/licenses/by/4.0/).
Share and Cite
Li, Z.; Hu, F.; Qi, S.; Hu, R.; Zhou, Y.; Bai, Y. Deformation Characteristics of the Shear Zone and Movement of Block Stones in Soil–Rock Mixtures Based on Large-Sized Shear Test. Appl. Sci. 2020, 10, 6475. https://doi.org/10.3390/app10186475
Li Z, Hu F, Qi S, Hu R, Zhou Y, Bai Y. Deformation Characteristics of the Shear Zone and Movement of Block Stones in Soil–Rock Mixtures Based on Large-Sized Shear Test. Applied Sciences. 2020; 10(18):6475. https://doi.org/10.3390/app10186475
Chicago/Turabian StyleLi, Zhiqing, Feng Hu, Shengwen Qi, Ruilin Hu, Yingxin Zhou, and Yawei Bai. 2020. "Deformation Characteristics of the Shear Zone and Movement of Block Stones in Soil–Rock Mixtures Based on Large-Sized Shear Test" Applied Sciences 10, no. 18: 6475. https://doi.org/10.3390/app10186475
APA StyleLi, Z., Hu, F., Qi, S., Hu, R., Zhou, Y., & Bai, Y. (2020). Deformation Characteristics of the Shear Zone and Movement of Block Stones in Soil–Rock Mixtures Based on Large-Sized Shear Test. Applied Sciences, 10(18), 6475. https://doi.org/10.3390/app10186475