Article

A Study on the Evaluation Method of Highway Driving Assist System Using Monocular Camera

1
Department of Mechanical Engineering, Keimyung University, Daegu 42601, Korea
2
Division of Mechanical and Automotive Engineering, Keimyung University, Daegu 42601, Korea
*
Author to whom correspondence should be addressed.
Appl. Sci. 2020, 10(18), 6443; https://doi.org/10.3390/app10186443
Submission received: 14 August 2020 / Revised: 1 September 2020 / Accepted: 10 September 2020 / Published: 16 September 2020
(This article belongs to the Special Issue Intelligent Transportation Systems)

Abstract

:
In this paper, we propose a method to evaluate Highway Driving Assist (HDA) systems, a type of Advanced Driver Assistance System (ADAS), using a monocular camera, which eliminates the need of experts or expensive equipment and reduces the time, effort, and cost required in such tests. We use the information from the images captured by the monocular camera, such as the lane and rear tires of the lead vehicle, and from the geometrical composition, including the heading angle and the distance of the camera from the front bumper of the test vehicle. To verify the evaluation method, we used the image and geometric information to calculate the distances of the lead vehicle and the lane center from the test vehicle. We compared and analyzed the method using DGPS (Differential Global Positioning System), Data Acquisition(DAQ) and the method using monocular camera. Therefore, it was determined that the proposed method of evaluating HDA systems using a monocular camera is reliable because of the small margin of error between the theoretical with monocular camera and real vehicle test with DAQ and DGPS.

1. Introduction

As one of the defining technologies of the Fourth Industrial Revolution, autonomous driving enables a vehicle to recognize its driving environment and generate a path and strategy to drive on its own. SAE International [1] classifies autonomous driving technology into six levels, from 0 to 5, according to the intervention level of the driver and vehicle systems. Currently, level 2 has reached the commercial stage in the form of Advanced Driver Assistance System (ADAS), which include various functions and systems, namely, Adaptive Cruise Control (ACC), Lane Keeping Assist System (LKAS), forward collision warning system, Autonomous Emergency Braking (AEB), active blind spot detection, and Highway Driving Assist (HDA).
The safety evaluation of ADAS requires essential criteria of test scenarios, which are made up of numerous situations that can occur while driving. Based on results in Scenario Model Predictive Control, Gesari et al. [2] proposed a novel design of control algorithms for lane change assistance and autonomous driving on highways, using scenarios that can be generated by any model- or data-based approach. The experimental results demonstrated the performance of their algorithm in highway lane change situations. Geng et al. [3] proposed traffic scenarios where characteristics of driving behavior were learned by Hidden Markov Models. In addition, they built a knowledge base to specify model adaptation strategies and store priori probabilities according to the scenario characteristics to predict the future behavior of the target car. Chae et al. [4] proposed safety evaluation scenarios based on existing ADAS regulation, which were evaluated via both a simulation and an experimental vehicle test. Na et al. [5] proposed a test evaluation scenario of an ACC and AEB integrated system, and verified it using the PRESCAN simulator. Lim et al. [6] proposed scenarios and evaluation items for autonomous driving safety evaluation, which were verified by analyzing the driving data acquired through actual vehicle driving. Additionally, safety evaluation factors were developed based on ISO requirements, previous works, and current traffic regulations at the time. Park et al. [7] proposed scenarios for the safety evaluation on take-over on highways, wherein they first developed a highway driving scenario, before developing six control transition scenarios.
In such studies, based on a proposed scenario, the safety of the system is evaluated through an actual vehicle test or a simulator such as PRESCAN [8,9,10] or CarSim [11,12,13]. Kim and Lee [14] proposed scenarios and equations to evaluate the safety and functioning of adaptive cruise control systems and verified their effectiveness through vehicle tests. Yoon and Lee [15] proposed test scenarios and evaluation equations to assess the safety and functioning of lane keeping assist systems and analyzed the characteristics of each scenario by applying real road conditions representing the driving environment of the Republic of Korea. Kwon and Lee [16] designed scenarios for safety evaluation, testing, and verification of autonomous emergency braking systems by comparing theoretical values with the corresponding experimental measurements. Bae et al. [17] devised scenarios to evaluate the safety and functioning of HDA systems, performed simulations using the PRESCAN simulator, and verified the simulation results with real vehicle tests. Butakov and Ioannou [18] developed a learning method that considers the dynamic characteristics of individual vehicles and driver systems, before and during lane changes, and verified the validity of the method through real vehicle tests. Ball and Tang [19] automatically extracted scenario-related features for the LKAS based on deep learning of sensor data; they compared the performances of a convolutional neural network and a recurrent neural network, from which two classification models could be established. Lee et al. [20] proposed a recognition algorithm using real-time driving image data and a quantitative recognition rate based on camera images. Kim and Lim [21] proposed a system that can automatically detect moving obstacles using a camera-equipped remote control car, and operated the vehicle to the target point. The results of this study were verified through experiments in the actual driving environment. Ahn [22] proposed a motion tracking algorithm for motion recognition of images using the front camera of a vehicle. Lee et al. [23] reduced error occurrence through learning to detect vehicles in wide angle lenses with severe distortion, and verified it through an actual car test. Chen and Huang [24] presented a novel instrument for pedestrian detection by combining stereo vision cameras with a thermal camera. The evaluation results showed that it significantly outperforms the traditional histogram of oriented gradients features. Lee et al. [25] described a perception system for autonomous vehicles, which performs information fusion to recognize road environments. The proposed perception system was validated on various roads and environmental conditions using an autonomous vehicle. Kalaki and Safabakhsh [26] proposed novel methods using computer vision technologies. The experimental results showed that the proposed algorithms can correctly identify lanes with high accuracy in real time, and are robust to noise and shadows. Shu and Tan [27] proposed a method for finding and tracking road lanes for vision-guided autonomous vehicle navigation. The new lane detection method was tested on real road images and achieved robust and reliable results. Zhao et al. [28] presented a novel object detection and identification method that fuses the complementary information obtained by two types of sensors. Song [29] used only camera sensors to predict the path of surrounding vehicles and showed high accuracy with deep learning technology, while Heo [30] proposed a method to measure the distance and speed of a moving object by extracting the difference image from a stereo vision system. Koo [31] proposed a single camera-based front collision warning system using deep learning and OBD2, and verified its performance through a collision experiment. Abduladhem and Hussein [32] proposed a method to estimate the distance from the preceding vehicle using Hough Transform and Kalman filter in a monocular camera. Yamaguti et al. [33] proposed a measurement method of the distance to the target vehicle using two images, and calculated the distance using the ratio between the sizes of the objects projected on the two images. Jiangwei et al. [34] detected a lead vehicle using a monocular camera, and Satzoda et al. [35] proposed a vehicle-detection algorithm using camera calibration.
The present study proposes an evaluation method of HDA systems using a monocular camera and verifies its performance through actual vehicle testing. Unlike simulation, there are many variables to be considered during real-world testing. Hence, an actual vehicle test is necessary for the safety evaluation of ADAS. In these tests, there is not only a need for expensive equipment, such as Data AcQuisition (DAQ) and Differential Global Positioning System (DGPS), which measure the dynamic information of the vehicle, but also of experts who can handle such equipment. Consequently, there is a significant amount of time and cost involved in conducting actual vehicle tests.
To solve these problems, we propose a method that can evaluate the safety of HDA systems using only a monocular camera (commercialized black-box camera with 30 frames per second), as cameras are affordable, easy to handle, and have good accessibility. We assume that the lanes, rear tires of the lead vehicle, and vanishing point are detected in the image captured by the monocular camera. In general, the rear tires of the lead vehicle are detected at a safe distance between vehicles on the highway. However, in the special case where the rear tires of the lead vehicle are not detected, the safe distance is based on the lowest point of the lead vehicle. Two parameters are needed to evaluate the HDA system using the proposed method. The first is the distance from the lead vehicle to the camera-equipped vehicle, and the second is the distance to the center of the lane. We developed a method to calculate the parameters based on information from the images captured by the monocular camera and the geometric composition of the lead vehicle. Furthermore, we compared and analyzed the method using a monocular camera with that involving real vehicle tests with DAQ and DGPS. Finally, we verified the reliability of the developed method in scenarios that resembled safety evaluation conditions.

2. Proposed Formulation for HDA System with Monocular Camera

The HDA system is activated by utilizing GPS data when a vehicle enters a highway. This facilitates the recognition of the lanes and lead vehicles to ensure safe following, distances, and lane-keeping. The distance to the lead vehicle is maintained via longitudinal control, and lane keeping is achieved via lateral control.

2.1. Conditions

For the proposed formulation, we considered the following conditions for camera installation on the vehicle and collection of images:
  • The camera was installed at the midpoint of the vehicle width;
  • The camera faced forward and was oriented parallel to the ground surface;
  • The required back-overhang value of the lead vehicle was known in advance;
  • The hood of the test vehicle, lanes, rear tires of the lead vehicle, and vanishing point were captured in the image obtained by the camera.
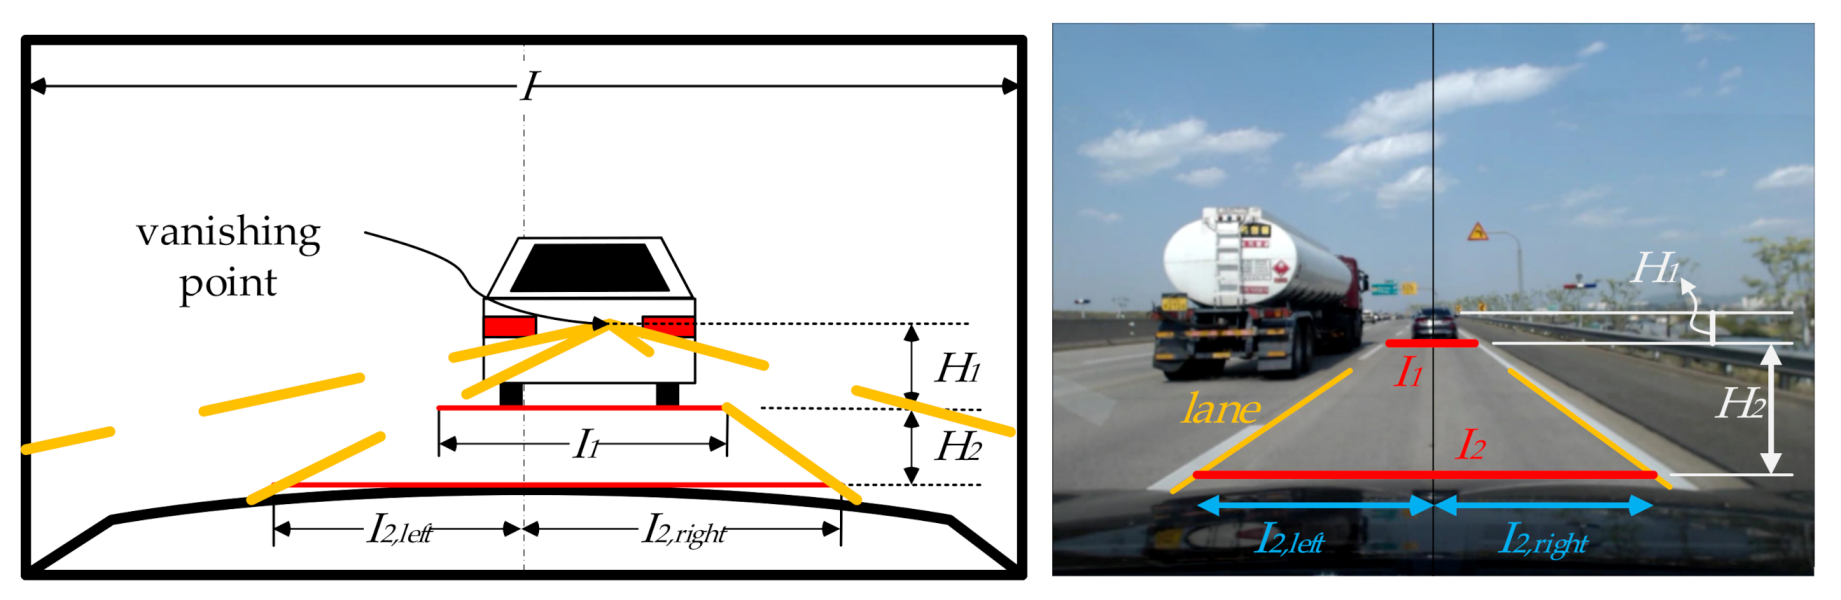
2.2. Camera Image

Figure 1 illustrates an image captured by the camera mounted on the vehicle, wherein the lanes, lead vehicle, rear tires of the lead vehicle, and vanishing point can be observed.
In Figure 1, I1 is the lane width determined from the bottom of the rear tires of the lead vehicle; I2,left and I2,right are the distances from the central vertical line of the image to the left and right lanes, respectively; H1 is the vertical distance from the vanishing point to the bottom of the rear tires of the lead vehicle; H2 is the vertical distance from the bottom of the rear tires of the lead vehicle to the hood of the camera-equipped vehicle.

2.3. Geometric Variables

The geometric variables related to two vehicles on a lane are shown in Figure 2 and Figure 3. Figure 2 shows the geometries of the camera-equipped vehicle and the lead vehicle, and Figure 3 shows the geometry of the camera-equipped vehicle and the lanes according to the heading angle ψ. Even if the slope of the test vehicle differed from that of the lead vehicle, the results of the theoretical formula and the real vehicle test, as well as the distance between the vehicles, were not affected up until a maximum slope of 5% (max. highway slope mandated by the highway design regulations of the Republic of Korea).
In Figure 2, h1 is the height from the ground to the camera; h2 is the height from the hood to the camera; b and c are the distances from the camera to the hood and the front bumper, respectively; a is the distance from the front bumper to the spot hidden from view by the hood; β is the angle to the spot hidden by the hood (with respect to the perpendicular to the ground); α is the angle between the lines joining the camera to both the spot hidden by the hood and the bottom of the rear tires of the lead vehicle. Further, l is the actual height of H2, l’ is the actual height of H1, dO.H. is the rear-overhang of the lead vehicle, and dImage is the distance between the spot hidden by the front bumper and the rear tires of the lead vehicle.
In Figure 3, dleft and dright are the distances from the left and right tires of the camera-equipped vehicle to the lane, respectively; df.wh is the distance from the front tire to the front bumper of the vehicle; k is the distance from the endpoint of a to the lane; ψ is the heading angle between the vehicle and lane; θ is the camera angle of view; L is the lateral distance across the front-view of the image with respect to the hood top.

2.4. Formulation

Using the aforementioned geometric relationships and the corresponding figures, Equations (1) and (2) can be obtained.
h 2   : b =   h 1   : a + c
I 2 , l e f t   : I =   L l e f t   : L .
On the basis of the camera angle of view and mounting height, Equations (3)–(6) can be obtained.
L 2 , l e f t =   2 a + c L 2 , l e f t L   t a n θ 2
t a n   β =   a + c h 1
l   : l + l =   H 2   : H 1 + H 2
t a n   α + β =   a + c + d I m a g e   h 1 .
The geometric relationships of the camera-equipped vehicle and lead vehicle can be used to derive Equations (7) and (8).
d f r o n t = a + d I m a g e d O . H .
d I m a g e   : l = d I m a g e + a + c : l + l .
The geometric relationships of the camera-equipped vehicle and lane in terms of the heading angle can be used to derive Equations (9)–(12).
d l e f t = d l e f t × c o s   ψ
d l e f t = k   × c o s   ψ
k   : d l e f t = k + a + d f . w h : d l e f t
d l e f t = L l e f t 1 2 w c a r .
Equation (13) can be used to calculate the distance to the lead vehicle via application of Equations (1)–(12). In addition, Equations (14) and (15) can be used to determine the distances from the closest front tires to the left and right lanes, respectively, and Equation (16) can be used to obtain the distance to the center of the lane, dcenter, via combination of Equations (14) and (15).
d f r o n t = a d O . H . + a + c I 2 I 1 I 1
d l e f t = 2 a + c I 2 ,   l e f t I   t a n   θ 2 1 2 w c a r c o s   ψ + a + d f . w h   s i n   ψ
d r i g h t = 2 a + c I 2 ,   r i g h t I   t a n   θ 2 1 2 w c a r c o s   ψ a + d f . w h   s i n   ψ
d c e n t e r = a + c I 2 , l e f t I 2 ,   r i g h t I   t a n   θ 2     c o s   ψ + a + d f . w h   s i n   ψ .
The following distance between the vehicles can be maintained via longitudinal control on the basis of Equation (13), and lane keeping can be achieved via lateral control on the basis of Equation (16). Moreover, the proposed formulation can be used for safety and function evaluations of an HDA system relying on a monocular camera.

3. Real Vehicle Test

To verify our method, we conducted a real vehicle test under scenarios presented in a related previous study [5] using the test conditions listed in Table 1. The initial speed of the subject vehicle is 90 km/h, and that of the lead vehicle is 70 km/h.

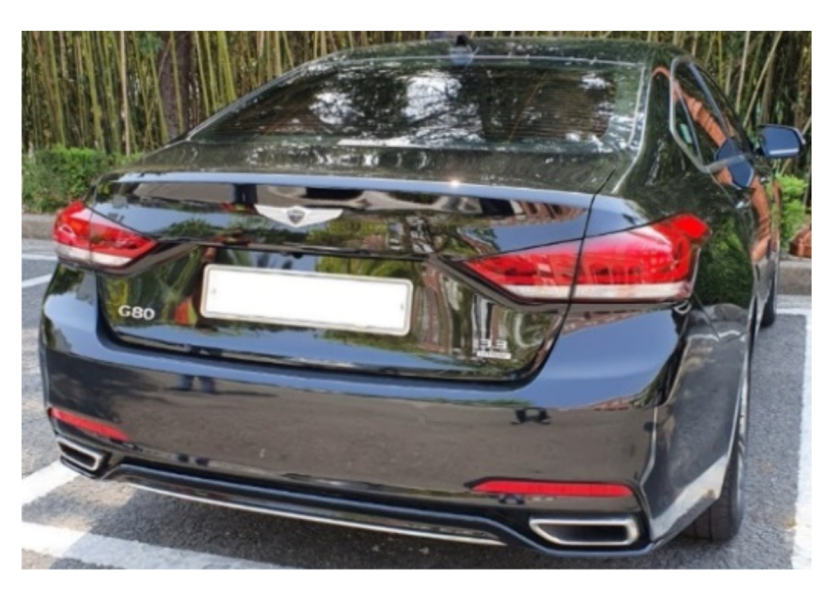
3.1. Field Test Vehicle
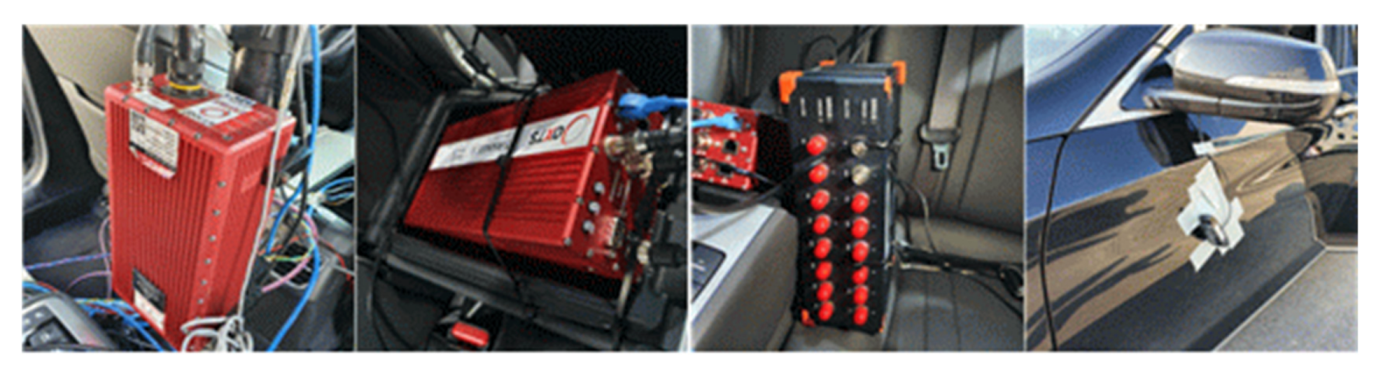
A 2016 Hyundai Genesis G80 (Figure 4) was used as the field test vehicle. The vehicle is equipped with a camera, radar, LiDAR, and ultrasonic sensors to perform ADAS functions such as adaptive cruise control, lane keeping, autonomous emergency braking, and HDA. This test vehicle demonstrates high HDA performance, according to evaluations of function-loaded vehicles in the Republic of Korea.

3.2. Test Equipment

The devices used for the recording measurements during the real vehicle test included the RT3002 inertial navigation system, RT-range ADAS sensor, SIRIUS data acquisition device, and a camera. The devices mounted on the test vehicle are shown in Figure 5, and their specifications are listed in Table 2. The RT3002 system measures the vehicle dynamic characteristics based on differential GPS data, and the RT-range sensor measures the distance to the lead vehicle. SIRIUS collects the data measured from RT3002 and RT-range, and the camera measures the distance from the front tires to a lane.

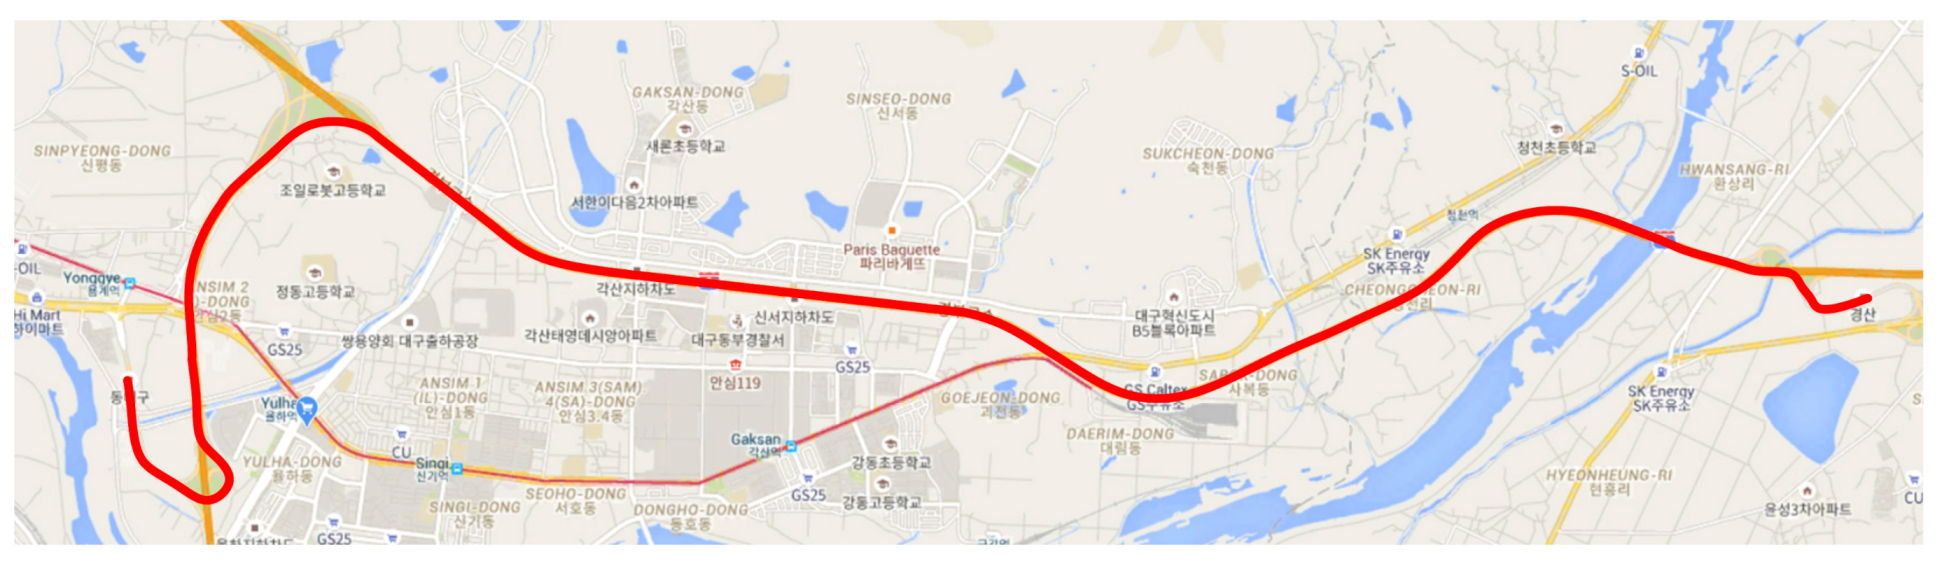
3.3. Test Location and Road Conditions

The vehicle test was conducted along the Dongdaegu TG-Gyeongsan TG section on the Gyeongbu Expressway of Republic of Korea. Figure 6 shows the vehicle trajectory, and Table 3 lists the road conditions.

3.4. Test Results

Based on the data collected during the real vehicle test, Figure 7, Figure 8, Figure 9, Figure 10 and Figure 11 show the yaw rate, distance to the lead vehicle, and distance to the center of the lane. Figure 7 and Figure 8 show the yaw rate and distance to the center of the lane for scenarios 1–5, and Figure 9, Figure 10 and Figure 11 show the yaw rate and distances to the lead vehicle and center of the lane for scenarios 6–12. We did not consider scenarios 2 and 7 (ramps) and scenario 13 (tollgate) in this study because commercial HDA cannot be activated in such scenarios. The real vehicle test was performed three times to evaluate measurement reliability and trends.
Figure 7a shows the test results for scenario 1 during straight road driving without the lead vehicle. The vehicle drove at approximately −0.1 to 0.2 m from the center of the lane. Figure 7b shows the test results for scenario 3 during driving in a curved section without the lead vehicle. The vehicle drove at approximately −0.5 to 0.5 m from the center of the lane.
Figure 8a shows the test results for scenario 4 during straight road driving in a side lane and with the lead vehicle. The vehicle drove at approximately −0.1 to 0.2 m from the center of the lane. Figure 8b shows the test results for scenario 5 during driving in a curved section in a side lane with the lead vehicle. The vehicle drove at approximately −0.1 to 0.5 m from the center of the lane.
Figure 9a shows the test results for scenario 6 during straight road driving in the main lane with the lead vehicle. The camera-equipped vehicle recognized the lead vehicle after approximately 5 s and slowly decelerated. Furthermore, the vehicle drove at approximately −0.3 to 0.4 m from the center of the lane. Figure 9b shows the test results for scenario 8 during driving in a curved section in the main lane with the lead vehicle. The camera-equipped vehicle recognized the lead vehicle after approximately 2 s and slowly decelerated. Furthermore, the vehicle drove at approximately −0.1 to 0.4 m from the center of the lane.
Figure 10a shows the test results for scenario 9 during straight road driving with the lead vehicle cutting in. The camera-equipped vehicle recognized the lead vehicle after approximately 2 s and decelerated. Furthermore, it drove at approximately −0.4 to 0.3 m from the center of the lane. Figure 10b shows the test results for scenario 10 during driving in a curved section with the lead vehicle cutting in. The camera-equipped vehicle recognized the lead vehicle after approximately 1.5 s and decelerated. Furthermore, it drove at approximately −0.4 to 0.5 m from the center of the lane.
Figure 11a shows the test results for scenario 11 during which the camera-equipped vehicle maintained an approximate distance of 30 m from the lead vehicle. After approximately 2 s, the vehicle accelerated to its initial speed setting owing to the lead vehicle cutting out. The camera-equipped vehicle drove at approximately −0.3 to 0.2 m from the center of the lane. Figure 11b shows the test results for scenario 12 during which the camera-equipped vehicle maintained an approximate distance of 30 m from the lead vehicle in a curved section. After approximately 3 s, the vehicle accelerated to its initial set speed owing to the lead vehicle cutting out. The camera-equipped vehicle drove at approximately −0.6 to 0.1 m from the center of the lane.

4. Comparative Analysis between Theoretical Values and Test Results

The theoretical values and the vehicle test results of each scenario are shown in Figure 12, Figure 13, Figure 14, Figure 15, Figure 16, Figure 17, Figure 18 and Figure 19. The distances to the center of the lane for scenarios 1, 3–6, and 8–12 are shown in Figure 12a,b, Figure 13a,b, Figure 14a,b, Figure 15a,b, Figure 16a,b, respectively. The distances to the lead vehicle for scenarios 6 and 8–12 are shown in Figure 17a,b, Figure 18a,b, Figure 19a,b, respectively.
Table 4 lists the maximum calculation errors in the theoretical values with respect to the vehicle test results for each scenario. A maximum error of 5.11 m for the distance to the lead vehicle occurred in scenario 8, while a maximum error of 0.15 m for the distance to the center of the lane occurred in scenarios 5 and 10. The comparative analysis showed that the maximum errors across scenarios occurred on curved sections of the road. Lane recognition and detection is more difficult on road curves than on straight road, and the errors occurred owing to large variations in the yaw rate and heading angle during turning.
The maximum calculation error was 8.6% in the longitudinal direction in scenario 8, 8.2% in the lateral direction in scenario 5, and 8.1% in the lateral direction in scenario 10. As the margin of error in the calculated values was found to be small, the proposed formula was determined to be reliable.

5. Conclusions

In this study, we proposed a method to evaluate HDA systems using a monocular camera and verified its reliability through a real vehicle test with DAQ and DGPS. The main findings are summarized below:
  • We used a monocular camera (1920 × 1080/30 frames per second) similar to the commercial black-box camera specification.
  • The evaluation method used the images captured by the camera and the geometric composition of the lead vehicles to calculate the distances of the lead vehicle and the center of the lane.
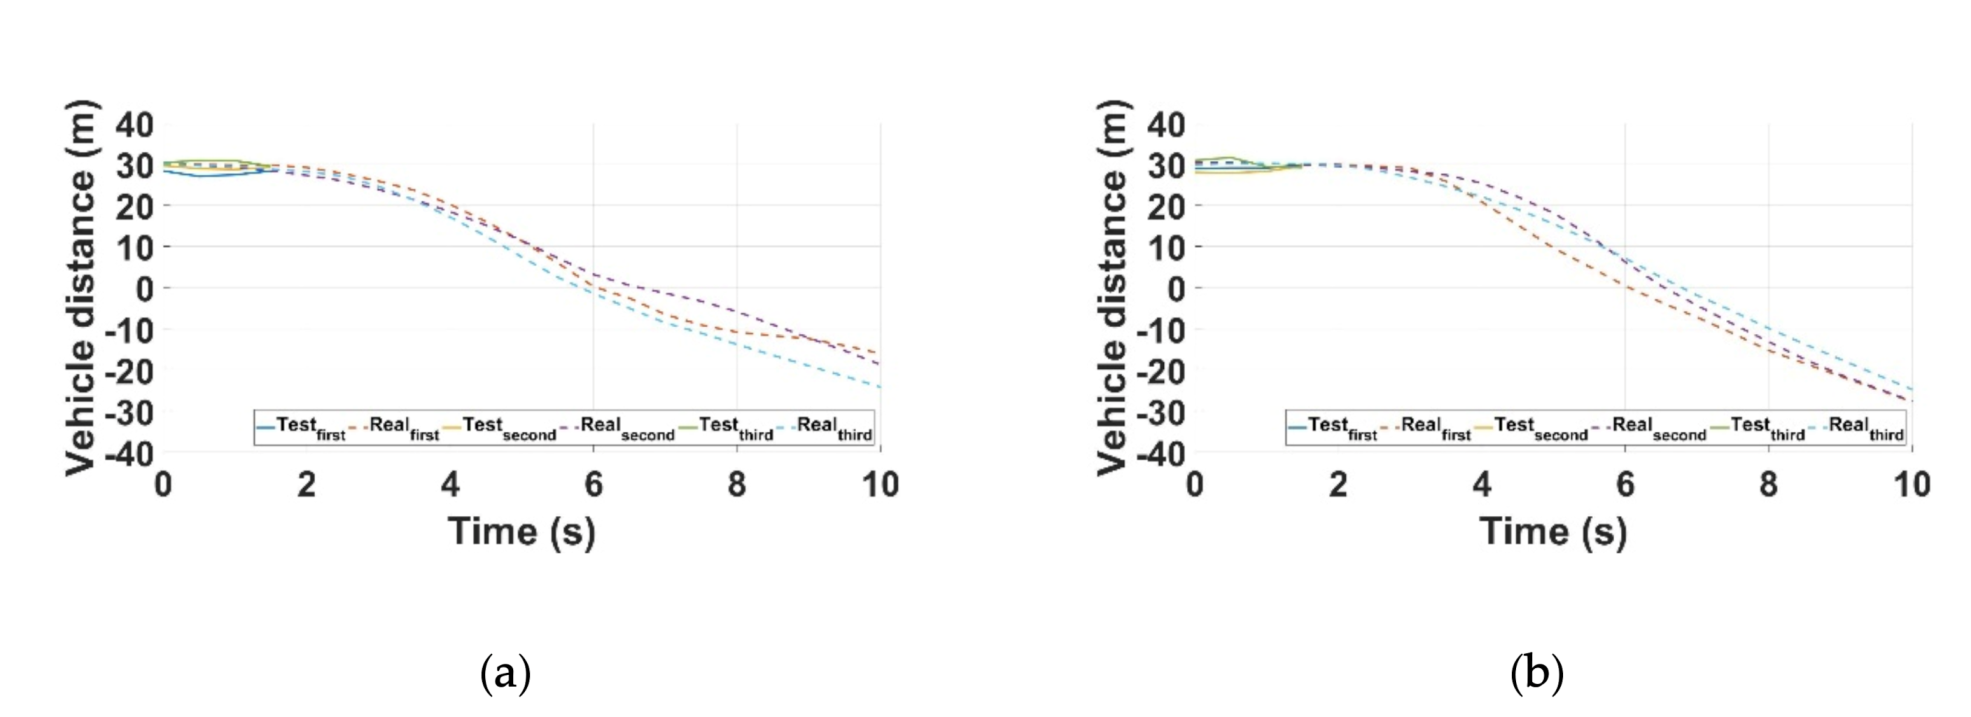
  • A test was conducted using a vehicle with DAQ and DGPS to verify the reliability of the proposed method, and the theoretical values of the monocular camera method were compared with the results of the real vehicle test for analysis.
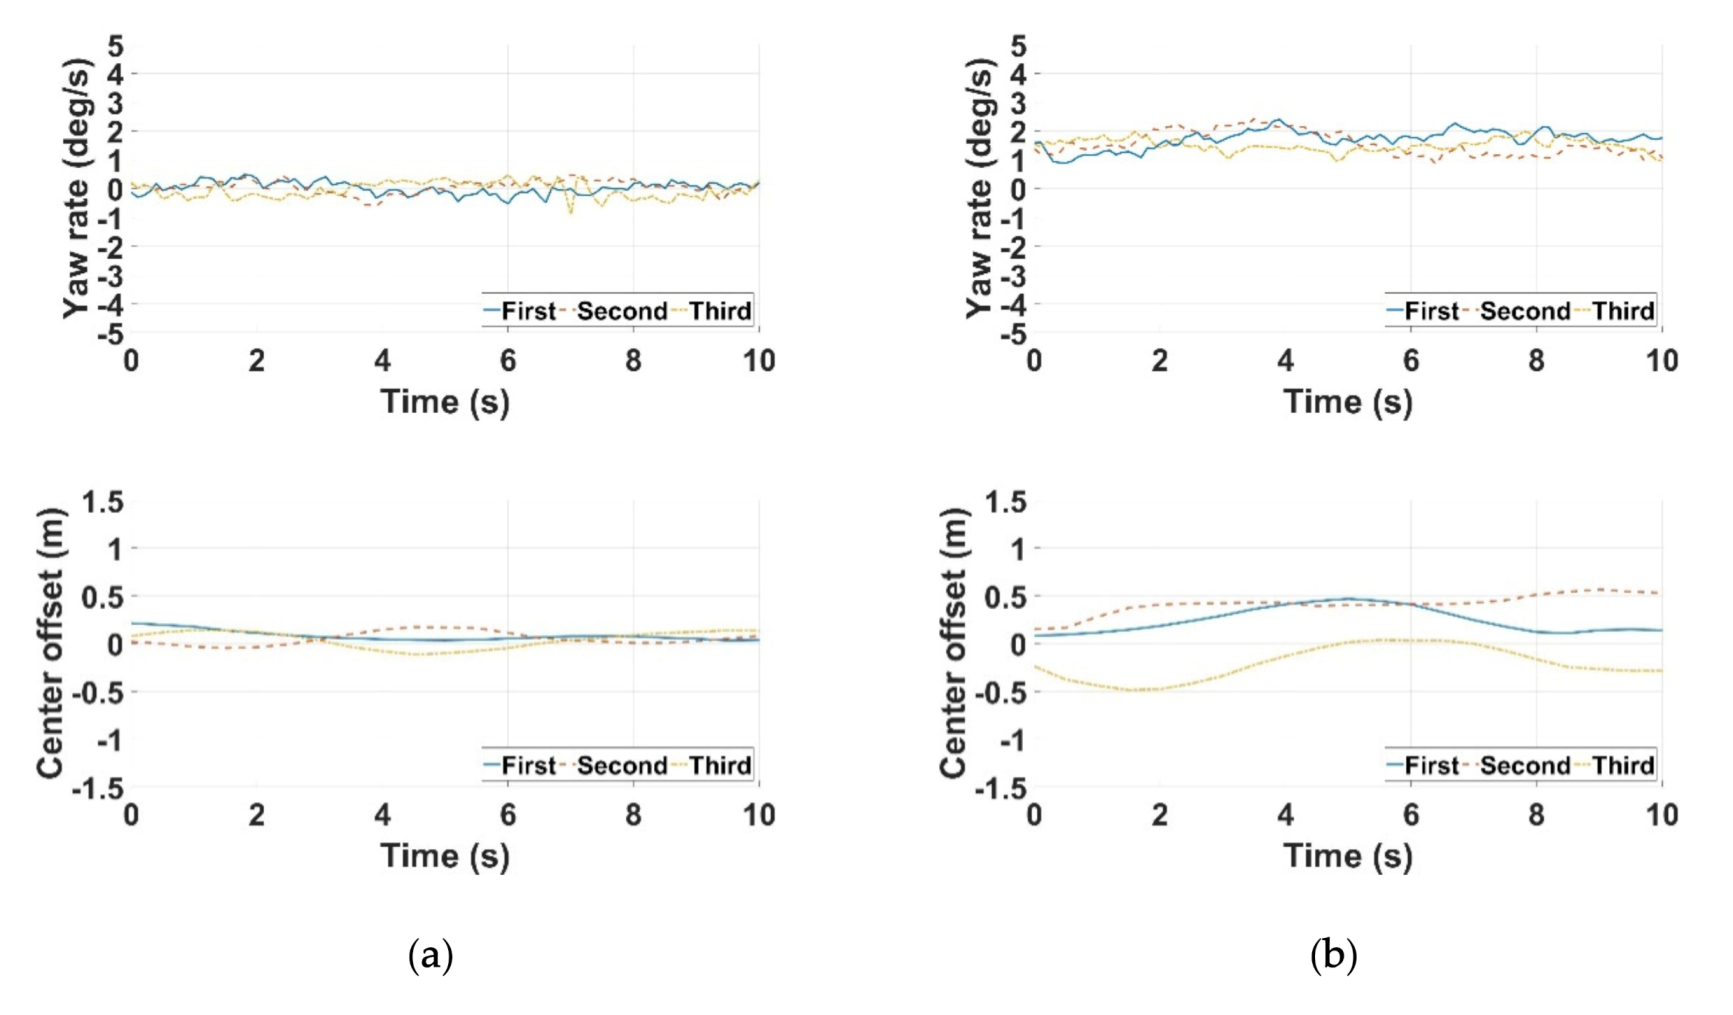
  • The comparative analysis revealed a maximum error of 0.15 m for the distance to the center of the lane in scenarios 5 and 10, and 5.11 m for the distance to the lead vehicle in scenario 8. The maximum errors occurred on the curved sections of the road, which can be attributed to the difficulties in predicting and detecting the lane, and the large changes in the yaw rate and heading angle of the vehicle when turning.
  • The maximum error between the results of the monocular camera method and the real vehicle test with DGPS and DAQ was 8.6% in the longitudinal direction in scenario 8, 8.2% in the lateral direction in scenario 5, and 8.1% in the lateral direction in scenario 10. Therefore, the method using a monocular camera can be deemed reliable because of the small margin of error.
  • This study proved that it is possible to test and evaluate HDA systems using only a monocular camera, without the need of experts handling expensive equipment such as DGPS and DAQ, thereby saving time and costs.
In future, we will conduct further research on instances where the lanes cannot be detected or when the rear tires of the preceding vehicle (as in the case of specially modified vehicles) are not visible.

Author Contributions

Conceptualization: S.B.L., methodology: S.B.L., actual test: G.H.B. and S.B.L., data analysis: G.H.B. and S.B.L., investigation: G.H.B., writing—original draft preparation: G.H.B. and S.B.L., writing—review and editing: G.H.B. and S.B.L. All authors have read and agreed to the published version of the manuscript.

Funding

This research was funded by the Ministry of Trade, Industry and Energy and the Korea Institute of Industrial Technology Evaluation and Management (KEIT) in 2020, grant number 10079967.

Acknowledgments

This work was supported by the Technology Innovation Program (10079967, Technical development of demonstration for evaluation of autonomous vehicle system) funded by the Ministry of Trade, Industry and Energy (MOTIE, Korea).

Conflicts of Interest

The authors declare no conflict of interest.

References

  1. SAE International, SAE J3016: Levels of Driving Automation. Available online: https://www.sae.org/news/2019/01/sae-updates-j3016-automated-driving-graphic (accessed on 10 June 2020).
  2. Cesari, G.; Schildbach, G.; Carvalho, A.; Borrelli, F. Scenario model predictive control for lane change assistance and autonomous driving on highways. IEEE Intell. Transp. Syst. Mag. 2017, 9, 23–35. [Google Scholar] [CrossRef]
  3. Geng, X.; Liang, H.; Yu, B.; Zhao, P.; He, L.; Huang, R. A scenario-adaptive driving behavior prediction approach to urban autonomous driving. Appl. Sci. 2017, 7, 426. [Google Scholar] [CrossRef]
  4. Chae, H.S.; Jeong, Y.H.; Lee, M.S.; Shin, J.K.; Yi, K.S. Development and validation of safety performance evaluation scenarios of autonomous vehicle. J. Auto-Veh. Saf. Assoc. 2017, 9, 6–12. [Google Scholar]
  5. Na, W.B.; Lee, J.I.; Park, C.W.; Lee, H.C. A study of designing integrated scenario for testing ADAS. J. Korean Soc. Automot. Eng. 2016, 2016, 1243–1248. [Google Scholar]
  6. Lim, H.H.; Chae, H.S.; Lee, M.S.; Lee, K.S. Development and validation of safety performance evaluation scenarios of autonomous vehicle based on driving data. J. Auto-Veh. Saf. Assoc. 2017, 9, 7–13. [Google Scholar]
  7. Park, S.H.; Jeong, H.R.; Kim, K.H.; Yun, I.S. Development of safety evaluation scenario for autonomous vehicle take-over at expressways. J. Korea Inst. Intell. Transp. Syst. 2018, 17, 142–151. [Google Scholar] [CrossRef]
  8. Gietelink, O.J.; Verburg, D.J.; Labibes, K.; Oostendorp, A.F. Pre-crash system validation with PRESCAN and VEHIL. In Proceedings of the IEEE Intelligent Vehicles Symposium, Parma, Italy, 14–17 June 2004. [Google Scholar]
  9. Nacu, C.R.; Fodorean, D.; Husar, C.; Grovu, M.; Irimia, C. Towards autonomous EV by using Virtual Reality and Prescan-Simulink simulation environments. In Proceedings of the 2018 International Symposium on Power Electronics, Electrical Drives, Automation and Motion (SPEEDAM), Amalfi, Italy, 20–22 June 2018. [Google Scholar]
  10. Kim, J.S.; Hong, S.J.; Baek, J.H.; Kim, E.T.; Lee, H.J. Autonomous vehicle detection system using visible and infrared camera. In Proceedings of the 2012 12th International Conference on Control, Automation and Systems, Jeju Island, Korea, 17–21 October 2012. [Google Scholar]
  11. Marino, R.; Scalzi, S.; Orlando, G.; Netto, M. A nested PID steering control for lane keeping in vision based autonomous vehicles. In Proceedings of the 2009 American Control Conference, St. Louis, MO, USA, 10–12 June 2009. [Google Scholar]
  12. Shah, S.; Dey, D.; Lovett, C.; Kapoor, A. AirSim: High-Fidelity Visual and Physical Simulation for Autonomous Vehicles. In Field and Service Robotics; Springer: Cham, Switzerland, 2018. [Google Scholar]
  13. Marino, R.; Scalzi, S.; Netto, M. Nested PID steering control for lane keeping in autonomous vehicles. Control Eng. Pract. 2011, 19, 1459–1467. [Google Scholar] [CrossRef]
  14. Kim, B.J.; Lee, S.B. A study on evaluation method of ACC test considering domestic road environment. J. Auto-Veh. Saf. Assoc. 2017, 9, 38–47. [Google Scholar]
  15. Yoon, P.H.; Lee, S.B. A Study on evaluation method of the LKAS test in domestic road environment. J. Korean Inst. Inf. Technol. 2018, 18, 628–637. [Google Scholar]
  16. Kwon, B.H.; Lee, S.B. A study on the V2V safety evaluation method of AEB. J. Auto-Veh. Saf. Assoc. 2019, 11, 7–16. [Google Scholar]
  17. Bae, G.H.; Kim, B.J.; Lee, S.B. A study on evaluation method of the HDA test in domestic road environment. J. Auto-Veh. Saf. Assoc. 2019, 11, 39–49. [Google Scholar]
  18. Vadim, A.B.; Petros, I. Personalized driver/vehicle lane change models for ADAS. IEEE Trans. Veh. Technol. 2015, 2015, 4422–4431. [Google Scholar]
  19. Ball, J.E.; Tang, B. Machine Learning and Embedded Computing in Advanced Driver Assistance Systems (ADAS). Electronics 2019, 8, 748. [Google Scholar] [CrossRef] [Green Version]
  20. Lee, J.W.; Lim, D.J.; Song, G.Y.; Noh, H.J.; Yang, H.A. The research of construction and evaluation of real road image database for camera-based autonomous driving recognition. J. Korean Soc. Automot. Eng. 2019, 2019, 622–626. [Google Scholar]
  21. Kim, S.J.; Lim, J.W. Camera based Autonomous Vehicle’s Obstacle Avoidance System. In Proceedings of the KSAE Annual Conference, Goyang, Korea, 19–22 November 2014; pp. 792–793. [Google Scholar]
  22. Ahn, I.S. Motion trace algorithm of front camera for autonomous vehicles. In Proceedings of the The Institute of Electronics and Information Engineers Conference, Seoul, Korea; 2018; pp. 806–808. [Google Scholar]
  23. Lee, J.S.; Choi, K.T.; Park, T.H.; Kee, S.C. A study on the vehicle detection and tracking using forward wide angle camera. Trans. KASE 2018, 26, 368–377. [Google Scholar] [CrossRef]
  24. Chen, Z.; Huang, X. Pedestrian detection for autonomous vehicle using multi-spectral cameras. IEEE Trans. Intell. Veh. 2019, 4, 211–219. [Google Scholar] [CrossRef]
  25. Lee, M.C.; Han, J.H.; Jang, C.H.; Sunwoo, M.H. Information fusion of cameras and laser radars for perception systems of autonomous vehicles. J. Korean Inst. Intell. Syst. 2013, 23, 35–45. [Google Scholar] [CrossRef]
  26. Kalaki, A.S.; Safabakhsh, R. Current and adjacent lanes detection for an autonomous vehicle to facilitate obstacle avoidance using a monocular camera. In Proceedings of the 2014 Iranian Conference on Intelligent Systems (ICIS), Bam, Iran, 4–6 February 2014. [Google Scholar]
  27. Shu, Y.; Tan, Z. Vision based lane detection in autonomous vehicle. In Proceedings of the Fifth World Congress on Intelligent Control and Automation, Hangzhou, China, 15–19 June 2004. [Google Scholar]
  28. Zhao, X.; Sun, P.; Xu, Z.; Min, H.; Yu, H.K. Fusion of 3D LIDAR and camera data for object detection in autonomous vehicle applications. IEEE Sens. J. 2020, 20, 4901–4913. [Google Scholar] [CrossRef] [Green Version]
  29. Song, Y.H. Real-time Vehicle Path Prediction based on Deep Learning using Monocular Camera. Master’s Thesis, Hanyang University, Seoul, Korea, 2020. [Google Scholar]
  30. Heo, S.M. Distance and Speed Measurements of Moving Object Using Difference Image in Stereo Vision System. Master’s Thesis, Kwangwoon University, Seoul, Korea, 2002. [Google Scholar]
  31. Koo, S.M. Forward Collision Warning (FCW) System with Single Camera using Deep Learning and OBD-2. Master’s Thesis, Dankook University, Seoul, Korea, 2018. [Google Scholar]
  32. Abduladhem, A.A.; Hussein, A.H. Distance estimation and vehicle position detection based on monocular camera. In Proceedings of the 2016 AI-Sadeq International Conference on Multidisciplinary in IT and Communication Science and Applications, Baghdad, Iraq, 9–10 May 2016. [Google Scholar]
  33. Yamaguti, N.; OE, S.; Terada, K. A method of distance measurement by using monocular camera. In Proceedings of the 36th SICE Annual Conference. International Session Papers, Tokushima, Japan, 29–31 July 1997. [Google Scholar]
  34. Chu, J.; Ji, L.; Guo, L.; Libibing; Wang, R. Study on method of detecting preceding vehicle based on monocular camera. In Proceedings of the 2004 IEEE Intelligent Vehicles Symposium, Parma, Italy, 14–17 June 2004. [Google Scholar]
  35. Ravi, K.S.; Eshed, O.B.; Jinhee, L.; Hohyon, S.; Mohan, M.T. On-road vehicle detection with monocular camera for embedded realization: Robust algorithms and evaluations. In Proceedings of the 2014 International SoC Design Conference, Jeju, Korea, 3–6 November 2014. [Google Scholar]
Figure 1. Image from camera mounted on vehicle.
Applsci 10 06443 g001
Figure 2. Geometry of vehicle, camera, and lead vehicle.
Applsci 10 06443 g002
Figure 3. Geometry of a vehicle on lane according to heading angle.
Applsci 10 06443 g003
Figure 4. Test vehicle-Hyundai Genesis G80.
Applsci 10 06443 g004
Figure 5. Test equipment mounted on vehicle.
Applsci 10 06443 g005
Figure 6. Vehicle trajectory during road test.
Applsci 10 06443 g006
Figure 7. Yaw rate and distance to the center of the lane: (a) scenario 1 and (b) scenario 3.
Applsci 10 06443 g007
Figure 8. Yaw rate and distance to the center of the lane: (a) scenario 4 and (b) scenario 5.
Applsci 10 06443 g008
Figure 9. Yaw rate, distance to the lead vehicle, and distance to the center of the lane: (a) scenario 6 and (b) scenario 8.
Applsci 10 06443 g009
Figure 10. Yaw rate, distance to the lead vehicle, and distance to the center of the lane: (a) scenario 9 and (b) scenario 10.
Applsci 10 06443 g010
Figure 11. Yaw rate, distance to the lead vehicle, and distance to the center of the lane: (a) scenario 11 and (b) scenario 12.
Applsci 10 06443 g011
Figure 12. Comparison of theoretical values and real vehicle test results based on distance to the center of the lane: (a) scenario 1 and (b) scenario 3.
Applsci 10 06443 g012
Figure 13. Comparison of theoretical values and real vehicle test results based on distance to the center of the lane: (a) scenario 4 and (b) scenario 5.
Applsci 10 06443 g013
Figure 14. Comparison of theoretical values and real vehicle test results based on distance to the center of the lane (a) scenario 6 (b) scenario 8.
Applsci 10 06443 g014
Figure 15. Comparison of theoretical values and real vehicle test results based on distance to the center of the lane: (a) scenario 9 and (b) scenario 10.
Applsci 10 06443 g015
Figure 16. Comparison of theoretical values and real vehicle test results based on distance to the center of the lane: (a) scenario 11 and (b) scenario 12.
Applsci 10 06443 g016
Figure 17. Comparison of theoretical values and real vehicle test results based on distance to the lead vehicle: (a) scenario 6 and (b) scenario 8.
Applsci 10 06443 g017
Figure 18. Comparison of theoretical values and real vehicle test results based on distance to the lead vehicle: (a) scenario 9 and (b) scenario 10.
Applsci 10 06443 g018
Figure 19. Comparison of theoretical values and real vehicle test results based on distance to the lead vehicle: (a) scenario 11 and (b) scenario 12.
Applsci 10 06443 g019
Table 1. HDA test scenarios.
Scenario No.Lead VehicleRoad Curvature (m)Note
1N0 (straight)-
2N350 (ramp)-
3N750 (curve)-
4Y (side lane)0 (straight)Lead vehicle driving along the side lane
5Y (side lane)750 (curve)Lead vehicle driving along the side lane
6Y (main lane)0 (straight)Lead vehicle driving along the main lane
7Y (main lane)350 (ramp)Lead vehicle driving along the main lane
8Y (main lane)750 (curve)Lead vehicle driving along the main lane
9Y (main lane)0 (straight)Lead vehicle cutting in
10Y (main lane)750 (curve)Lead vehicle cutting in
11Y (main lane)0 (straight)Lead vehicle cutting out
12Y (main lane)750 (curve)Lead vehicle cutting out
13Y (main lane)0 (straight)Passage through tollgate
Table 2. Specifications of test equipment.
RT3002RT-RangeSIRIUSCamera
L1/L2 kinematic GPS with positioning accuracy up to 2 cm RMS(Root Mean Square)V2V and V2X measurements in real time;
Network DGPS for passing correction data between vehicle
Real-time data acquisition;
Synchronized acquisition of video, GPS, and many other sources
1920 × 1080/30 fps resolution (video);
15 megapixels resolution (still)
Table 3. Road conditions during real vehicle test.
CurvatureConditionFriction Coefficient
0.750 mFlat, dry, clean, asphalt1.079
Table 4. Maximum calculation errors per scenario.
Scenario No.Distance to Lead Vehicle (m)Distance to Center of Lane (m)
Theoretical ValueTest ResultErrorTheoretical ValueTest ResultError
1---0.050.160.11
3---0.330.420.09
4---−0.030.070.10
5---0.300.450.15
652.0455.223.180.230.340.11
854.3959.515.110.030.160.13
934.3237.192.87−0.45−0.34−0.11
1023.0221.09−1.930.200.350.15
1127.0129.882.870.030.150.13
1227.8230.302.47−0.48−0.410.07

