Investigating Effects of Landfill Soil Gases on Landfill Elevated Subsurface Temperature

 ,
, 
 ,
, 


Abstract
Featured Application
Abstract
1. Introduction
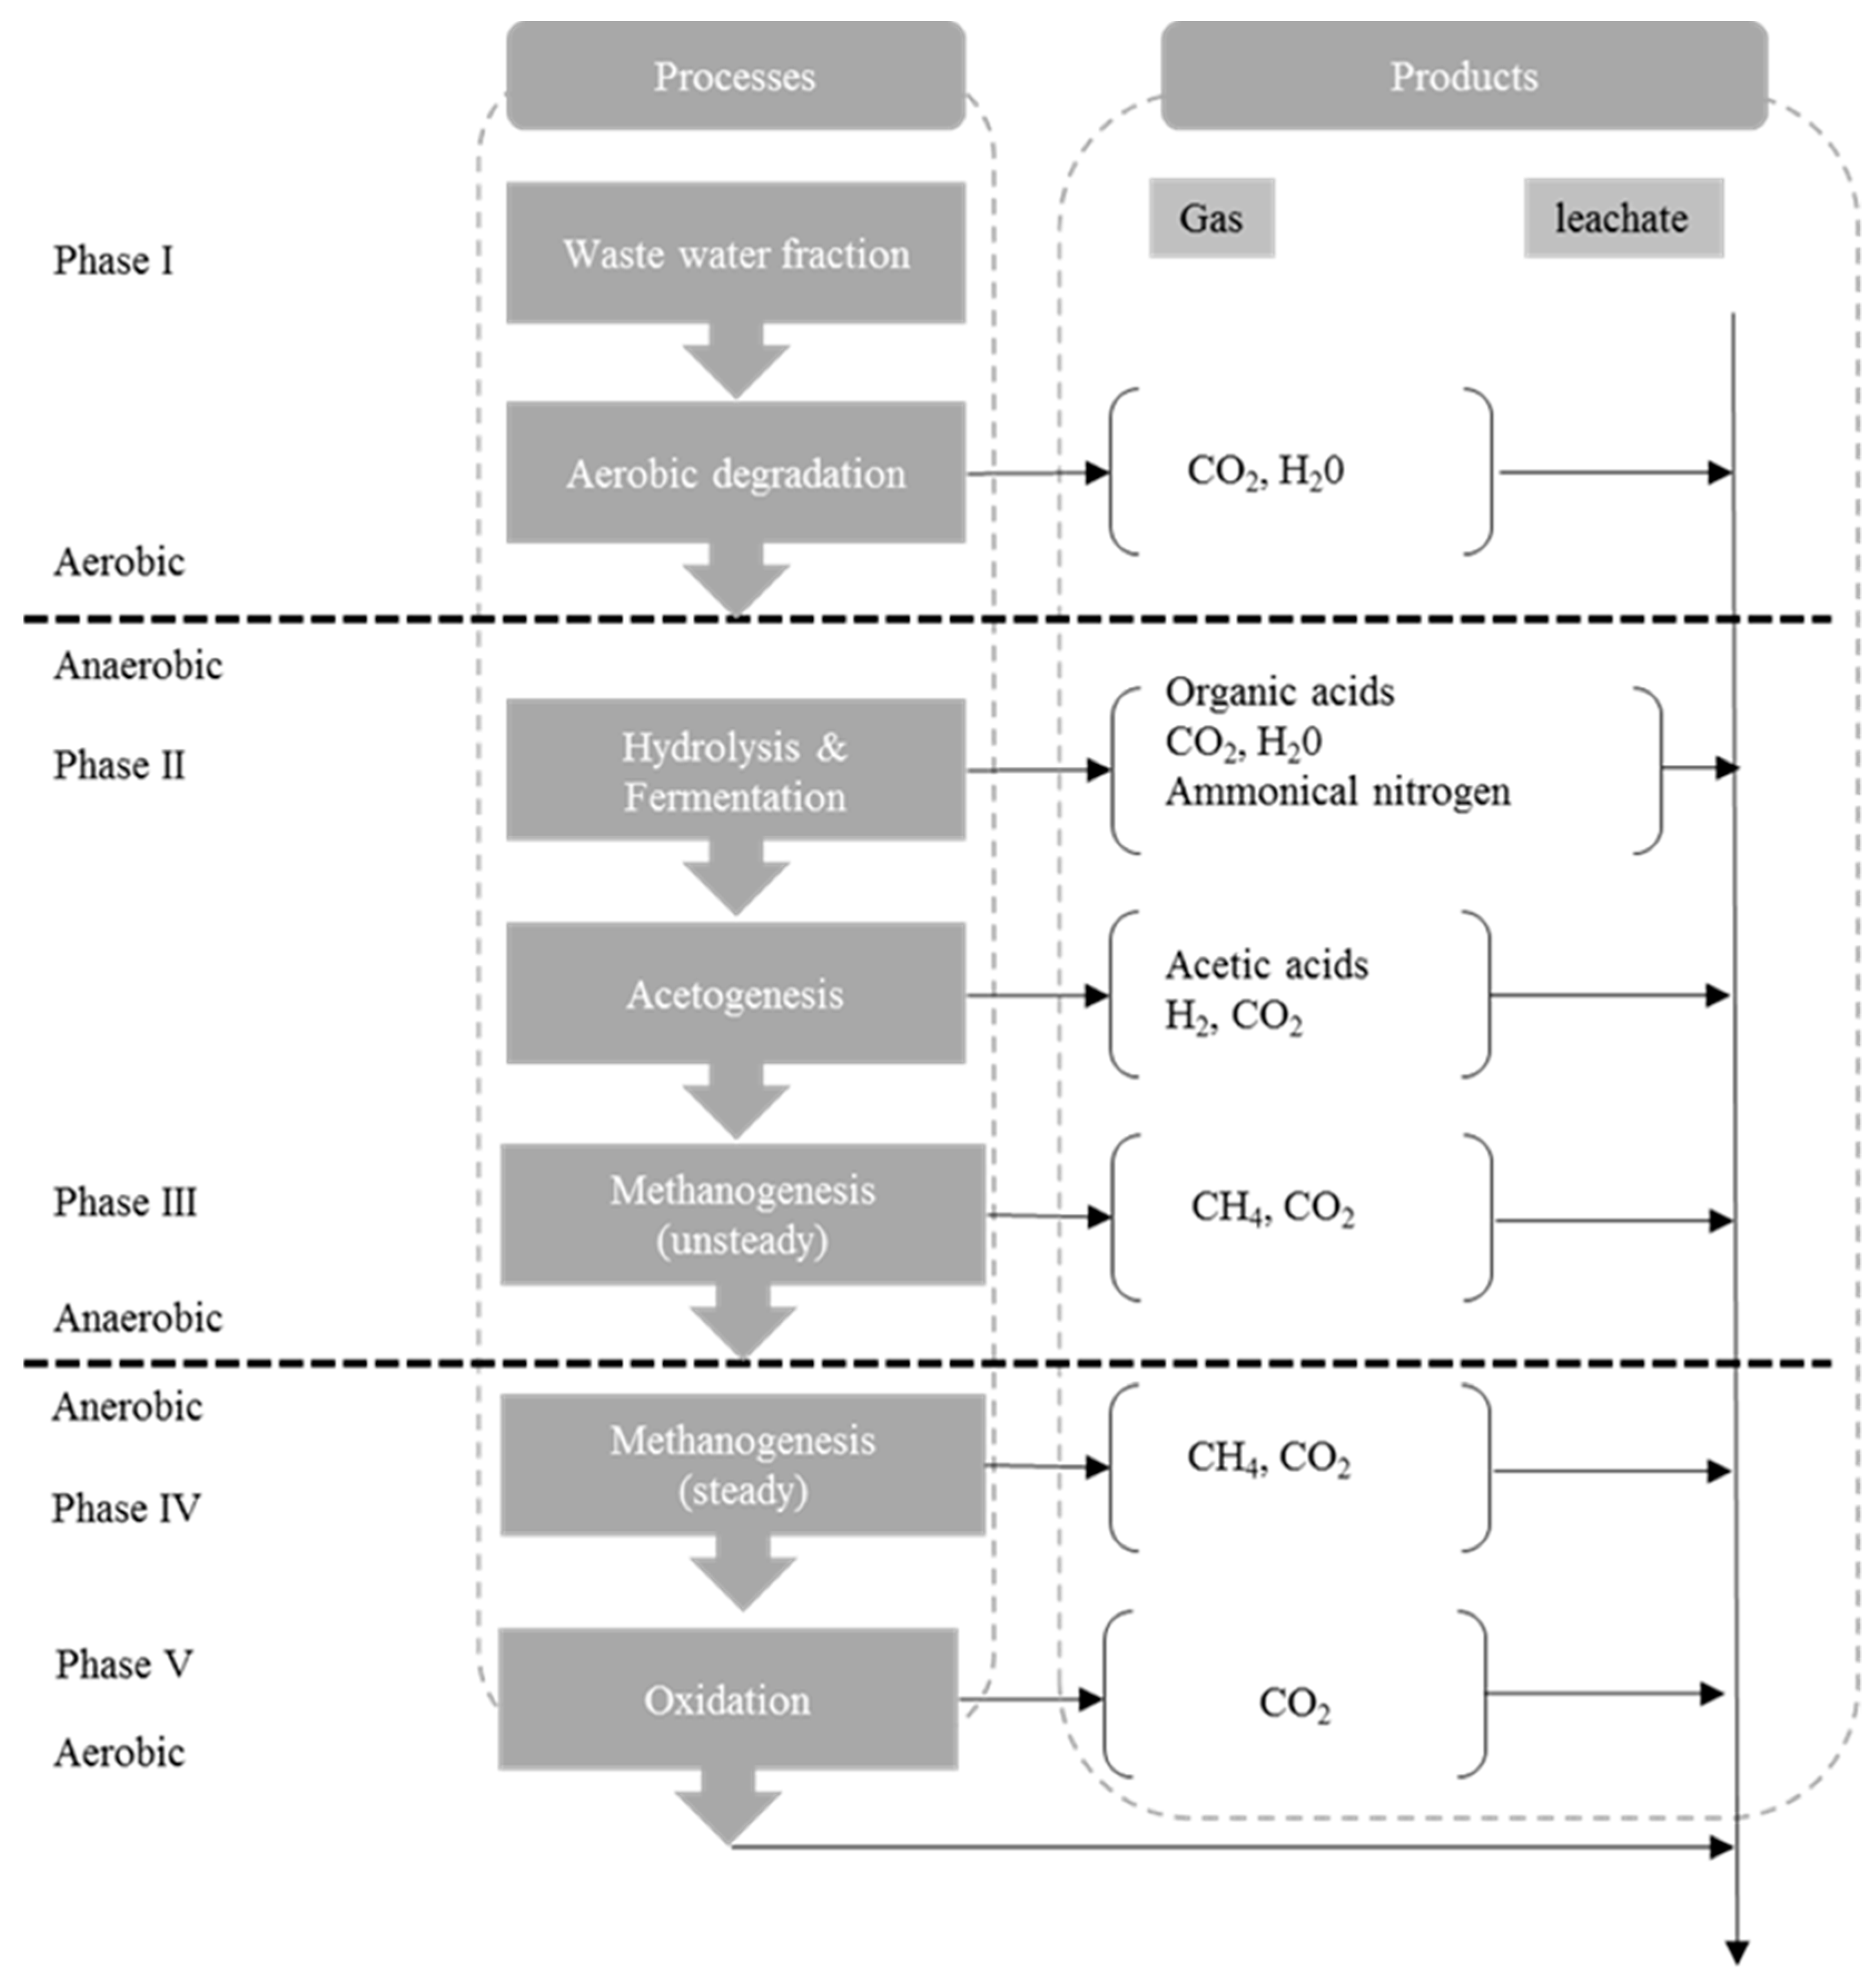
2. Background
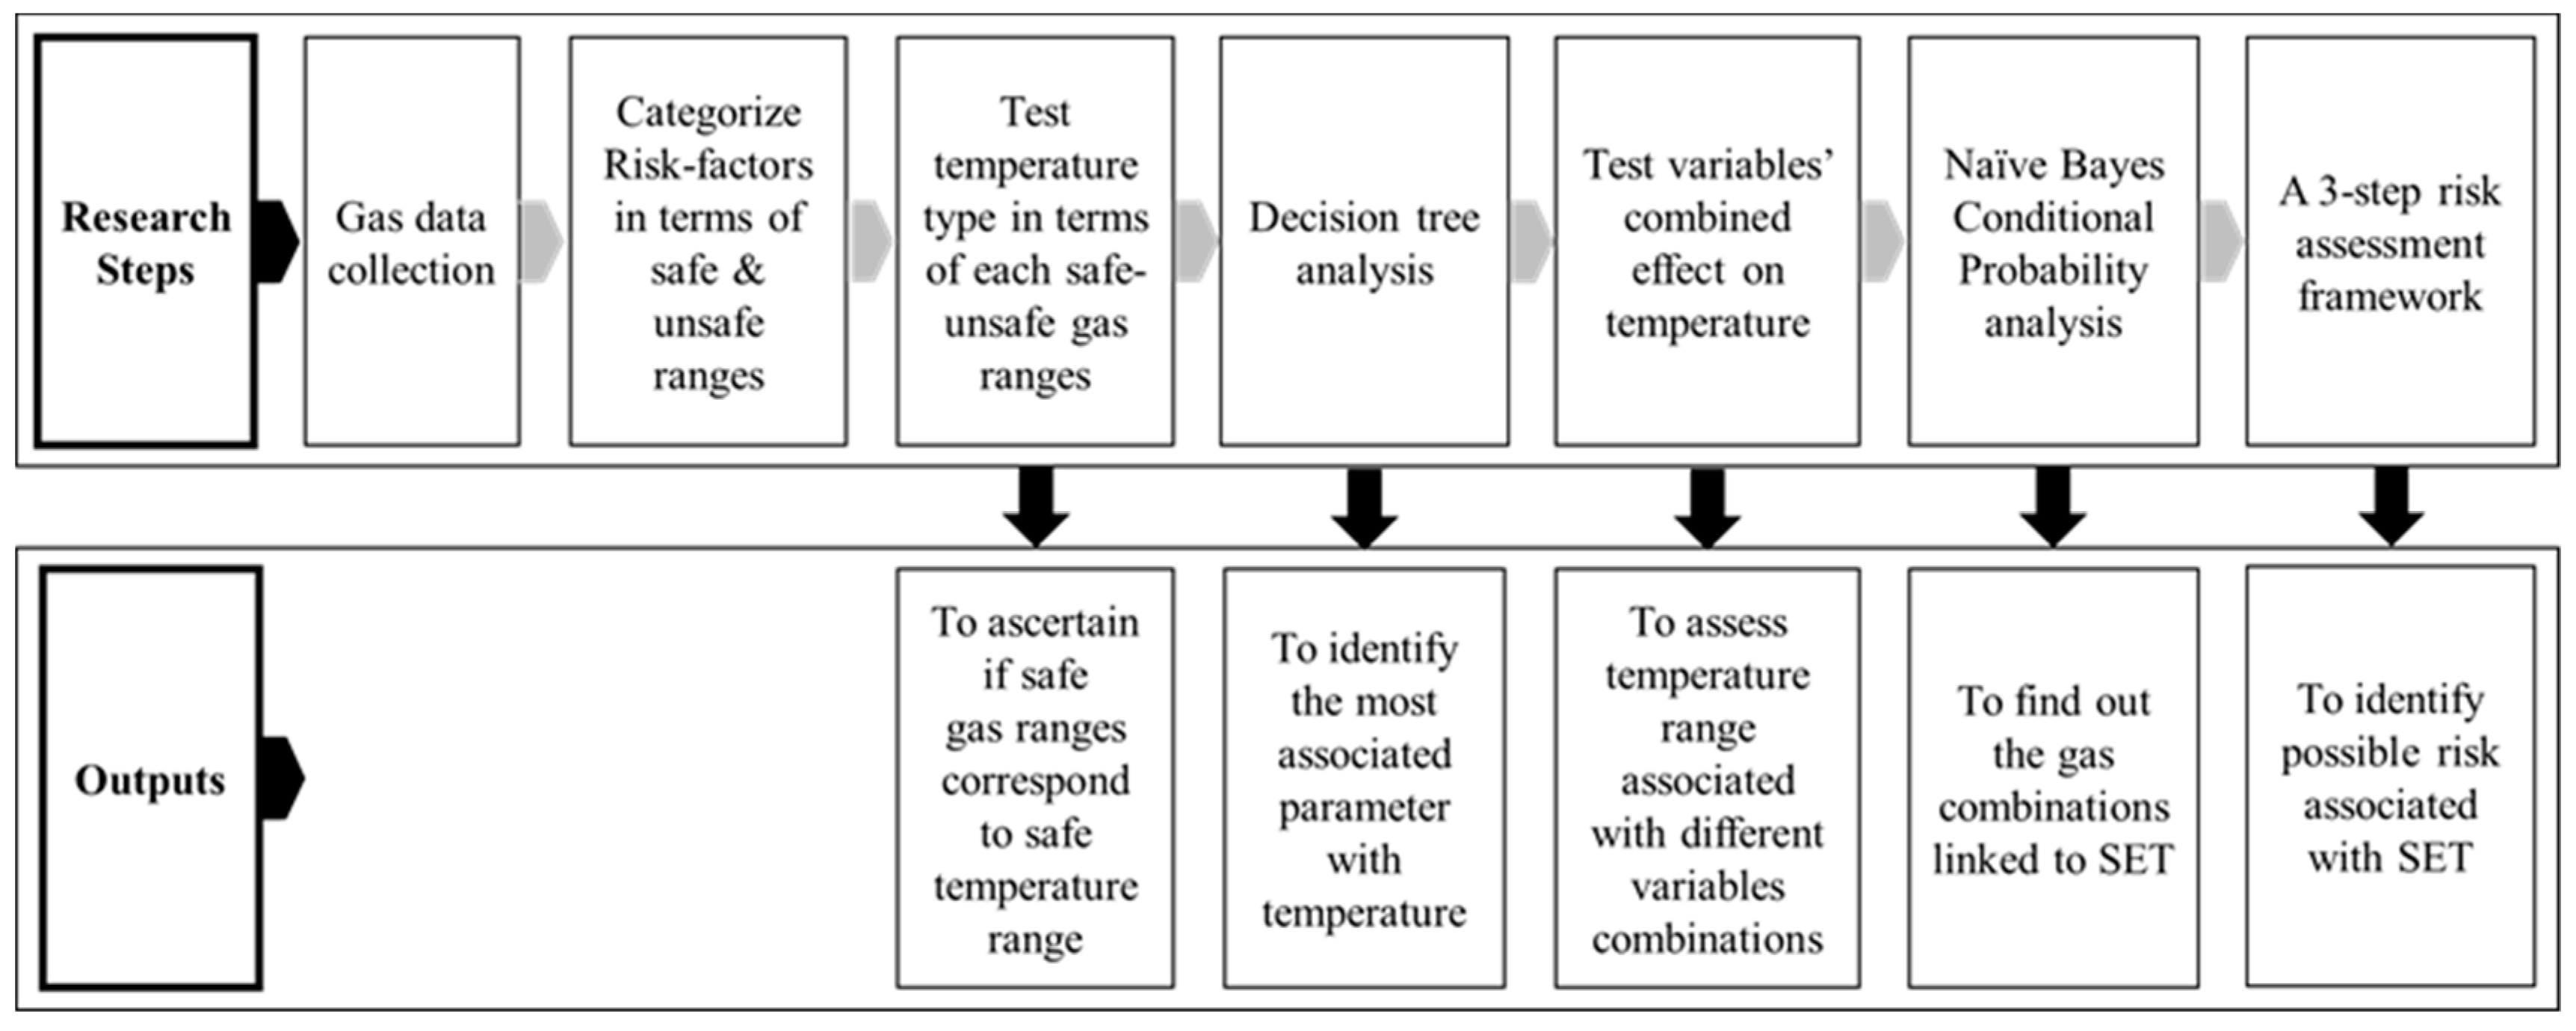
3. Methodology
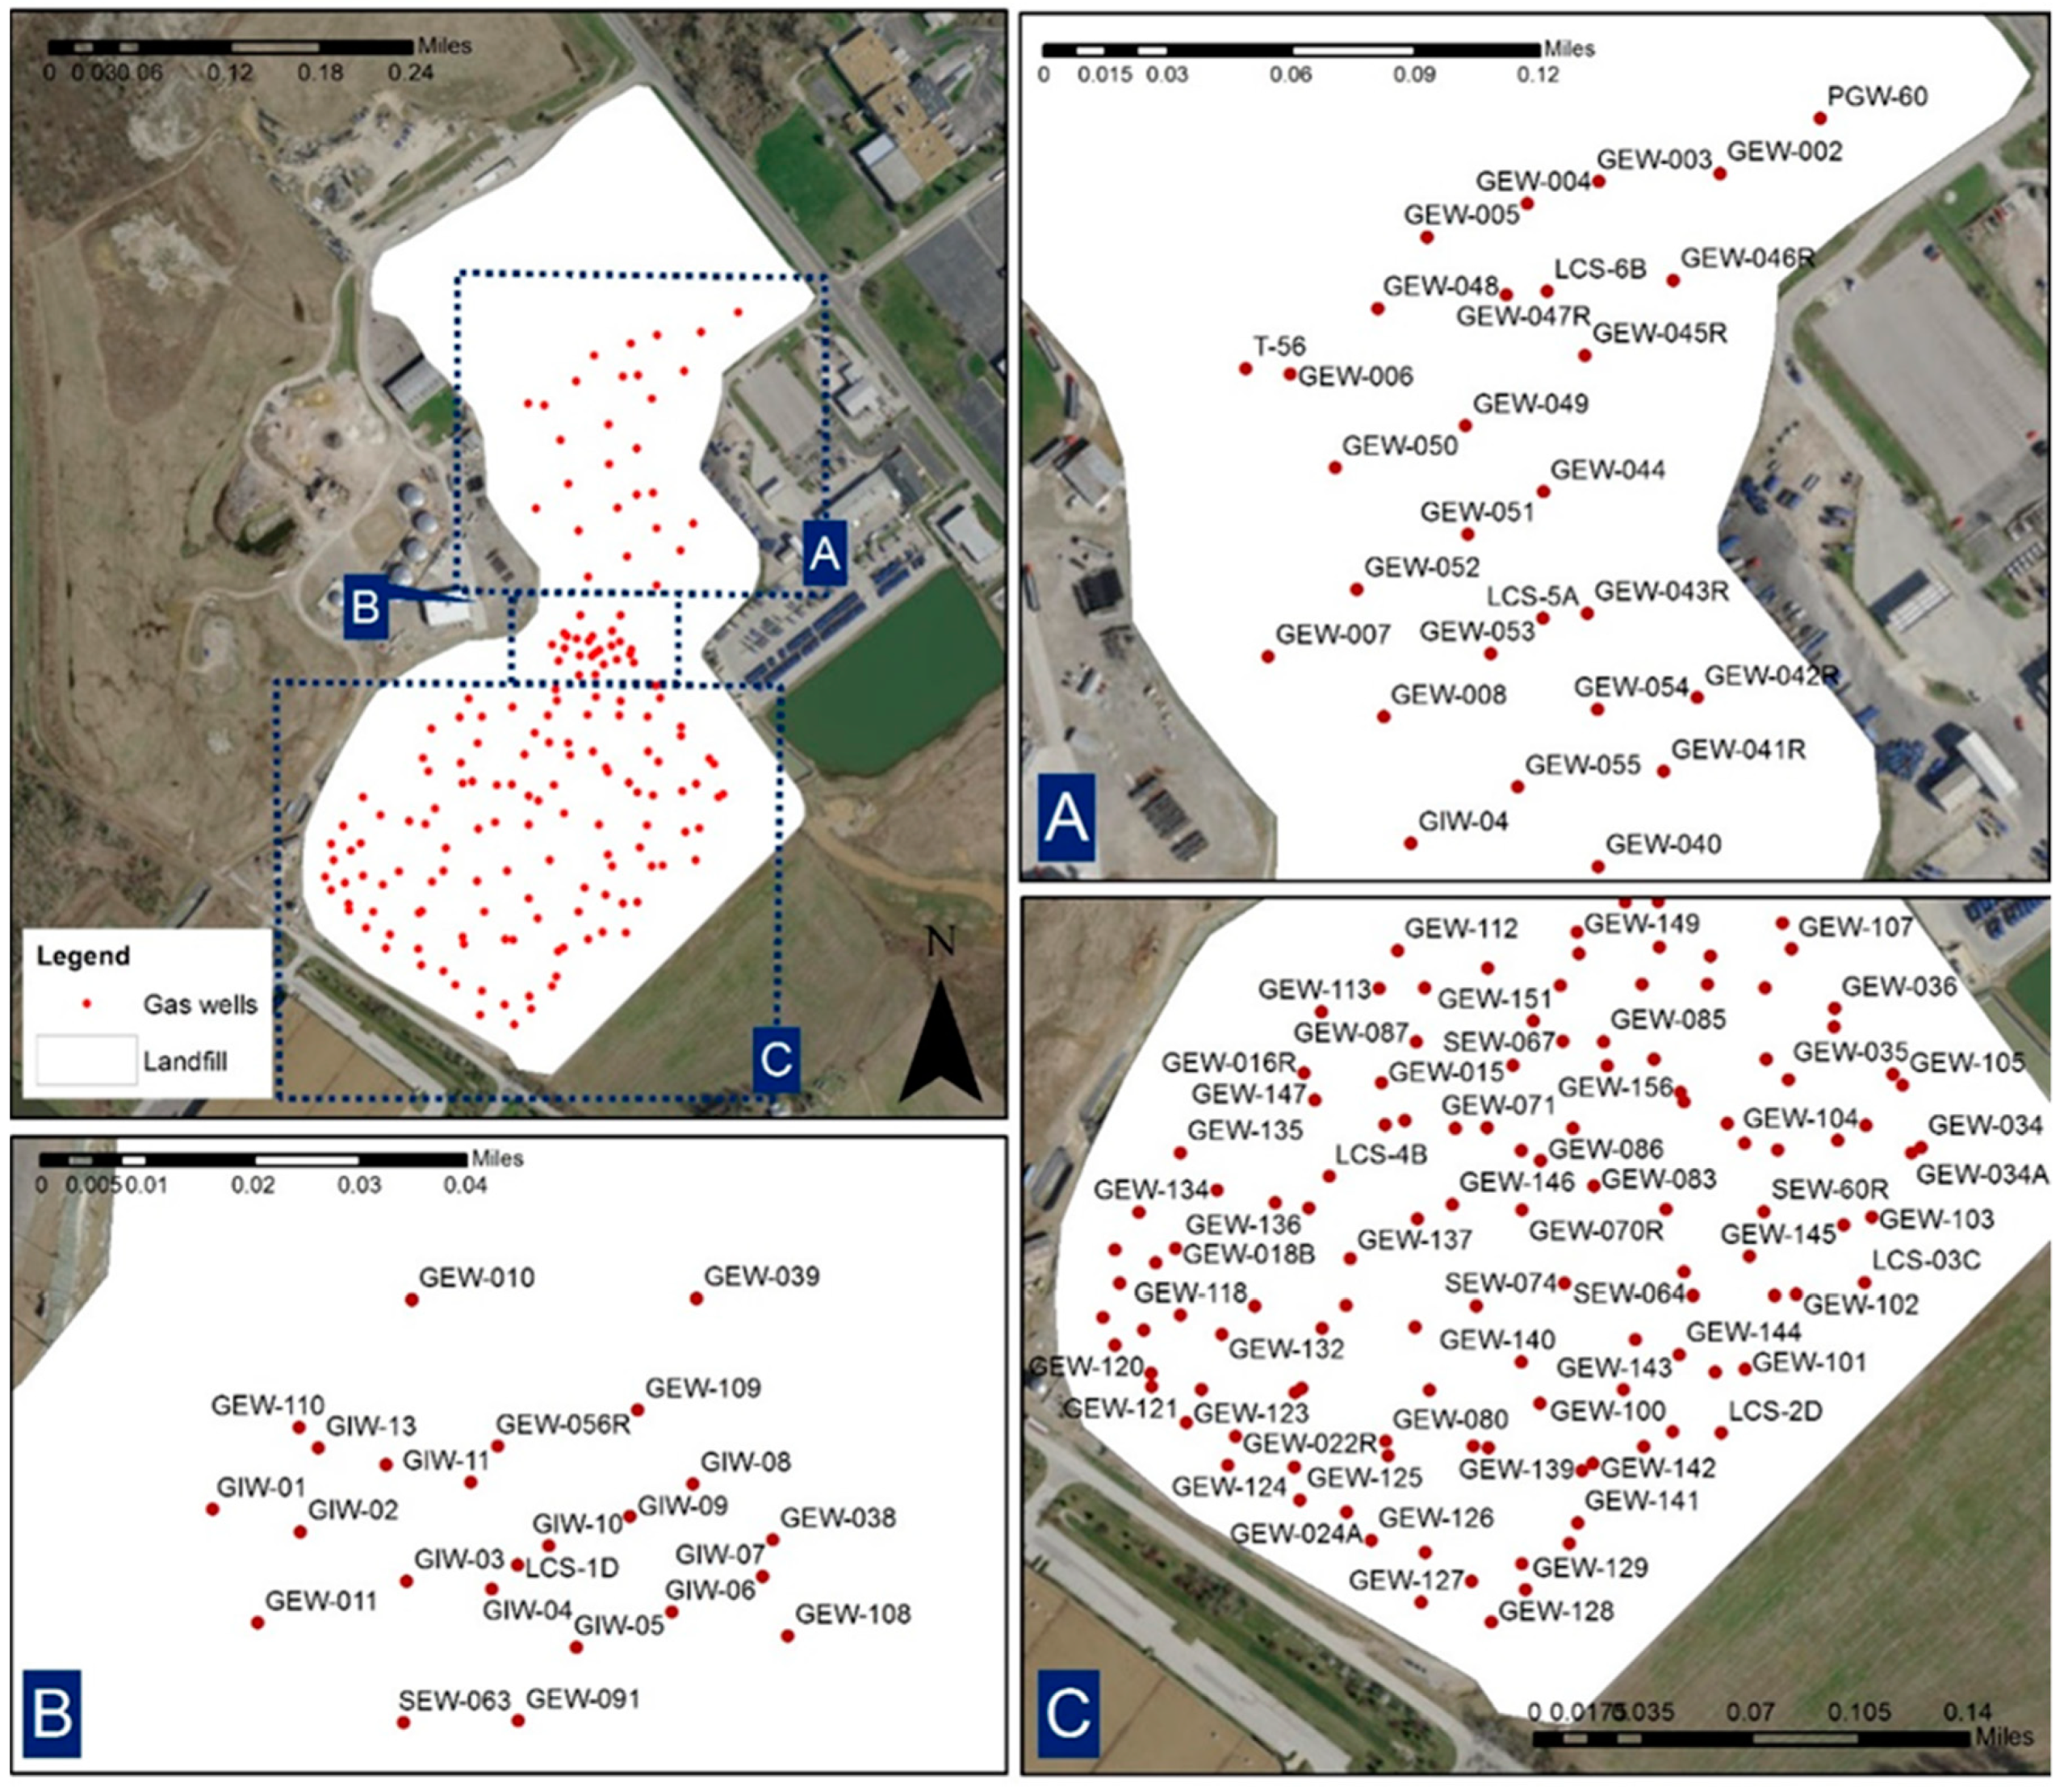
4. Data Collection
5. Results
5.1. Categorization of Variables
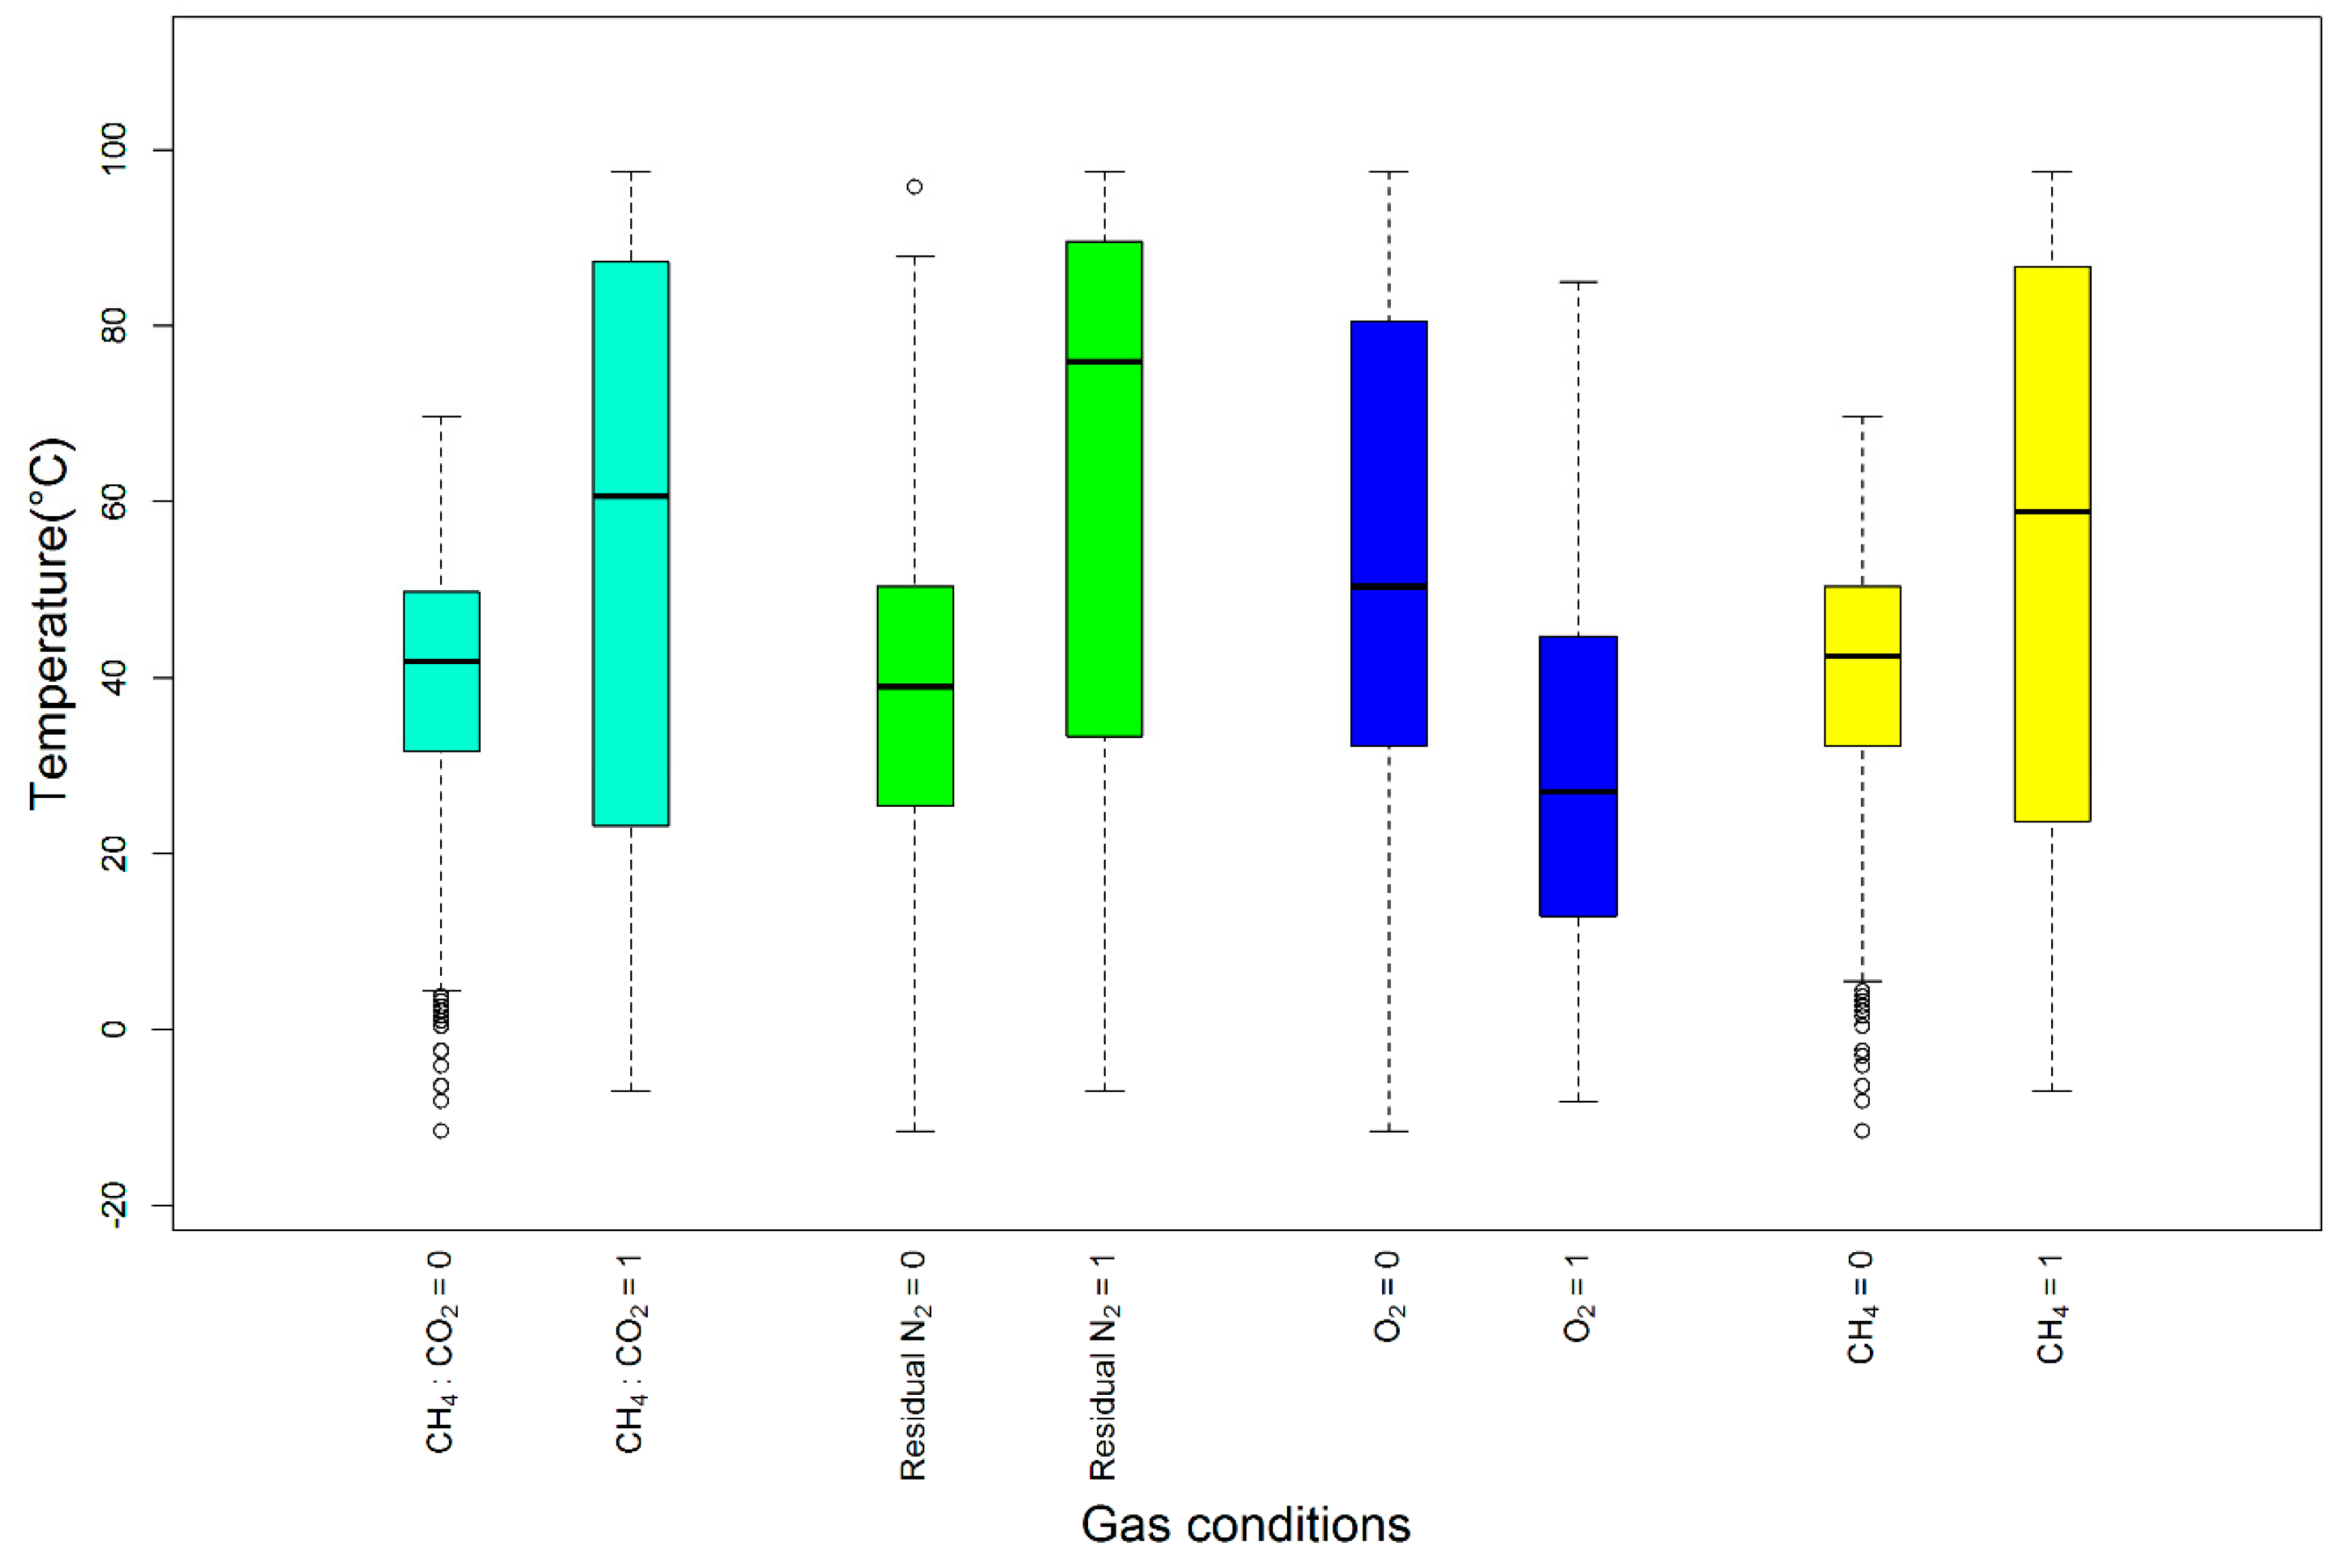
5.2. Testing the Effect of Each Variable on Temperature
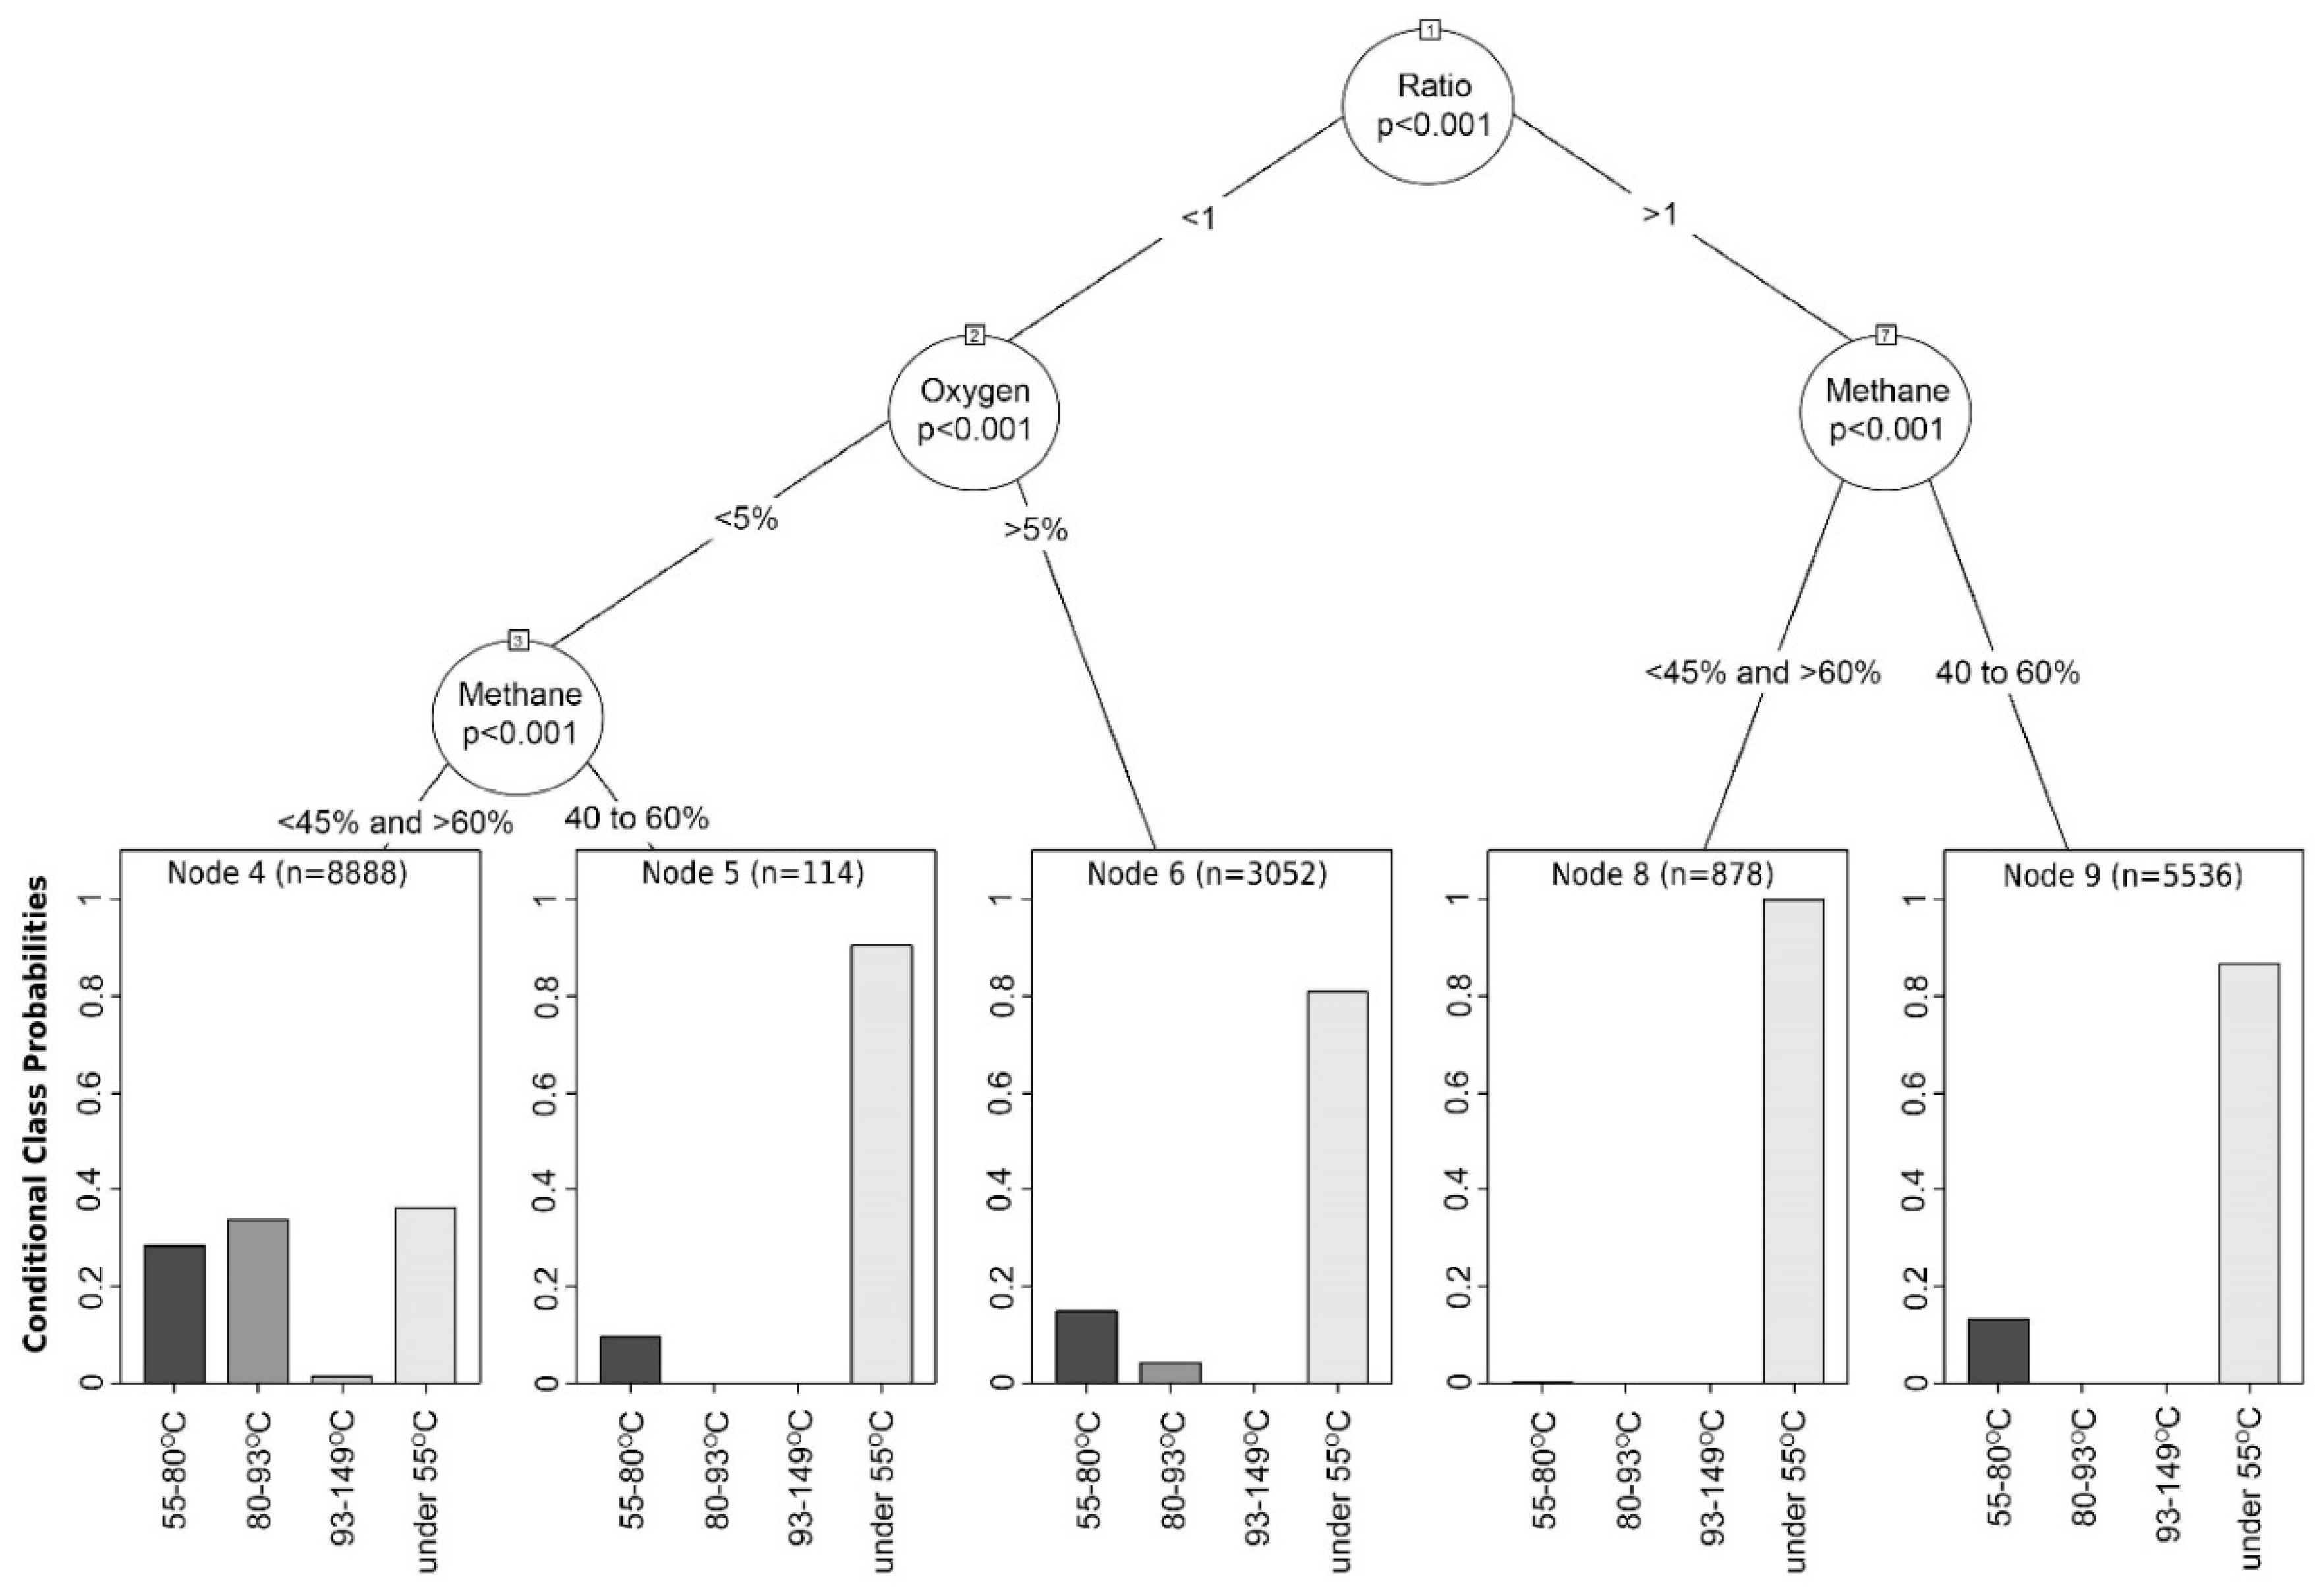
5.3. Decision Tree Analysis
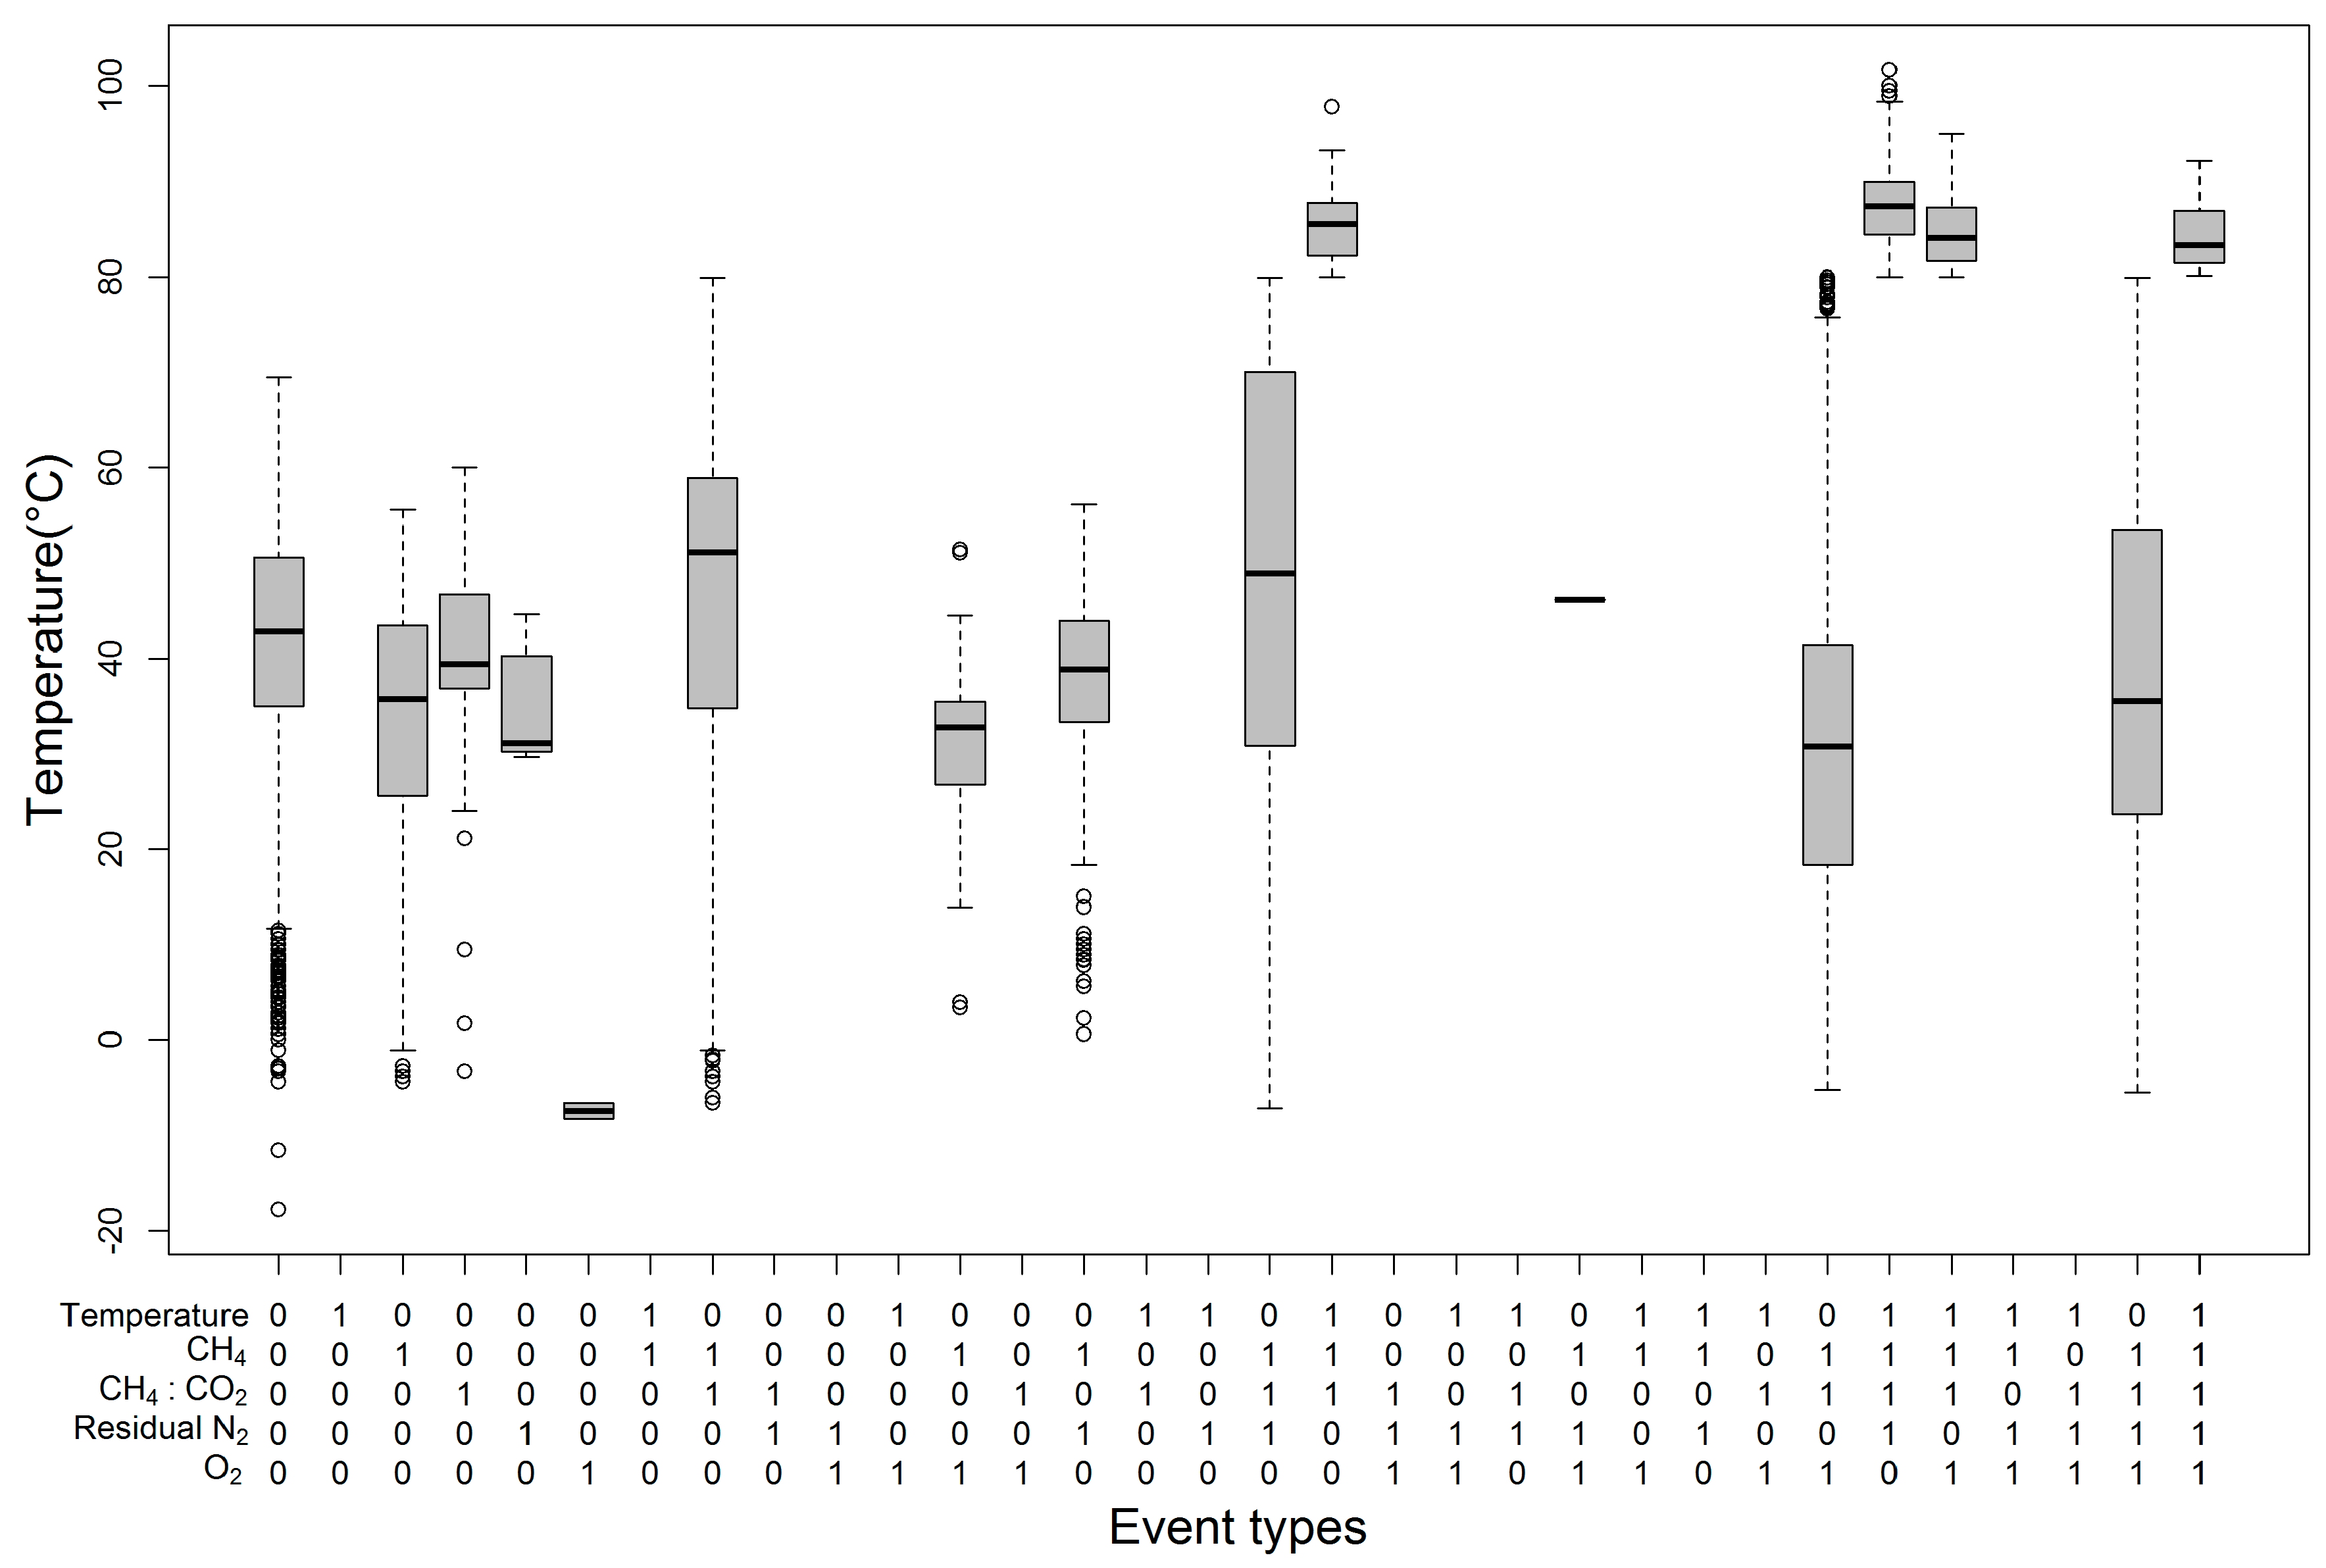
5.4. Effect of Variable Combinations on Temperature
- In four cases, i.e., (temperature = 0, CH4 = 1, CH4:CO2 = 1, O2 = 0, RN2 = 0), (temperature = 0, CH4 = 1, CH4:CO2 = 1, O2 = 0, RN2 = 1), (temperature = 0, CH4 = 1, CH4:CO2 =1, O2 = 1, RN2 = 0), and (temperature = 0, CH4 = 1, CH4:CO2 = 1, O2 = 1, RN2 = 1), the temperature ranges were wide. The widest interquartile temperature ranges were noticed in the events with <45% and >60% CH4, (CH4:CO2) ratio <1, RN2 <20% or >20%, O2 <5% or >5% and temperature <80 °C. These combinations resulted in temperatures ranging from safe to almost unsafe, although some parameters were in the unsafe range.
- The highest positive quartile value for temperature was observed for (temperature = 1, CH4 = 1, CH4:CO2 = 1, O2 = 0, RN2 = 1), which represents events with < 45% and >60% CH4, (CH4:CO2) ratio < 1, RN2 > 20%, O2 < 5%, and temperature >80 °C. Here, the combination resulting in the highest SET did not include an unsafe O2 range, which contradicts the suggested safe O2 range.
- Only one data point was noticed for the (temperature = 0, CH4 = 1, CH4:CO2 = 0, O2 = 1, RN2 = 1) combination, which indicates that the events with < 45% and >60% CH4, (CH4:CO2) ratio > 1, RN2 > 20%, O2 > 5%, and temperature < 80 °C may be rare. This combination requires more historical data to confirm its rare occurrence.
- Four of the combinations (temperature = 1, CH4 = 1, CH4:CO2 = 1, O2 = 0, RN2 = 0), (temperature = 1, CH4 = 1, CH4:CO2 = 1, O2 = 0, RN2 = 1), (temperature = 1, CH4 = 1, CH4:CO2 = 1, O2 = 1, RN2 = 0), (temperature = 1, CH4 = 1, CH4:CO2 = 1, O2 = 1, RN2 = 1) representing events with < 45% and >60% CH4, (CH4:CO2) ratio < 1, RN2 < 20% or > 20%, O2 < 5% or >5%, and temperature > 80 °C showed temperatures higher than 176 °F, whereas the other combinations produced safe temperatures (under 80 °C) with a probability of more than 75%.
- Similar gas parameter combinations were noticed in three combination pairs. For example, the (temperature = 0, CH4 = 1, CH4:CO2 = 1, O2 = 0, RN2 = 0) and (temperature = 1, CH4 = 1, CH4:CO2 = 1, O2 = 0, RN2 = 0) combinations demonstrate same gas combinations with temperature in both safe and unsafe ranges, which indicates that temperature is insignificantly affected by gas parameters in the gas combination of (CH4 = 1, CH4:CO2 = 1, O2 = 0, RN2 = 0). We observed a similar outcome for the gas combination of (CH4 = 1, CH4:CO2 = 1, O2 = 0, RN2 = 1) and (CH4 = 1, CH4:CO2 = 1, O2 = 1, RN2 = 0). There might be other missing variables that are triggering the SET with the same gas combinations. Therefore, insignificant impacts on temperature were observed in events with gas combinations such as: (< 45% and >60% CH4, (CH4:CO2) ratio < 1, RN2 < 20%, O2 < 5%); (< 45% and >60% CH4, (CH4:CO2) ratio < 1, RN2 > 20%, O2 < 5%); (< 45% and >60% CH4, (CH4:CO2) ratio < 1, RN2 < 20%, O2 > 5%). In their landfill study, Jafari et al. (2017a, b) reported a trend among numerous gas-extraction wells in which a decreasing CH4-to-CO2 ratio occurred prior to an increase in the wellhead temperature. A decreasing CH4-to-CO2 ratio and a CH4 level above the recommended range were noticed in these three combination pairs, which indicates that the conditions of RN2 and O2 do not govern the increase in temperature. Rather, other possible gases such as H2 or CO may control the situation.
- Moreover, no boxplot was created for seventeen other combinations due to the absence of these combinations in the sample datapoints, which implies that these events do not occur or are extremely rare. Increasing the volume of sample data from recent years could firmly establish the truth of this statement.
6. Discussions
- Unsafe temperature events have occurred more in the unsafe range for CH4, the CH4-to-CO2 ratio, and RN2, but not for O2. The combination associated with the highest SET did not include an unsafe O2 range, a finding which contradicts the suggested safe O2 range.
- The conditional inference tree algorithm shows that the CH4-to-CO2 ratio of the four parameters has the strongest association with temperature. Ratios less than 1, O2 concentrations less than 5% and CH4 <45% and >60% resulted in the highest probability of events ranging from 80 to 149 °C. However, the safe O2 range was not associated with a safe temperature range, which is also consistent with the observation above.
- Some combinations of gas parameters, i.e., (CH4 = 1, CH4:CO2 = 1, O2 = 0, RN2 = 0), (CH4 = 1, CH4:CO2 = 1, O2 = 0, RN2 = 1), and (CH4 = 1, CH4:CO2 = 1, O2 = 1, RN2 = 0) have an insignificant effect on temperature. This implies that there are other confounding variables affecting these three combinations.
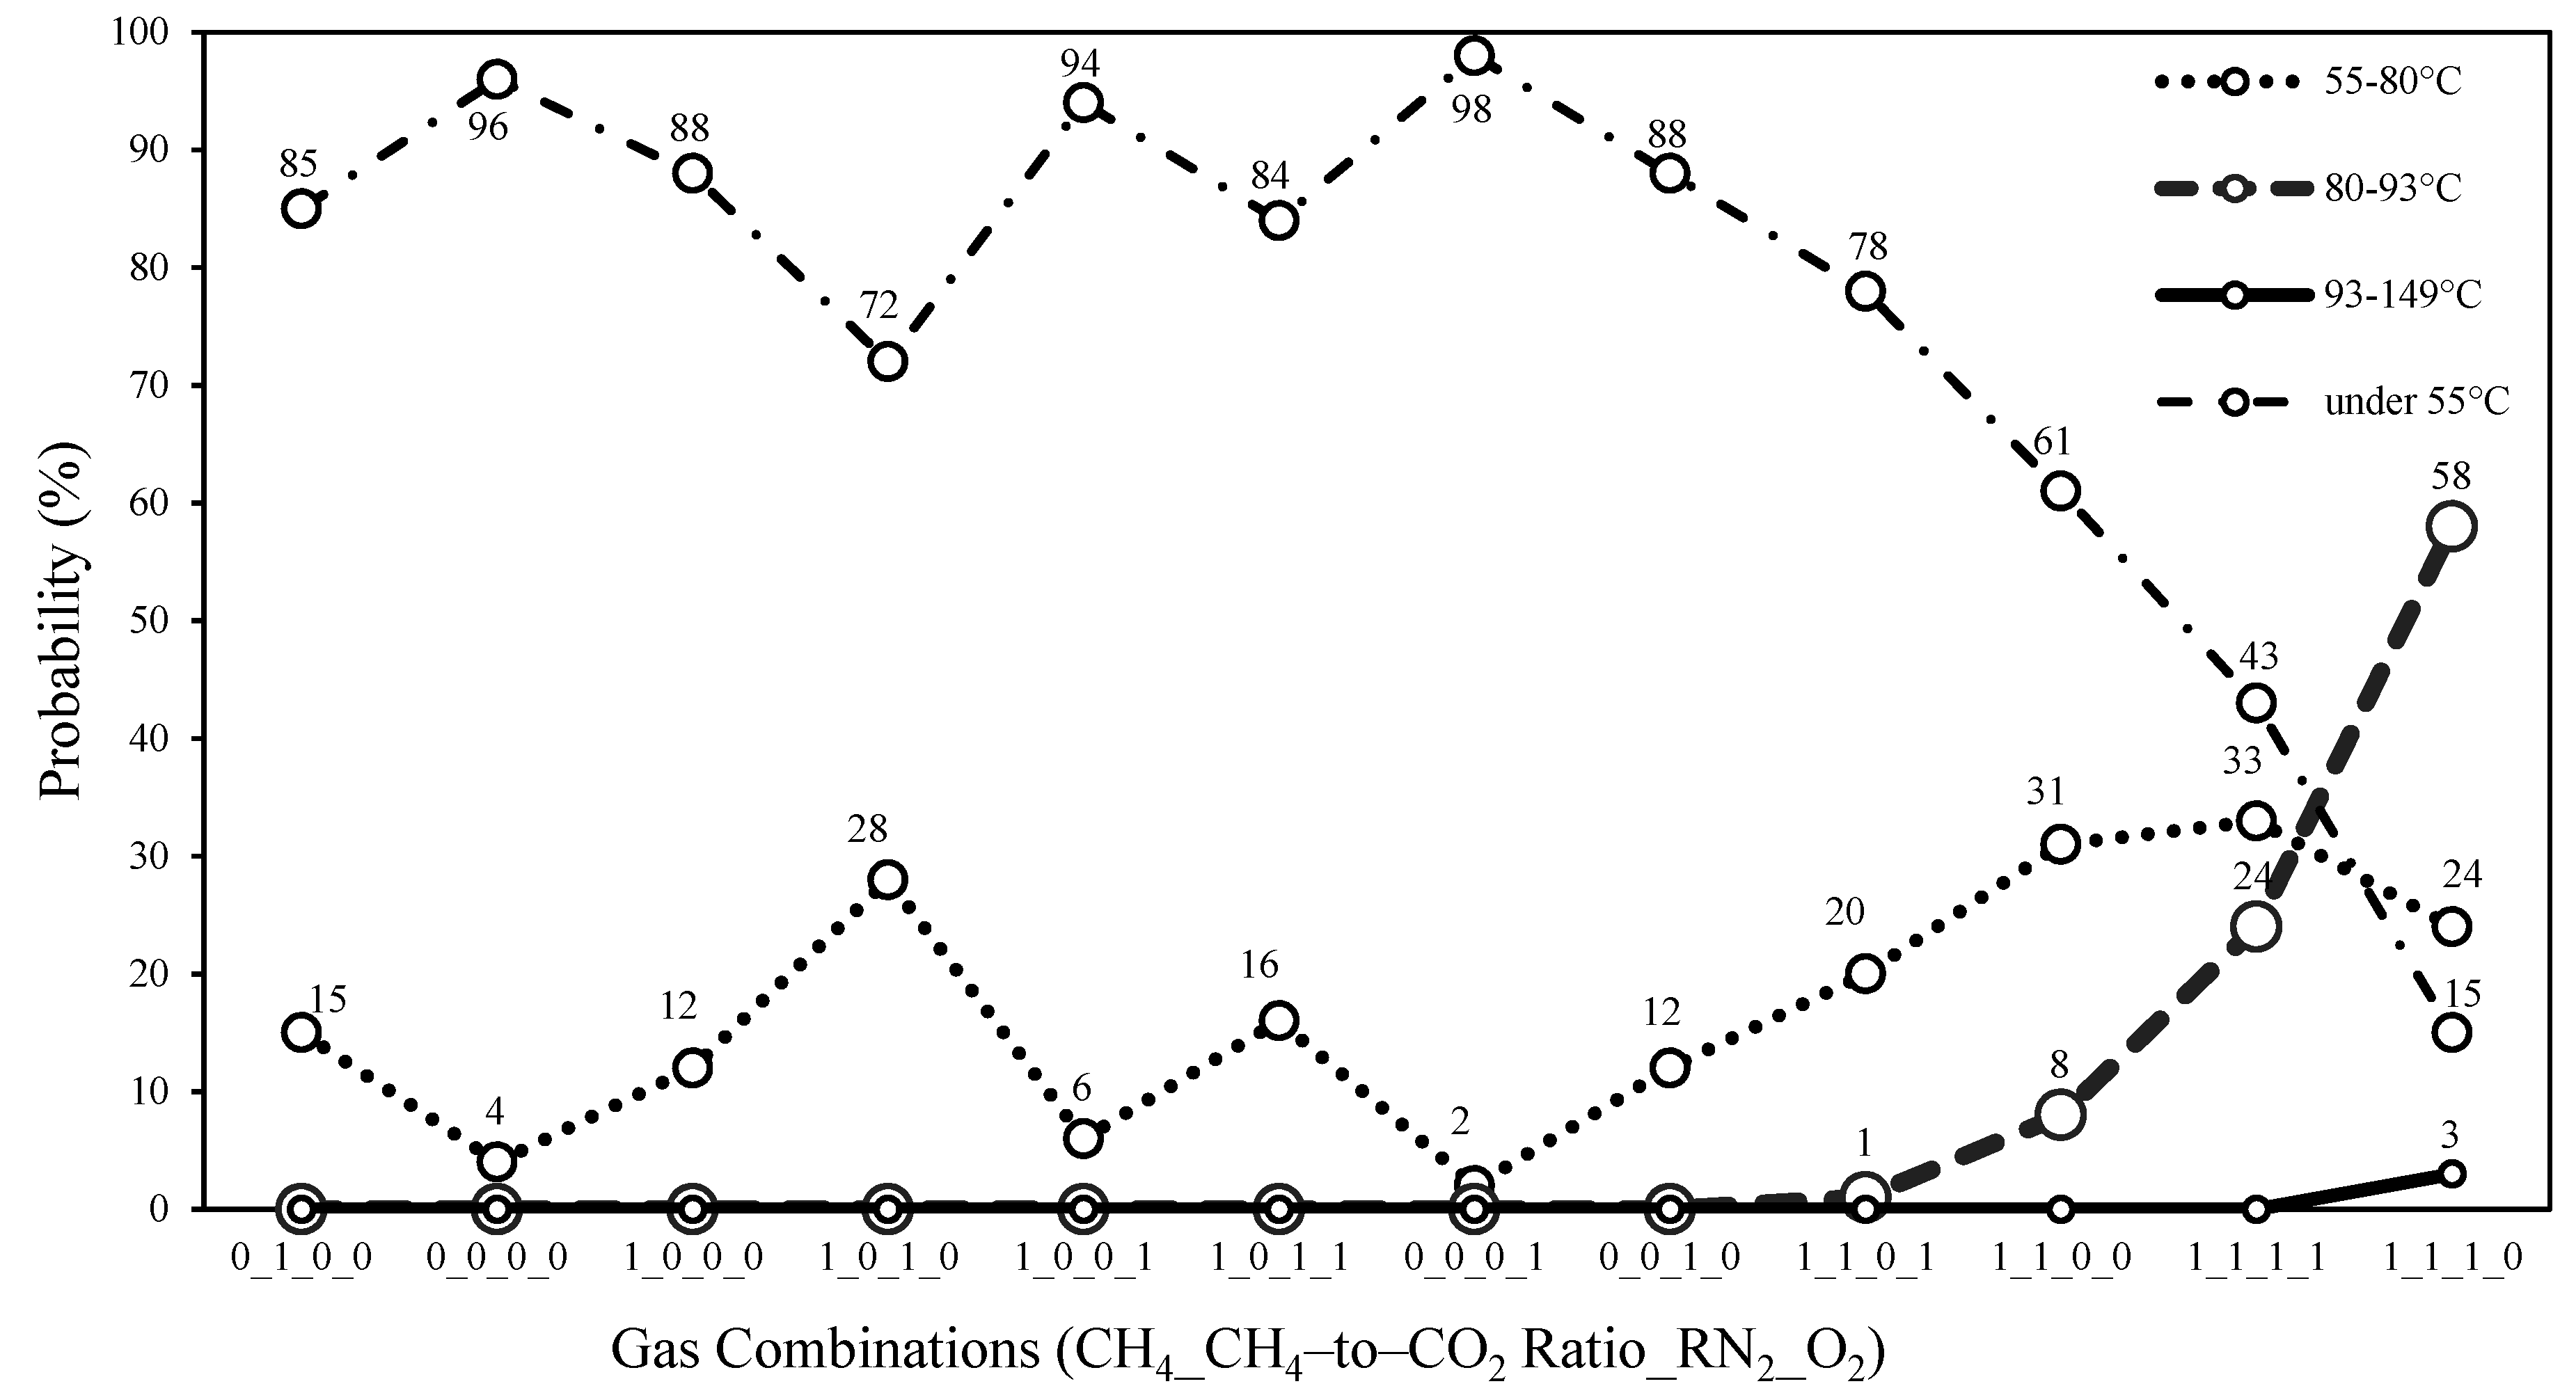
- Only the (CH4 = 1, CH4:CO2 = 1, O2 = 0, RN2 = 1) combination shows a high occurrence in the 93–149 °C range based on the naïve Bayes conditional probability, whereas a gradual upward trend is observed for the 80–93 °C range in the four combinations of (CH4 = 1, CH4:CO2 = 1, O2 = 1, RN2 = 0), (CH4 = 1, CH4:CO2 = 1, O2 = 0, RN2 = 0), (CH4 = 1, CH4:CO2 = 1, O2 = 1, RN2 = 1), and (CH4 = 1, CH4:CO2 = 1, O2 = 0, RN2 = 1). Using the conditional probability results, the gas combinations have been summarized according to their potential risk levels (low, moderate, or high) with respect to SETs.
- The unsafe ranges of the gas parameters are not always associated with high temperature ranges, but rather different combinations of parameters.
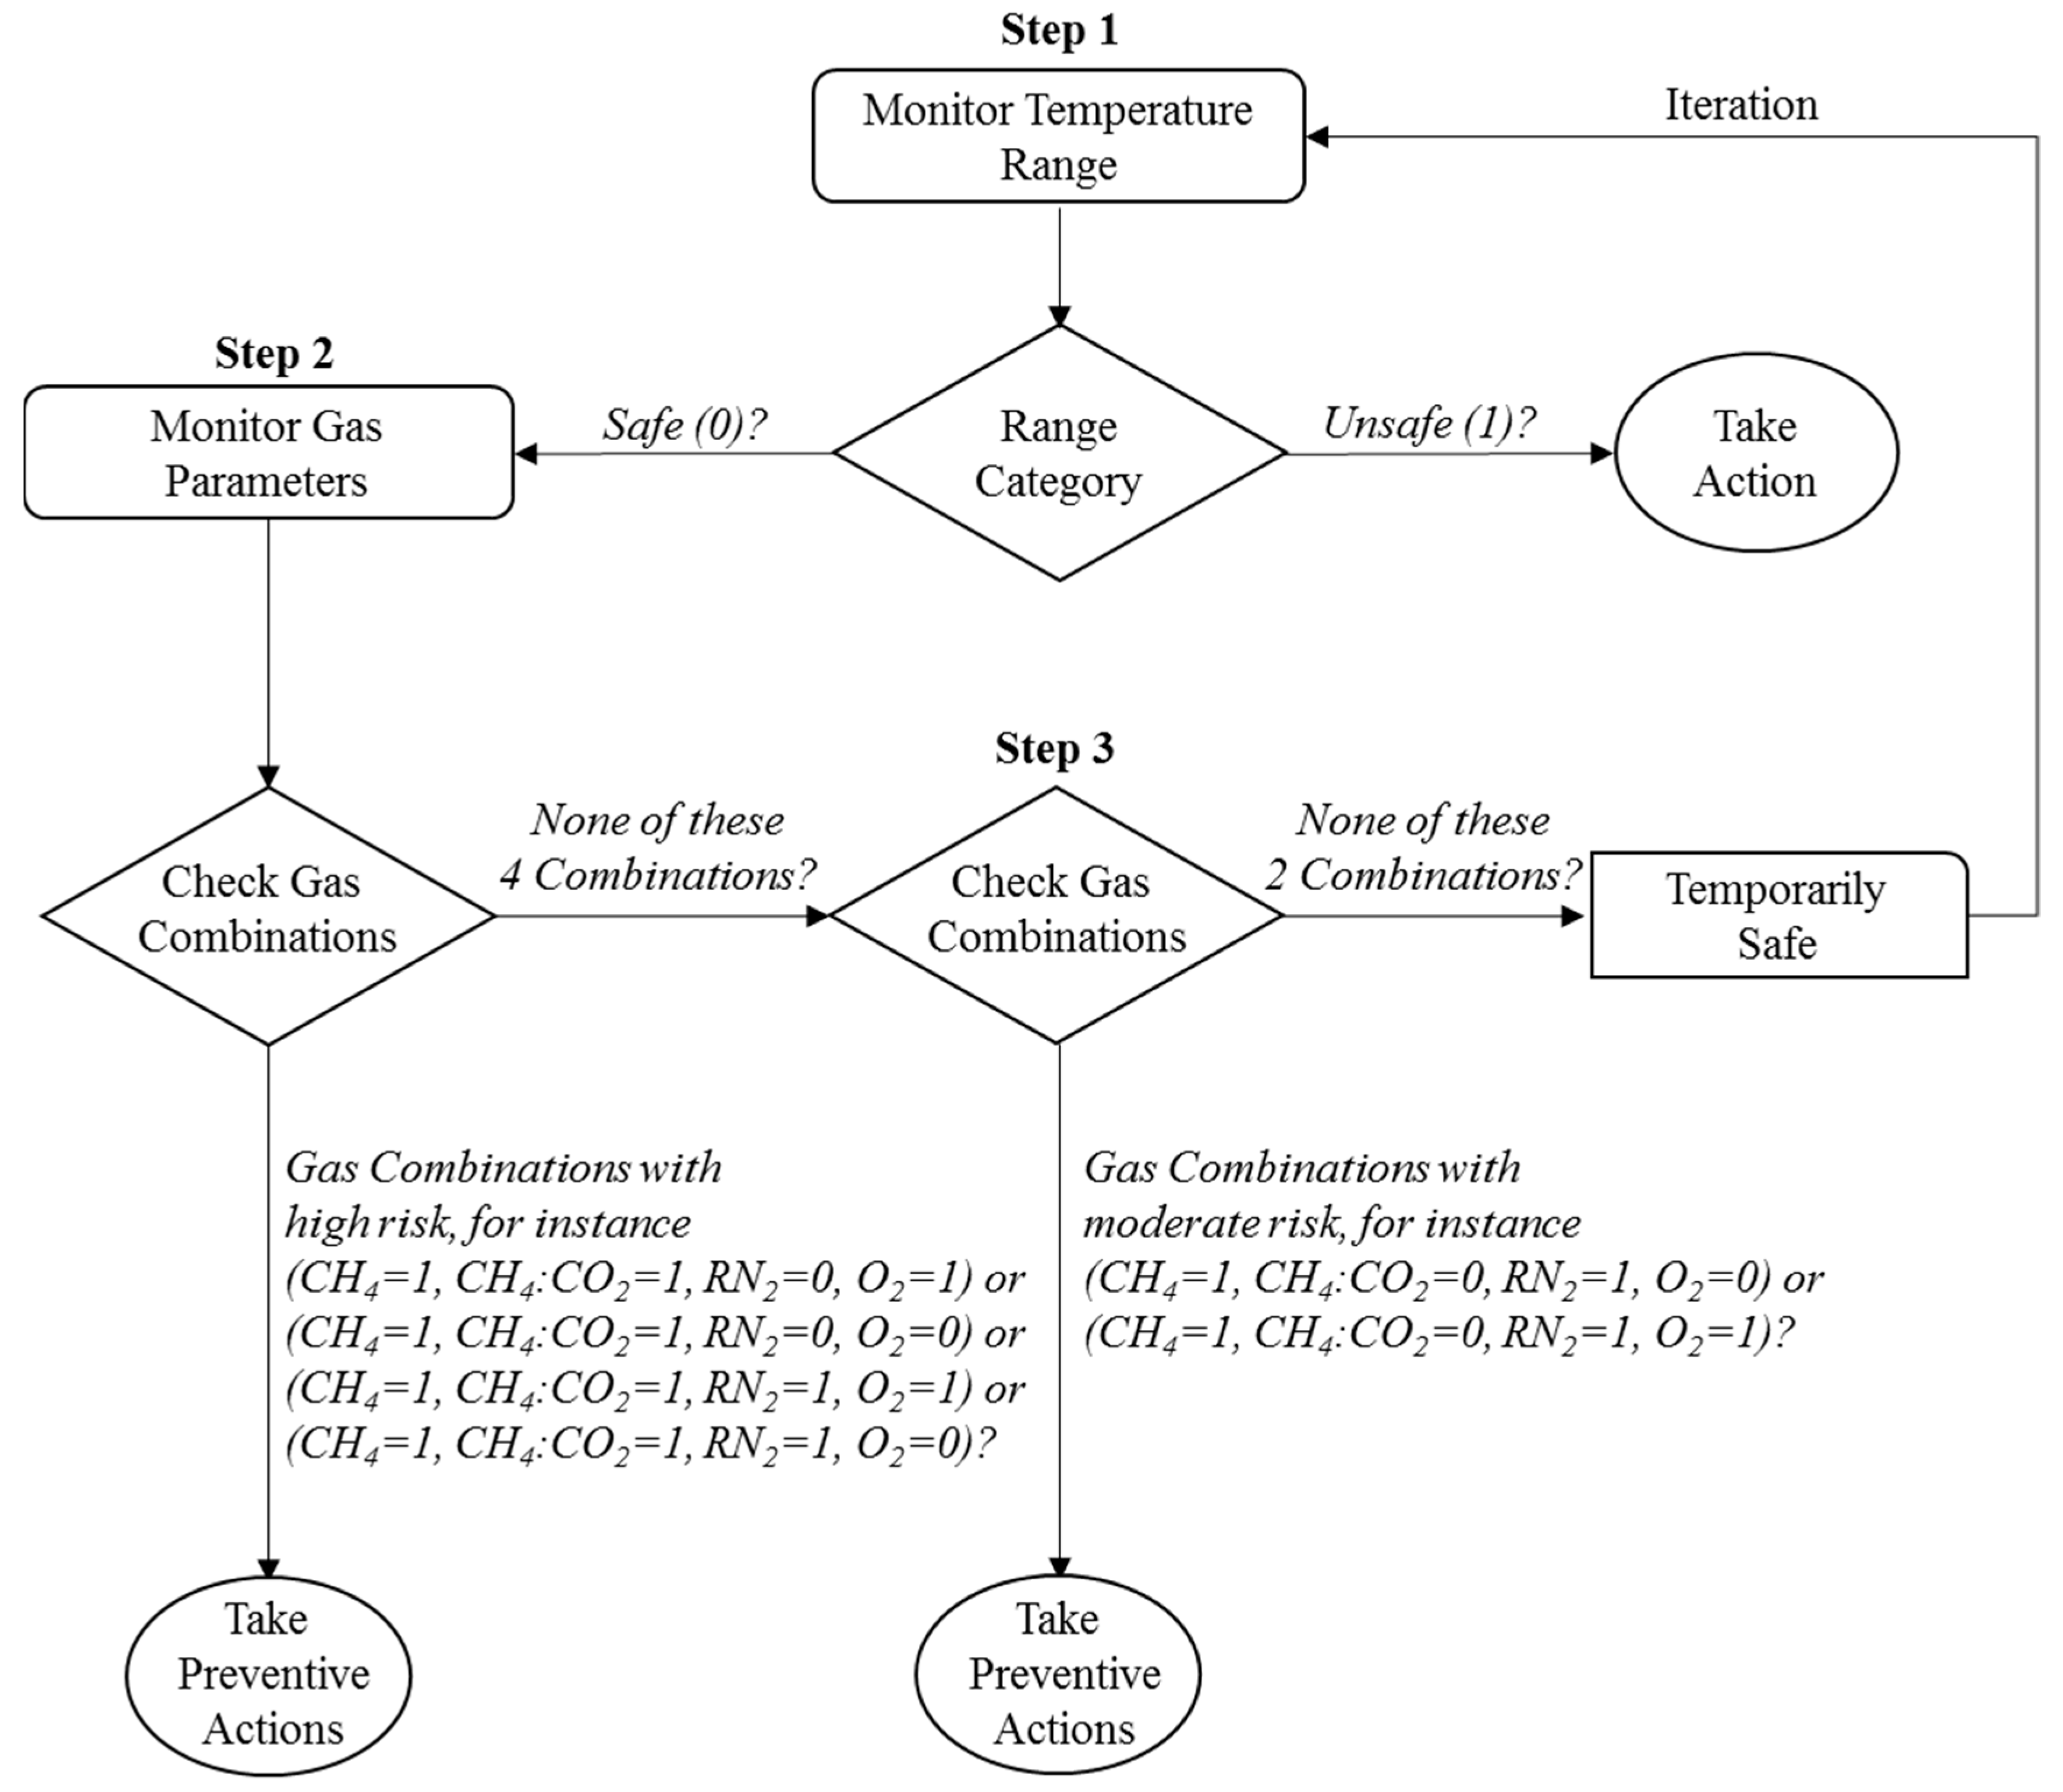
- A three-step procedure can be followed to evaluate the risk of a landfill subsurface fire. The diagram in Figure 10 provides a general idea of this step-by-step procedure for preventing subsurface fire incidents. Step 1 is to check the temperature to determine if it falls within the unsafe range, which would require that other parameters be controlled to bring the temperatures into the safe range. Otherwise, landfill personnel should proceed to step 2 which involves checking the gas combinations. Other preventive measures should be considered if one of the four combinations of (CH4 = 1, CH4:CO2 = 1, O2 = 1, RN2 = 0), (CH4 = 1, CH4:CO2 = 1, O2 = 0, RN2 = 0), (CH4 = 1, CH4:CO2 = 1, O2 = 1, RN2 = 1) and (CH4 = 1, CH4:CO2 = 1, O2 = 0, RN2 = 1) occurs. Step 3 proposes to check gas-wells showing similar combinations of (CH4 = 1, CH4:CO2 = 0, O2 = 0, RN2 = 1) and (CH4 = 1, CH4:CO2 = 0, O2 = 1, RN2 = 1) that correspond to a medium risk, and then monitor these gas-well locations more carefully or more often to ensure that they do not become one of the riskiest combinations. Landfill authorities can repeat this three-step action plan as part of their regular monitoring practices of the gas collection system.
7. Conclusions
Author Contributions
Funding
Conflicts of Interest
References
- EPA, USA. Advancing Sustainable Materials Management: Facts and Figures. Available online: https://www.epa.gov/facts-and-figures-about-materials-waste-and-recycling/advancing-sustainable-materials-management-0 (accessed on 15 August 2019).
- EPA, USA. Municipal Solid Waste in the United States: 2011 Facts and Figures; EPA: Washington, DC, USA, 2013.
- EPA, USA. Municipal Solid Waste in the United States: 1999 Facts and Figures; EPA: Washington, DC, USA, 2001.
- Moqbel, S. Characterizing Spontaneous Fires in Landfills. Ph.D. Thesis, University of Central Florida, Orlando, FL, USA, 2009. [Google Scholar]
- Moqbel, S.; Reinhart, D. Spontaneous Landfill Fires: Investigation and Simulation. 2017. Available online: https://jeaconf.org/UploadedFiles/Document/f1aeb43d-e221-4357-9fde-3eb83e2c08f7.pdf (accessed on 1 August 2018).
- System, N.F.I.R. National Fire Incident Reporting System Data: 2004–2010. Available online: https://www.nfirs.fema.gov/ (accessed on 1 August 2018).
- Powell, J.T.; Townsend, T.G.; Zimmerman, J.B. Estimates of solid waste disposal rates and reduction targets for landfill gas emissions. Nat. Clim. Chang. 2016, 6, 162–165. [Google Scholar] [CrossRef]
- Foss-Smith, P. Understanding Landfill Fires. Available online: https://waste-management-world.com/a/understanding-landfill-fires (accessed on 2 August 2018).
- Bates, M. Managing Landfill Site Fires in Northamptonshire; SITA-Sustainable Wastes Management Centre, University College Northampton: Northamptonshire, UK, 2004; Volume 63, pp. 1635–1641. [Google Scholar]
- Martin, J.W.; Stark, T.D.; Thalhamer, T.; Gerbasi-Graf, G.T.; Gortner, R.E. Detection of aluminum waste reactions and waste fires. J. Hazard. Toxic Radioact. Waste 2012, 17, 164–174. [Google Scholar] [CrossRef]
- Nammari, D.R.; Hogland, W.; Marques, M.; Nimmermark, S.; Moutavtchi, V. Emissions from a controlled fire in municipal solid waste bales. Waste Manag. 2004, 24, 9–18. [Google Scholar] [CrossRef] [PubMed]
- Stark, T.D.; Martin, J.W.; Gerbasi, G.T.; Thalhamer, T.; Gortner, R.E. Aluminum waste reaction indicators in a municipal solid waste landfill. J. Geotech. Geoenviron. Eng. 2011, 138, 252–261. [Google Scholar] [CrossRef]
- Szczygielski, T. Fire in the hole: Aluminum dross in landfills. J. Nat. Resour. Envtl. L. 2007, 22, 159. [Google Scholar]
- Sharman, J. Underground Fire Continues to Burn in Forestdale, Forces Residents Out of Their Homes. Available online: https://birminghamwatch.org/underground-fire-continues-burn-forestdale-forces-residents-homes/ (accessed on 13 July 2020).
- Jafari, N.H. Elevated Temperatures in Waste Containment Facilities. Ph.D. Thesis, University of Illinois Urbana-Champaign, Champaign, IL, USA, 2015. [Google Scholar]
- Jafari, N.H.; Stark, T.D.; Thalhamer, T. Spatial and temporal characteristics of elevated temperatures in municipal solid waste landfills. Waste Manag. 2017, 59, 286–301. [Google Scholar] [CrossRef]
- El-Fadel, M.; Shazbak, S.; Saliby, E.; Leckie, J. Comparative assessment of settlement models for municipal solid waste landfill applications. Waste Manag. Res. 1999, 17, 347–368. [Google Scholar] [CrossRef]
- Frid, V.; Doudkinski, D.; Liskevich, G.; Shafran, E.; Averbakh, A.; Korostishevsky, N.; Prihodko, L. Geophysical-geochemical investigation of fire-prone landfills. Environ. Earth Sci. 2010, 60, 787–798. [Google Scholar] [CrossRef]
- Hogland, W.; Marques, M. Physical, biological and chemical processes during storage and spontaneous combustion of waste fuel. Resour. Conserv. Recycl. 2003, 40, 53–69. [Google Scholar] [CrossRef]
- Jafari, N.H.; Stark, T.D.; Roper, R. Classification and reactivity of secondary aluminum production waste. J. Hazard. Toxic Radioact. Waste 2014, 18, 04014018. [Google Scholar] [CrossRef]
- Koelsch, F.; Fricke, K.; Mahler, C.; Damanhuri, E. Stability of landfills-The Bandung dumpsite disaster. In Proceedings of the Tenth International Waste Management and Landfill Symposium, Cagliari, Sardinia, Italy, 3–7 October 2005. [Google Scholar]
- Lewicki, R. Early Detection and Prevention of Landfill Fires. In Proceedings of the International Waste Management and Landfill Symposium, Cagliari, Sardinia, Italy, 4–8 October 1999; pp. 613–620. [Google Scholar]
- Lönnermark, A.; Blomqvist, P.; Marklund, S. Emissions from simulated deep-seated fires in domestic waste. Chemosphere 2008, 70, 626–639. [Google Scholar] [CrossRef] [PubMed]
- Merry, S.M.; Fritz, W.U.; Budhu, M.; Jesionek, K. Effect of gas on pore pressures in wet landfills. J. Geotech. Geoenviron. Eng. 2006, 132, 553–561. [Google Scholar] [CrossRef]
- Nikolaou, K. Environmental management and landfill fire accidents. J. Env. Prot. Ecol. 2008, 9, 830–834. [Google Scholar]
- Øygard, J.K.; Måge, A.; Gjengedal, E.; Svane, T. Effect of an uncontrolled fire and the subsequent fire fight on the chemical composition of landfill leachate. Waste Manag. 2005, 25, 712–718. [Google Scholar] [CrossRef]
- Riquier, L.; Guerbois, M.; Budka, A.; Hebe, I.; Riviere, S. Underground fire characterisation in landfills: Investigation methods. In Proceedings of the Ninth International Waste Management and Landfill Symposium, Cagliari, Sardinia, Italy, 6–10 October 2003. [Google Scholar]
- Ruokojärvi, P.; Ruuskanen, J.; Ettala, M.; Rahkonen, P.; Tarhanen, J. Formation of polyaromatic hydrocarbons and polychlorinated organic compounds in municipal waste landfill fires. Chemosphere 1995, 31, 3899–3908. [Google Scholar] [CrossRef]
- Sperling, T.; Henderson, J.P. Understanding and controlling landfill fires. In Proceedings of the SWANA landfill symposium, San Diego, CA, USA, 18–20 June 2001. [Google Scholar]
- Rees, J.F. Optimisation of methane production and refuse decomposition in landfills by temperature control. J. Chem. Technol. Biotechnol. 1980, 30, 458–465. [Google Scholar] [CrossRef]
- Yeşiller, N.; Hanson, J.L.; Liu, W.-L. Heat generation in municipal solid waste landfills. J. Geotech. Geoenviron. Eng. 2005, 131, 1330–1344. [Google Scholar] [CrossRef]
- Hanson, J.L.; Yesiller, N.; Kendall, L.A. Integrated temperature and gas analysis at a municipal solid waste landfill. Civ. Environ. Eng. 2005, 136, 2265–2268. [Google Scholar]
- Hanson, J.L.; Yeşiller, N.; Oettle, N.K. Spatial and temporal temperature distributions in municipal solid waste landfills. J. Environ. Eng. 2009, 136, 804–814. [Google Scholar] [CrossRef]
- Jafari, N.H.; Stark, T.D.; Thalhamer, T. Progression of Elevated Temperatures in Municipal Solid Waste Landfills. J. Geotech. Geoenviron. Eng. 2017, 143, 05017004. [Google Scholar] [CrossRef]
- Joshi, R.; Pant, D. Landfill biodegradation process and leachate. In Waste Bioremediation; Springer: Singapore, 2018; pp. 233–247. [Google Scholar]
- Krause, M.J.W.; Chickering, G.; Townsend, T.G.; Reinhart, D.R. Critical review of the methane generation potential of municipal solid waste. Crit. Rev. Environ. Sci. Technol. 2016, 46, 1117–1182. [Google Scholar] [CrossRef]
- Nair, A.T.; Senthilnathan, J.; Nagendra, S.S. Emerging perspectives on VOC emissions from landfill sites: Impact on tropospheric chemistry and local air quality. Process. Saf. Environ. Prot. 2019, 121, 143–154. [Google Scholar] [CrossRef]
- Crawford, J.F.; Smith, P.G. Landfill Technology; Elsevier: Amsterdam, Netherlands, 2016. [Google Scholar]
- Thalhamer, T. Data Evaluation of the Subsurface Smoldering Event at the Bridgeton Landfill; Missouri Department of Natural Resources: Jefferson City, MO, USA, 2013.
- Hudgins, M.; Harper, S. Operational characteristics of two aerobic landfill systems. In Proceedings of the International Waste Management and Landfill Symposium, Cagliari, Sardinia, Italy, 4–8 October 1999; pp. 327–333. [Google Scholar]
- Stark, T.D.; Jafari, N.H. Landfill operational techniques in the presence of elevated temperatures. In Geotechnical Frontiers; ASCE: Reston, VA, USA, 2017; pp. 289–297. [Google Scholar]
- Huggett, C. Estimation of rate of heat release by means of oxygen consumption measurements. Fire Mater. 1980, 4, 61–65. [Google Scholar] [CrossRef]
- Pitts, W.M.; Johnsson, E.L.; Bryner, N.P. In Carbon monoxide formation in fires by high-temperature anaerobic wood pyrolysis. In Symposium (International) on Combustion; Elsevier: Amsterdam, Netherlands, 1994; pp. 1455–1462. [Google Scholar]
- Pitts, W.M. Ignition of Cellulosic Fuels by Heated and Radiative Surfaces (NIST TN 1481). 2007. Available online: https://www.nist.gov/publications/ignition-cellulosic-fuels-heated-and-radiative-surfaces-nist-tn-1481?pub_id=911663 (accessed on 10 January 2018).
- De Haan, J.D.; Icove, D.J. Kirk’s Fire Investigation: Pearson New International Edition; Pearson Higher Education: London, UK, 2013. [Google Scholar]
- Ettala, M.; Rahkonen, P.; Rossi, E.; Mangs, J.; Keski-Rahkonen, O. Landfill fires in Finland. Waste Manag. Res. 1996, 14, 377–384. [Google Scholar] [CrossRef]
- Bergström, J.; Björner, B. Dioxiner och bränder vid Avfallsupplag (Dioxins and Fires in Waste Storage); REFORSK Foundation Report; REFORSK Foundation: Malmö, Sweden, 1992. [Google Scholar]
- Rowe, R.K.; Islam, M.; Brachman, R.; Arnepalli, D.; Ewais, A.R. Antioxidant depletion from a high density polyethylene geomembrane under simulated landfill conditions. J. Geotech. Geoenviron. Eng. 2009, 136, 93–0939. [Google Scholar] [CrossRef]
- Jafari, N.; Stark, T.; Thalhamer, T. In Mapping Elevated Temperatures in Municipal Solid Waste Landfills. In Proceedings of the Global Waste Management Symposium, Palm Springs, CA, USA, 30 January–3 February 2016. [Google Scholar]
- Robertson, T.; Dunbar, J. Guidance for Evaluating Landfill Gas Emissions from Closed or Abandoned Facilities; EPA: Washington, DC, USA, 2005.
- SWANA. Landfill Gas Operation & Maintenance Manual of Practice; SWANA: Silver Spring, MD, USA, 1997. [Google Scholar]
- Estrabrooks, M. Using residual nitrogen to troubleshoot wellfield performance. In Proceedings of the SWANA 36th Annual Landfill Gas Symposium, Las Vegas, NV, USA, 19 March 2013. [Google Scholar]
- Hothorn, T.; Hornik, K.; Zeileis, A. ctree: Conditional Inference Trees. Compr. R Arch. Netw. 2015, 8. [Google Scholar]
- Lowd, D.; Domingos, P. Naive Bayes models for probability estimation. In Proceedings of the 22nd international conference on Machine learning, ACM, New York, NY, USA, 7–11 August 2005; pp. 529–536. [Google Scholar]
- Michigan Department of Natural Resources. Archived Reports Through 2016. Available online: https://dnr.mo.gov/bridgeton/BridgetonSanitaryLandfillReports.htm (accessed on 1 August 2018).
- Milosevic, L.T.; Mihajlovic, E.R.; Djordjevic, A.V.; Protic, M.Z.; Ristic, D.P. Identification of Fire Hazards Due to Landfill Gas Generation and Emission. Pol. J. Environ. Stud. 2018, 27. [Google Scholar] [CrossRef]
- Haynes, W. Wilcoxon rank sum test. In Encyclopedia of Systems Biology; Springer: Cham, Switzerland, 2013; pp. 2354–2355. [Google Scholar]


| Percentage of Residual Nitrogen (RN2) | Indications |
|---|---|
| 0–12% | The internal extraction system contains this range in most operating landfills. |
| 16–20% | Deemed essential to regulate perimeter migration, side slope emission, or where other compromises are required. |
| >20% | Indication of an aggressive landfill gas-extraction system with potential to initiate aerobic conditions. |
| Document | Recommended /Allowed Oxygen Intrusion (%) | Normal Methane Range (%) | Temperature Action Range (°C) | Carbon Monoxide (CO) Action Level (ppm) | Symptoms/Indications of a Smoldering Event or Comments |
|---|---|---|---|---|---|
| Solid Waste Association of North America (SWANA, 1997) | 0 to 0.5% (Ideal range) | 45 to 58% | 15.5 °C to 51.7 °C | Trace |
|
| <1% (Maximum limit) | (Typical range) | <25 ppm |
| ||
| |||||
| 51.7 °C to 60 °C (Action level) |
| ||||
| |||||
| |||||
| |||||
| |||||
| United States Environm-ental Protection Agency (US EPA) | 0.1 to 1% (Ideal range) | 45 to 60% | >55 °C (Action level) | 0 to 2000 ppm |
|
| (Robertson and Dunbar, 2005) | <5% (Maximum limit) |
|
| Well Name | Date Sampled | CH4 | CO2 | O2 | Balance Gas | Temperature (°F) | Residual N2 | Ratio (CH2:CO2) |
|---|---|---|---|---|---|---|---|---|
| GEW-40 | 6/3/2013 9:31 | 47.9 | 51.6 | 0.0 | 0.5 | 100 | 0.5 | 0.93 |
| GEW-41R | 6/3/2013 9:35 | 57.3 | 42.2 | 0.0 | 0.5 | 116 | 0.5 | 1.36 |
| GEW-41R | 6/3/2013 9:36 | 56.8 | 41.1 | 0.0 | 2.1 | 116 | 2.1 | 1.38 |
| GEW-42R | 6/3/2013 9:39 | 53.3 | 39.9 | 0.0 | 6.8 | 112 | 6.8 | 1.34 |
| GEW-43R | 6/3/2013 9:45 | 57.4 | 42.5 | 0.0 | 0.1 | 96 | 0.1 | 1.35 |
| GEW-43R | 6/3/2013 9:46 | 56.4 | 43.5 | 0.0 | 0.1 | 140 | 0.1 | 1.30 |
| Parameter | Rules of categorization | Category | Reference |
|---|---|---|---|
| Methane | Safe range: 45 to 60% | safe | 40 CFR §60.753 |
| Unsafe range: < 45% and >60% | unsafe | ||
| Ratio (CH4:CO2) | Safe range: >1 | safe | Thalhamer, 2013 |
| Unsafe range: <1 | unsafe | ||
| Oxygen | Safe range: <5% | safe | 40 CFR §60.753 |
| Unsafe range: >5% | unsafe | ||
| Temperature | Safe range: <176°F (80 °C) | safe | Thalhamer, 2013 |
| Unsafe range: >176 °F (80 °C) | unsafe | ||
| Residual Nitrogen | Safe range: <20% | safe | Estabrooks, 2013 |
| Unsafe range: >20% | unsafe |
| Gas Combinations (CH4_CH4-to-CO2 Ratio_RN2_O2) | Risk Levels |
|---|---|
| 0_0_0_0, 0_1_0_0, 1_0_0_0, 1_0_0_1, 0_0_0_1, 0_0_1_0 | Low |
| 1_0_1_0, 1_0_1_1 | Moderate |
| 1_1_0_0, 1_1_0_1, 1_1_1_0, 1_1_1_1 | High |
© 2020 by the authors. Licensee MDPI, Basel, Switzerland. This article is an open access article distributed under the terms and conditions of the Creative Commons Attribution (CC BY) license (http://creativecommons.org/licenses/by/4.0/).
Share and Cite
Sabrin, S.; Nazari, R.; Fahad, M.G.R.; Karimi, M.; Everett, J.W.; Peters, R.W. Investigating Effects of Landfill Soil Gases on Landfill Elevated Subsurface Temperature. Appl. Sci. 2020, 10, 6401. https://doi.org/10.3390/app10186401
Sabrin S, Nazari R, Fahad MGR, Karimi M, Everett JW, Peters RW. Investigating Effects of Landfill Soil Gases on Landfill Elevated Subsurface Temperature. Applied Sciences. 2020; 10(18):6401. https://doi.org/10.3390/app10186401
Chicago/Turabian StyleSabrin, Samain, Rouzbeh Nazari, Md Golam Rabbani Fahad, Maryam Karimi, Jess W. Everett, and Robert W. Peters. 2020. "Investigating Effects of Landfill Soil Gases on Landfill Elevated Subsurface Temperature" Applied Sciences 10, no. 18: 6401. https://doi.org/10.3390/app10186401
APA StyleSabrin, S., Nazari, R., Fahad, M. G. R., Karimi, M., Everett, J. W., & Peters, R. W. (2020). Investigating Effects of Landfill Soil Gases on Landfill Elevated Subsurface Temperature. Applied Sciences, 10(18), 6401. https://doi.org/10.3390/app10186401