Article

Effective Privacy-Preserving Collection of Health Data from a User’s Wearable Device

Department of Computer Science, Sangmyung University, Seoul 03016, Korea
*
Author to whom correspondence should be addressed.
Appl. Sci. 2020, 10(18), 6396; https://doi.org/10.3390/app10186396
Submission received: 20 July 2020 / Revised: 10 September 2020 / Accepted: 11 September 2020 / Published: 14 September 2020

Abstract

:
The popularity of wearable devices equipped with a variety of sensors that can measure users’ health status and monitor their lifestyle has been increasing. In fact, healthcare service providers have been utilizing these devices as a primary means to collect considerable health data from users. Although the health data collected via wearable devices are useful for providing healthcare services, the indiscriminate collection of an individual’s health data raises serious privacy concerns. This is because the health data measured and monitored by wearable devices contain sensitive information related to the wearer’s personal health and lifestyle. Therefore, we propose a method to aggregate health data obtained from users’ wearable devices in a privacy-preserving manner. The proposed method leverages local differential privacy, which is a de facto standard for privacy-preserving data processing and aggregation, to collect sensitive health data. In particular, to mitigate the error incurred by the perturbation mechanism of location differential privacy, the proposed scheme first samples a small number of salient data that best represents the original health data, after which the scheme collects the sampled salient data instead of the entire set of health data. Our experimental results show that the proposed sampling-based collection scheme achieves significant improvement in the estimated accuracy when compared with straightforward solutions. Furthermore, the experimental results verify that an effective tradeoff between the level of privacy protection and the accuracy of aggregate statistics can be achieved with the proposed approach.

1. Introduction

The recent growth of individuals’ interest in their personal health and wellness has prompted the use of smart healthcare services, which combine information and communications technologies with medical services. One of the key technologies that enable smart healthcare services is a recommendation method that provides individual users with customized healthcare-related services. Generally, these recommendation techniques require considerable health data to be collected from diverse users over a long period of time to enhance the recommendation quality by extracting aggregate statistics.
Wearable devices are equipped with a variety of sensors capable of measuring the users’ environmental conditions (e.g., temperature, humidity, pressure, and ultraviolet radiation). In addition, the user’s health status (e.g., their heart rate, sleep status, and blood pressure) as well as their lifestyle (e.g., daily step-count and calories burned per day) can be measured by wearable devices. For example, Figure 1 displays the change in daily cumulative step-count per hour measured by the built-in accelerometer of a wearable device, such as a commercial smart band, fitness band, and smartwatch. The widespread use of wearable devices that are able to measure the user’s health status and lifestyle has made it possible for healthcare service providers to utilize these wearable devices as a primary means to collect considerable health data from diverse users.
The health data collected from wearable devices are useful for the provision of smart healthcare services; however, the indiscriminate collection of individuals’ health data may raise serious privacy concerns because of the personal and sensitive nature of information pertaining to a person’s health and lifestyle. For example, a user’s private lifestyle could be inferred by analyzing the change in their daily cumulative step-count. From Figure 1, the activities associated with a user’s lifestyle, such as the time they left home for work and the time they spent working in the office, can be deduced based on the change in the daily cumulative step-count as a function of time. The periods with little change in the step-count denote periods when the user is either remaining in a specific location or moving by using transportation vehicles, whereas periods during which the step-count rapidly increases denote periods when they are walking or exercising. Furthermore, combined with external data, such as information about the user’s location measured by smartphone, an accurate impression of the user’s lifestyle is feasible. Therefore, users are generally reluctant to provide their health-related data, measured by wearable devices, to service providers owing to privacy concerns. These concerns have been identified as the most significant challenge faced by smart healthcare services.
The literature on data management contains reports of extensive studies relating to data privacy protection. From the literature, differential privacy (DP) has emerged as a de facto standard for privacy-preserving data processing. DP is based on a formal mathematical definition that provides a probabilistic privacy guarantee against attackers with arbitrary background knowledge [1,2]. In a DP-based data collection scenario, a centralized trusted data aggregator (who is trusted to not reveal the original data received from data owners) collects the original data from the data owners, perturbs the collected original data by adding random noise to satisfy DP, and publishes the perturbed data for the purpose of data analysis.
Recently, local differential privacy (LDP), which is a variant of DP, has now attracted attention as a promising way of guaranteeing individual privacy during the process of data collection [3,4,5]. Unlike DP, LDP does not require the existence of the trusted data aggregator. In an LDP-based data collection scenario, each data owner, who does not fully trust a data aggregator, perturbs his/her original data in a manner that satisfies DP before sending it to the data aggregator. With its strong privacy guarantees, several successful LDP-based deployments have been implemented in industry by major technology companies, including Google [3], Samsung [6], Apple [7,8], and Microsoft [9].
In this study, we leverage LDP to collect sensitive health data from wearable devices (e.g., smart band, fitness band, smartwatch, etc.) in a privacy-preserving manner such that a data owner’s original data is not revealed at all (i.e., wearable device user’s original health data is not exposed). In particular, our contributions can be summarized as follows:
  • We propose an effective way to aggregate health data acquired from wearable devices under LDP. To mitigate the error incurred by the perturbation mechanism of LDP, the proposed method extracts (samples) a small amount of salient data from given health data and reports the identified salient data to the data collection server under LDP, instead of reporting all the health data. Then, the data collection server reconstructs the health data based on the small amount of salient data received from a wearable device.
  • Through experiments with a real dataset, we demonstrate that the developed method can effectively collect health data from wearable devices, while preserving privacy.
The remainder of this paper is structured as follows. We describe related work in the next section. Section 3 formalizes the problem. Section 4 presents the proposed method for collecting sensitive health data from wearable devices in a privacy-preserving manner. Section 5 contains details of the experimental evaluation of the proposed approach, and in Section 6, we conclude the paper.

2. Related Work

A considerable number of studies have implemented medical systems comprising wearable devices implanted with sensors to record data for health applications. Examples of the collected data include heart rate, electrocardiogram, blood pressure, sleep state, step counts, calories, etc. With intelligent systems, these lifelogging data are exploited to enable data owners to monitor individuals’ health status during their daily activities, such as exercising, working, sleeping, etc. For example, CodeBlue [10] is a health care system that provides patient monitoring functionality by using body sensor data. AlarmNet [11] and Medical MoteCare [12] are patient monitoring systems that not only use body sensor data but also data gathered by environmental sensors.
Health monitoring is a field that has been actively studied. The exploitation of health data makes it possible to provide personalized medical and early disease diagnosis services. For instance, a doctor examining a patient whose health data are collected in a hospital could make an assessment based on the current state of the patient in comparison with the medical records of other patients, which enables improved assessment [13]. An electrocardiogram was used to monitor the state of heart disease and predict the degree of stress by observing changes in heart rate. Taelman et al. [14] investigated the relationship between the stress level and changes in the heart rate. In their experiments with 28 students, the average heart rate rose from 73.52 to 75.94 when the Mensa exam was presented to the students compared to images of pastoral scenes. This means that a mentally stressful situation stimulates the heart rhythm. Fisher et al. [15] introduced a method whereby a wearable device can be used to track the heart rate of a patient with congestive heart failure and the condition monitored remotely. Several studies have demonstrated a significant relationship between health and exercise, indicating that those who are active in their leisure time are more likely to live longer than those who are inactive [16,17].
With respect to human behavior recognition, recognizing patients’ state by analyzing their health data is a viable option. For example, an emergency alarm system can be used to automatically request help when it detects abnormal movement of a disabled person or an elderly person with impeded mobility. These alarm systems analyze the data gathered by the inertial sensor embedded in a wearable device for monitoring purposes [18]. The analysis of daily behavior information in an office environment is a popular application in the area of human behavior recognition [19]. In this area, health data are actively being analyzed by classifying physical activities, using methods such as machine learning, and monitoring them for health management purposes. Altun et al. [20] conducted a study to classify 19 types of human behavior using small inertial and magnetic sensors. Behavioral classification using health data is mainly used to provide a service for patients or the elderly. Melillo et al. [21] introduced a method based on electrocardiograms for detecting and preventing collapse owing to hypotension. In another work, Hamatani et al. [22] developed a method to provide customized healthcare services for individual users by collecting and analyzing wearable devices’ biodata such as heart rates and body temperatures.
Much as the works presented in [10,11,12,13,14,15,16,17,18,19,20,21,22] aim at improving the well being and the general standard of living of humans, they pay limited attention to the user privacy concerns. In [10,11,12,13,14,15,18,19,20,21,22], the focus is mainly on methods for collecting and analyzing user data for the purpose of monitoring, without considering the user privacy violations involved. However, in [13], though the authors considered data access security in their design, user privacy still remains a challenge once an entity gains access to the data. For interested readers, a survey on privacy and security issues when using body implantable medical devices is presented in [23].
For practical implementation, privacy preservation is essential in healthcare and medical systems. To preserve privacy, researchers have proposed several techniques such as encryption, anonymization, and data perturbation (through DP and LDP) that protect the health data from intruders. However, data perturbation techniques have emerged as the future of privacy preservation because of the simplicity associated with their mechanisms [24]. Thus, a number of conducted researches have focused on the use of data perturbation techniques for e-health data privacy preservation. Beaulieu-Jones et al. [25] perturbed clinical data using differential privacy to efficiently and accurately train a privacy-preserving deep learning model. The authors integrated differential privacy with a cryptographic mechanism to enhance privacy. Mohammed et al. [26] proposed a lightweight framework for privacy-preserving data mining of cancer patients’ data by using the Laplace noise of differential privacy. In [27,28], differential mechanisms are integrated with encryption techniques to preserve the privacy of genomic data. In [29], Tang et al. combined differential privacy with Boneh–Goh–Nissim cryptosystem and Shamir’s secret sharing for privacy-preserving aggregation of data from different health devices. Guan et al. [30] combined differential privacy with machine learning to perform k-means clustering of differentially private health data recorded from medical IoT devices.
Apart from healthcare and medical systems, data perturbation techniques have found use in other applications, such as private heavy hitter identification, which employs locally differentially-private algorithms to find the top k items with the highest frequency along with the estimated frequency for each such item [5,31,32]. LDP has also been used for marginal distribution estimation, which computes the joint distribution of multiple variables [33,34] in a privacy preserving manner. Other applications that have integrated LDP for privacy preservation include: IoT acquired data analysis [6,35,36,37,38], deep learning [39,40], and data mining [41]. In the literature, the focus is mostly on the privacy of the data already in storage. However, for those that aggregate data periodically, they consider the entire data set which can be inefficient and inaccurate because of the increased error. We intend to address the challenge in this work.

3. Problem Definition, Background and Naive Solution

In this section, we first formally define the problem, provide background on LDP, and present a naive solution to the problem.

3.1. Problem Definition

Generally, wearable devices periodically measure a user’s health status within a predefined fixed time interval. Let U = { U 1 , U 2 , , U w } be the set of users in which w represents the total number of users. In this study, we model the health data of the i-th user U i (which are measured by a wearable device) as a sequence S i = ( t 1 , x 1 i ) , ( t 2 , x 2 i ) , , ( t n , x n i ) of length n. Note that ( t d , x d i ) in a sequence denotes the value, x d i , measured by the wearable device at timestamp, t d . Let us further assume that x d i is within the predefined range [ x m i n , x m a x ] . Especially, in this paper, we focus on a scenario that generates health data with a monotonically increasing property (i.e., x 1 i x 2 i x 3 i , , x n i ), such as the daily cumulative step-count (Figure 1) and daily cumulative calorie consumption, which are among the most common forms of health data. We also consider a scenario in which each user reports the daily health data measured by their wearable device to an aggregator. In this case, the user’s health data are sent to the aggregator every 24 h.
Let S = { S 1 , S 2 , , S w } be a set of sequences the aggregator receives from w users. Then, the problem addressed in this paper can be stated as follows:Given
  • the set of users U = { U 1 , U 2 , , U w } , and
  • the set of health data S = { S 1 , S 2 , , S w } received from users,
compute the aggregate statistics A S = ( t 1 , a x 1 ) , ( t 2 , a x 2 ) , , ( t n , a x n ) . Here, the value of a x d at timestamp t d is computed as follows:
a x d = 1 w × h = 1 w x d h .
In other words, once receiving S = { S 1 , S 2 , , S w } from w users, the aggregator wants to compute the aggregate statistics A S = ( t 1 , a x 1 ) , ( t 2 , a x 2 ) , , ( t n , a x n ) where the value of a x d at timestamp t d is computed by averaging all values of x d h where 1 h w .

3.2. Local Differential Privacy

The basic concept of LDP involves perturbation of the original data by the data owner by adding random noise, and reporting the perturbed data to a data aggregator. This mechanism guarantees that the data owner’s original data are not exposed to an external entity. LDP is defined as follows: A randomized algorithm A satisfies ϵ -LDP, if and only if for (1) all pairs of the data owner’s local data v a and v b , and (2) any output O of A, the following equation is satisfied [3,4,5]:
P r [ A ( v a ) = O ] e ϵ × P r [ A ( v b ) = O ] .
Here, P r [ A ( v a ) = O ] denotes the probability that the output of running a randomized algorithm A with v a is O. The meaning of the aforementioned definition is that, regardless of the data an aggregator receives from a data owner, the aggregator cannot infer with, high confidence (which is controlled by the privacy budget ϵ ), whether the data owner has sent v a or v b . This provides the data owner with plausible deniability. The parameter ϵ is a privacy budget that controls the level of privacy. That is, small values of ϵ ensure strong privacy, guaranteed by adding a comparatively larger amount of noise to the original data. By contrast, large values of ϵ provide weak privacy protection by adding less noise to the original data.
An important property regarding the privacy budget is the sequential composition property, which LDP follows to attain differential privacy. That is, the available privacy budget, ϵ , can be partitioned into n smaller privacy budgets, ϵ 1 , ϵ 2 , , ϵ n , such that ϵ = h = 1 n ϵ h and the data owner uses each small privacy budget to report their local data to an aggregator.

3.3. Naive Solution

In this subsection, we introduce a straightforward privacy-preserving solution based on the use of LDP which consists of wearable device processing (i.e., data owner) and server processing of the collected data (i.e., data aggregator).
Wearable device processing: For explanatory purposes, we focus on the i-th user, U i U . By the sequential composition property of LDP, the privacy budget, ϵ , is first partitioned into n privacy budgets. Then, given original health data S i = ( t 1 , x 1 i ) , ( t 2 , x 2 i ) , , ( t n , x n i ) represented as a sequence of length n, each smaller privacy budget is used to generate a perturbed sequence P S i = ( t 1 , p x 1 i ) , ( t 2 , p x 2 i ) , , ( t n , p x n i ) . Here, p x d i is obtained using the LDP mechanism as follows:
p x d i = x d i + L a p ( Δ s ϵ / n ) ,
where Δ s corresponds to the local sensitivity defined as Δ s = x m a x x m i n and L a p ( Δ s ϵ / n ) denotes a random noise sampled from a Laplace distribution with mean μ = 0 and scale s f = Δ s ϵ / n . Note that this satisfies the ϵ -differential privacy because of ϵ = h = 1 n ϵ / n = n × ( ϵ / n ) . Then, the user U i reports the perturbed sequence P S i instead of the original data S i , which guarantees that the original data of the data owner is not exposed to the (untrusted) data aggregator.
Server processing of the collected data: Once it has been received the perturbed sequences from all the data owners P S = { P S 1 , P S 2 , P S w } , the data aggregator computes the aggregate statistics A S = ( t 1 , a x 1 ) , ( t 2 , a x 2 ) , , ( t n , a x n ) . Here, the value of a x d at timestamp, t d , is estimated by using the perturbed values as follows:
a x d = 1 w × h = 1 w p x d h .
The expected error incurred by this estimation is known to be linearly proportional to the sequence length n [6]. Thus, this scheme is not suitable when the sequence length, n, is large.

4. Proposed Method

In this section, we introduce the proposed method to collect sensitive health data from wearable devices using LDP. The general outline of the proposed scheme is similar to that of the naive solution introduced in the previous section. However, to mitigate the high expected error incurred by the perturbation mechanism of LDP when collecting the health data via wearable devices, we develop a novel scheme which reports sampled salient data instead of the entire health data. In particular, the proposed method first extracts (samples) a small amount of salient data from the entire health data, perturbs the identified salient data using the perturbation mechanism of LDP, and sends the perturbed salient data to a data collection server. Then, after receiving the perturbed salient data, the data collection server reconstructs the health data based on them. In the next subsections, we explain each of these steps in detail.

4.1. Wearable Device Processing

Wearable device processing consists of two phases: searching for a salient data set and reporting the perturbed salient data set to the data collection server.

Searching for a Set of Salient Data

As described in Section 3.3, the expected error incurred by using LDP is linearly proportional to the length of the sequence of health data. To mitigate the expected error caused by the perturbation mechanism of LDP, the proposed method first identifies a small amount of salient data, after which it uses LDP to process these data instead of processing the entire health data. Thus, given a health data, the objective of the first phase of wearable device processing is to search for an optimal salient data set that best represents the original health data.
For easy explanation, let us focus on the i-th user U i and their health data, S i = B i g ( ( t 1 , x 1 i ) , ( t 2 , x 2 i ) , , ( t n , x n i ) ) , represented as a sequence of length n. Note that in the following, for ease of notation, we omit the superscript i whenever possible. As indicated in Section 3.1, in this study, we consider a scenario in which the collected health data increase monotonically (i.e., x 1 x 2 x 3 , , x n ). Algorithm 1 contains the pseudo-code for computing a salient data set, F S = { ( t f 1 , x f 1 ) , ( t f 2 , x f 2 ) ( t f m , x f m ) } , which is composed of m elements (i.e., salient data), extracted from S i . The inputs of the algorithm include the health data sequence S i and the predefined maximum number of salient data α . In the initialization step, the best salient data set, F S b e s t , is initialized such that it contains the first (i.e., ( t 1 , x 1 ) ) and the last (i.e., ( t n , x n ) ) data value of S i (lines 1–3). Then, the best error, e r r b e s t , incurred by using LDP, is estimated with the initial best salient data set by the function E s t i m a t e E r r o r _ b y _ L D P ( ) , which is explained later in this subsection.
Algorithm 1: Pseudo-code for extracting a set of salient data from a given health data sequence
Applsci 10 06396 i001
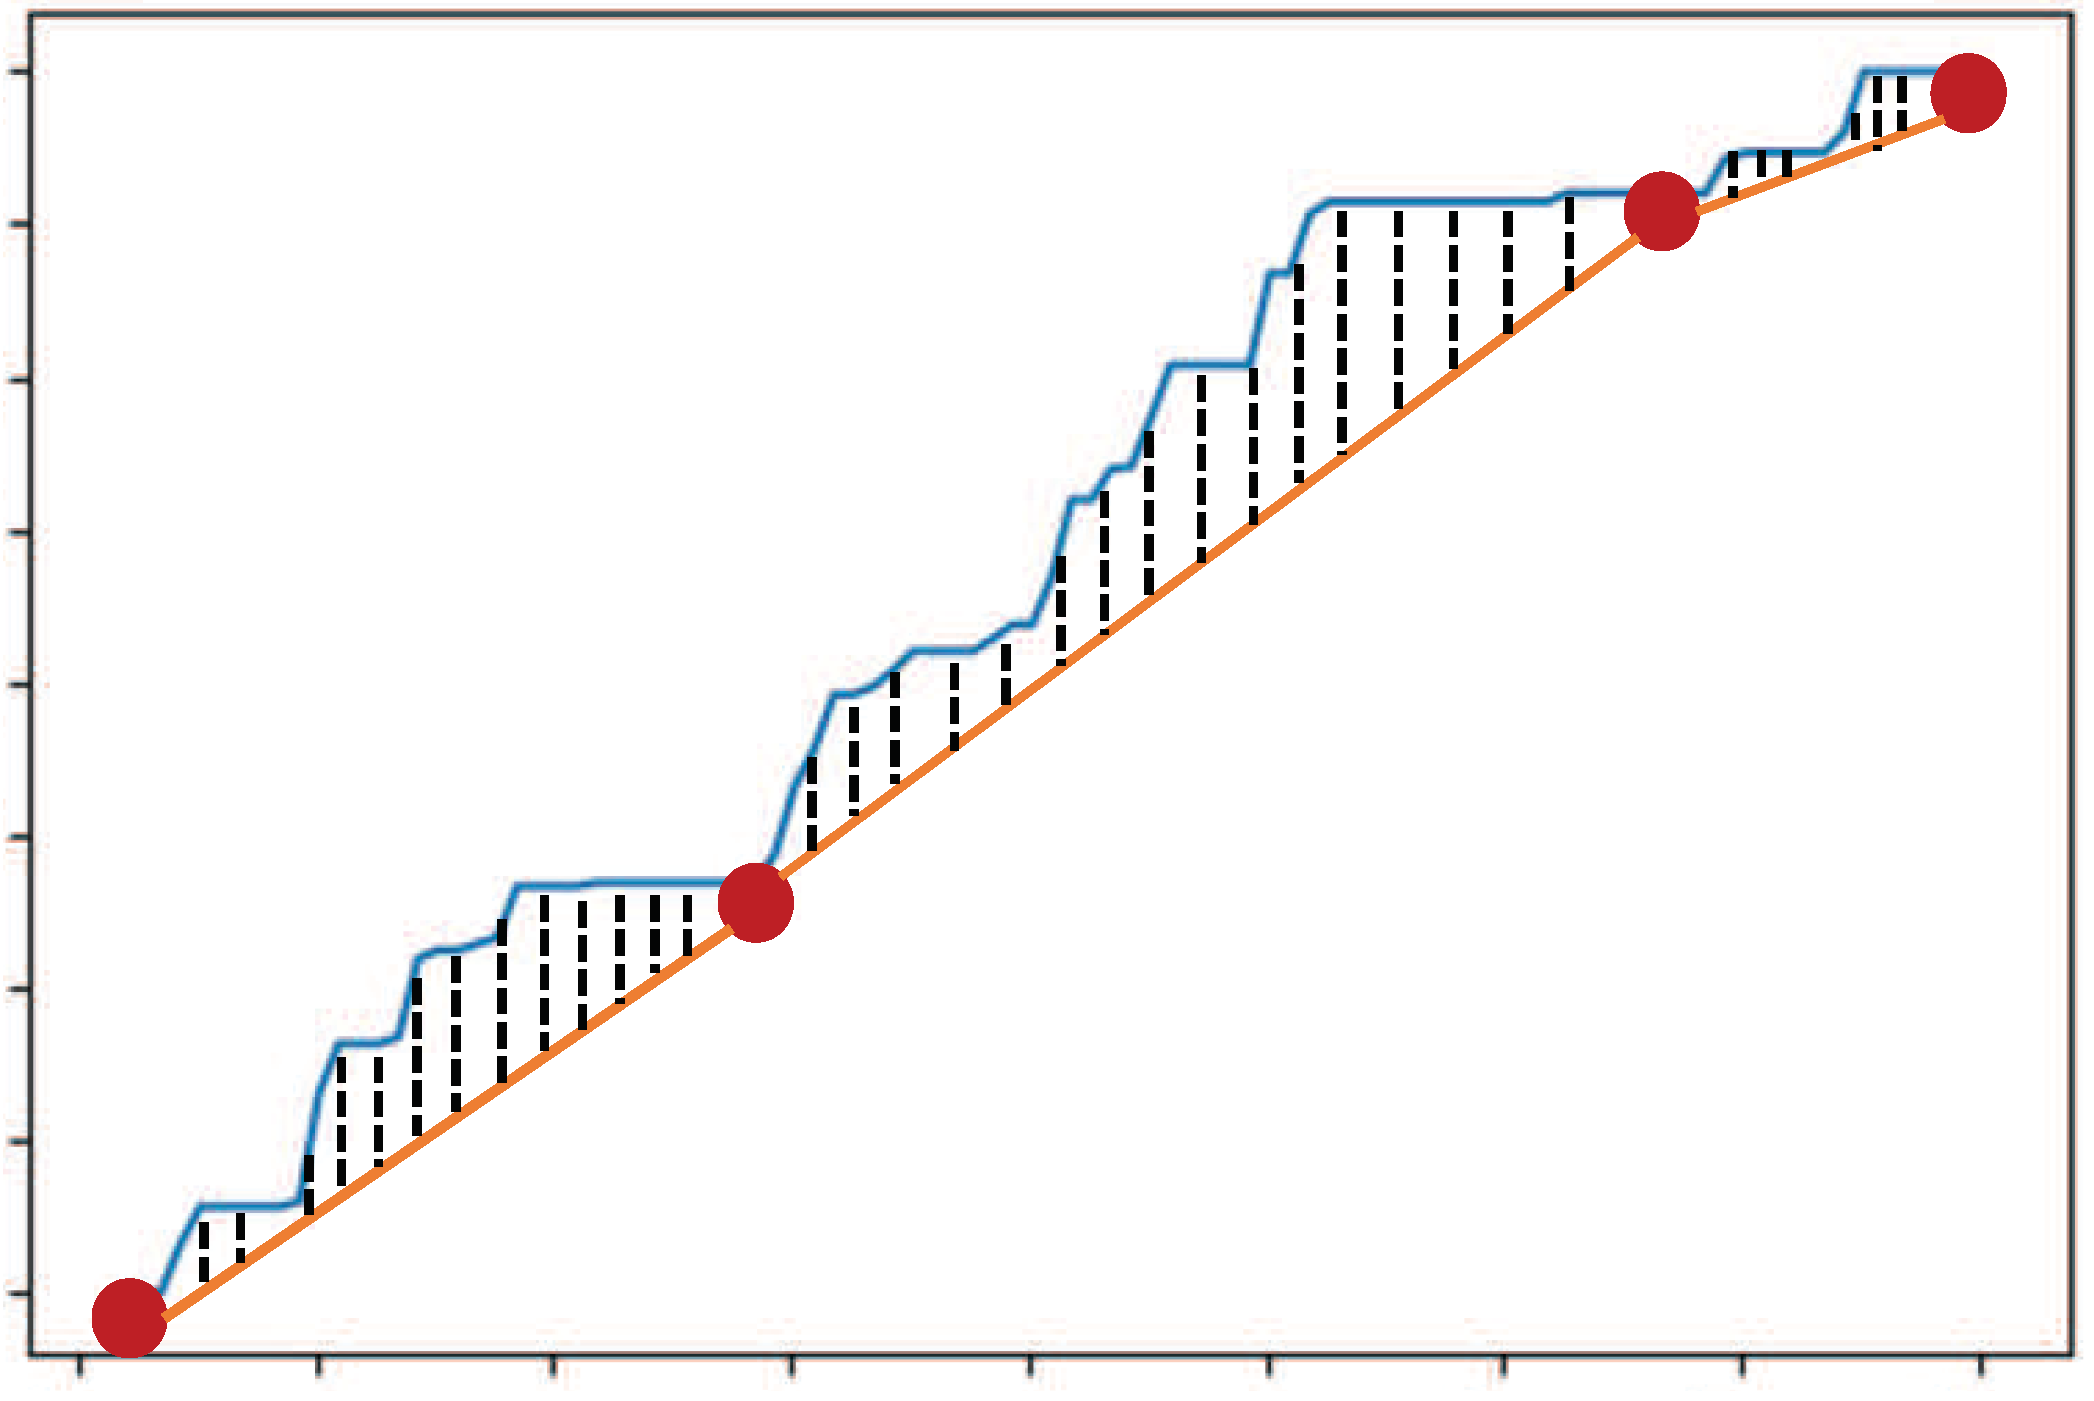
The main parts of the algorithm consist of two steps: finding the next best salient data and updating the best salient data set if necessary. In the first step (lines 7–19), the algorithm finds the next salient data by scanning all data in S i and then adding these data to F S c u r . Here, the next salient data is selected in such a way that the distance (which is computed by ComputeDistance() in line 11) between the original health data S i and the linear line obtained on the basis of salient data set F S c u r is minimized. For example, Figure 2 illustrates the computation of the distance (represented by black dotted lines) between the original health data (represented by a blue curve) and a salient data set (represented by red circles) containing four salient data. In this example, we assume that α is set to 6 and the salient data set contains 4 salient data. Here, each linear line segment (represented by an orange line) is obtained by connecting two adjacent salient data.
In the second step (lines 20–24), the algorithm compares the estimated error incurred by using LDP with F S c u r to the one with F S b e s t . If e r r is less than e r r b e s t , the best salient data set is updated with F S c u r . The algorithm iteratively repeats this process until the number of salient data in F S c u r reaches the predefined α (line 6), which implies that the number of salient data in the best salient data set F S b e s t is no greater than α .
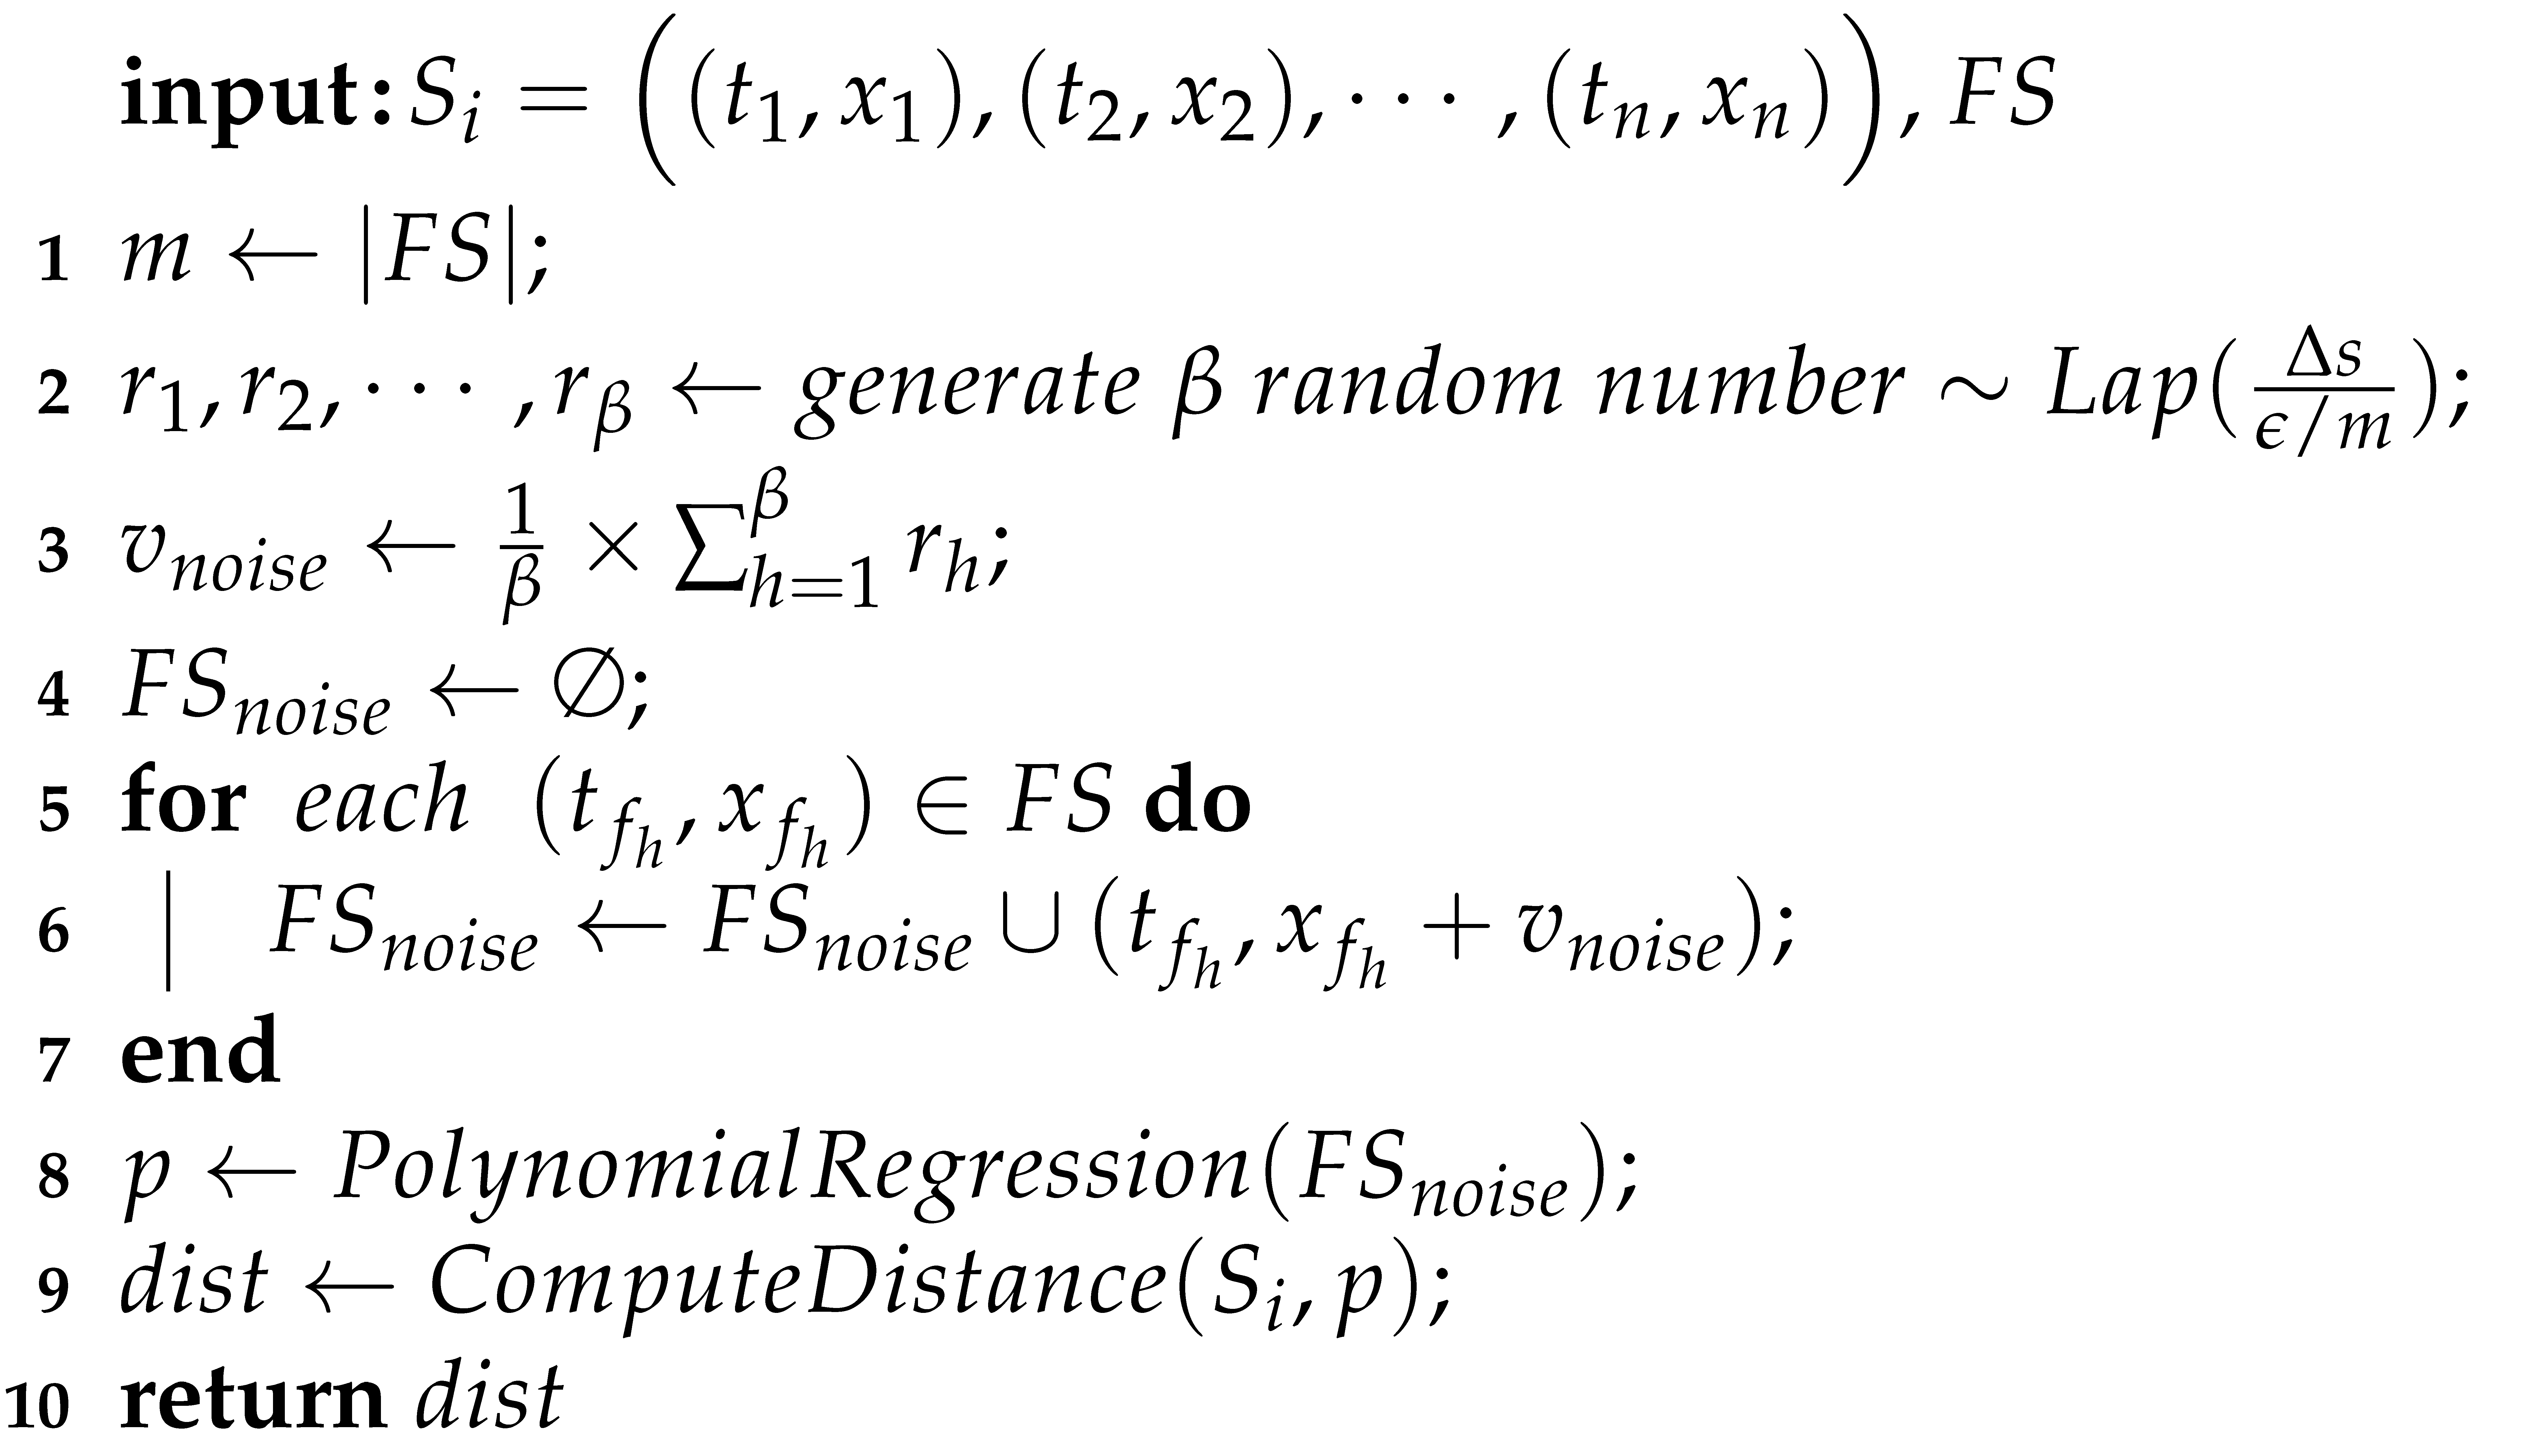
We now explain the function E s t i m a t e E r r o r _ b y _ L D P ( ) that estimates the error induced by the perturbation step of LDP (Algorithm 2). Algorithm 2 accepts the health data, S i , and the salient data set, F S , as its input. In line 2, the algorithm generates β random noises sampled from a Laplace distribution with mean μ = 0 and scale s f = Δ s ϵ / m , where Δ s is the local sensitivity explained in Section 3.3, m is the number of salient data in F S , and β is a predefined parameter. Then, in line 3, v n o i s e is computed by averaging the β random noises generated in the previous step. In the next steps, the noised salient data set F S n o i s e is generated by adding v n o i s e to each salient data in F S (line 4–7). Then, in line 8, the algorithm computes the nonlinear curve that best expresses the salient data in F S n o i s e by using polynomial regression. Finally, the distance (i.e., error) between the original health data S i and the nonlinear curve obtained in the previous step is computed.
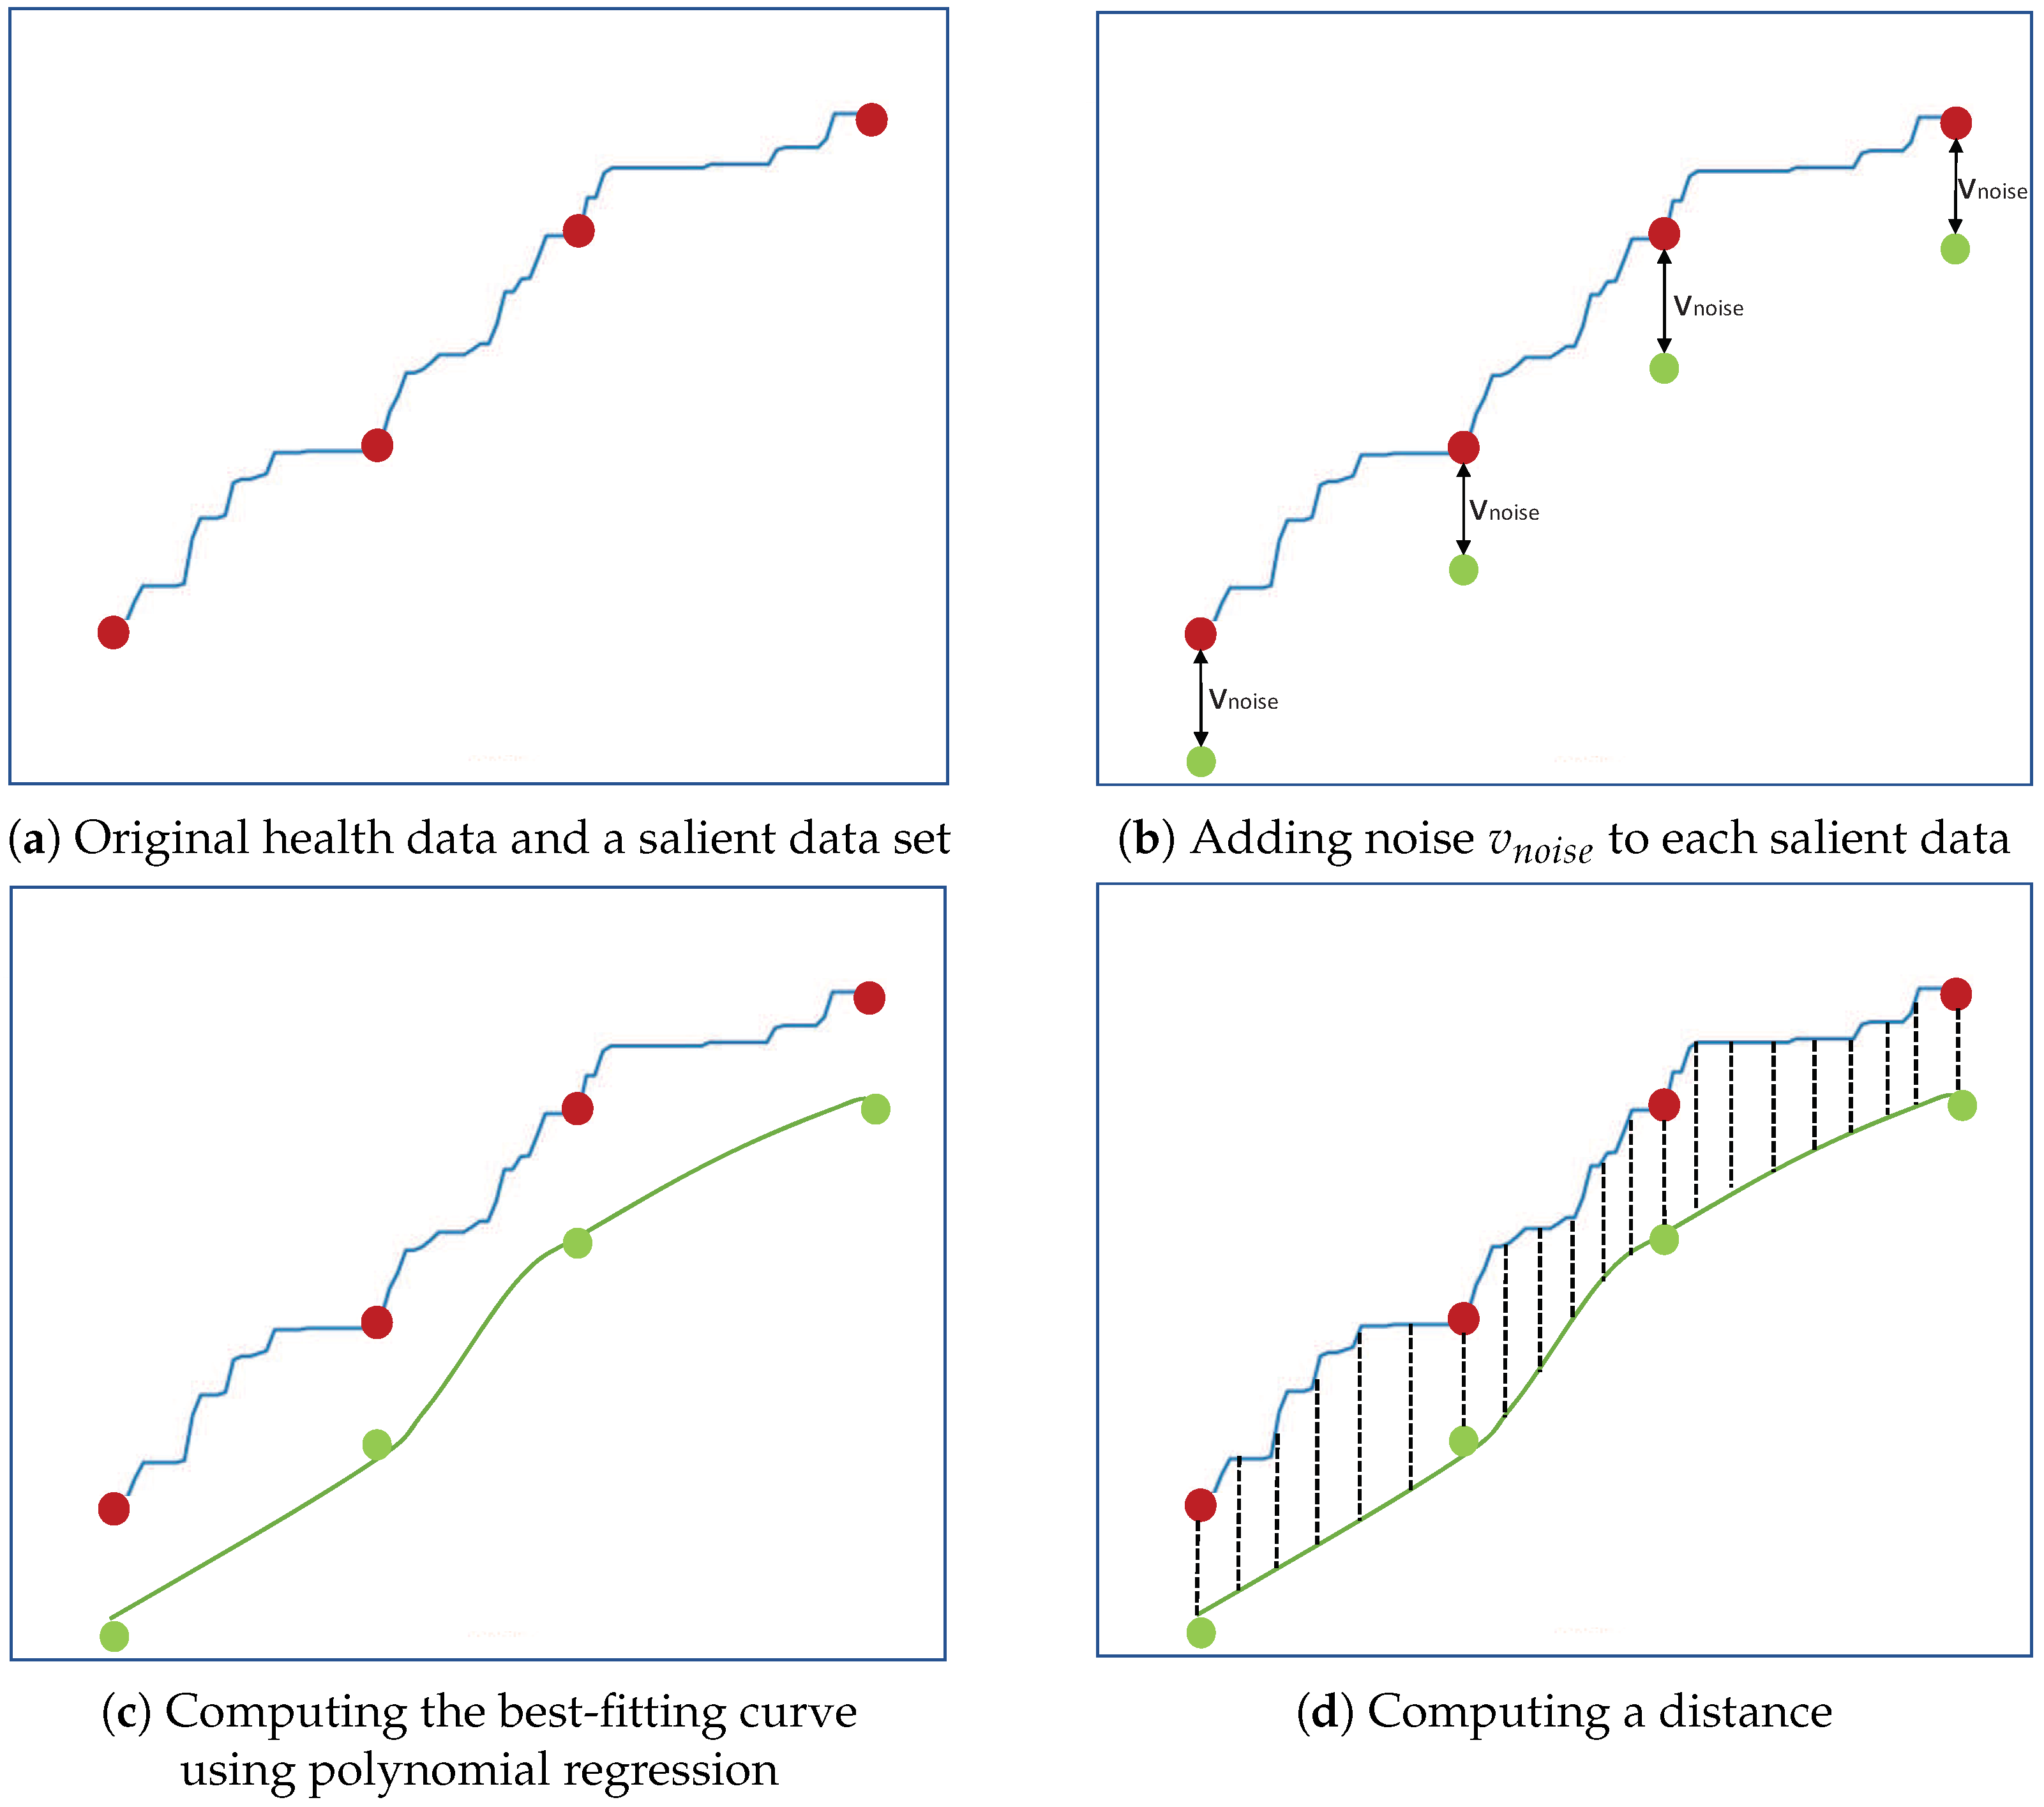
For example, Figure 3 illustrates the method to compute the estimated error by the function EstimateError_by_LDP(). The original health data (i.e., S i ) is represented by the blue curve and each salient data in F S is represented by the red circle (Figure 3a). Here, the x-axis corresponds to the timestamps (i.e., t 1 , t 2 , , t n of S i ) and the y-axis represents the values (i.e., x 1 , x 2 , , x n of S i ). In Figure 3b, each noised salient datum, represented by the green circle, is obtained by adding v n o i s e to each salient data. Then, in Figure 3c, by using polynomial regression which finds the best-fitting curve by minimizing the sum of the deviations from each given data point (i.e., each green circle in this example) to the curve, the nonlinear curve (represented by the green curve) is computed. We also note that the best-fitting curve computed by using polynomial regression does not need to pass through existing given data points. Finally, the distance between the original health data and the best-fitting curve is computed in Figure 3d.
Algorithm 2: EstimateError_by_LDP()
Applsci 10 06396 i002
Once the salient data set is identified from the health data, the next step entails reporting the perturbed set to the data collection server under LDP. Let F S i = { ( t f 1 , x f 1 ) , ( t f 2 , x f 2 ) ( t f m , x f m ) } be the salient data set, which consists of m salient data, extracted from S i , as explained in the previous phase. Then, based on the sequential composition property of LDP, the privacy budget, ϵ , is equally partitioned into m privacy budges, each of which is used to perturb each salient data in F S i . Formally, given F S i , let P F S i = { ( t f 1 , p x f 1 ) , ( t f 2 , p x f 2 ) ( t f m , p x f m ) } be the corresponding perturbed salient data set. Here, p x f h is obtained by adding random noise sampled from a Laplace distribution with mean μ = 0 and scale s f = Δ s ϵ / m :
p x f h = x f h + L a p ( Δ s ϵ / m ) .
This satisfies the ϵ -differential privacy because ϵ = h = 1 m ϵ / m .
The last step of wearable device processing is to send the perturbed salient data set, P F S i , to the data aggregation server. Note that, unlike the naive solution in Section 3.3, the proposed method is able to reduce the error caused by the perturbation mechanism of LDP by using the privacy budget ϵ to perturb and report the small number of salient data instead of reporting the entire health data (i.e., m < n ).

4.2. Server Processing of the Collected Data

After receiving the perturbed salient data set from a wearable device, the data collection server first reconstructs the health data based on the perturbed salient data set. Given P F S i , for easy explanation, let us assume that the timestamp of a salient datum in P F S i satisfies the condition t f 1 < t f 2 < < t f m .
Given two adjacent salient data, ( t f h , p x f h ) and ( t f h + 1 , p x f h + 1 ) , the health data located between two timestamps, t f h and t f h + 1 , are estimated by the points that lie on the linear line connecting ( t f h , p x f h ) and ( t f h + 1 , p x f h + 1 ) . Let a be the slope and b be the y-intercept of the linear line connecting ( t f h , p x f h ) and ( t f h + 1 , p x f h + 1 ) . Then, a and b, respectively, are computed as follows:
a = p x f h + 1 p x f h t f h + 1 t f h , b = p x f h a × t f h .
All health data that fall into the time interval between t f h and t f h + 1 are represented with a linear line with a slope a and the y-intercept ( 0 , b ) .
Let R S i = ( t 1 , r x 1 i ) , ( t 2 , r x 2 i ) , , ( t n , r x n i ) be a reconstructed health data sequence of the i-th user. Let R S = { R S 1 , R S 2 , R S 3 , , R S w } be a set of reconstructed health data of w wearable device users. Then, the data aggregator computes the aggregate statistics A S = ( t 1 , a x 1 ) , ( t 2 , a x 2 ) , , ( t n , a x n ) . Here, the value of a x d at timestamp t d is estimated using the reconstructed data as follows:
a x d = 1 w × i = 1 w r x d i .
That is, the average value of the d-th timestamp is obtained by averaging the values of the d-th timestamp for all the reconstructed health data.

5. Experimental Evaluation

In this section, we describe the experiments that were conducted to evaluate the effectiveness of the proposed approach. We first explain the experimental setup and then discuss the experimental results.

5.1. Data Set

To evaluate the effectiveness of the proposed method, we collected 290 cumulative step-count data from students (undergraduate and graduate) of Sangmyung University on daily basis as they carry on their activities. The recordings were done in one-minute time intervals between 10:00–21:00 using the Gear S3 smartwatch. The effect of the amount of data on the performance of the proposed method was investigated by generating 290 × 10 1 and 290 × 10 2 data sets. The 290 × 10 1 and 290 × 10 2 data sets were generated by replicating each data in 290 daily cumulative step-count data by 10 1 and 10 2 times.

5.2. Baseline Approaches

In the experiments, in addition to reporting results for the proposed approach( O S ), which is based on the optimal salient data selection presented in Section 4, we also report results for the following alternatives:
  • N S corresponds to the naive solution explained in Section 3.3.
  • R S is the random selection method which first randomly selects a predefined fixed number of salient data from a given health data, and then reports the randomly selected salient data to the data collection server under LDP.
  • N S corresponds to the non-optimal selection method which first selects a predefined fixed number of salient data from a given health data by using the first step in Algorithm 1, and then reports the selected salient data to the data collection server under LDP. We note that unlike O S , N S use the first step in Algorithm 1, but does not leverage the second step (which considers the error incurred by the perturbation mechanism of LDP) in Algorithm 1
We note that R S and N S are used to evaluate the effectiveness of the proposed method for identifying a salient data set, as presented in Section 4.1.

5.3. Experimental Setup

Three different levels of privacy, ϵ = 0.5 , ϵ = 1.0 , and ϵ = 2.0 , were used in the experiments. In the experimental data set, the difference between a possible minimum value and a possible maximum value of daily cumulative step-count is less than 8000, and thus, the local sensitivity Δ s was set to 8000. Furthermore, the predefined parameters, α and β , in Algorithms 1 and 2 were assigned the values of 6 and 200, respectively.
To measure the estimation accuracy, we use an error rate, e, defined as follows:
e = 1 n × d = 1 n | a x d a c t u a l a x d e s t | .
Here, n denotes the length of the health data sequence, and a x d a c t u a l and a x d e s t , respectively, correspond to the actual and the estimated value of a x d at the timestamp, t d , in aggregate static A S = ( t 1 , a x 1 ) , ( t 2 , a x 2 ) , , ( t n , a x n ) .

5.4. Experimental Results

Table 1 lists the average error rates for varying privacy budget ϵ and datasets of different sizes. In the experiments, the privacy budget ϵ varied from 0.5 to 2.0 and the sizes of the datasets varied from 290 × 10 1 to 290 × 10 2 . Key observations based on the table can be summarized as follows: As the number of collected data sizes increases, the error rate decreases, which implies that as additional data are collected from users of wearable devices, the estimation accuracy becomes high. As ϵ decreases, the error rate increases. This is because a decrease in the privacy budget causes random noise, which is added to the original data by the perturbation phase of LDP, to increase, whereupon the level of privacy protection of the user’s health data increases. As indicated by the results in the table, the method proposed in this paper significantly outperforms the naive solution for all privacy budgets and data sizes. These experimental results verify that the proposed method, which reports carefully selected salient data, is more effective than the naive solution, which reports the entire collection of health data.
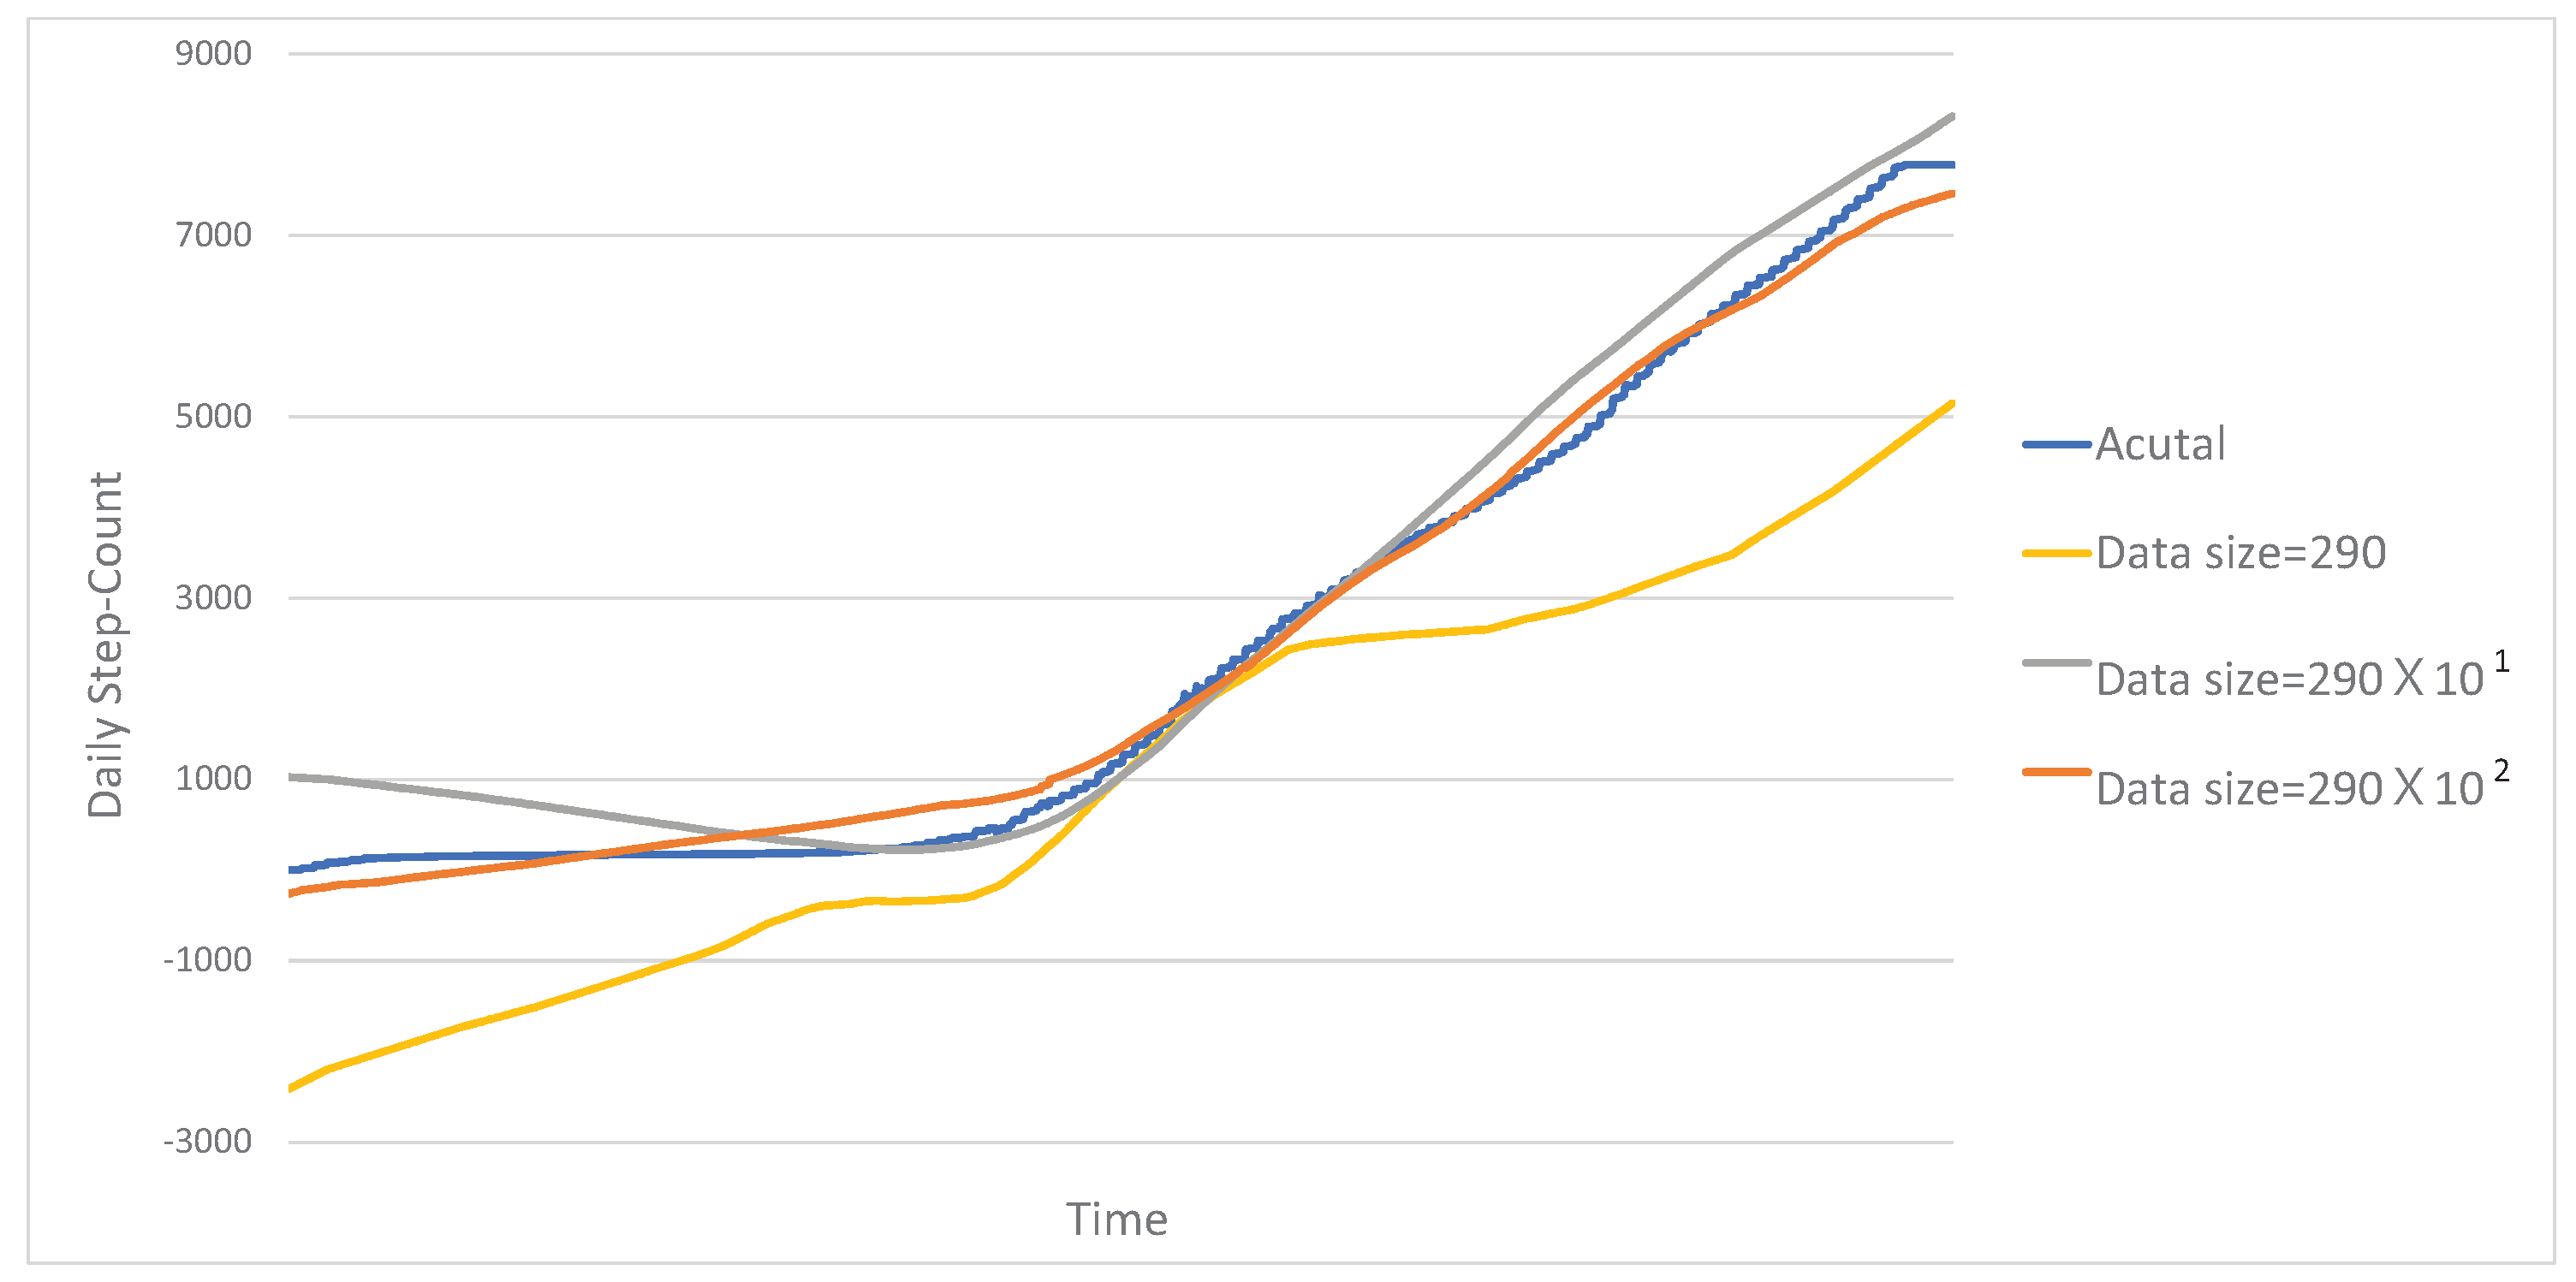
Figure 4 plots the actual and estimated aggregate static for datasets of various sizes. In this figure, the y-axis corresponds to the daily step-count and the x-axis represents the time between 10:00 and 21:00. In the experiment, the privacy budget is set to 1.0, whereas the amount of data varies from 290 to 290 × 10 2 . As expected, as the amount of data increases, the aggregated health data sequence estimated by the proposed approach more closely approximates the actual data (which is represented by a blue curve). As can be seen in the figure, with the 290 dataset, an accurate estimation cannot be obtained due to the insufficient collected data. However, with the 290 × 10 2 dataset, a fairly good estimation can be achieved by the proposed approach in this paper. These experimental results indicate that the method proposed in this study effectively exploits the collected dataset.
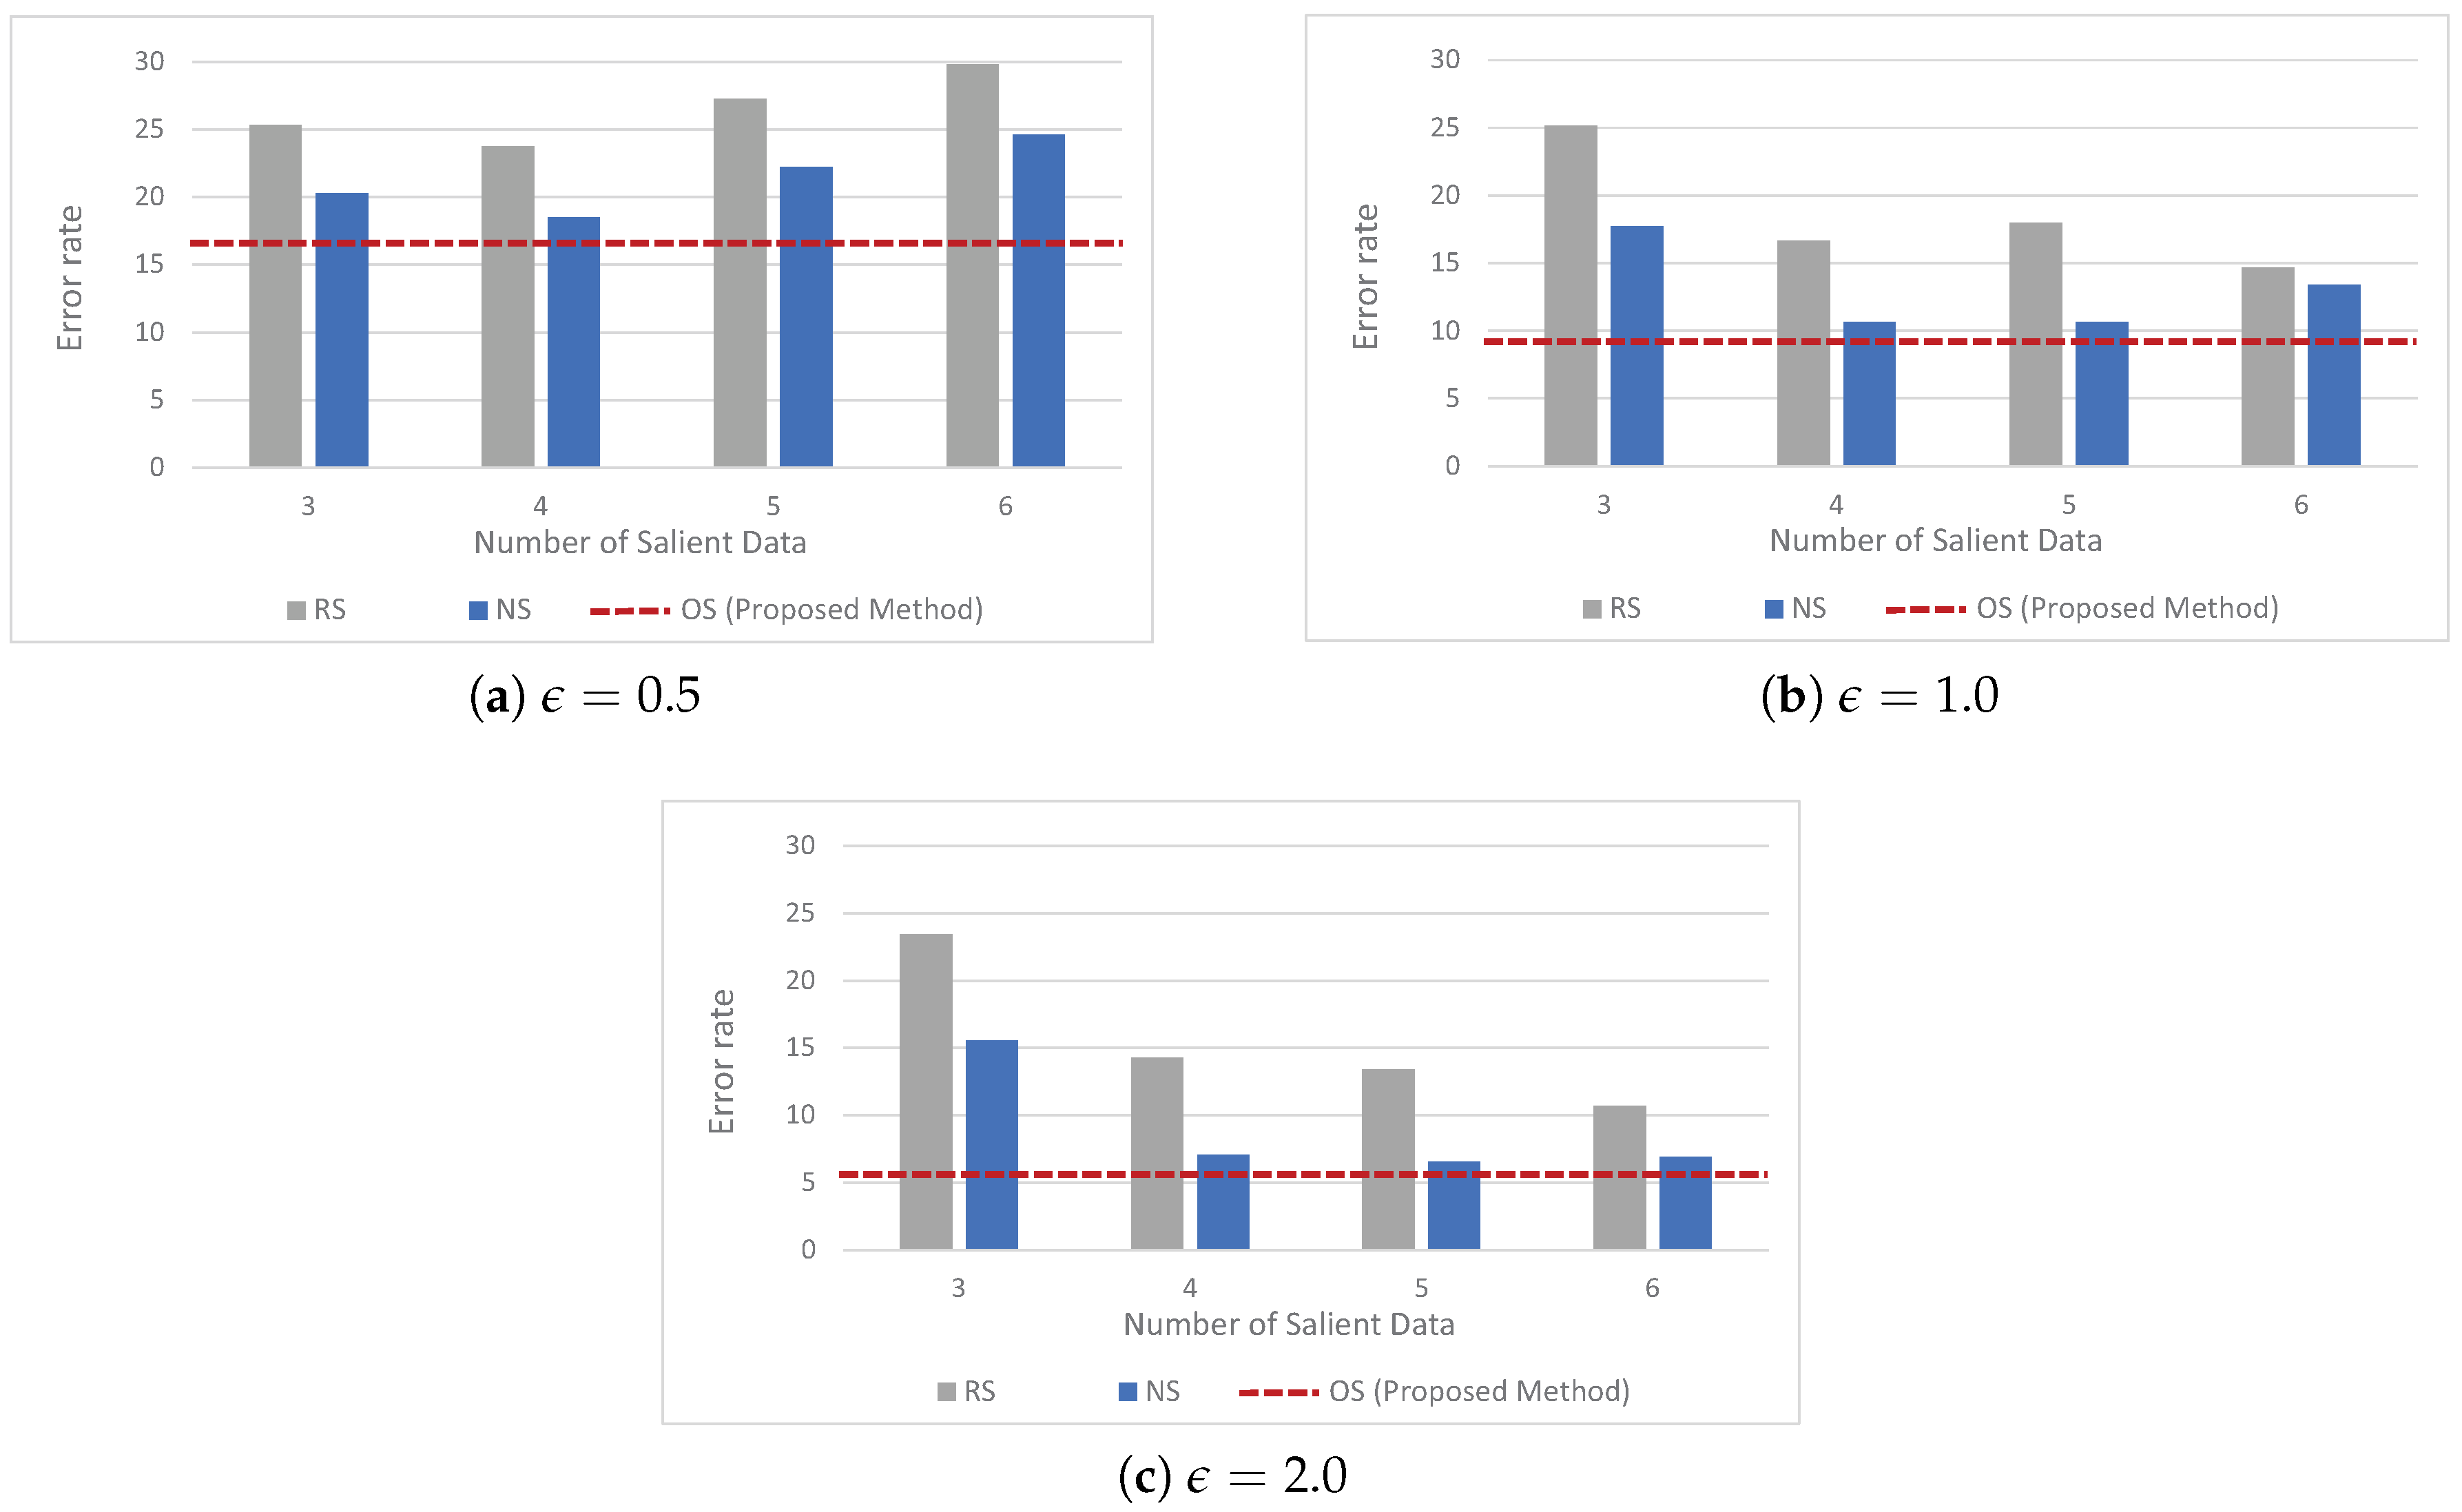
We also evaluated the effectiveness of the proposed method for identifying a salient data set, as presented in Section 4.1. Figure 5 shows the average error rates for the three alternative methods, R S , N S , and O S . In this figure, the y-axis corresponds to the error rate and the x-axis represents the number of salient data that are extracted from the given health data. In the experiments, the privacy budget ϵ varied from 0.5 to 2, while the size of the dataset was fixed to 290 × 10 2 . Furthermore, for the random and non-optimal selection methods, which require the number of salient data that are extracted from the given health data to be predefined, the number of extracted salient data varies from 3 to 6. We note that, unlike these two methods, for the proposed method explained in Section 4, the optimal number of salient data, which minimize the expected error incurred by using LDP, is determined by Algorithm 1.
Key observations based on Figure 5 can be summarized as follows: as the privacy budget, ϵ , decreases, the error rate increases. This is because, as the privacy budget decreases, noises added by the wearable device-side increase, which, in turn, leads to decreased estimation accuracy at the data collection server-side. These evaluation results are consistent with the ones presented in Table 1. N S , which leverages the first step of Algorithm 1, outperforms R S for all privacy budgets. These results indicate that the first phase in Algorithm 1 is able to effectively search the salient data sets that best represent the original health data. More importantly, the experimental results show that the proposed scheme (represented as red dotted lines) delivers the best performance for all privacy budgets. These results verify that the method presented in this paper is able to effectively identify a salient data set from given health data by considering the expected error caused by the perturbation mechanism of LDP.

6. Conclusions

In this paper, we developed methods to collect sensitive health data by using wearable devices in a privacy-preserving manner by leveraging LDP. The method proposed here first identifies a small number of salient data that best represents the original health data, and then reports the identified salient data to the data aggregation server under LDP instead of reporting the entire collection of health data. Compared with the naive approach, the proposed scheme is able to reduce the error induced by the perturbation phase of LDP. The experimental results show that the proposed method achieves a significant improvement in the estimated accuracy when compared with the naive solutions. Furthermore, the results verify that an effective tradeoff between the level of privacy protection and the accuracy of aggregate statistics can be achieved with the proposed approach.

Author Contributions

J.W.K. designed the algorithm and wrote the manuscript. S.-M.M. implemented the algorithm and conducted experiments. S.-u.K. and B.J. analyzed the experimental results and reviewed the manuscript. All authors have read and agreed to the published version of the manuscript.

Funding

This research was supported by the Institute of Information and communications Technology Planning and Evaluation (IITP) grant funded by the Korea government (MSIT) (No.2018-0-00269, A research on safe and convenient big data processing methods) and the Basic Science Research Program through the National Research Foundation of Korea (NRF-2020R1F1A1072622).

Conflicts of Interest

The authors declare no conflict of interest.

References

  1. Dwork, C. Differential privacy. In Proceedings of the International Conference on on Automata, Languages and Programming, Venice, Italy, 9–16 July 2006; pp. 1–12. [Google Scholar]
  2. Dwork, C.; McSherry, F.; Nissim, K.; Smith, A. Calibrating noise to sensitivity in private data analysis. In Lecture Notes in Computer Science, Proceedings of the Third Conference on Theory of Cryptography, New York, NY, USA, 4–7 March 2006; Springer: Berlin/Heidelberg, Germany, 2006. [Google Scholar]
  3. Erlingsson, U.; Pihur, V.; Korolova, A. RAPPOR: Randomized aggregatable privacy-preserving ordinal response. In Proceedings of the ACM SIGSAC Conference on Computer and Communications Securitys, Scottsdale, AZ, USA, 3–7 November 2014; pp. 1054–1067. [Google Scholar]
  4. Wang, T.; Blocki, J.; Li, N.; Jha, S. Locally differentially private protocols for frequency estimation. In Proceedings of the 26th USENIX Conference on Security Symposium, Berkeley, CA, USA, 16–18 August 2017. [Google Scholar]
  5. Bassily, R.; Smith, A. Local, private, efficient protocols for succinct histograms. In Proceedings of the Forty-Seventh Annual ACM Symposium on Theory of Computing, Portland, OR, USA, 14–17 June 2015. [Google Scholar]
  6. Nguyen, T.T.; Xiao, X.; Yang, Y.; Hui, S.C.; Shin, H.; Shin, J. Collecting and Analyzing Data from Smart Device Users with Local Differential Privacy. 2016. Available online: https://arxiv.org/abs/1606.05053 (accessed on 14 July 2020).
  7. Differential Privacy Team, Apple. Learning with Privacy at Scale. 2018. Available online: https://machinelearning.apple.com/docs/learning-with-privacy-at-scale/appledifferentialprivacysystem.pdf (accessed on 14 July 2020).
  8. Tang, J.; Korolova, A.; Bai, X.; Wang, X.; Wang, X. Privacy Loss in Apple’s Implementation of Differential Privacy on MacOS 10.12. 2017. Available online: https://arxiv.org/abs/1709.02753 (accessed on 14 July 2020).
  9. Ding, B.; Kulkarni, J.; Yekhanin, S. Collecting telemetry data privately. In Proceedings of the International Conference on Neural Information Processing Systems, Long Beach, CA, USA, 4–9 December 2017; pp. 3574–3583. [Google Scholar]
  10. Missen, K.; Porter, J.E.; Raymond, A.; de Vent, K.; Larkins, J.A. Adult deterioration detection system (ADDS): An evaluation of the impact on MET and code blue activations in a regional healthcare service. Collegian 2018, 25, 157–161. [Google Scholar] [CrossRef]
  11. El-Bendary, M.F.N.; Ramadan, R.; Hassanien, A. Wireless Sensor Networks: A Medical Perspective; CRC Press, Taylor and Francis Group: Boca Raton, FL, USA, 2013; pp. 713–732. [Google Scholar]
  12. Navarro, K.F.; Lawrence, E.; Lim, B. Medical MoteCare: A distributed personal healthcare monitoring system. In Proceedings of the International Conference on eHealth, Telemedicine, and Social Medicine, Cancun, Mexico, 1–7 February 2009. [Google Scholar]
  13. Manogaran, G.; Varatharajan, R.; Lopez, D.; Kumar, P.M.; Sundarasekar, R.; Thota, C. A new architecture of internet of things and big data ecosystem for secured smart healthcare monitoring and alerting system. Future Gener. Comput. Syst. 2018, 82, 375–387. [Google Scholar] [CrossRef]
  14. Taelman, J.; Vandeput, S.; Spaepen, A.; VanHuffel, S. Influence of mental stress on heart rate and heart rate variability. In IFMBE Proceedings, Proceedings of the International Federation for Medical and Biological Engineering, Antwerp, Belgium, 23–27 November 2008; Springer: Berlin/Heidelberg, Germany, 2009. [Google Scholar]
  15. Fisher, R.; Smailagic, A.; Sokos, G. Monitoring Health Changes in Congestive Heart Failure Patients Using Wearables and Clinical Data. In Proceedings of the IEEE International Conference on Machine Learning and Applications, Cancun, Mexico, 18–21 December 2017. [Google Scholar]
  16. Warburton, D.E.R.; Bredin, S.S.D. Health benefits of physical activity: A strengths-based approach. J. Clin. Med. 2019, 8, 2044. [Google Scholar] [CrossRef] [PubMed] [Green Version]
  17. Ruegsegger, G.N.; Booth, F.W. Health benefits of exercise. In Cold Spring Harbor Perspectives in Medicine; Cold Spring Harbor Laboratory Press: Cold Spring Harbor, NY, USA, 2018. [Google Scholar]
  18. Hong, Y.J.; Kim, I.J.; Ahn, S.C.; Kim, H.G. Activity recognition using wearable sensors for elder care. In Proceedings of the Second International Conference on Future Generation Communication and Networking, Hainan Island, China, 13–15 December 2008. [Google Scholar]
  19. Jalal, A.; Quaid, M.A.K.; Hasan, A.S. Wearable sensor-based human behavior understanding and recognition in daily life for smart environments. In Proceedings of the International Conference on Frontiers of Information Technology, Islamabad, Pakistan, 17–19 December 2018. [Google Scholar]
  20. Altun, K.; Barshan, B.; Tuncel, O. Comparative study on classifying human activities with miniature inertial and magnetic sensors. Pattern Recognit. 2010, 43, 3605–3620. [Google Scholar] [CrossRef]
  21. Melillo, P.; Castaldo, R.; Sannino, G.; Orrico, A.; Pietro, G.D.; Pecchia, L. Wearable technology and ECG processing for fall risk assessment, prevention and detection. In Proceedings of the Annual International Conference of the IEEE Engineering in Medicine and Biology Society, Milan, Italy, 25–29 August 2015. [Google Scholar]
  22. Hamatani, T.; Uchiyama, A.; Higashino, T. HeatWatch: Preventing heatstroke using a smart watch. In Proceedings of the IEEE International Conference of Pervasive Computing and Communications Workshops, Kona, HI, USA, 13–17 March 2017. [Google Scholar]
  23. Camara, C.; Peris-Lopez, P.; Tapiado, J.E. Security and privacy issues in implantable medical devices: A comprehensive survey. J. Biomed. Inform. 2015, 55, 272–289. [Google Scholar] [CrossRef] [PubMed] [Green Version]
  24. Hassan, M.U.; Rehmani, M.H.; Chen, J. Differential privacy techniques for cyber physical systems: A survey. IEEE Commun. Surv. Tutor. 2020, 22, 746–789. [Google Scholar] [CrossRef] [Green Version]
  25. Beaulieu-Jones, B.K.; Yuan, W.; Finlayson, S.G.; Wu, Z.S. Privacy-preserving distributed deep learning for clinical data. arXiv 2018, arXiv:1812.01484. [Google Scholar]
  26. Mohammed, N.; Barouti, S.; Alhadidi, D.; Chen, R. Secure and private management of healthcare databases for data mining. In Proceedings of the IEEE International Symposium on Computer-Based Medical Systems (CBMS), Sao Carlos, Brazil, 22–25 June 2015; pp. 191–196. [Google Scholar]
  27. Raisaro, J.L.; Troncoso-Pastoriza, J.; Misbach, M.; Sousa, J.S.; Pradervand, S.; Missiaglia, E.; Michielin, O.; Ford, B.; Hubaux, J.-P. MedCo: Enabling secure and privacy-preserving exploration of distributed clinical and genomic data. IEEE/ACM Trans. Comput. Biol. Bioinform. 2019, 16, 1328–1341. [Google Scholar] [CrossRef] [PubMed] [Green Version]
  28. Raisaro, J.L.; Choi, G.; Pradervand, S.; Colsenet, R.; Jacquemont, N.; Rosat, N.; Mooser, V.; Hubaux, J.-P. Protecting privacy and security of genomic data in i2b2 with homomorphic encryption and differential privacy. IEEE/ACM Trans. Comput. Biol. Bioinform. 2018, 15, 1413–1426. [Google Scholar] [CrossRef] [PubMed]
  29. Tang, W.; Ren, J.; Deng, K.; Zhang, Y. Secure data aggregation of lightweight e-healthcare IoT devices with fair incentives. IEEE Internet Things J. 2019, 6, 8714–8726. [Google Scholar] [CrossRef]
  30. Guan, Z.; Lv, Z.; Du, X.; Wu, L.; Guizani, M. Achieving data utility-privacy tradeoff in internet of medical things: A machine learning approach. Future Gener. Comput. Syst. 2019, 98, 60–68. [Google Scholar] [CrossRef] [Green Version]
  31. Bassily, R.; Nissim, K.; Stemmer, U.; Thakurta, A. Practical locally private heavy hitters. In Proceedings of the International Conference on Neural Information Processing Systems, Long Beach, CA, USA, 4–9 December 2017; pp. 2285–2293. [Google Scholar]
  32. Bun, M.; Nelson, J.; Stemmer, U. Heavy hitters and the structure of local privacy. In Proceedings of the ACM SIGMOD-SIGACT-SIGAI Symposium on Principles of Database Systems, Houston, TX, USA, 10–15 June 2018; pp. 435–447. [Google Scholar]
  33. Fanti, G.; Pihur, V.; Erlingsson, U. Building a RAPPOR with the unknown: Privacy-preserving learning of associations and data dictionaries. In Proceedings of the Privacy Enhancing Technologies Symposium, Darmstadt, Germany, 19–22 July 2016; pp. 41–61. [Google Scholar]
  34. Cormode, G.; Kulkarni, T.; Srivastava, D. Marginal Release Under Local Differential Privacy. In Proceedings of the International Conference on Management of Data, Houston, TX, USA, 10–15 May 2018; pp. 131–146. [Google Scholar]
  35. Xu, C.; Ren, J.; She, L.; Zhang, Y.; Qin, Z.; Ren, K. EdgeSanitizer: Locally differentially private deep inference at the edge for mobile data analytics. IEEE Internet Things J. 2019, 6, 5140–5151. [Google Scholar] [CrossRef]
  36. Kim, J.W.; Kim, D.H.; Jang, B. Application of local differential privacy to collection of indoor positioning data. IEEE Access 2018, 6, 4276–4286. [Google Scholar] [CrossRef]
  37. Kim, J.W.; Jang, B. Workload-aware indoor positioning data collection via local differential privacy. IEEE Commun. Lett. 2019, 23, 1352–1356. [Google Scholar] [CrossRef]
  38. Kim, J.W.; Lim, J.H.; Moon, S.M.; Jang, B. Collecting health lifelog data from smartwatch users in a privacy-preserving manner. IEEE Trans. Consum. Electron. 2019, 65, 369–378. [Google Scholar] [CrossRef]
  39. Shokri, R.; Shmatikov, V. Privacy-preserving deep learning. In Proceedings of the ACM SIGSAC Conference on Computer and Communications Security, Denver, CO, USA, 12–16 October 2015; pp. 1310–1321. [Google Scholar]
  40. Gong, M.; Feng, J.; Xie, Y. Privacy-enhanced multi-party deep learning. Neural Netw. 2020, 121, 484–496. [Google Scholar] [CrossRef] [PubMed]
  41. Wang, T.; Li, N.; Jha, S. Locally differentially private frequent itemset mining. In Proceedings of the IEEE Symposium on Security and Privacy, San Francisco, CA, USA, 20–24 May 2018; pp. 127–143. [Google Scholar]
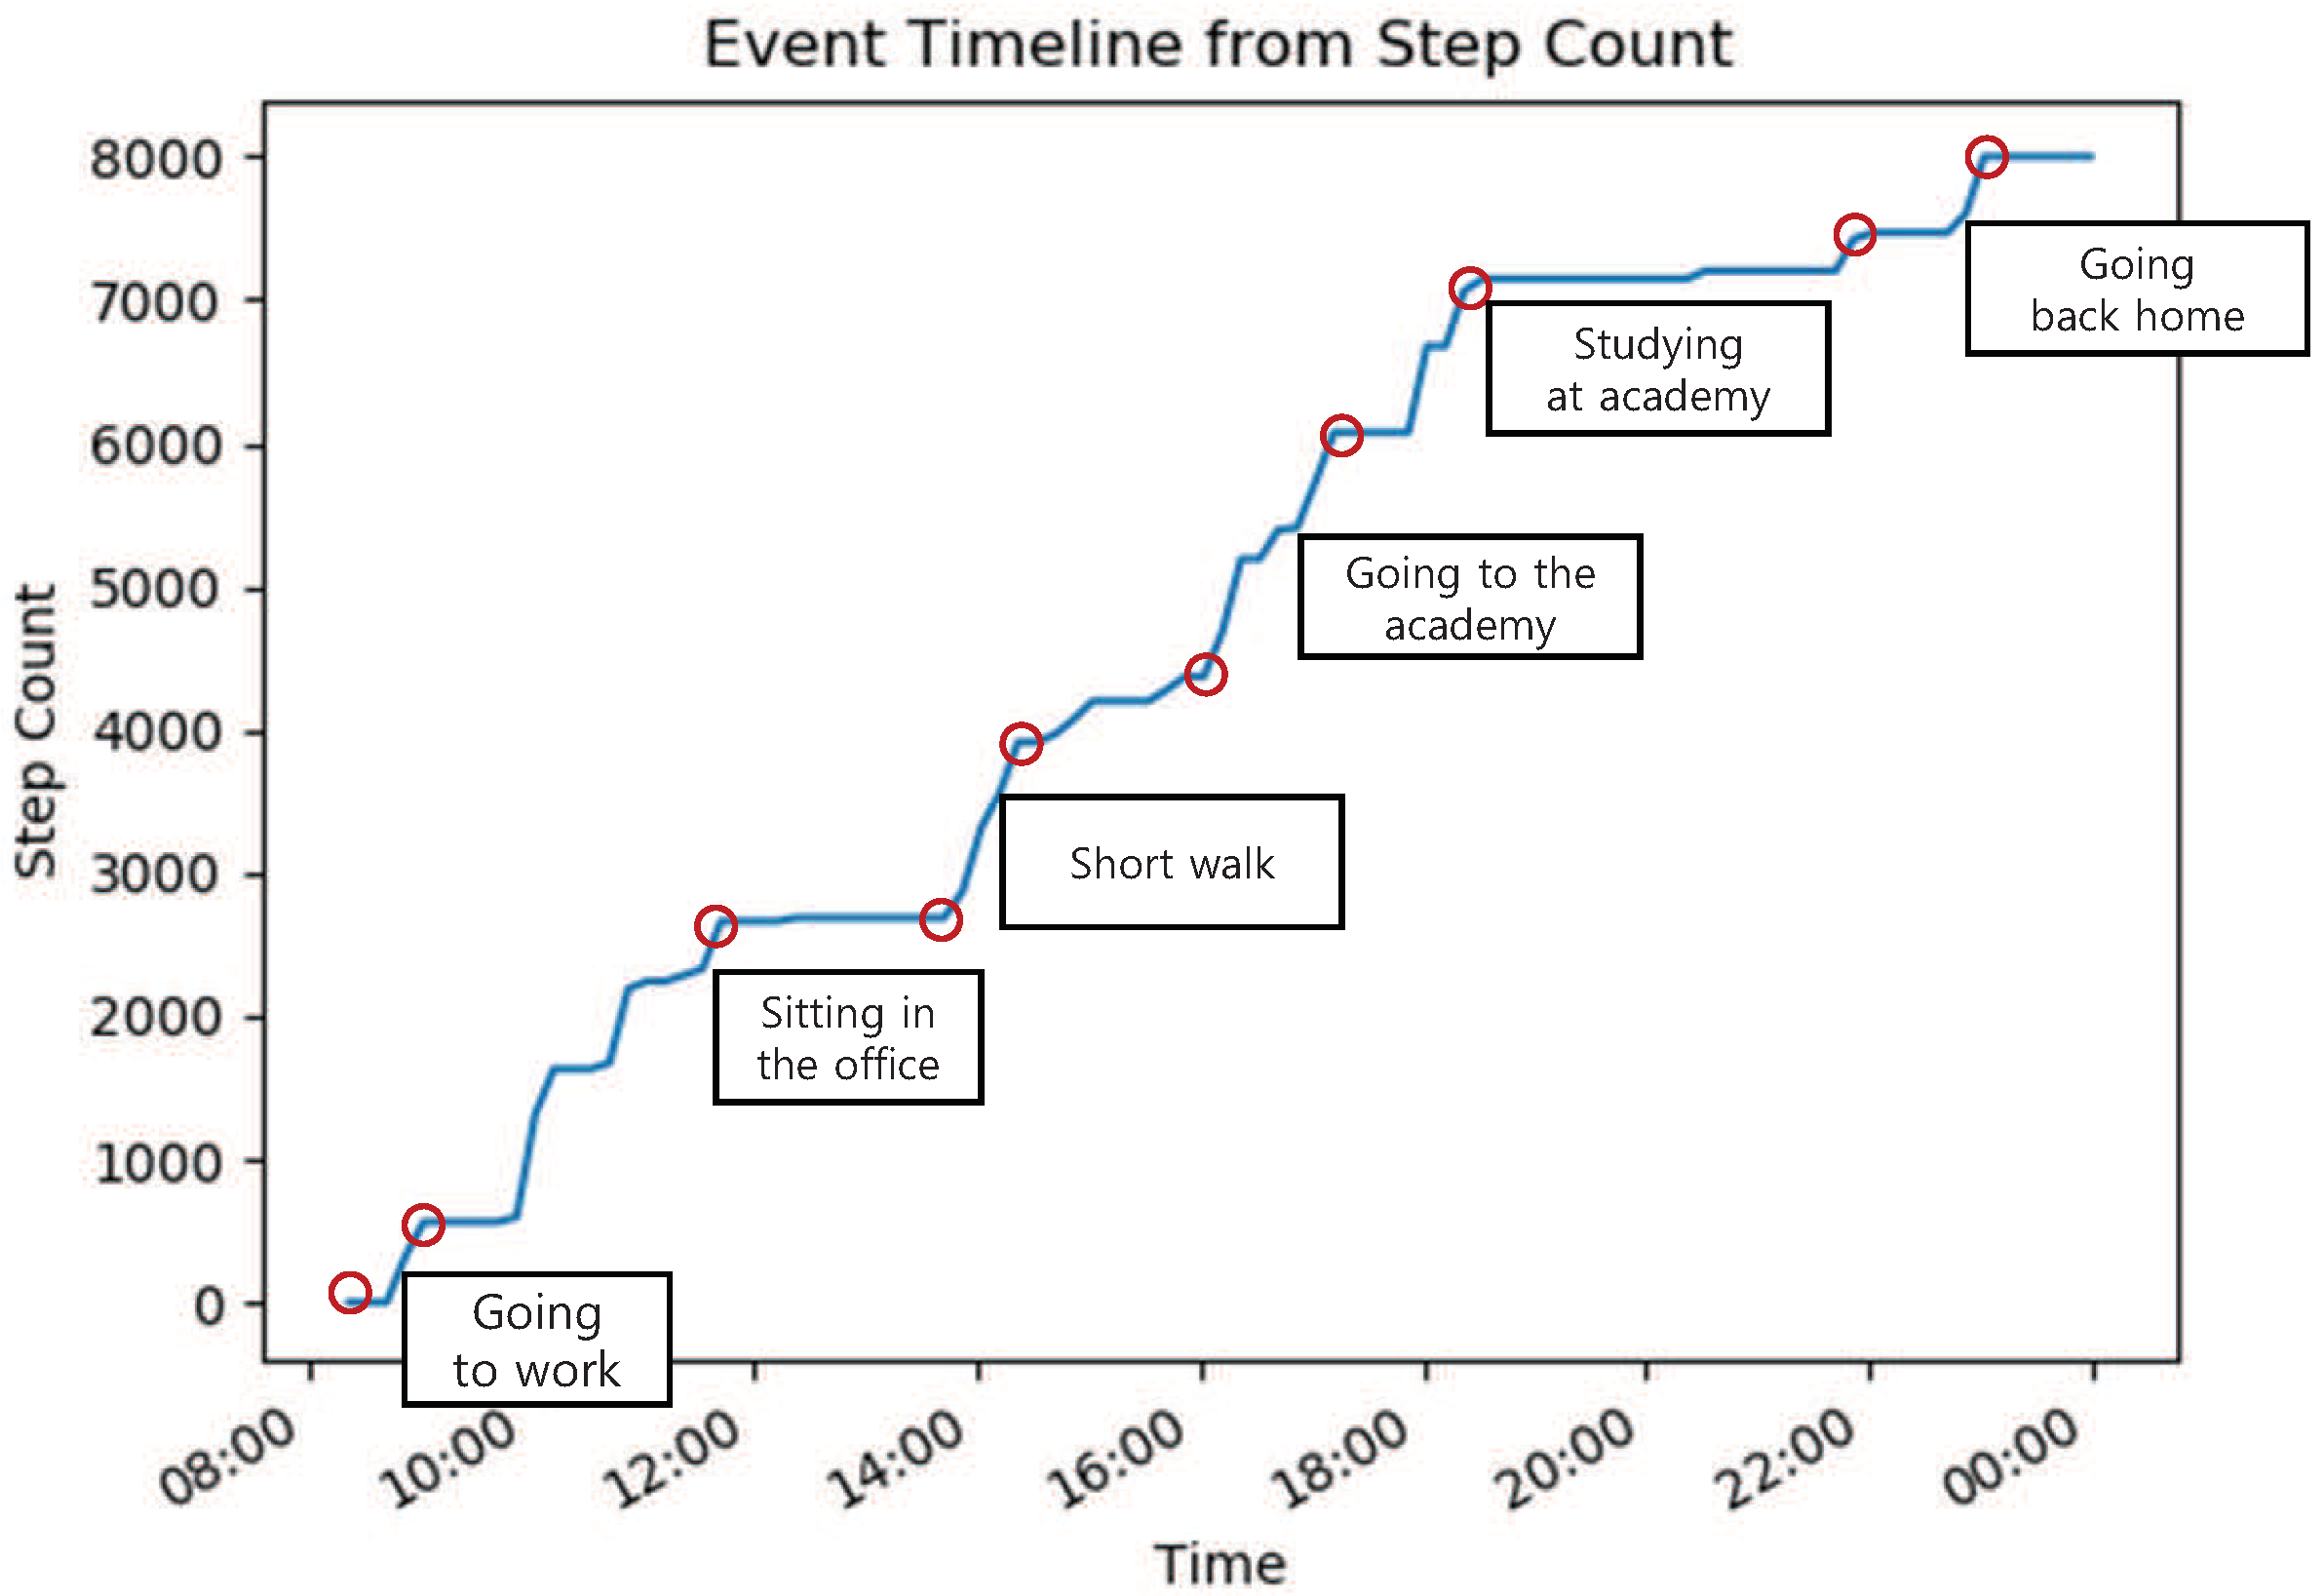
Figure 1. An example of the change in daily cumulative step-count per hour that is measured by a wearable device.
Applsci 10 06396 g001
Figure 2. Example of computing the distance between the original health data and the salient data set.
Applsci 10 06396 g002
Figure 3. Example of computing the error by the function EstimateError_by_LDP().
Applsci 10 06396 g003
Figure 4. Actual vs estimated aggregate health data sequences for various data sizes ( ϵ = 1.0 ).
Applsci 10 06396 g004
Figure 5. Average error rates for three alternative methods, R S , N S , and O S (data size = 290 × 10 2 ).
Applsci 10 06396 g005
Table 1. Comparison of average error rates for varying privacy budget ϵ and data sizes.
Data SizeNSOS (Proposed Method)
ϵ = 0 . 5 ϵ = 1 ϵ = 2 ϵ = 0 . 5 ϵ = 1 ϵ = 2
290 × 10 1 240,843.99119,103.2259,302.83471.28210.77143.62
290 × 10 2 7604.893783.731890.8717.209.185.57