Abstract
Fill compaction in the construction of Geosynthetic Reinforced Soil (GRS) mass is typically performed by operating a vibratory or roller compactor, which in turns imposed a compaction load in direction perpendicular to the wall face. The compaction process resulted in the development of the so-called compaction-induced stress (CIS), which may subsequently increase the stiffness and strength of the fill material. Compaction process is normally simulated using one of the following compaction procedures—(i) a uniformly distributed load acting on the top surface of each soil lift, (ii) a uniformly distributed load acting on the top and bottom surface of each soil lift, and (iii) a moving strip load with different width. Uncertainties such as compaction procedures, compaction and surcharge loads led to the disparity in studying the mechanism of GRS mass. This paper aimed to study the impact of compaction load, compaction procedure, surcharge load and CIS on the stress-deformation behavior of GRS mass via the simulation of a 2 m high Soil Geosynthetic Composite (SGC) mass and a 6 m high GRS mass. The results were examined in terms of reinforcement strains, wall lateral displacements, and net CIS. Results from the analysis show the important impacts of compaction conditions on the stress-deformation behavior of SGC mass and the CIS.
1. Introduction
Reinforced soil walls was introduced some sixty years ago in the 1960s; the technology incorporated metallic strips in the compacted fill together with a wall face to gain and maintain stability. Polymeric geosynthetics was later replaced the metallic strips as reinforcement. The reinforced soil walls are designed by considering the strips as quasi-tieback tension members, and are commonly designed using the design methods such as the American Association of State Highway Transportation Officials Specifications (AASHTO) ([1]), Design and Construction Guidelines of Federal Highway Administration (FHWA) ([2]), Design Manual of National Concrete Masonry Association (NCMA) ([3]), and so on.
Geosynthetic-Reinforced Soil (GRS) mass is normally comprised of soil and layers of geosynthetic reinforcement; GRS is, thus, not a uniform mass. The significant beneficial effect of placing sheet reinforcements have gained increasing attention in recent years. Early studies mainly focused on the influence of reinforcement spacing in actual construction and results validated by field-scale experiments. For example, Reference [4] performed large unconfined compression tests with non-woven geotextiles to evaluate the behavior of reinforced soil under various spacings; Reference [5] reported the results of five GRS mini piers experiments performed to appraise the effect of reinforcement spacing and reinforcement strength on the performance of a GRS mass; Reference [6] performed five field-scale soil-geosynthetic composite (SGC) tests to assess the effect of reinforcement spacing and reinforcement strength on the performance of the SGC mass. These experiments not only revealed that spacing plays a much greater role than the strength of the reinforcement, but also established that the behavior of reinforced soil with closely spaced geosynthetic reinforcement can be accurately characterized as a Soil Geosynthetic Composite (SGC). The stress-deformation behavior of a GRS mass can be studied in the laboratory via a sufficiently large-size specimen of soil and reinforcement, which is capable of producing a representative Soil-Geosynthetic Composite (SGC) in a plane strain condition.
When a soil mass is subjected to an additional vertical load, it will generally resulted in an increase in the vertical and horizontal stresses in the soil mass. If the additional vertical load is subsequently removed, the increase in the vertical stress would diminish to a very small value or zero, the increase in horizontal stress might, however, be only diminished slightly. The net increase in the horizontal stress that “remained” in the soil mass is commonly called the “lock-in” lateral stress. An increase in vertical load followed by its subsequent removal is usually encountered in fill compaction during the construction of GRS mass. The “lock-in” lateral stress due to such compaction is defined here as the “Compaction-Induced Stress” (CIS).
The CIS in a soil mass has been the subject of study by many authors. For instance, Reference [7] presented a theory to calculate compaction-induced residual lateral earth pressures of a frictionless, rigid, vertical and non-yielding wall; Reference [8] analytically examined the effects of compaction at various levels of fill behind a retaining wall; Reference [9] used a -based nonlinear and a -based bi-linear models to simulate compaction operation of GRS mass and obtained good agreement between the simulated CIS results and the measured data of unreinforced earth retaining walls; subsequently, References [10,11] suggested that CIS could be calculated using either the simplified bi-linear model, or the nonlinear model but with the aid of finite element analysis; based on the studies of References [9,10], References [12,13] used a simplified stress path that was developed based on—(i) the model introduced by Reference [9], (ii) the companion hand-calculation procedure for an unreinforced soil mass by Reference [10], and (iii) the concept of average stress of SGC behavior proposed by Reference [14], to demonstrate that the CIS at any given location, as a result of multiple passes of a compactor moving towards or moving away from that location, could be estimated by applying the compaction load directly at the location under review.
Numerical methods have been extensively utilized for analyzing the behavior of GRS walls. References [15,16] numerically simulated the response of a full scale GRS modular block retaining wall undertaken at Royal Military College and compared the simulated response with the physical data obtained from project; a series of paper by References [17,18,19,20] were aimed to validate the numerical procedures of modeling CIS and investigate the combined effects of different controlling factors (i.e., wall height, stresses induced during backfill compaction, reinforcement stiffness, toe conditions, and facing stiffness) on the response of GRS walls under working stress conditions; Reference [21] predicted the performance of two well instrumented wrapped-face walls reinforced with either a welded steel wire mesh or a biaxial polypropylene geogrid, the reinforcement was represented by a general hyperbolic (nonlinear) axial load-strain-time model and the result for the welded steel wire mesh wall showed a better agreement with the measured data than that of the biaxial polypropylene geogrid wall. If aided by experimental and field measured data, the numerical methods have many advantages such as obtaining more comprehensive results, and investigating the effects of various parameters, which are difficult or costly to achieve in the laboratory and field tests. Two-dimensional (2D) numerical studies have been conducted by References [6,12,22,23] to evaluate the composite behavior of the GRS wall constructed by Reference [6] under static loading condition. In particular, Reference [6] conducted a series of finite element analyses to examine the effect of specimen dimensions on the resulting global stress-strain and volume change relationships of SGC mass with the aim to determine the proper dimensions of a generic SGC that will produce load-deformation behavior sufficiently close to that of a large SGC mass. Reference [12] compared the hand-calculated compaction pressure of a 6-m high SGC mass obtained from their proposed analytical CIS model with that obtained from the finite element analysis; Reference [22] performed a series of parametric study to examine the effects of reinforcement spacing, reinforcement stiffness, and soil stiffness on volume change behavior of a SGC mass; while Reference [23] numerically studied the effects of CIS, reinforcement strength, and soil dilation angle on the stress-deformation behavior of a SGC mass.
Many studies (see, for examples, References [6,12,13,15,16,21,24,25]) have evaluated the CIS due to fill compaction by simply simulating the compaction load as a uniform load applied at the top surface of each newly placed fill layer as the wall was constructed from the bottom up. Mirmoradi and Ehrlich ([18,20]) have, however, tried to evaluate the CIS due to compaction by applying a uniformly distributed load at the top and bottom surfaces of each soil layer. The applied compaction load was removed prior to the placement of the next soil lift. The compaction energy used in these simulation was very low; as a result, the magnitude of the CIS was also very small, resulting in an insignificant effect of CIS on the reinforcement global stress-strain relationship.
Reference [26] suggested that the equivalent compaction load approach used in the simulation of the GRS walls of Reference [20] could likely be affected the compaction load, compactor type, soil type, soil placement condition, fill thickness, boundary conditions, and the soil model employed in the analysis. They further elaborated that CIS could be accurately assessed by simulating the compaction load as a point or limited-area load at location considered, not as a uniformly distributed load over the entire top surface or a wide strip load on the newly placed soil lift. These uncertainties led to the disparity in the application of the equivalent compaction load approach.
The objective of this study is to examine the impacts of several factors such as compaction procedures, compaction load, and surcharge load on the stress-deformation behavior and the development of CIS in GRS mass. The objective is achieved by mean of numerical simulation. A fully instrumented 2 m high SGC mass will first be used to calibrate the numerical procedures and more comprehensive results be obtained by incorporating the above factors into current parametric study. Finally, the mechanism of CIS will be investigated via the simulation of a hypothetical 6 m high GRS mass.
2. Compaction-Induced Stress
During the construction of GRS walls, fill compaction is typically carried out by operating a vibratory or roller compactor, which in turns imposed a compaction load to the newly placed soil lift in the form of a moving point or a moving strip load. References [6,12] used the stress path proposed by References [9,10,11] to show that the CIS at any given location, as a result of multiple passes of a compactor moving towards or moving away from the wall, could be assessed by applying a compaction load directly over the location considered.
When a soil mass is subjected to a surcharge, there would generally be an increase in the vertical and horizontal stresses in the soil mass. When a compaction load is added to I-I (Figure 1a), its horizontal stress at depth z would increase corresponding to the stress path AB (Figure 1b). As the compaction load moves away from I-I, the horizontal stress would begin to decrease following the stress path BC. AC is thus the increment of the horizontal stress after the compaction load is removed. This increase in horizontal stress and, hence, the confining pressure would lead to an increase in the stiffness and strength of the soil mass ([6,12]).
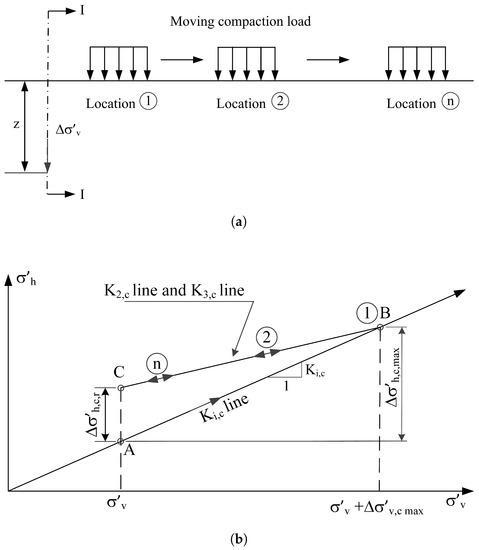
Figure 1.
(a) Schematic diagram of a moving compaction load. (b) Stress paths of a soil element at
depth z as the compaction load moves away from I-I.
References [6,12] proposed a procedure to calculate the increase in lateral stress in a reinforced soil mass caused by backfill compaction:
where is the maximum increase of the “vertical” stress (point B in Figure 1b) due to fill compaction, which can be calculated using the Westergaard solution ([27]), for simplicity it is taken as the compaction load q in this study; is the coefficient of lateral earth pressure of a GRS mass for initial loading, which is generally taken as:
where ([12]); is the stiffness of the soil (kPa), and is, respectively, the stiffness (kN/m) and spacing (m) of the reinforcement. The value of F has been given by References [9,28] using:
where and is the over-consolidation ratio, and the internal friction angle, respectively.
The lower and upper limits of the compaction-induced stress for “un-reinforced” soil has been proposed by Reference [29] as:
where is the as-compacted unit weight of the fill, and Q is the maximum force per unit length of the compactor due to the combined action of gravity and cyclic accelerations. The compaction stresses should not then exceed the larger of for the free field, and for the zone near the wall ([29]). Reference [26] has recommended the use of Bolton’s upper and lower limits of CIS value could be adopted for the preliminary analysis and design of GRS mass structures.
Table 1 and Table 2, respectively, summarizes the CIS value of the various types of light soil compacting equipment (vibratory plate compactor), and heavy soil compacting equipment (vibratory roller compactor), as reported in References [6,19,24,26,30] and equipment’s manufactures ([31,32]).

Table 1.
Data for vibratory plate soil compactor (light compaction).

Table 2.
Data for vibratory roller soil compactors (heavy compaction).
It can be seen that the ranges of the CIS values for “un-reinforced” fill for the light compaction vibratory plate compactor and the heavy compaction vibratory roller compactor fall between: 14.3∼28.6 kPa, and 15.3∼30.6 kPa, respectively. The upper limit of the CIS values of 28.3 kPa (for light compaction equipment) and 30.3 kPa (for heavy compaction equipment) corresponded, respectively, to an equivalent total force per unit width Q of 53.2 kN/m and 61 kN/m. Note that, these CIS values corresponding to equipment with plate or roller width w ranges from 0.25 to 0.75 m, and from 0.391 to 2.080 m, for vibratory plate soil compactor and vibratory roller soil compactor, respectively. Clearly, for geosynthetic reinforced soil (GRS), the values of the compaction-induced stresses are likely to be higher.
3. Numerical Analyses
Numerical Model and Verification
A large-scale SGC mass specimen (the other two sides were restrained by two steel tubing frames with transparent plexiglass panels), reinforced by nine sheet of single-sheet Geotex 4 × 4 with a vertical spacing of 0.2 m has been experimentally studied by Reference [6] (Figure 2a). The data monitored from this full-scale SGC mass have been utilized repeatedly for calibrating numerical models (see, for examples, References [6,12,13,22,23,25,33,34]).
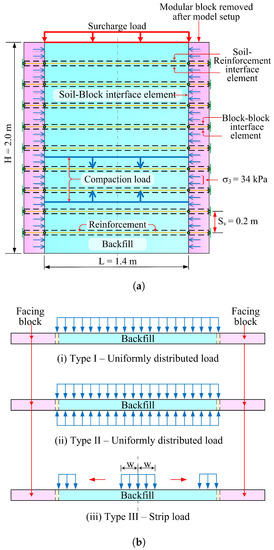
Figure 2.
(a) Schematic diagram and configuration of Soil-Geosynthetic Composite (SGC) mass. (b) Simulated compaction procedures adopted for SGC mass in FE analysis.
The SGC mass specimen was 2 m high and 1.4 m wide, giving an ratio of 0.7. The fill was made of a crushed Diabase from a source near Washington D.C. It has a maximum particle size of 33 mm, and classified as well-graded gravel (GW) according to the Unified Soil Classification System (USCS). The results of large-size triaxial tests, with specimen diameter of 150 mm and specimen height of 300 mm, indicated that the backfill has a peak internal angle of friction of 50 and an apparent cohesion of 70 kPa, for tests conducted under four different confining pressures ranged between 35 kPa and 210 kPa.
Polypropylene (PP) woven geotextile was used as the reinforcement; the geotextile has an ultimate tensile strength of 70 kN/m, a breakage strain of about 12%, and an axial stiffness of 1000 kN/m at 1% strain, which were obtained from a “wide width tensile test” of a geotextile specimen ([35]). The backfill was placed and compacted to 98% maximum dry density into a 0.2 m thick layer. Hollow concrete blocks (397 mm × 194 mm × 194 mm) were used as formwork during model setup in the specimen preparation stage; they were, however, removed before the surcharge application stage. The entire surface area of the test specimen was vacuum-sealed with a 0.5 mm thick latex membrane, and a prescribed confining pressure of 34 kPa was applied to the GRS walls specimen by mean of vacuuming.
A hydraulic-jack, fastened on a 30 cm thick concrete pad, was mounted on the top surface of the specimen. Several linear variable differential transformers (LVDTs) and digital dial indicators were installed on top of the concrete pad to monitor the vertical movement of the SGC mass during shearing. LVDTs and digital dial indicators were also installed along the open face of the SGC mass to measure the lateral movement of the mass. The SGC mass was then sheared gradually until failure; the vertical failure stress and vertical failure strain observed was approximately 2700 kPa and 6.75%, respectively.
Two-dimensional FE program, Plaxis2D [36], was used in the numerical analysis. Figure 2b illustrates the numerical geometry, loading conditions and the interface elements employed in the SGC walls mass simulation. The numerical and the experimental models have the same geometrical configuration. In the FE model, the soil and the facing block were represented by 15-noded triangular elements, which provides a fourth-order interpolation for displacements, and the numerical integration involves twelve Gaussian stress points ([36]). The geotextile was represented by a 5-noded geogrid (line) elements with two translational degrees of freedom in each node (), while the axial forces are evaluated at the Newton-Cotes stress points, which coincide with the nodes.
The stress/strain behavior of the granular backfill material was modeled using the second-order hyperbolic elasto-plastic hardening soil model ([37]); the model computes deformation as the sum of elastic strain and plastic strain, which are generated during deviatoric loading, while the plastic volumetric strain in isotropic compression is simulated by introducing cap hardening in the model.
The interactions between the backfill/geosynthetic, backfill/facing block, and block/block were simulated using the zero-thickness interfaces elements, which follow Mohr-Coulomb constitutive behaviour. The parameters for the interface Mohr-Coulomb constitutive model are: friction angle (), cohesion (), dilation angle (), shear modulus (), Poisson’s ratio (default value = 0.45), and oedometer modulus () [36]. The degree of bonding of the interface can be set directly using a strength/stiffness reduction factor :
where: is the soil apparent cohesion; is the soil friction angle; is the soil dilatancy angle, and is the soil shear modulus. All the input parameters involved in this study are tabulated in Table 3. The default value of is 1.0, which represents a fully bonded interface. The value of the interface property between soil–reinforcement was taken to be 0.8 in this research.

Table 3.
Input parameters for finite element analyses.
The FE analysis was conducted in two stages, that is, filling and compaction stage, and surcharge application at the top surface of the SGC mass stage. The wall was constructed in stages, that is, 0.2 m thick soil lifts were placed and compacted until the final wall height of 2 m was achieved. Compaction of each soil lift was simulated by applying an equivalent compaction load.
To examine the effect of simulated compaction procedures on the reinforcement, three types compaction procedures have been simulated:
- Type-I: A uniformly distributed load is applied to the top surface of each soil lift as the mass is gradually constructed from the bottom up, see (i) of Figure 2b ([15]).
- Type-II: A uniformly distributed load is applied at the top and bottom surfaces of each soil lift as the mass is gradually constructed from the bottom up, see (ii) of Figure 2b ([18]).
- Type-III: A moving strip load of width w is applied to the top surface of each soil lift as the mass is gradually built from the bottom up, see (iii) of Figure 2b. Three different strip widths have been considered: 0.175 m, 0.35 m, and 0.70 m. In the simulation, the strip load moves either away or towards the modular block under consideration.
Each of these compaction loads is removed from the existing soil layer prior to the placement of the next soil lift. A variety of compaction pressures: 10, 30, 44, 60, and 70 kPa have been considered in the parametric study. In particular, the compaction pressure of 44 kPa represents the compaction pressure induced by the plate compactor (MBW–GP1200), as used in the SGC Test No. 2 of Reference [6], whereas the compaction pressure of 70 kPa has been corresponded to the pressure induced by the Caterpillar CW-34 roller compactor. In the numerical model, both the horizontal and vertical displacements of the bottom boundary were fixed.
4. Results and Discussion
4.1. Reinforcement Strain and Lateral Displacement of Sgc Mass
4.1.1. Effect of Compaction Procedures on Reinforcement Strain
Figure 3 shows the axial strain of the geotextile reinforcement at depths 0.4 m and 1.2 m from the top surface of the model. Three different types of compaction procedures (Figure 2b) have been simulated, each with different compaction loads of q of 10, 30, 44, 60 and 70 kPa for the 0.2 m thick soil lift. At the end of the compaction stage, a surcharge load p of 600 kPa was applied to the top surface of the GRS walls specimen.
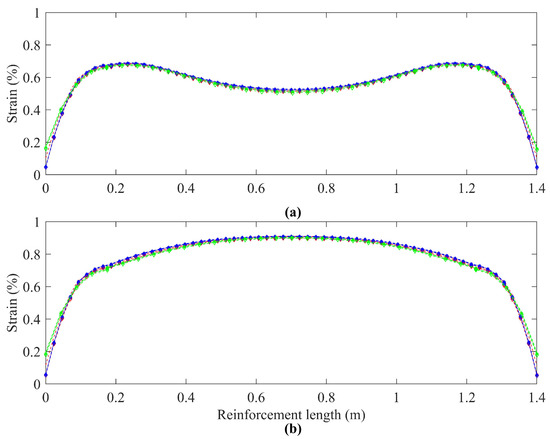
Figure 3.
Effect of compaction procedures (Types-I, II, and III) on reinforcement strains of SGC mass, under kPa and q of 10, 30, 44, 60 and 70 kPa—for reinforcements at depths: (a) 0.4 m; and (b) 1.2 m, from the specimen’s top surface.
Figure 3a,b indicates that the types of compaction procedures shown in Figure 2b do not have any effect on the axial strain developed in the reinforcement; there were, however, some minor variations from both ends of the reinforcement. Compaction procedure Type-III with w = 0.7 m generated the largest axial strain while procedure Type-II generated the least axial strain at both ends.
Reference [20] performed a 2D numerical modelling on the full-scale reinforced soil wall No. 1, which was built at the Royal Military College of Canada ([15]). The wall was 3.6 m high, with a facing inclination of 8 to the vertical. The length of the geogrid was 2.52 m while the vertical spacing of the geogrid was 0.6 m. The 2.52 m long reinforcement terminated some 42% into the soil backfill, which has a width of 5.95 m. Reference [20] observed that Type-I generated the largest axial strain while Type-II generated the least axial strain; furthermore, the effect of compaction procedures on reinforcement strain was found to be much more obvious in Reference [20] than that observed in this study.
It should be noted that the geometrical configuration simulated by Reference [20] is different from that simulated in this study. The reinforcement simulated in this study was almost half (1.4 m) the length used in Reference [20]. In addition, during the compaction stage, the 1.4 m long reinforcements were “partially” fixed at both ends by the facing blocks.
On the other hand, the strain profiles were different for reinforcement at different depths. At the shallower depth, Figure 3a, the maximum strain of 0.67% was observed to develop at the locations 0.2 m from the both ends of the reinforcement, while at the deeper depth, Figure 3b, the maximum strain of 0.9% was seen to develop at the middle of the reinforcement. The maximum strain levels observed in this study are comparable to that observed in Reference [20], which is less than 1.4%. The slightly larger axial strain generated in Reference [20] was probably because their wall was 1.8 times taller than the one used in this study.
4.1.2. Effect of Width of Strip Load on Reinforcement Strain
The overlapping of all the numerical results of reinforcement axial strain in Figure 4 indicated that the width of the strip load w under consideration, that is, 0.175 m, 0.3 m and 0.7 m, has either insignificant or no effect at all on the axial strain of the reinforcement of the study SGC mass. This is in contrast to the study performed by Reference [20], who found that the smaller the width of the strip load w, the lesser its effect on the reinforcement’s axial strain; in other word, increasing the width of the strip load w leading to a higher distribution of reinforcement strain in all their reinforcement layers.
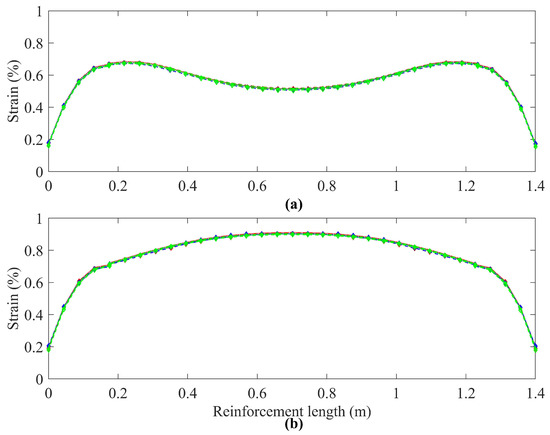
Figure 4.
Effect of the widths of strip load (w = 0.175, 0.3, 0.7 m) on reinforcement strains of SGC mass, under p of 600 kPa, compaction procedure Type-III and q of 10, 30, 44, 60 and 70 kPa—for reinforcements at depths: (a) 0.4 m; and (b) 1.2 m, from the top surface.
4.1.3. Effect of Surcharge Load on Reinforcement Strain
Figure 5 shows the strain of the reinforcement at depths 0.4 m and 1.2 m from the top surface of the SGC mass under the influence of three different applied surcharges: 200 kPa, 600 kPa, and 800 kPa, applied separately on the top surface of the SGC mass. The compaction loads considered during the SGC mass construction stage are: 44 kPa and 70 kPa. In addition, the compaction procedure Type-I, II, and III have also been considered in this series of analysis.
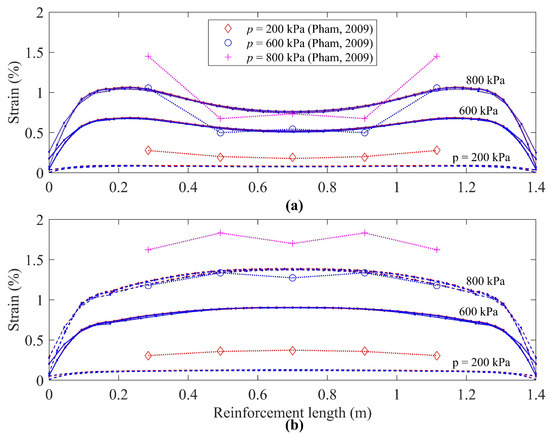
Figure 5.
Effect of surcharge loads (p = 200, 600, 800 kPa) on reinforcement strains of SGC mass, under compaction procedures Type-I, II and III and q of 44 and 70 kPa—for reinforcements at depths: (a) 0.4 m; and (b) 1.2 m, from the top surface.
The results clearly show that the higher the surcharge load the larger the axial strain generated in the reinforcement. For example, the maximum axial strain for reinforcement layer at the depth of 1.2 m was 0.124%, 0.907% and 1.388% for surcharge load p of 200 kPa, 600 kPa and 800 kPa, respectively. As for the axial strain at the middle length (0.7 m from the open face) of the reinforcement at the depth of 0.4 m from the top surface of the SGC mass, the value was 0.081%, 0.52% and 0.762% for surcharge load p of 200 kPa, 600 kPa and 800 kPa, respectively.
4.1.4. Effect of Compaction Load on Open Face Lateral Displacement
Figure 6 shows the lateral displacements on the open faces of the specimen, that is, after facing blocks were removed and confining pressure of 34 kPa was applied, with an uniformly distributed surcharge load q of 1000 kPa applied to the top surface of the specimen for various compaction pressures—Type-I, Type-II, Type-III (w = 0.7 m, 0.35 m, and 0.175 m). The associated compaction load q in each of these compaction procedure were 44 kPa and 70 kPa.
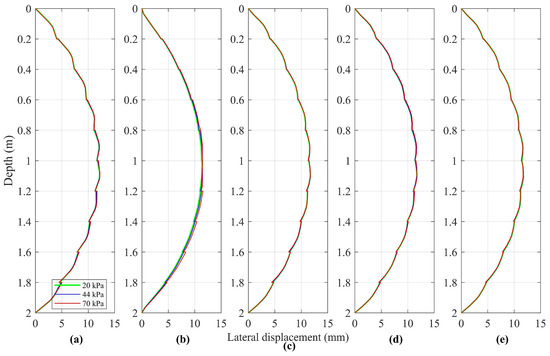
Figure 6.
Effect of compaction load q and compaction procedures on open face lateral displacement of SGC mass: for case of p = 1000 kPa, q = 20, 44 and 70 kPa: (a) Type-I; (b) Type-II; (c) Type-III (w = 0.7 m); (d) Type-III (w = 0.35 m); (e) Type-III (w = 0.175 m).
The numerical results shown in Figure 6 show that the compaction loads q of 20, 44 and 70 kPa have no or insignificant effect on the open face lateral displacement of the SGC mass. In addition, the compaction procedures (Type-I, II and III) also have no or very minor effect on the open face lateral displacement, albeit the profile of the lateral displacement generated by Type-II compaction is slightly different from the rest of the compaction procedures. Thus, the result imply that both the compaction load and compaction procedures were insignificant to the characteristics of the stress-deformation behavior of the SGC mass.
4.1.5. Effect of Surcharge Load on Open Face Lateral Displacement
The effect of service load on the lateral displacement of the SGC mass is examined here. Figure 7 shows the open face lateral displacement of SGC mass under four different surcharge load p of 400, 1000, 2000 kPa, and 2500 kPa at the top surface of the specimen, which had been compacted with a compaction load q of 44 kPa, as it was found in the previous Section 4.1.4 that compaction load has insignificant effect on the lateral displacement. The result of the SGC mass experiment conducted by Reference [6] is also plotted in this figure. In general, the numerical and the experimental results were in good agreement, in particular, for cases with smaller surcharge loads.
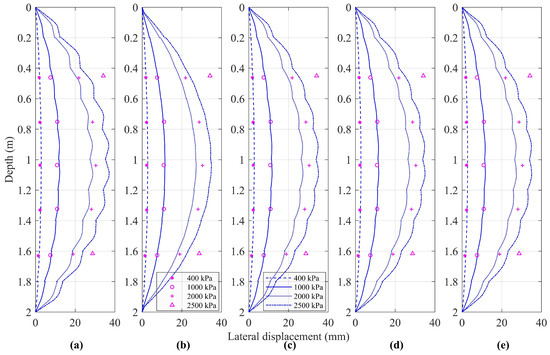
Figure 7.
Effect of surcharge load p and compaction procedures on open face lateral displacement of SGC mass, for kPa, p = 400, 1000, 2000 and 2500 kPa: (a) Type-I; (b) Type-II; (c) Type-III (w = 0.7 m); (d) Type-III (w = 0.35 m); (e) Type-III (w = 0.175 m).
The maximum open face lateral displacement of the SGC mass (compacted using different compaction procedures) induced during the serviceability stage by various surcharges is tabulated in Table 4. The tabulated results show that the variation between the numerical results of the five compaction procedures is very small, in particular, for compaction procedures Type-II and III.

Table 4.
Maximum lateral displacement induced during serviceability stage by various surcharges.
We can, for example, plot the profile of the lateral displacement versus depth of the SGC mass under the surcharge load p of 1000 kPa together with the experimental result of Reference [6], as in Figure 8. The profile shows that compaction procedure Type-II (UDL applied to top and bottom of each soil lift) produced a smooth and the smallest lateral displacement versus depth profile compared to that of Types-I and III. Both the Types-I and III procedures produced a similar jiggered profile, with Type-I showing the most obvious manifestation. The jagger has a width of 0.2 m, corresponded to the thickness of the thickness of each soil lift. In other words, compaction procedure Type-I generated the most lateral displacement at the middle of each soil lift while procedure Type-II generated the least, but at the top and bottom surfaces of each soil lift the generated lateral displacements were pretty similar. Although the lateral displacement profile induced by compaction procedure Type-II shows the most promising comparison with experimental result, the profiles induced by Type-I and II were also in good agreement with the experimental result. It thus suggested that the consideration of different compaction simulation procedures on the lateral displacement of SGC mass could be neglected in the future numerical simulation for the experimental tests by Reference [6].
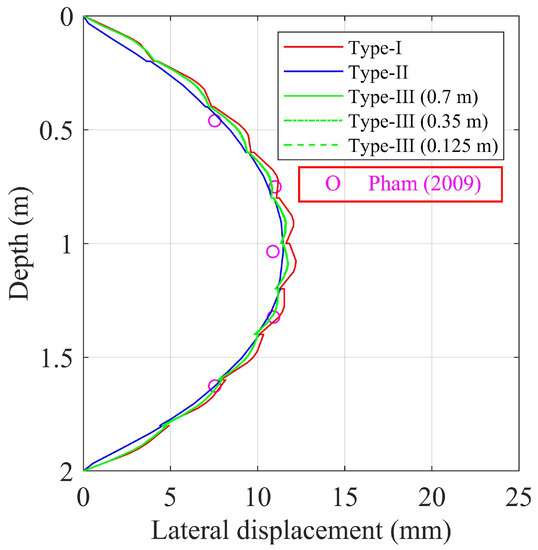
Figure 8.
Effect of compaction procedures on lateral displacement of SGC mass for case of kPa and kPa.
4.2. Compaction-Induced Stress in Grs Mass
The increase in lateral stresses due to compaction during construction would lead to an increase in the stiffness and strength of the soil mass, which, in turn, leads to less lateral displacement. Since the SGC mass, which was mainly used for calibrating the numerical procedures adopted in this study, is unsuitable for the study of compaction-induced stress because it was confined by a confining pressure of 34 kPa, a hypothetical 6 m high back-to-back Geo-synthetic Reinforced Soil (GRS) mass, Figure 9a, has been proposed for this purpose. Figure 9a shows the geometrical configuration of a 6 m high back-to-back GRS walls. The simulated compaction procedures, Figure 9b, to be adopted here are similar to that applied in the simulation of SGC mass.
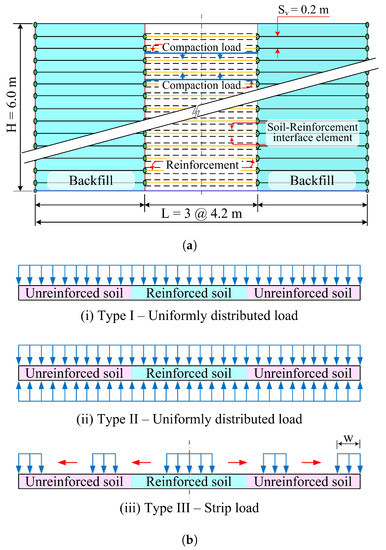
Figure 9.
(a) Schematic diagram and configuration of the back-to-back Geo-synthetic Reinforced Soil (GRS) mass. (b) Heavy compaction procedures for GRS wall mass adopted in FE analysis.
4.2.1. Effect of Compaction Loads and Procedures on Cis
The distribution of lateral stresses along the centre line of the hypothetical GRS mass induced by compaction loads q of 44 and 70 kPa during the GRS mass construction stage is presented and compared in Figure 10. The numerical simulation of the compacted procedures, that is, Type-I, II and III (with a strip load width w of 0.7 m only) were identical to that simulated in the SGC mass.
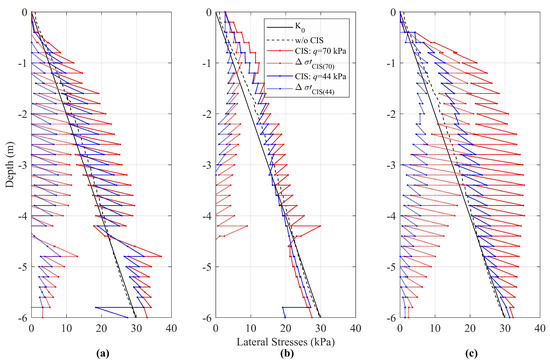
Figure 10.
Distribution of lateral stresses along the centre line of the hypothetical GRS mass during construction stage, for cases of q = 44 and 70 kPa, and compaction procedures: (a) Type-I; (b) Type-II; (c) Type-III (w = 0.7 m).
The lateral stresses with and without considering the compaction-induced stresses (CIS) are shown in Figure 10. It is seen that the lateral stress without considering the CIS is slightly larger than the lateral stress at rest, that is, the condition, in the top 4.5 m from the top surface of the GRS mass, thereafter, it reduces to values slightly smaller than the stress.
The compaction operation was simulated by loading and unloading the surface/surfaces of each compaction lift, depending on the compaction procedures as shown in Figure 9b. Thus, the zigzag profile of the lateral stress profile was induced by the compaction of each of the 0.2 m thick soil lift. The results clearly show that, for all the three simulated compaction procedures, Figure 10a–c, as expected, the larger the compaction load, the larger the corresponded compaction-induced stress was. In addition, there are significant differences in the values of the CIS associated with the three simulated compaction procedures: Type-I, II, and III. In general, compaction procedure Type-II produced the lowest CIS profile, whereas compaction procedure Type-III generated the highest CIS profile. The magnitude of the stress level of the CIS corresponded to the magnitude of the open face lateral displacement, albeit very small, as shown in Figure 8. The compaction procedure Type-III amplified the lateral stress by a “nominal average value” of approximately 140% when the compaction load was increased from 44 kPa to 70 kPa, compared to that of 120% and 110% when, respectively, compaction procedures Type-I and II was adopted.
Also depicted in Figure 10 is the distribution of the net lateral stress induced by compaction, which is the net difference between the lateral stresses induced by compaction and the stress, and , that is, net CIS generated by compaction load and 70 kPa, respectively. These results show that the larger the compaction load, the greater the net lateral stress was. The results clearly show that it is of paramount importance to consider CIS in the numerical simulation of GRS mass.
4.2.2. Comparison between Analytical and Numerical Cis Profiles
The net lateral stress induced by compaction can be readily calculated by hand using Reference [12]’s CIS model (Equations (1)–(3)). The hand-calculated net lateral stress induced by compaction are plotted and compared with the numerical results for compaction loads q of 44 and 70 kPa in Figure 11. In general, it can be seen that the FE profile was not in good agreement with the analytical calculated net CIS profile, in particular, for the results generated by the simulated compaction procedures of Type-I and III; the analytical result significantly under-estimated the numerical CIS result. The analytical model, however, shows satisfactory agreement, Figure 11b, with the numerical result simulated using compaction procedure Type-II, which applied the uniformly distributed load at the top and bottom surfaces of each of the 0.2 m thick soil lift, in particular, for the case of heavy compaction (q of 70 kPa). The analytical net lateral stress induced by compaction initially increased following the passive earth pressure stress path to a depth of 0.2 m and then linearly decreased to zero at a depth of 4.2 m. The negative value of net CIS revealed that the characteristics of compaction-induced stress beyond this depth is vanishing. The net CIS profile along the height of the GRS mass is a parabolic shape instead of two linear segments as in the analytical model.
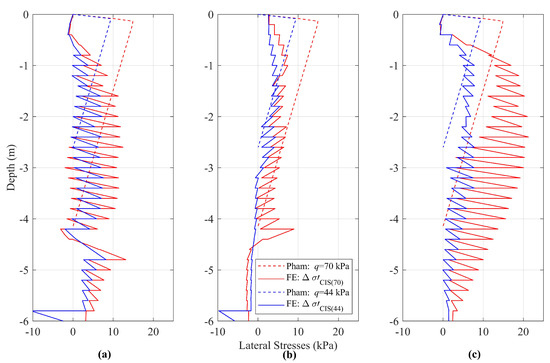
Figure 11.
Comparison of CIS between analytical and numerical results for q = 44 and 70 kPa: (a) Type-I; (b) Type-II; (c) Type-III (w = 0.7 m).
4.2.3. Development of Net Cis during Construction of Grs Mass
Figure 12 shows the development of the net compaction-induced stress as the hypothetical GRS mass was constructed using compaction procedure Type-II. The profile of the numerical compaction-induced stress for each meter of GRS mass height increment to a height of 6 m is presented in Figure 12. As it can be seen from this figure, the value of the net CIS profile induced by the compaction load kPa, for GRS mass heights between 1 m and 6 m, is always larger than that induced by the compaction load kPa. Notwithstanding the effect of compaction load on CIS, the magnitude of the net compacted-induced stress near the ground surface is always less than the Rankine’s passive earth pressure, as the depth increases, the magnitude of the net compacted-induced stress reduces to a value close to or smaller than the earth pressure at rest. The range of the value of the net CIS was, thus, falls between the active and passive earth pressure. Another observation from Figure 12 is that the influence depth of the net CIS profile increases with the increase of the compaction load.
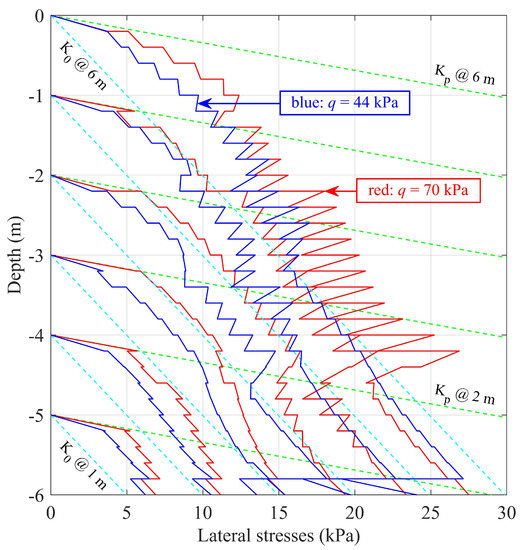
Figure 12.
Incremental net compaction-induced stress corresponded to GRS mass construction using compaction procedure Type-II.
5. Conclusions
A series of numerical analysis of a 2 m high Soil Geosynthetic Composite (SGC) mass and a hypothetical 6 m high Geo-synthetic Reinforced Soil (GRS) mass has been performed in this study. The effect of simulated compaction procedures, compaction loads, surcharge loads have been examined via the simulation of the SGC mass and compared with the experimental lateral displacements and reinforcement strains. Finally, the mechanism of compaction-induced stress has also been studied via the simulation of the GRS mass. Based on the above simulations the findings and conclusions of this study can be summarized as follows:
- The numerical and lateral displacement result of the SGC mass obtained in this study were in good agreement with the experimental result of Reference [6], in particular, for surcharge loads smaller than 2000 kPa.
- The simulated compaction procedures, that is, Type-I (an uniformly distributed load applied to the top surface of each soil lift), Type-II (an uniformly distributed load applied to the top and bottom surfaces of each soil lift), and Type-III (with various widths of strip load w = 0.7 m, 0.35 m, 0.175 m), the compaction loads used during the construction of the SGC mass, and the surcharge loads induced during the serviceability stage of the mass were all found to have insignificant or no effect at all on the reinforcement strains, and the open face lateral displacement of the simulated GRS mass compared with the experimental results in Reference [6].
- The numerical result of the net CIS profile obtained via simulating the compaction process by applying a uniformly distributed load at the top and bottom surfaces of each soil lift (compaction procedure Type-II) was found to be in good agreement with the analytical model proposed in Reference [12].
- Both the types of simulated compaction procedure and the compaction load have significant effect on the compaction-induced stress, with compaction procedure Type-III (strip load) has the most influence, while compaction procedure Type-II has the least influence. Compaction procedure Type-III was found to amplify the lateral stress by a “nominal average value” of approximately 140% when the compaction load was increased from 44 kPa to 70 kPa, compared to that of 120% and 110% when, respectively, compaction procedures Type-I and II was adopted.
- The range of the value of the net CIS was found to be between the active and the passive earth pressure.
Author Contributions
Conceptualization, T.P. (Truc Phan), T.P. (Thang Pham) and M.G.; numerical analysis, T.P. (Truc Phan); experimental data curation, T.P. (Thang Pham); numerical data curation, T.P. (Truc Phan) and M.G.; writing—original draft preparation, T.P. (Truc Phan); writing—review and editing, T.P. (Thang Pham) and M.G.; supervision, M.G. All authors have read and agreed to the published version of the manuscript.
Funding
This research received no external funding.
Conflicts of Interest
The authors declare they have no conflict of interest.
Abbreviations
The following abbreviations are used in this manuscript:
| CIS | Compaction-Induced Stress |
| GRS | Geosynthetic Reinforced Soil |
| SGC | Soil Geosynthetic Composite |
| p | Surcharge Load During Serviceability Stage |
| q | Compaction Load For Each Soil Lift |
References
- AASHTO. LRFD Bridge Design Specifications, 7th ed.; American Association of State Highway and Transportation Officials: Washington, DC, USA, 2014; 1694p, ISBN 9781560515920. [Google Scholar]
- Berg, R.R.; Christopher, B.R.; Samtani, N. Design and Construction of Mechanically Stabilized Earth Walls and Reinforced Soil Slopes–Volume I; US Department of Transportation, Federal Highway Administration: Washington, DC, USA, 2009. Available online: https://www.fhwa.dot.gov/engineering/geotech/pubs/nhi10024/ (accessed on 30 June 2020).
- NCMA. Design Manual for Segmental Retaining Walls, 3rd ed.; National Concrete Masonry Association: Herndon, VA, USA, 2009; 302p, Available online: https://ncma.org/resource/srw-design-manual/ (accessed on 30 June 2020).
- Elton, D.J.; Patawaran, M.A.B. Mechanically Stabilized Earth Reinforcement Tensile Strength from Tests of Geotextile-Reinforced Soil. Transp. Res. Rec. 2004, 1868, 81–88. [Google Scholar] [CrossRef]
- Adams, M.T.; Ketchart, K.; Wu, J.T.H. Mini Pier Experiments: Geosynthetic Reinforcement Spacing and Strength as Related to Performance. In Proceedings Geo-Denver 2007: Geosynthetics in Reinforcement and Hydraulic Applications (Geotechnical Special Publication 165); Gabr, M.A., Bowders, J.J., Eds.; ASCE Geo-Institute: Reston, VA, USA, 2007. [Google Scholar]
- Pham, T.Q. Investigating Composite Behavior of Geosynthetic-Reinforced Soil (GRS) Mass. Ph.D. Thesis, University of Colorado, Denver, CO, USA, 2009; 378p. [Google Scholar]
- Broms, B. Lateral Pressure Due to Compaction of Cohesionless Soils. In Proceedings of the 4th Budapest Conference on Soil Mechanics and Foundation Engineering: 3rd Danube-European Conference, Budapest, Hungary, 12–15 October 1971; pp. 373–384. [Google Scholar]
- Aggour, M.S.; Brown, C.B. The Prediction of Earth Pressure on Retaining Walls Due to Compaction. Ge´otechnique 1974, 24, 489–502. [Google Scholar] [CrossRef]
- Seed, R. Compaction-induced Stresses and Deflections on Earth Structure. Ph.D. Dissertation, Department of Civil Engineering, University of California, Berkeley, CA, USA, 1983; 447p. [Google Scholar]
- Duncan, J.M.; Seed, R.B. Compaction-Induced Earth Pressures Under K0-Conditions. J. Geotech. Eng. ASCE 1986, 112, 1–22. [Google Scholar] [CrossRef]
- Seed, R.; Duncan, J. FE Analyses: Compaction-Induced Stresses and Deformations. J. Geotech. Eng. ASCE 1986, 112, 23–43. [Google Scholar] [CrossRef]
- Wu, J.T.H.; Pham, T.Q. An Analytical Model for Evaluation of Compaction-Induced Stresses in a Reinforced Soil Mass. Int. J. Geotech. Eng. 2010, 4, 549–556. [Google Scholar] [CrossRef]
- Wu, J.T.H.; Pham, T.Q. Load-Carrying Capacity and Required Reinforcement Strength of Closely Spaced Soil-Geosynthetic Composites. J. Geotech. Geoenviron. Eng. 2013, 139, 1468–1476. [Google Scholar] [CrossRef]
- Ketchart, K.; Wu, J.T.H. Performance Test for Geosynthetic-Reinforced Soil Including Effects of Preloading; Report No. FHWA-RD-01-118; US Department of Transportation, Federal Highway Administration: Washington, DC, USA, 2001; 283p.
- Hatami, K.; Bathurst, R.J. Development and Verification of a Numerical Model for the Analysis of Geosynthetic-Reinforced Soil Segmental Walls under Working Stress Conditions. Can. Geotech. J. 2005, 42, 1066–1085. [Google Scholar] [CrossRef]
- Hatami, K.; Bathurst, R.J. Numerical Model for Reinforced Soil Segmental Walls under Surcharge Loading. J. Geotech. Geoenviron. Eng. 2006, 132, 673–684. [Google Scholar] [CrossRef]
- Mirmoradi, S.H.; Ehrlich, M. Modeling of the Compaction-Induced Stresses in Numerical Analyses of GRS Walls. Int. J. Comput. MethodsvSpec. Issue Comput. Geomech. 2014, 11, 1–14. [Google Scholar] [CrossRef]
- Mirmoradi, S.H.; Ehrlich, M. Modeling of the Compaction-Induced Stress on Reinforced Soil Walls. Geotext. Geomembr. 2015, 43, 82–88. [Google Scholar] [CrossRef]
- Mirmoradi, S.H.; Ehrlich, M. Compaction-Induced Stress: Numerical Modeling. In Proceedings of the 15th Pan-American Conference on Soil Mechanics and Geotechnical Engineering, Buenos Aires, Argentina, 15–18 November 2015; Manzanal, D., Sfriso, A.O., Eds.; pp. 1161–1168. [Google Scholar]
- Mirmoradi, S.H.; Ehrlich, M. Numerical Simulation of Compaction-Induced Stress for the Analysis of RS Walls under Working Conditions. Geotext. Geomembr. 2018, 46, 354–365. [Google Scholar] [CrossRef]
- Yu, Y.; Bathurst, R.J.; Allen, T.M. Numerical Modelling of Two Full-Scale Reinforced Soil Wrapped-Face Walls. Geotext. Geomembr. 2017, 45, 237–249. [Google Scholar] [CrossRef]
- Wu, J.T.H.; Yang, K.H.; Mohamed, S.; Pham, T.Q.; Chen, R.H. Suppression of Soil Dilation—A Reinforcing Mechanism of Soil-Geosynthetic Composites. Transp. Infrastruct. Geotechnol. 2014, 1, 68–82. [Google Scholar] [CrossRef]
- Phan, T.T.; Gui, M.W.; Pham, T.Q. Numerical simulation analysis of stress-deformation behavior of soil and geosynthetic composite mass: A case study. In Proceedings of the 3rd International Conference on Transport Infrastructure & Sustainable Development (TISDIC 2019), Da Nang, Vietnam, 31 August–1 September 2019; pp. 211–219, ISBN 978-604-82-2893-4. [Google Scholar]
- Bathurst, R.J.; Nernheim, A.; Walters, D.L.; Allen, T.M.; Burgess, P.; Saunders, D.D. Influence of Reinforcement Stiffness and Compaction on the Performance of Four Geosynthetic-Reinforced Soil Walls. Geosynth. Int. 2009, 16, 43–59. [Google Scholar] [CrossRef]
- Wu, J.T.H.; Tung, C.; Adams, M.T.; Nicks, J.E. Analysis of Stress-Deformation Behavior of Soil-Geosynthetic Composites in Plane Strain Condition. Transp. Infrastruct. Geotechnol. 2018, 5, 210–230. [Google Scholar] [CrossRef]
- Wu, J.T.H.; Hoffman, P.; Pham, T.Q. Discussion on “Numerical Simulation of Compaction-Induced Stress for the Analysis of GRS Walls under Working Conditions by Mirmoradi, SH and Ehrlich, M. in Geotext. Geomembr. 2018, 46, 354–365.”. Geotext. Geomembr. 2018, 46, 913–914. [Google Scholar] [CrossRef]
- Westergaard, H.M. A Problem of Elasticity Suggested by a Problem in Soil Mechanics: Soft Material Reinforced by Numerous Strong Horizontal Sheet. In “Contributions to the Mechanics of Solids,” on the Occasion of the 60th Birthday Anniversary of Stephen Timoshenko; The Macmillan Co.: New York, NY, USA, 1938; pp. 268–277. [Google Scholar]
- Ehrlich, M.; Mitchell, J.K. Working Stress Design Method for Reinforced Soil Walls. J. Geotech. Eng. 1994, 120, 625–645. [Google Scholar] [CrossRef]
- Bolton, M.D. Geotechnical Stress Analysis for Bridge Abutment Design; Transport and Road Research Lab.: Crowthorne, UK, 1991; 115p. [Google Scholar]
- Duncan, J.M.; William, G.W.; Sehn, A.L.; Seed, R.B. Estimation Earth Pressures due to Compaction. J. Geotech. Eng. Div. ASCE 1991, 117, 1833–1847. [Google Scholar] [CrossRef]
- DYNAPAC Light Compaction. Available online: https://dynapac.com/en/products/compaction (accessed on 30 June 2020).
- Light Equipment for Soil and Asphalt Compaction. Available online: https://www.bomag.com/ww-en/machinery/categories/light-equipment/ (accessed on 30 June 2020).
- Wu, J.T.H.; Ma, C.Y.; Pham, T.Q.; Adams, M.T. Required Minimum Reinforcement Stiffness and Strength in Geosynthetic-Reinforced Soil (GRS) Walls and Abutments. Int. J. Geotech. Eng. 2011, 5, 395–404. [Google Scholar] [CrossRef]
- Yang, K.H.; Wu, J.T.H.; Chen, R.H.; Chen, Y.S. Lateral Bearing Capacity and Failure Mode of Geosynthetic-Reinforced Soil Barriers Subject to Lateral Loadings. Geotext. Geomembr. 2016, 44, 799–812. [Google Scholar] [CrossRef]
- ASTM D4595-17. Standard Test Method for Tensile Properties of Geotextiles by the Wide-Width Strip Method; ASTM International: West Conshohocken, PA, USA, 2017. [Google Scholar] [CrossRef]
- Plaxis 2D—Version 8, Reference Manual; Delft University of Technology: Delft, The Netherlands. 2002. Available online: https://www.plaxis.com/support/manuals/plaxis-2d-manuals/ (accessed on 30 June 2020).
- Schanz, T.; Vermeer, P.A.; Bonnier, P.G. The Hardening Soil Model: Formulation and Verification. In Beyond 2000 in Computational Geotechnics; Ronald, B., Brinkgreve, J., Eds.; Taylor & Francis Group: London, UK, 1999; pp. 281–296. [Google Scholar]
© 2020 by the authors. Licensee MDPI, Basel, Switzerland. This article is an open access article distributed under the terms and conditions of the Creative Commons Attribution (CC BY) license (http://creativecommons.org/licenses/by/4.0/).