1. Introduction
The AC/DC converters and output filters are a foremost and essential technology for linking Renewable Energy Sources (RES) and the electric grid. The converter enables energy transaction between the grid and RES in an appropriate, secure and dependable way. These types of DC-AC converters are informally called grid-tied inverters or Grid-Connected Inverters (GCI).
The smart grid is the newest generation of the conventional power system grids which rely on the two-way power flow and information transfer competencies [
1,
2,
3,
4,
5,
6,
7]. A traditional grid comprises control centres, power generation, transmission, distribution, and consumers [
8]. Presently, with the progression of new digital technologies, like micro processed systems, and developments in power electronics, several applications have been deployed in the smart grid, particularly in the formulation of electronic energy converters and controllers. Of late, academics have made noteworthy contributions which have caused a significant effect on these domains, chiefly aimed at data acquirement, automation, and regulation of microgrids [
9]. The microgrids do not merely assimilate the distributed generation with the utility grid in a dependable and tidy manner but also offer greater dependability in its capability to function despite natural phenomena and dynamic distribution grids, consequently causing reduced energy losses in transmission and dissemination and saving the time consumed in building and investment [
10,
11,
12,
13,
14].
In literature, authors in [
15] suggested an AC/DC hybrid microgrid comprising wind, supercapacitors, and hydrogen-based energy to regulate the power fed to the microgrid. This DC system has all energy sources coupled to a shared DC-bus, which is then linked with the grid using a primary inverter. How the variable load demand affects the system has not been analysed. One more hybrid DC/AC microgrid structure comprising photovoltaic and fuel cells were recommended in [
16]. A synchronised function of unit power control and feeder flow control was formulated for improving system stability and decreasing the quantity of operating mode variations. A related hybrid microgrid configuration was introduced in [
17]. Ref. [
18] suggests appropriate day-ahead scheduling concerning the inclusion of hybrid microgrids in frequency regulation-based requirements. To service a frequency regulation market, all Distributed Generation (DG) comprising the microgrid is analysed for the balance between energy production and associated services. The authors in [
19] suggest a technique for optimal power transmission and management in AC/DC hybrid microgrids. The penetration ratio specific to microgrids is a crucial indicator of the appropriate location of a microgrid in a power distribution setup. This study identifies the optimal location of the microgrid, considering two distribution systems. For these systems, the line losses and voltage characteristics are studied. Even though microgrids are taken into account on a minor scale, their technical intricacy of modelling and simulation is greater as against the traditional energy system. Hence, models facilitating dynamic analyses are crucial to ensure the stability of future microgrids.
In contrast, there are three topologies specific to decoupled AC systems: a totally isolated two-stage setup, a setup comprising two partially-isolated stages, and a setup comprising three partially isolated stage. The environment and application for which the AC/DC hybrid microgrid shall be used to determine the optimal configuration [
20]. The critical aspect of an interconnected setup is the direct connection of an AC microgrid with the utility grid using an AC converter. The microgrid connects with the utility grid with the transformer being set up at the point of connection, thereby creating galvanic isolation for microgrid and also decreasing voltage specific to low voltage AC grid. Hybrid microgrids connected with the primary grid can regulate bidirectional power transfer (production/consumption) by employing AC/DC VSC for battery energy storage setups. It is necessary to highlight that hybrid microgrids can be scaled with ease. Moreover, the implementation of such microgrids may be performed at several levels using different configurations. These microgrids can be integrated with a Low-Voltage (LV) residential-scale grid or a Medium Voltage (MV) distribution-level grid [
21].
The literature has several references for Grid-Connected Inverters (GCI) using PR controllers. Few studies specify the process of designing the PR controller [
22,
23,
24]. All specified research is appropriate and highlights PR efficacy. Nevertheless, most research focuses on the PR controller being used in continuous-time. In contrast, a major proportion of the GCI applications require a digital setup. In such cases, the task of using the PR controller digitally is something the reader should ascertain.
The main unique contributions of the approach recommended in this paper can be summed up as shown below:
This work aims to formulate a model that can assess the behaviour of distributed energy resources in 14-node IEEE systems that stem from the change in the opening protocol of the disconnector, which establishes a power generating island. The stability analysis it exposes makes it possible to determine the performance of a radial distribution power system given various disturbances. Results have relevance in the operation and planning phases of a distributed generation system.
As a renewable energy interface, numerous control technologies can be used to operate controlled inverters or rectifiers. In this study, some converters operated in an open-loop control strategy while others operated in a closed-loop control strategy. Furthermore, pulse width modulation techniques at varying carrier frequencies were utilised by these rectifiers or inverters.
The main contribution of this paper the proposed method not only focused on the transient response but also improve the steady-state response which smooth the voltage, furthermore all inverters are effectively involved to increase capacity of the microgrid for better power management.
The hybrid microgrid was equipped with nonlinear and linear loads, typical energy storage systems, and balanced and unbalanced loads. Moreover, this paper thoroughly describes the model with all the data needed to tackle the abovementioned studies.
This paper offers a design process for the digital PR current controller implemented to a GCI. The procedure describes a step-by-step method for calculating the resonant and proportional gains, as well the resonant path’s coefficients. Its main contribution is helping facilitate and providing support to researchers who are tasked with designing GCI that incorporates present control strategies in a digital environment. The paper will also present an analysis of the frequency domain of a digital PR controller. This analysis utilised the fictitious w-domain. The case-study demonstrated the efficacy of GCI that uses a digital PR current controller, which was designed with the help of the proposed procedure. The paper also demonstrates how the proposed procedure has validity for a number of resonant path PR controllers.
2. Proposed System Description
The studied hybrid microgrid is composed of a photovoltaic array, together with batteries, and AC loads. These systems form a hybrid microgrid interconnected to a low voltage distribution.
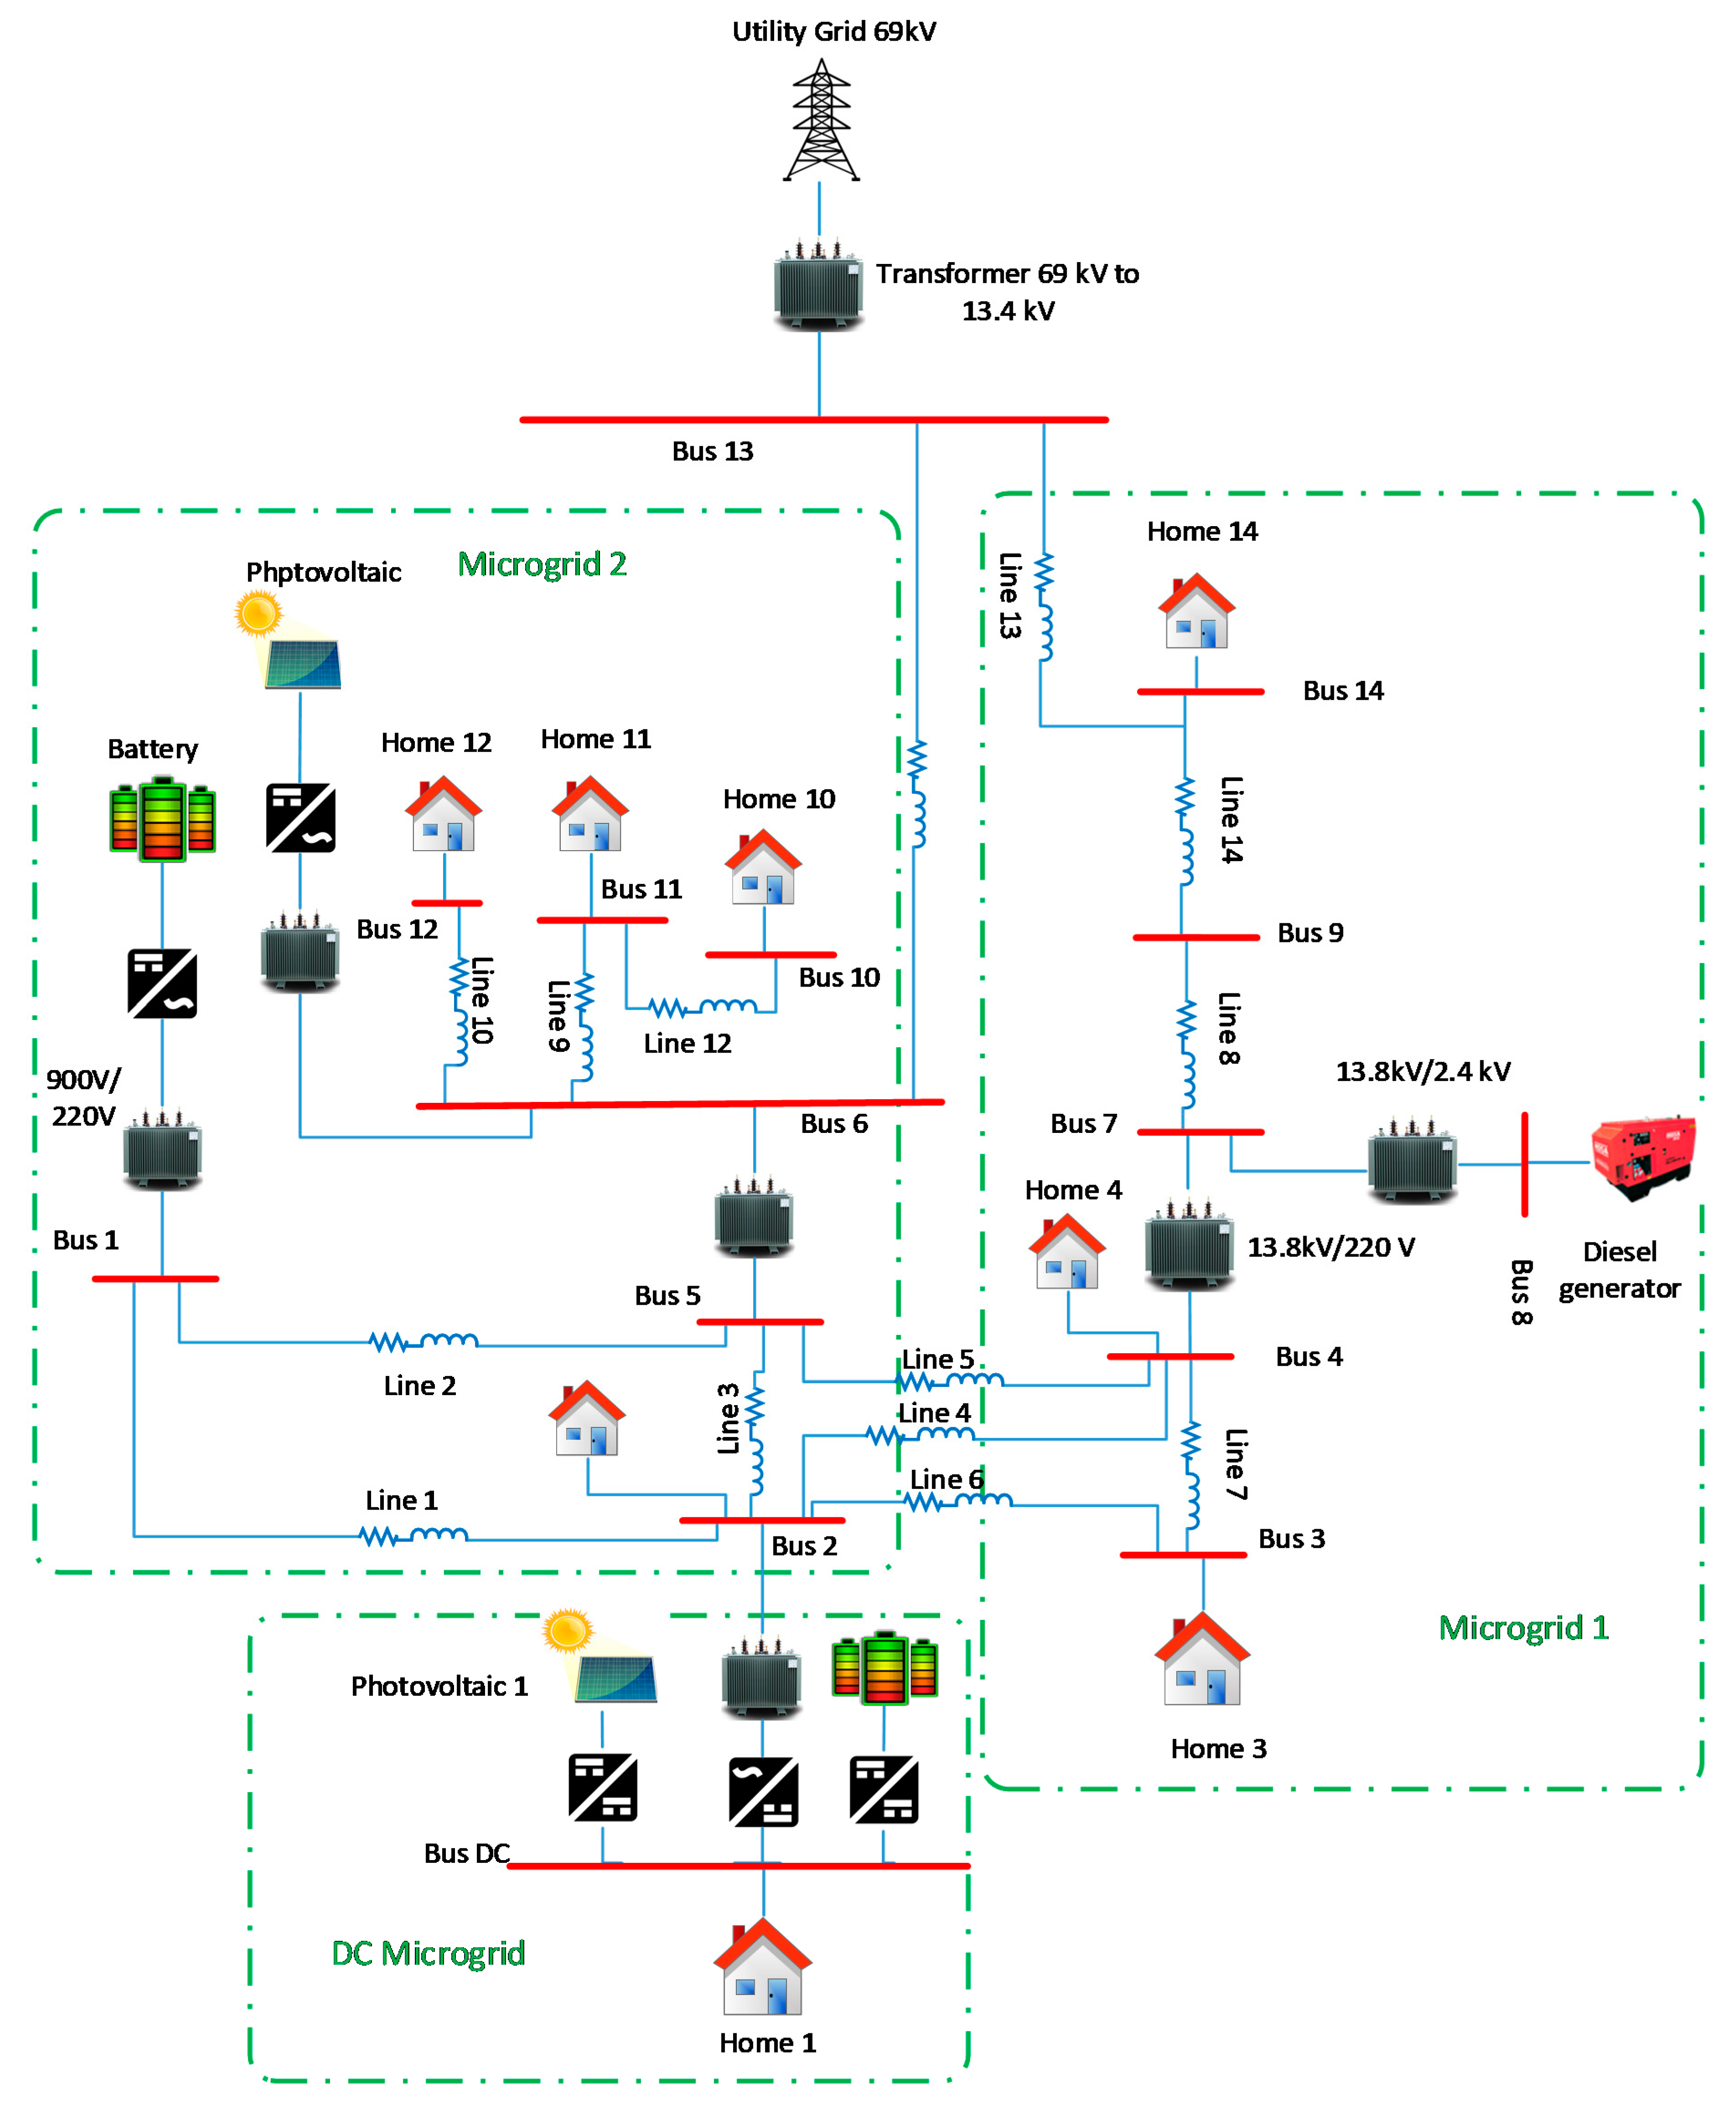
Figure 1 illustrates the configuration of a hybrid power system for the distribution microgrid.
The IEEE 14 bus feeder is the basis of the test platform for the hybrid microgrid developed in this report. The test feeder has been significantly modified to include diesel generators, detailed domestic dynamic multi-home models, battery storage systems and photovoltaic. The network diagram of the proposed distribution system is shown in
Figure 1. The location of the photovoltaic generator, batteries and diesel generator used in this article is also indicated. It consists of a substation, 14 lines, 14 buses or nodes and 9 houses. The house consists of a combination of constant current, continuous impedance and constant loads of power. The network proposed incorporates a microgrid with an electric transmission system of 69 kV. There were two voltage output stages. The primary voltage was 13.8 kV and the secondary voltage was 0.22 kV. In the proposed system, three sub-microgrids have been given: AC microgrid 1 is an AC microgrid 2-related area of 0.22 kV through lines 4, 5, 6. In addition, AC microgrid 1 provides electricity to 4 houses and is powered by a diesel generator. AC microgrid 2 is another area with battery power storage 2 and photovoltaic 2 feature. The two AC microgrids run at 50 Hz. Ultimately, the third zone is the photovoltaic 1 DC microgrid and a battery power storage system 1. The battery power storage system 1 is connected by a two-way buck-boost converter, while photovoltaic 2 and DC connections are connected by a boost converter. The DC Bus and the AC microgrid 2 are connected by two parallel bidirectional transformers, which can be used as inverters or rectifiers for two transformers to swap reactive and active power. Finally, this hybrid AC/DC system also has a load equivalent grid network and diesel generators.
5. Controller of Proportional Resonant
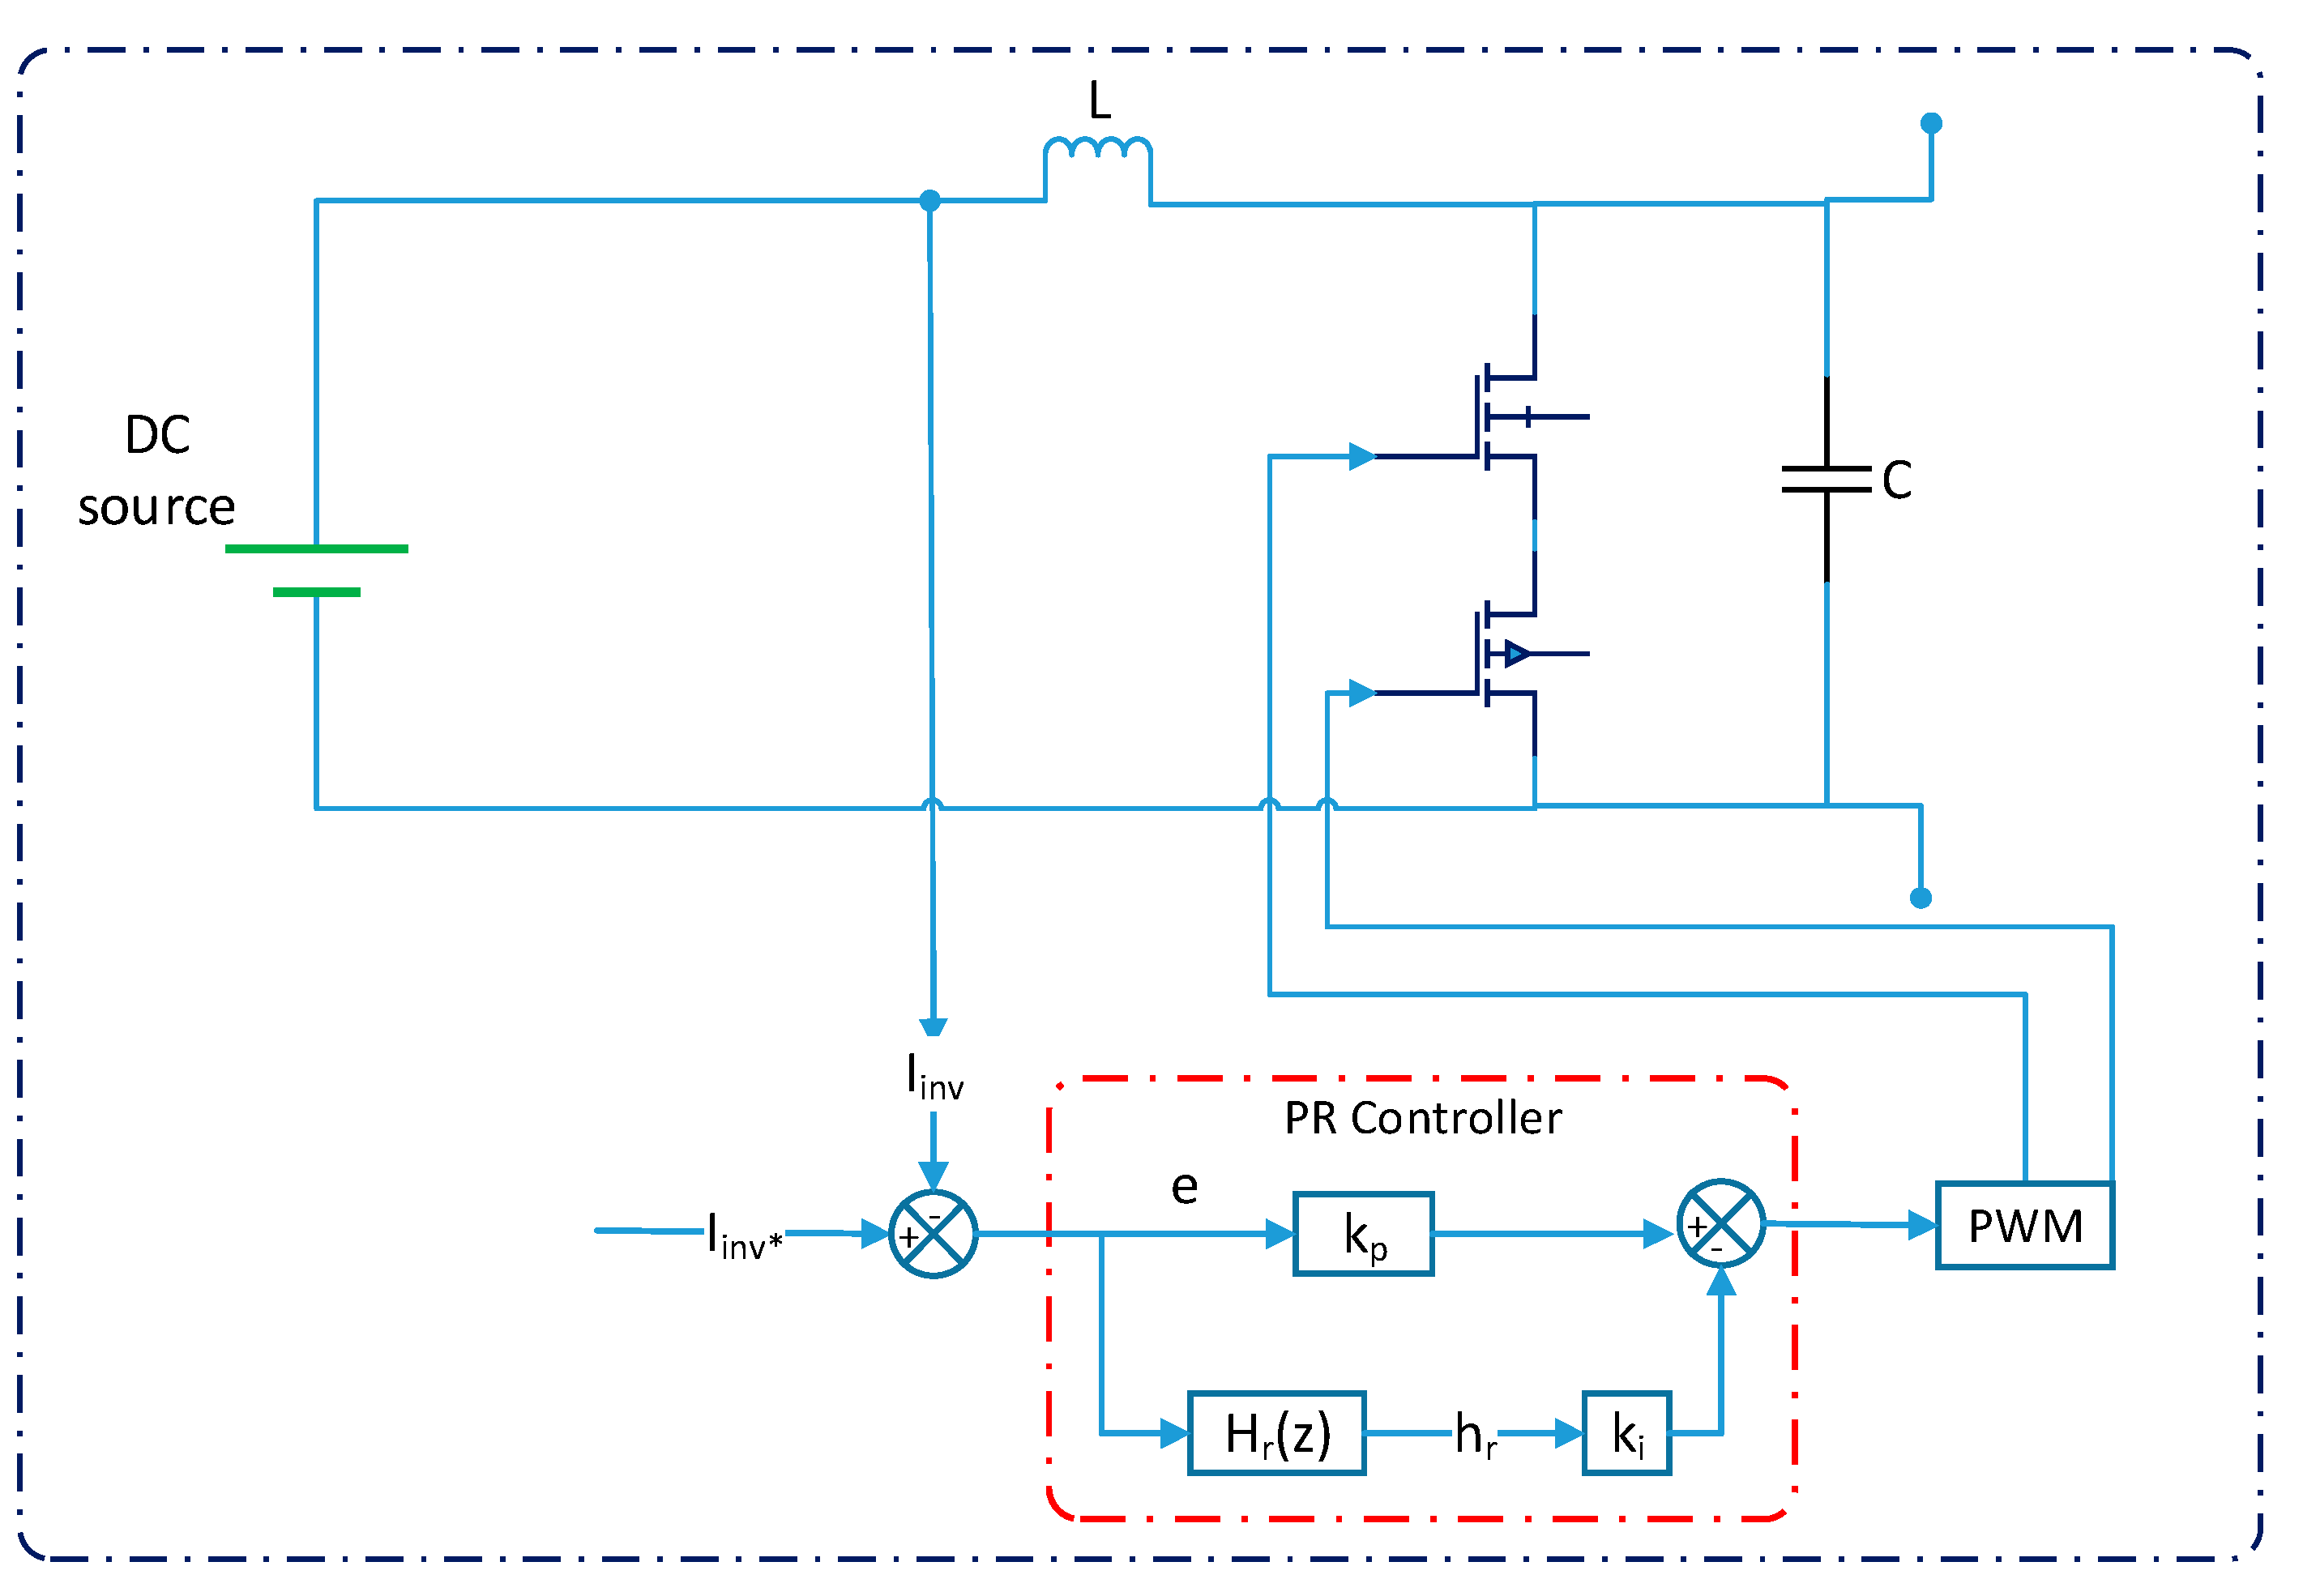
Figure 5 shows the digital PR controller going from a proportional gain (
) and into a resonant direction. As given by Equation (11) and described by the z-domain transfer
function, the resonant path is consistent with the resonant filter and the resonant gain (
).
where:
,
and
are a constant, and
,
,
are real constants.
The resonant filter is often referred to as Notch Filter. The word resonant filter is used in this article. The digital PR controller architecture thus results in the values
,
,
,
,
,
,
, and
. This section describes a design procedure for half-bridge inverters in
Figure 1. However, this process is also applicable to the three-phase inverter and the full-bridge inverters. For the three-phase inverter, designed PR controller can be repeated in the other phases. Knowing the system parameters as shown in
Table 4 [
34].
PR controller resonant (
) and proportional (
) gains are calculated in Equations (12) and (13) [
35].
The third stage involves the calculation of the
,
,
,
,
and
coefficients to be used for the z-domain transfer function. To obtain these coefficients, the Z-transform could be applied to the s-domain analogue resonant filter transfer functions below:
When the Z-transform is applied in Equation (14), the optical resonant filter is given by the Backward–Euler approximation.
The resonant filter coefficients are thus indicated by the following expressions:
where:
Note that the a0 is deliberately defined as 1 to allows z-domain transmission function in Equation (11) to be written as a differential equation by
where
represents the resonant filter output and
represents the resonant filter input. This step can be considered as one of the main contributions of this work. This makes it possible for the designer to compute for resonant filter coefficients when only the desired filter frequency response is defined in the s-domain. Then, Equations (16) to (22) provide digital implementation coefficients.
7. Proposed System Analysis
Two analytical schemes are established to compute metrics for describing the primary cases concerning future studies focusing on optimisation and compensation.
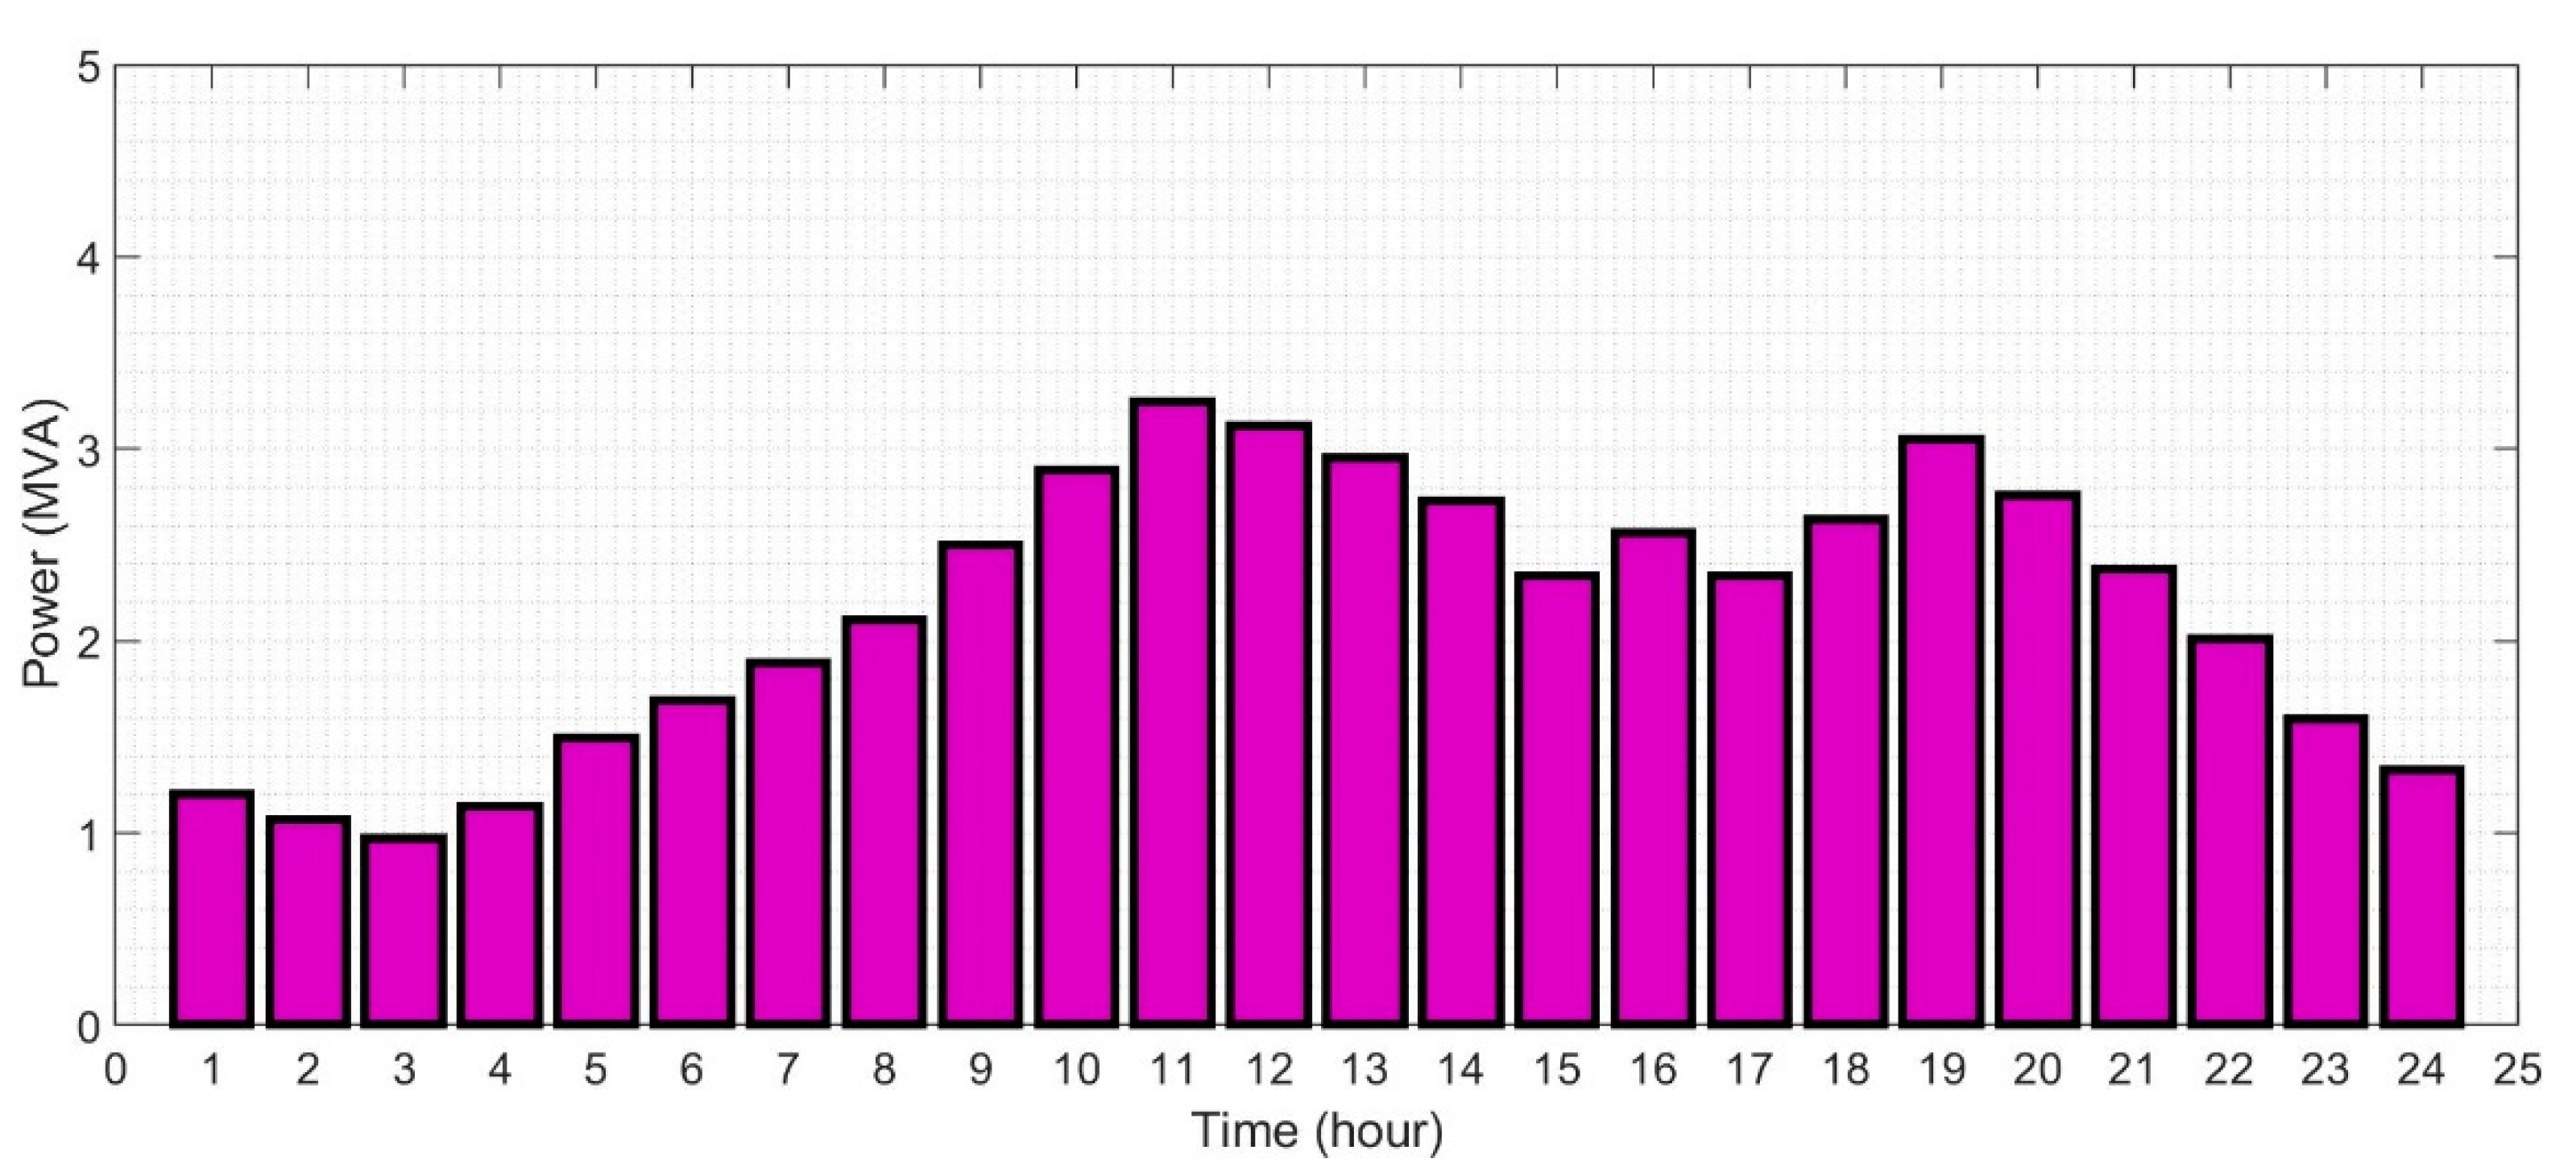
Figure 6 depicts the characteristics of daily demand for the suggested hybrid microgrid system. The curve is obtained by computing total hourly demand specific to every load defined by the model, which includes the critical load components, namely commercial and industrial. Load modelling was based on fixed impedance; therefore, the nominal power and actual power used differ slightly because of the voltage drop created in the system. As illustrated in
Figure 6, the system’s minimum demand is only 30% of the maximum demand. Active and reactive power demand in the system is assumed to have a similar relationship. The minimum demand situation must be used to ascertain the capacity and placement of the compensation mechanism. Interacting compensating components may cause an overvoltage scenario in the system. Referring to
Figure 6, it can be observed that there is maximum demand at 11:00, which is also the time at which solar radiation, and, therefore, solar power production is also maximised. The increased power demand witnessed at this time is caused by the combination of industrial and domestic loads.
8. Voltage Analysis
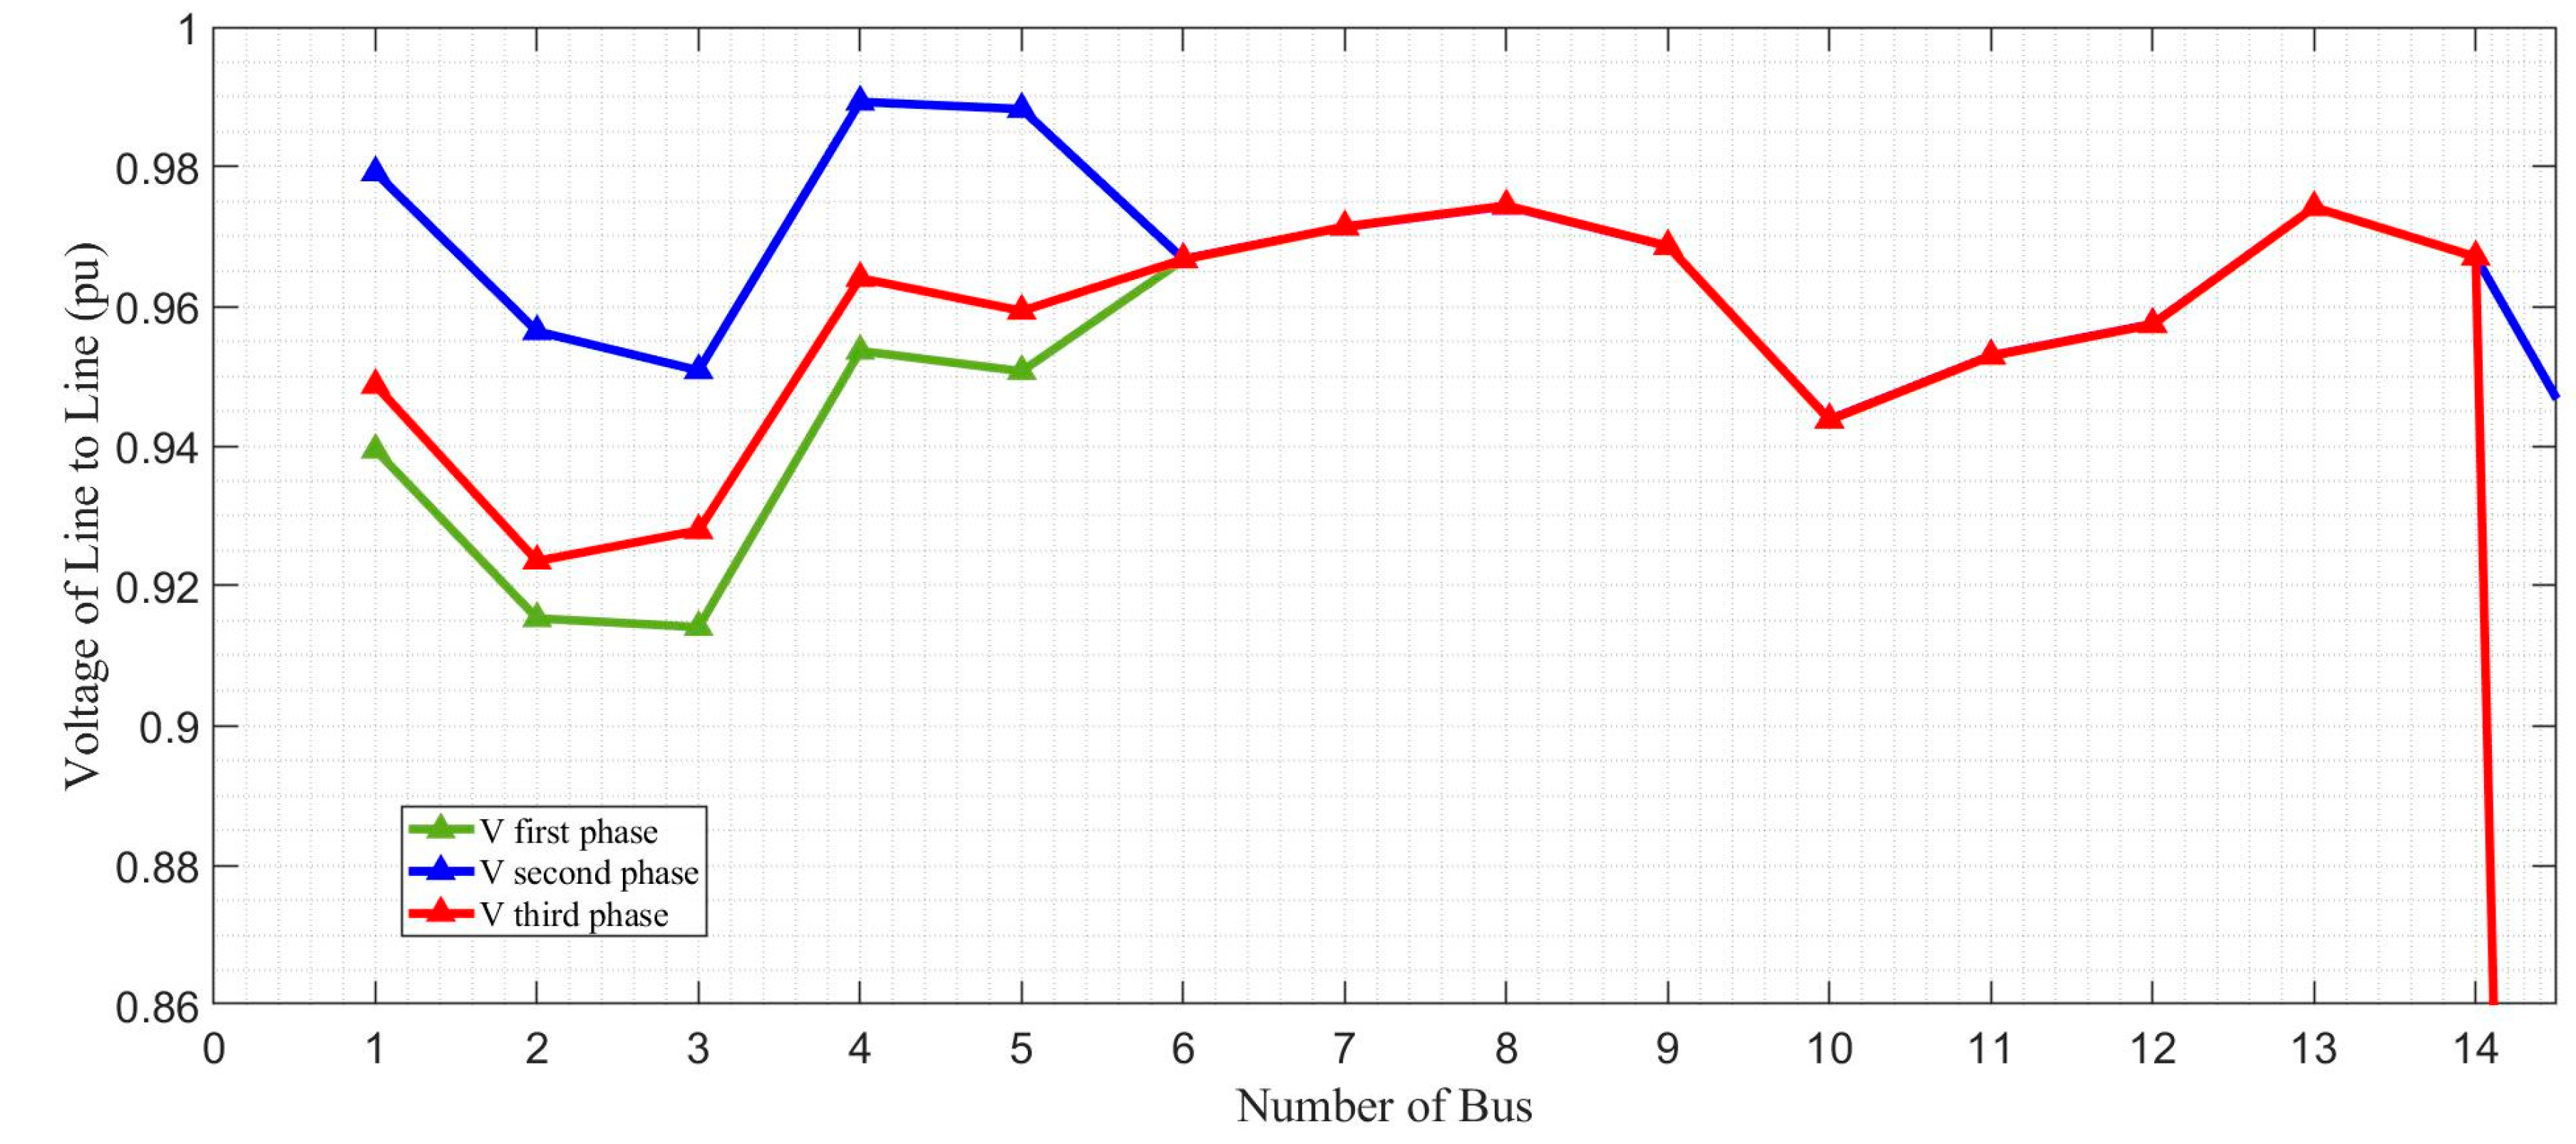
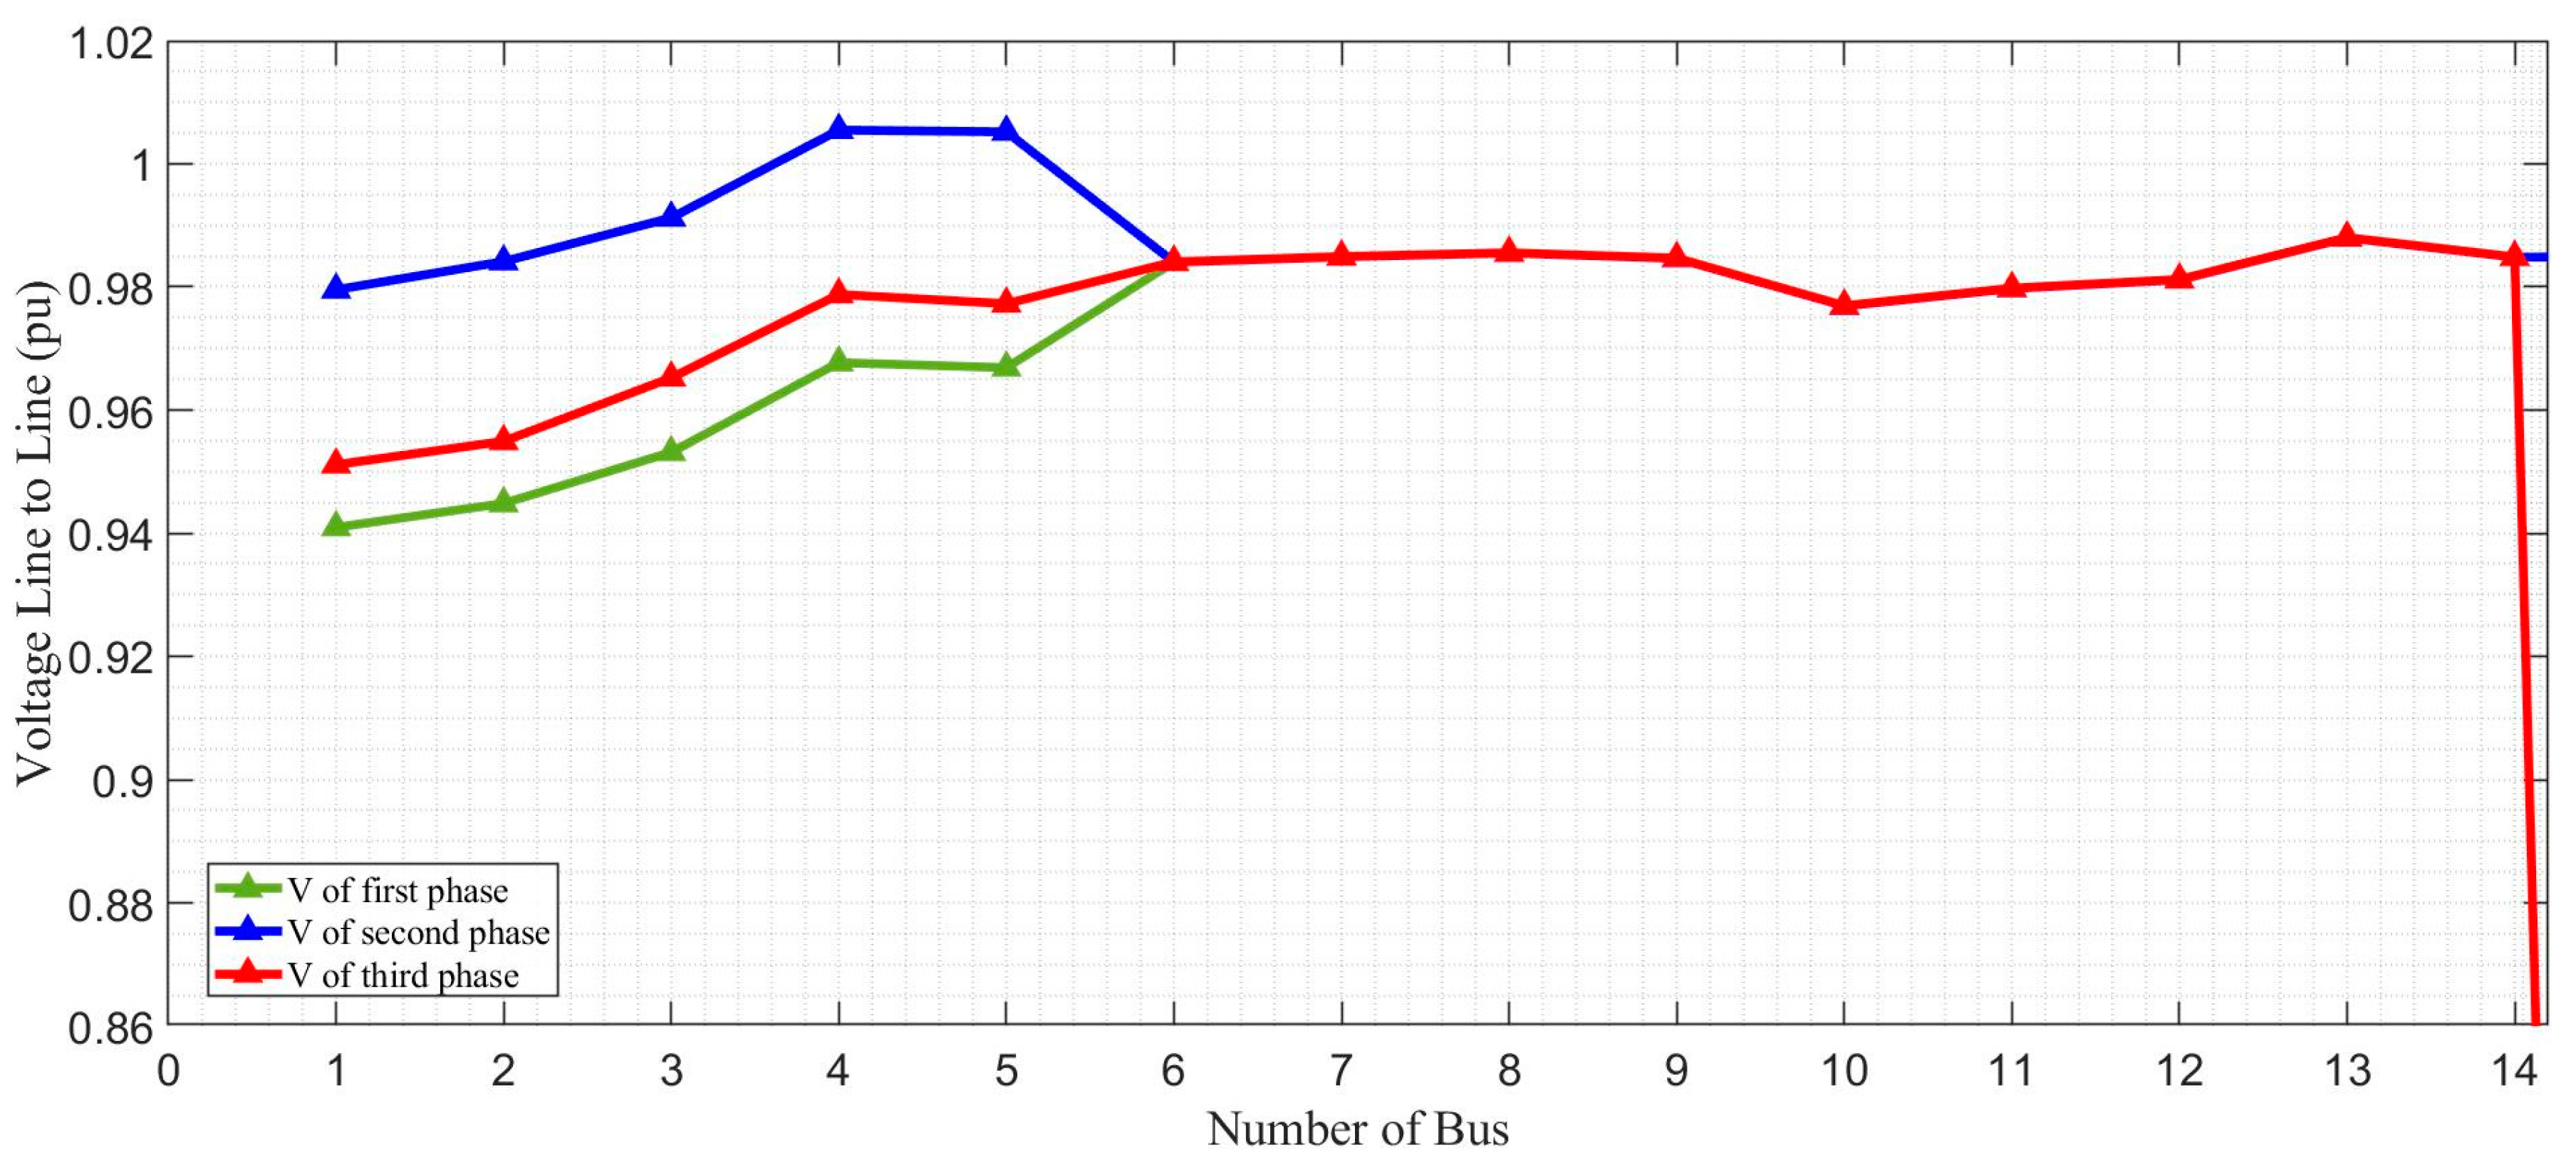
Figure 7 depicts the voltage profile determined for analysing the maximum load energy scenario, while
Figure 8 depicts the voltage profile for minimum load capacity. The system operates under single-phase loading leading to unbalanced loads, thereby warranting a voltage profile analysis. In both situations, the voltage profile adheres to the appropriate operating standards. Nevertheless, as highlighted in
Figure 7, when demand is at its maximum level, low voltage grid (220 V) buses 2 and 3 witness a noteworthy drop in voltage. Voltage profile quality is specified using indicators depicted in
Figure 7 and
Figure 8. Equations (24) and (25) specify the calculation for average voltage deviation for the system.
where:
is the desired voltage, and
is the bus voltage, and n is the buses number.
The maximum voltage deviation magnitude is represented by [
33]:
Using
Figure 7, it can be seen that, under a peak demand situation, the maximum average voltage deviation for the system is up to 0.048 per unit. Nevertheless, this system is determined to have a maximum voltage deviation of 0.072 on bus 3 (first, second, and third stage values are 0.087, 0.05, and 0.08, respectively).
Figure 8 depicts that, under a minimum load situation, the voltage profile for all buses is positive. The computation of the average of maximum deviations and system voltage deviations is quite low, thereby highlighting that the system is operating under appropriate conditions. The analysis and computation for this scenario were performed concerning the reactive power compensation scheme to address maximum demand situation that could potentially affect minimum demand setting with respect to its voltage profile.
In the case study, the fictitious w-domain was used to numerically check the precision and frequency response of the system PR controller with a fictional w-plane. W-domain is a technique that allows structures to be evaluated in a z-domain near the s-domain by frequency charts. All advantages in the frequency domain are regarded as true for the mapping of the z plane into the w plane, except for high frequency. The w-transformation is given by the z-plane to the w-plane transformation.
The PR controller’s resonant filter, described by
, is first analysed. The built resonant filter is therefore mapped to the w-plane.
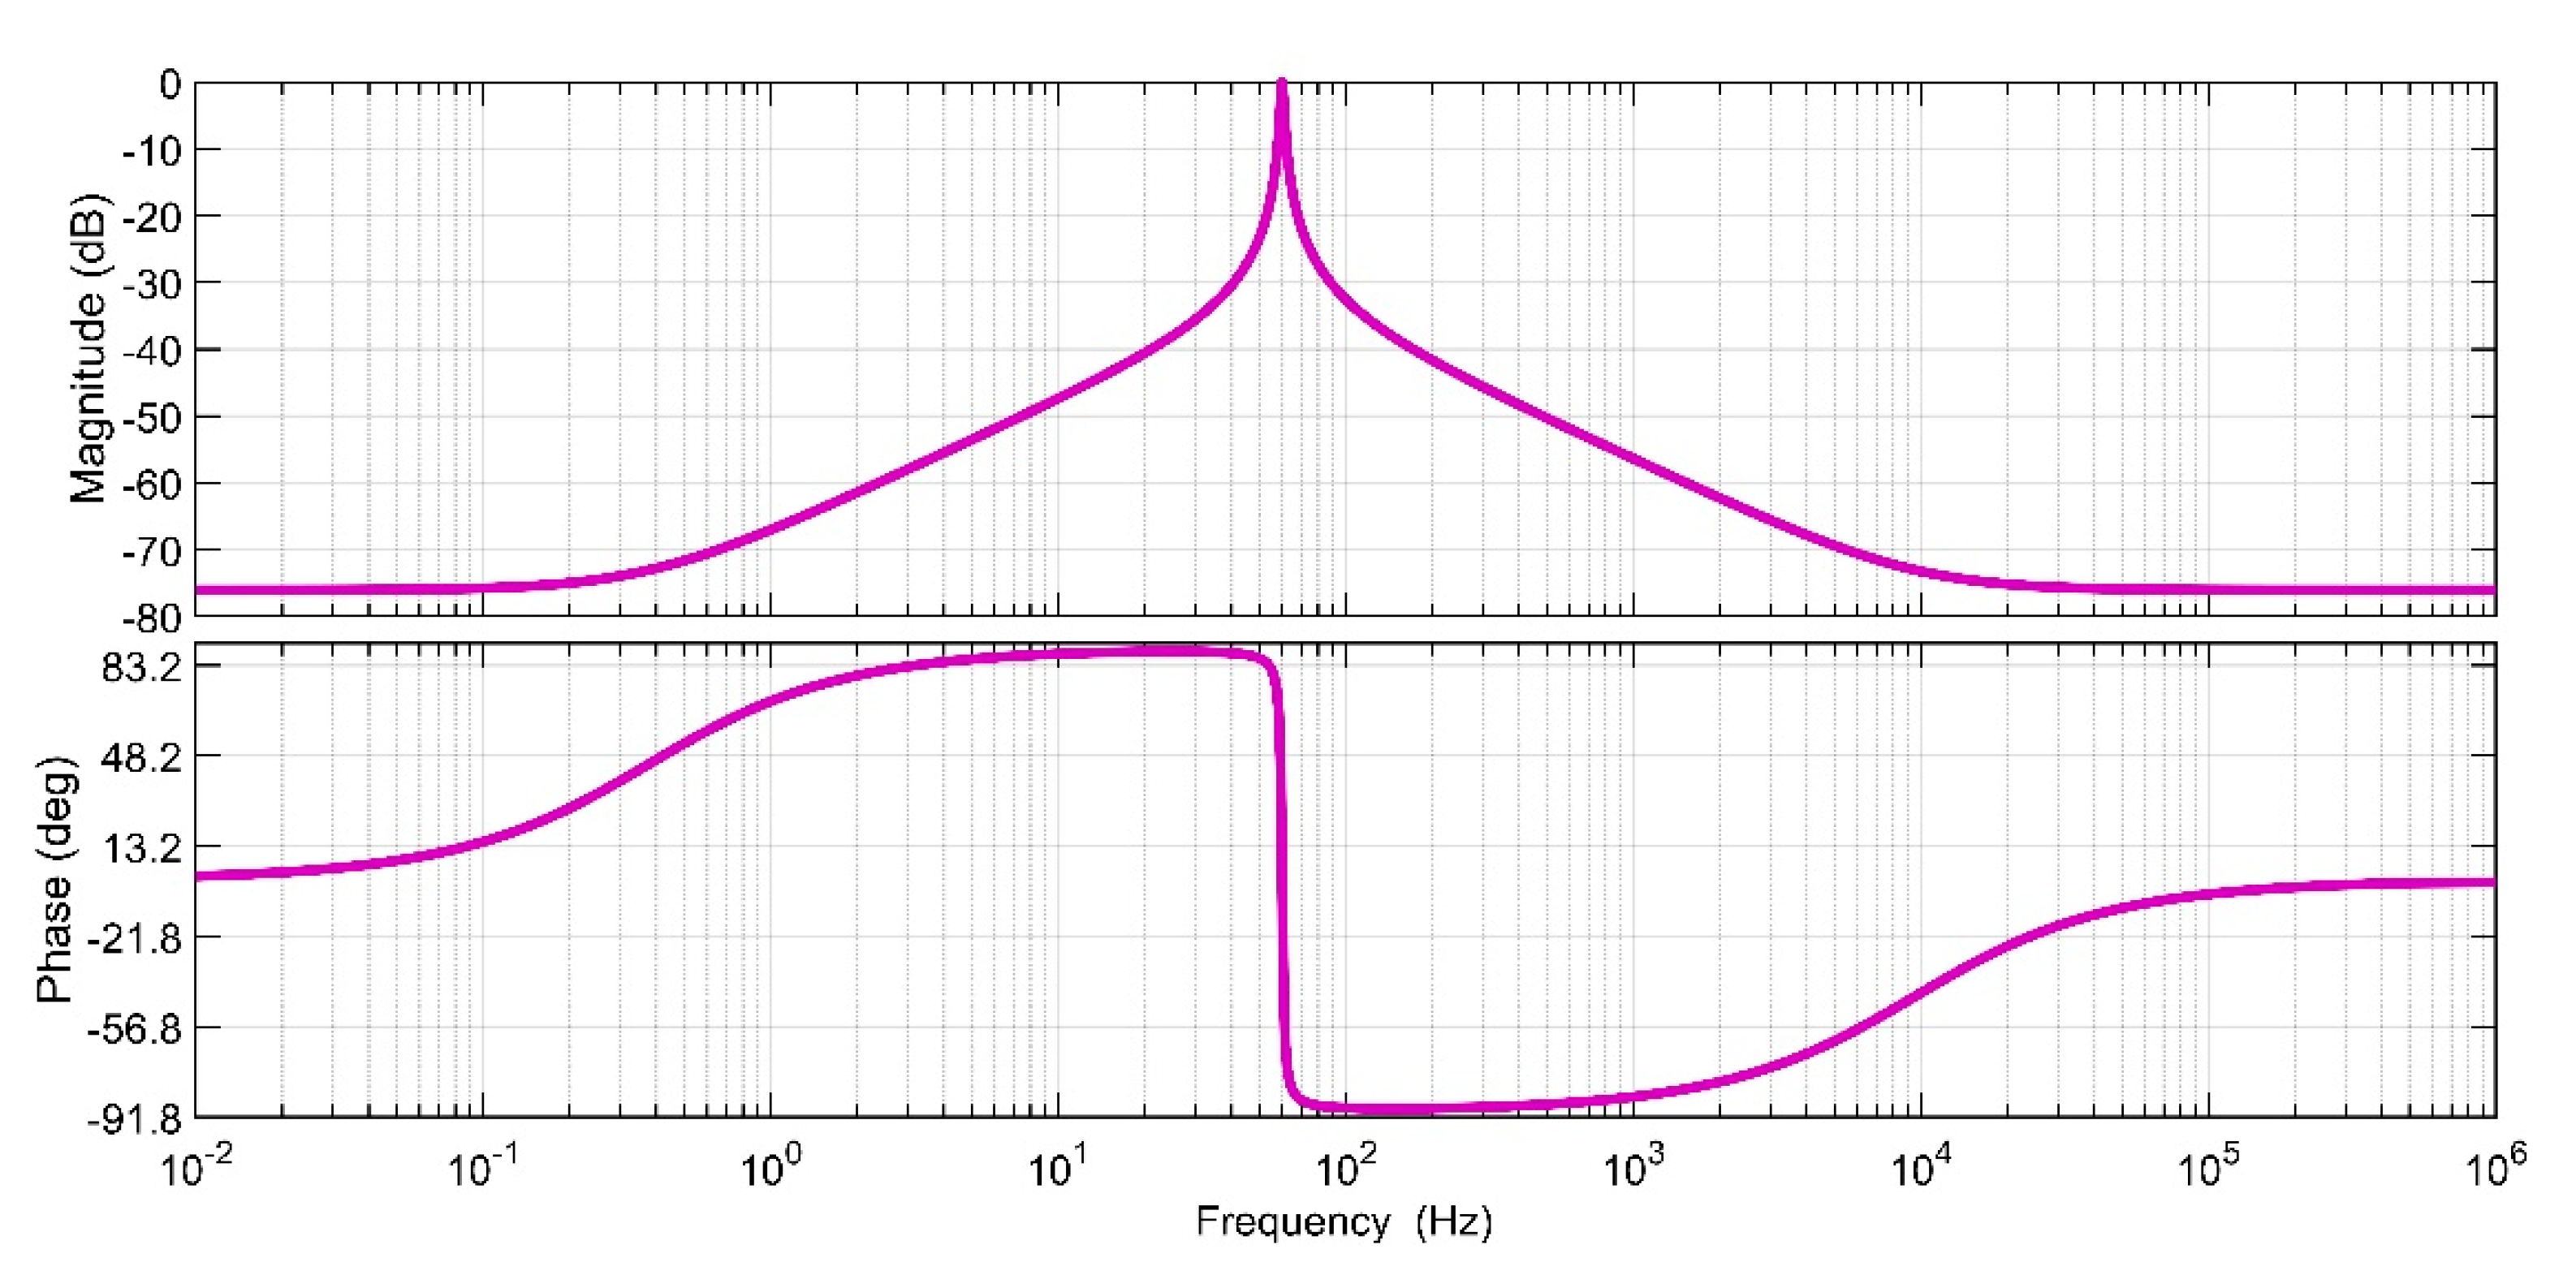
Figure 9 shows the magnitude response of the design resonant filter in w-domain. Note that in the third phase of the design process, the resonant filter does not include the resonant gain measured.
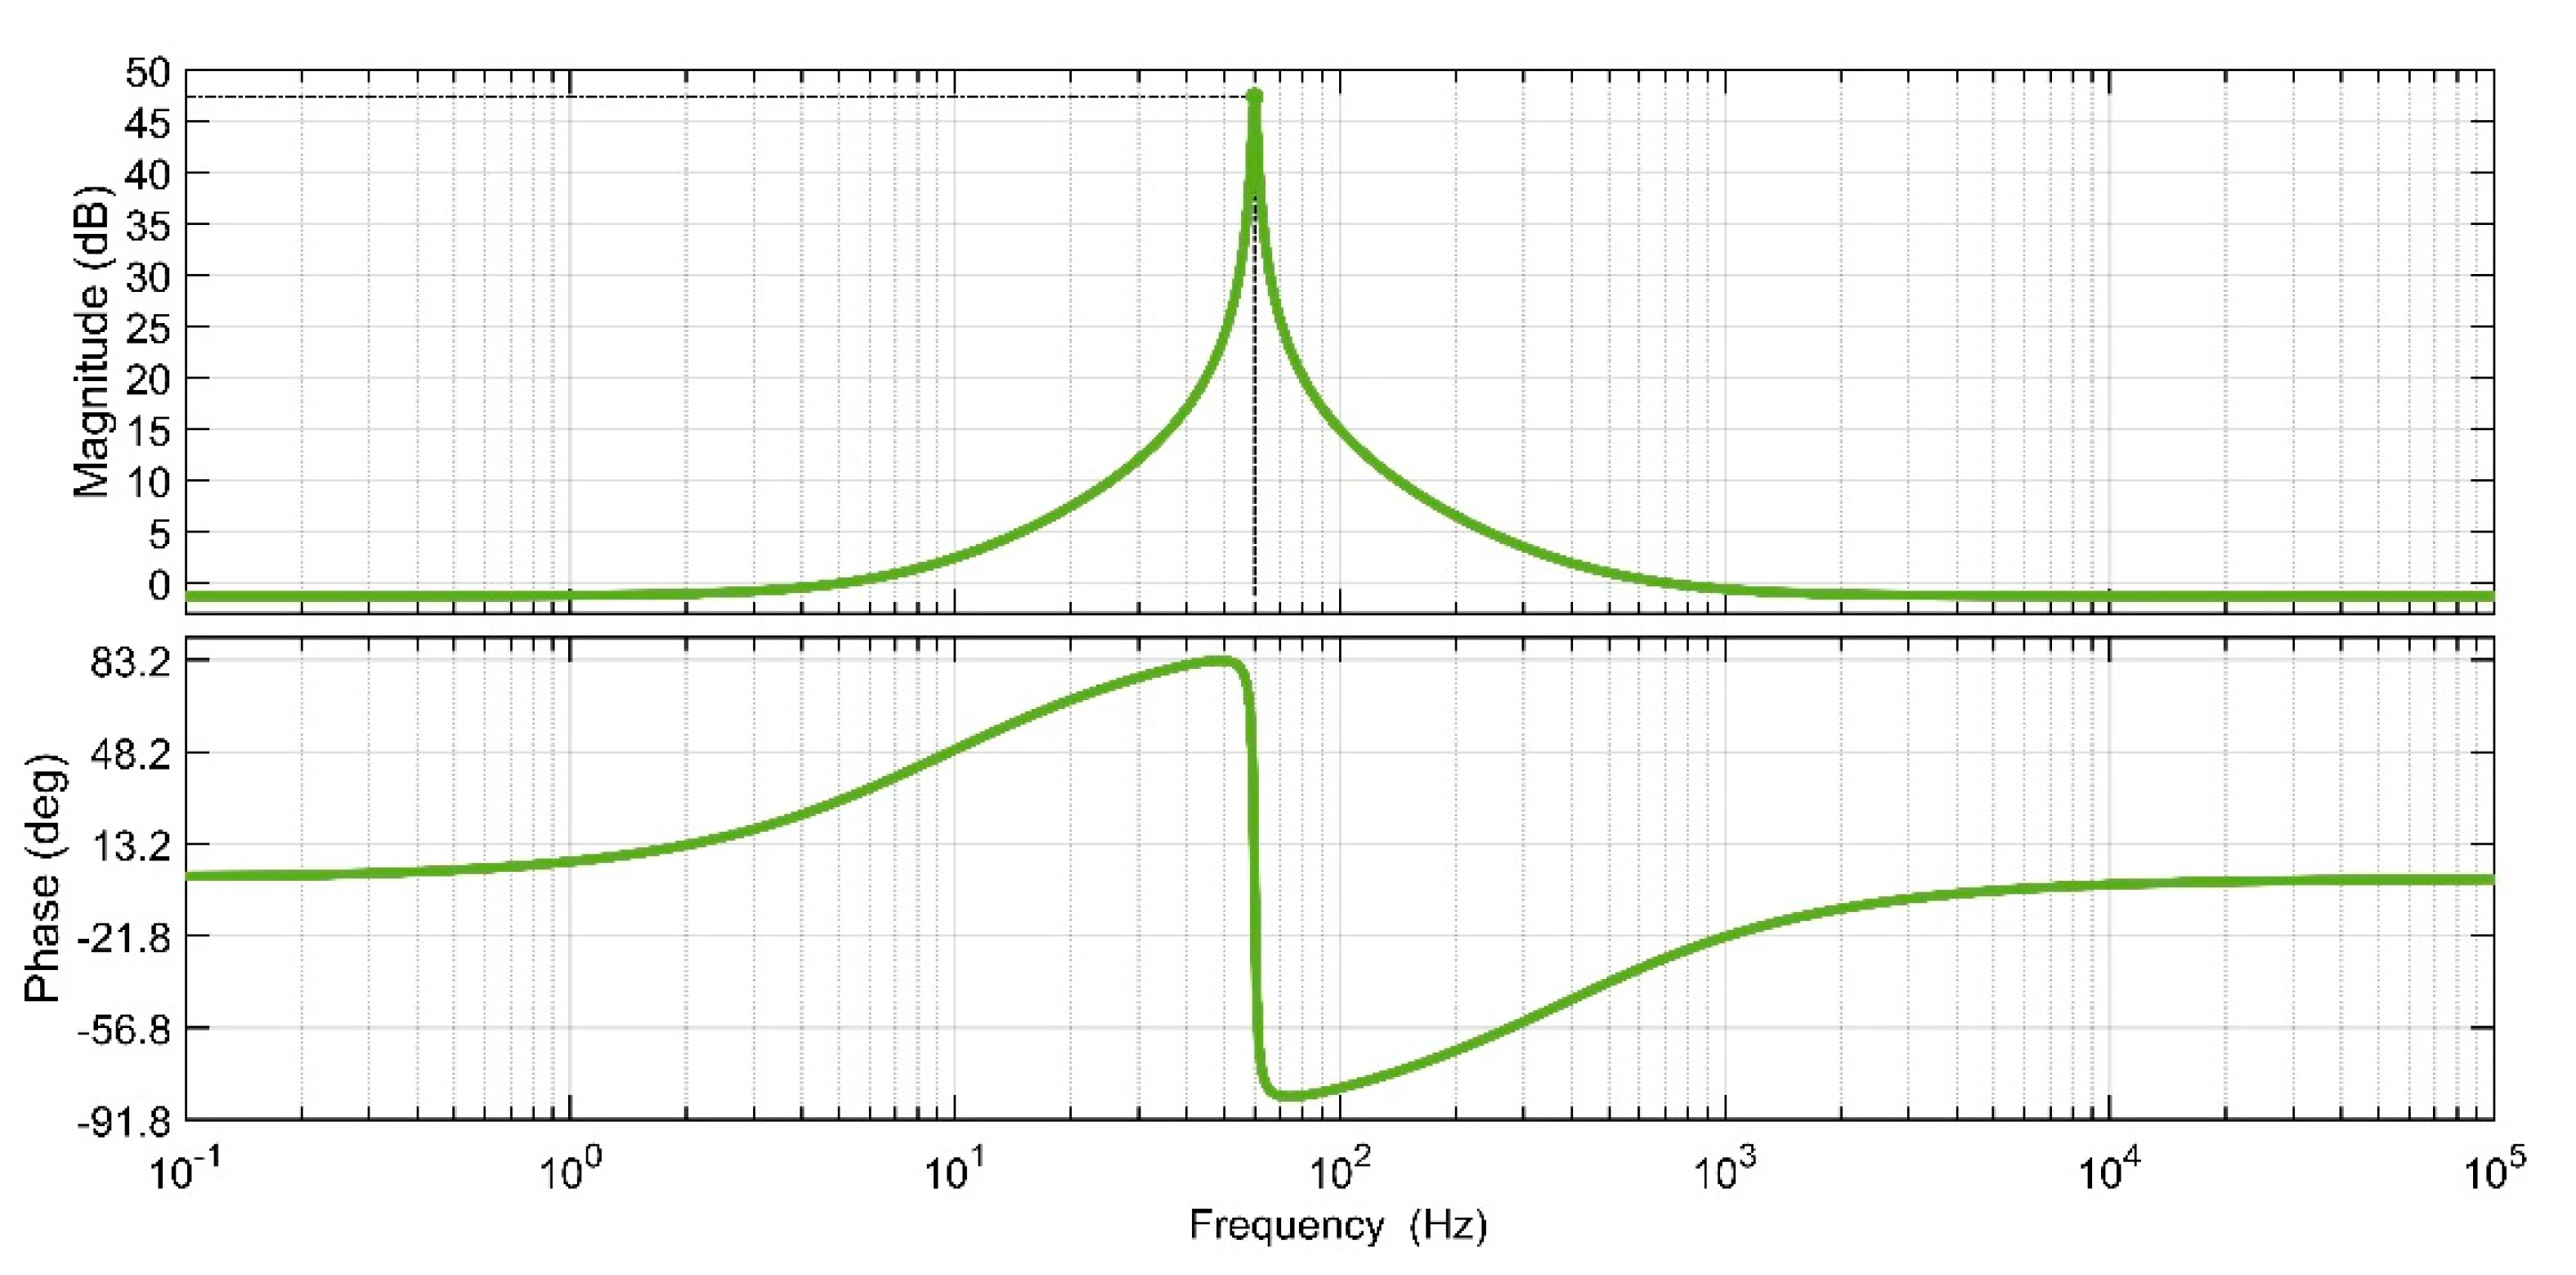
Figure 10 shows the magnitude response phase response of the designed PR controller.
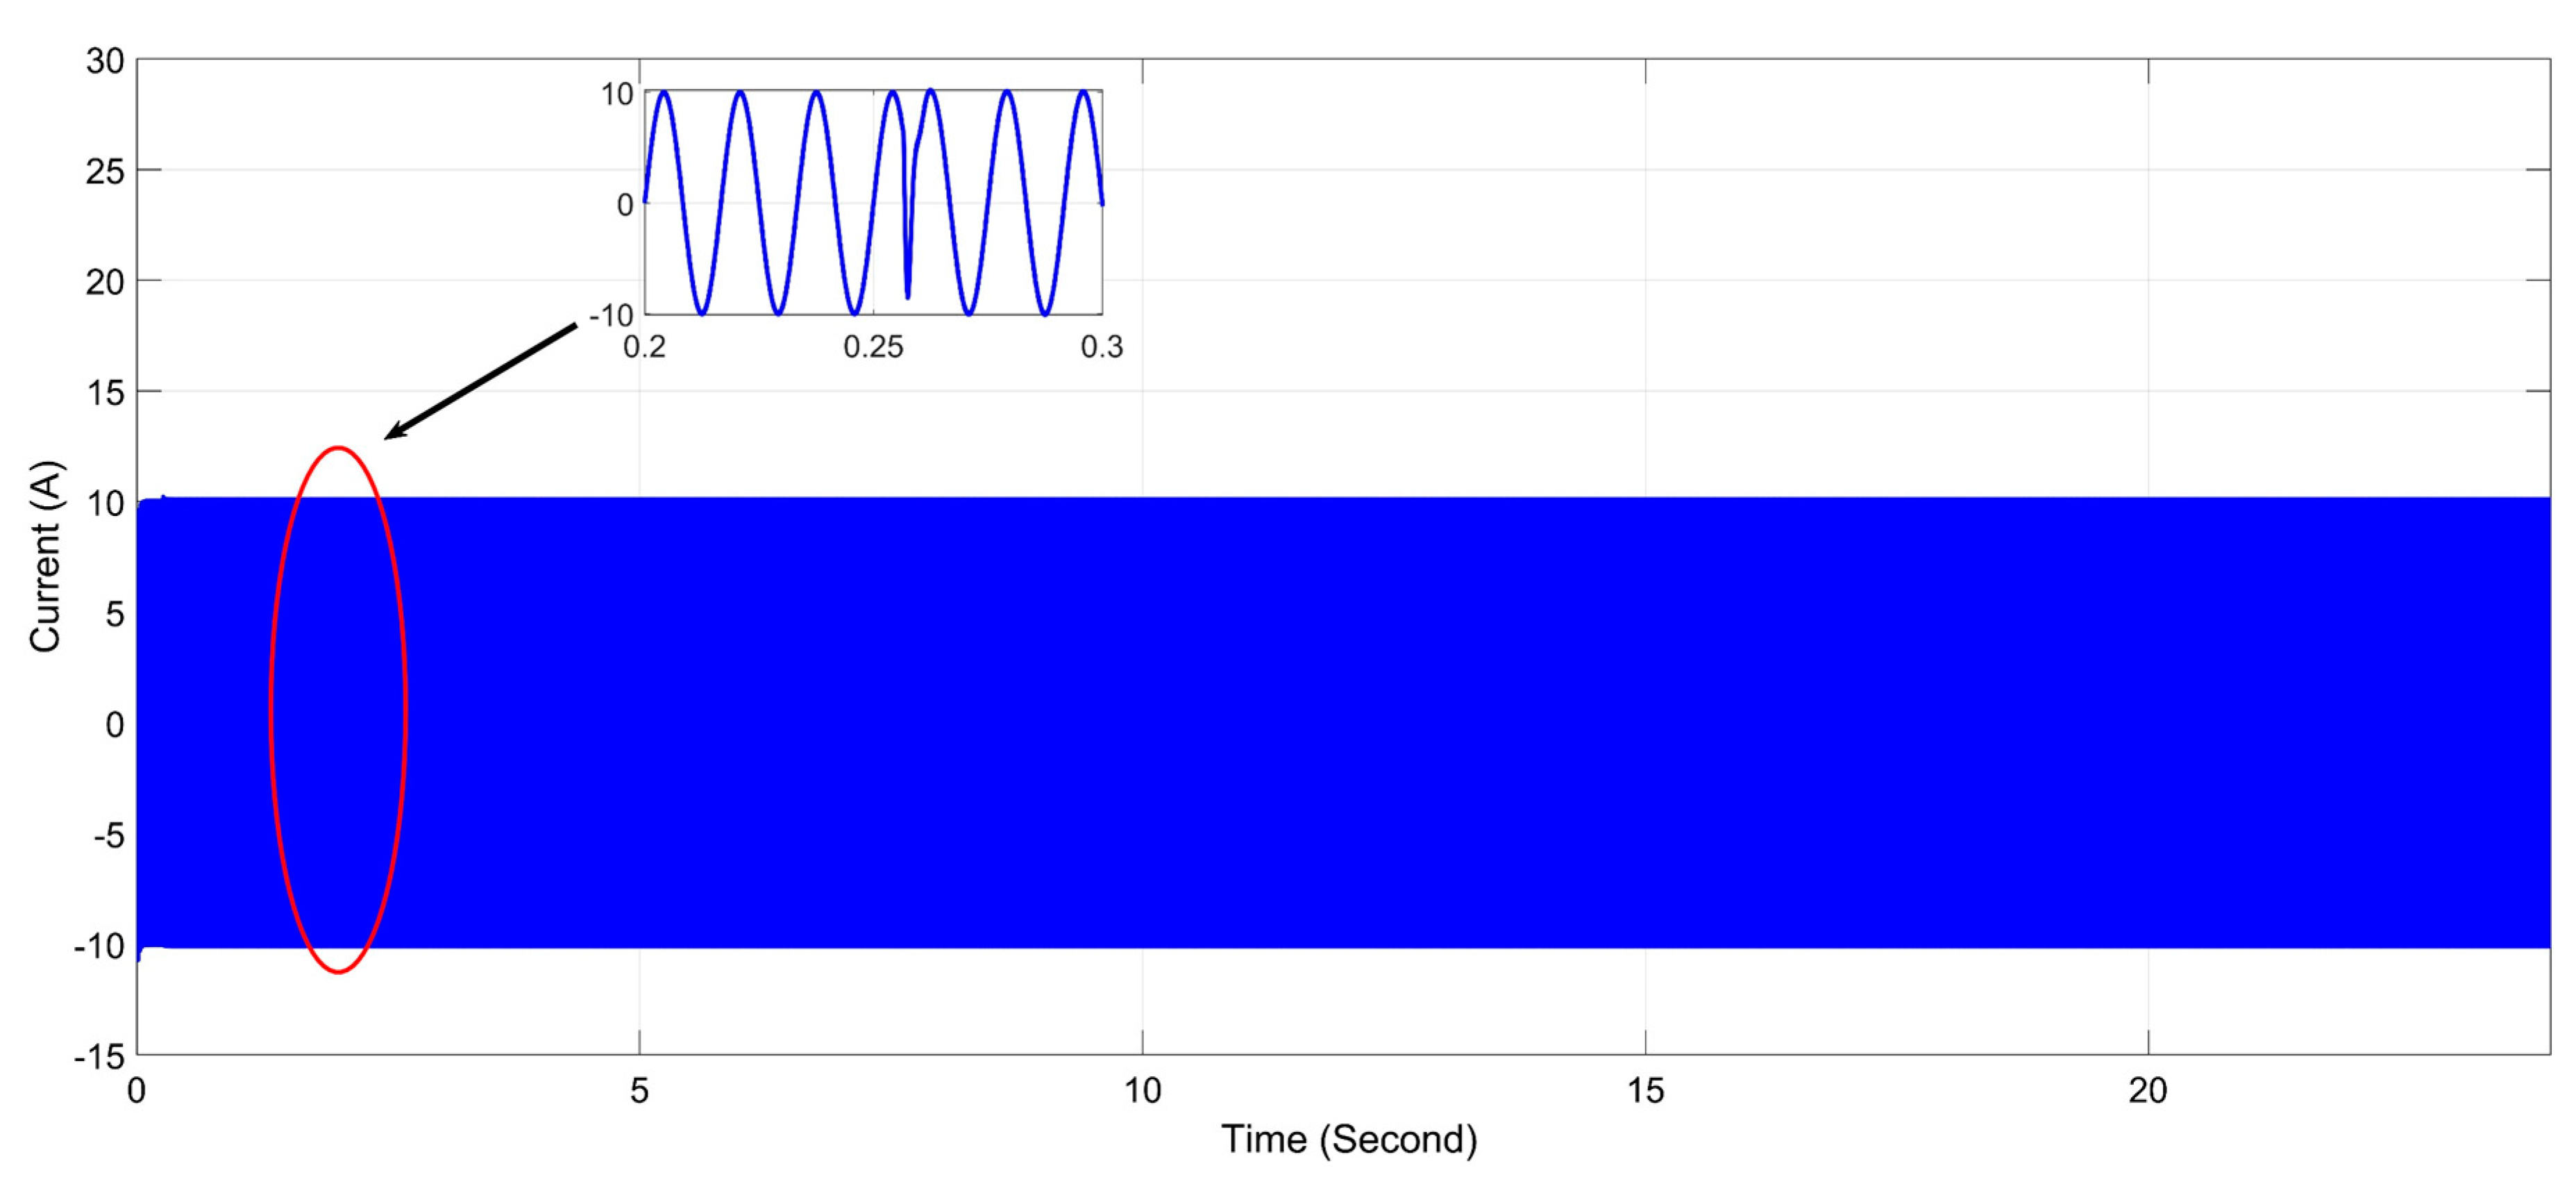
Figure 11 illustrate the output current of inverters.
9. Power Flow Result
Figure 1 shows the hybrid microgrid system, in which all vector angle values are calculated with a phase-locked notch filter adaptive to a loop. Phase lock loop has an auxiliary circuit which gets the phase angle at one stage from the instantaneous voltage waveform. In addition, the angle of the phase current is obtained in the same phase from the instantaneous current wave. Then these two values are subtracted before
for all buses is calculated.
At the basic frequency, the power block calculates the reactive power (
) and active power (
) in the basic frequency. The output variables (
) and (
) are then determined at every fundamental waveform time, as set out in Equations (31) and (32) [
33]:
This section also demonstrates the proposed system’s simulation result. Hybrid microgrids are responsible for stabilising the operations in stable condition under minimum and maximum demand scenario. Simulink furnished per phase calculations. However, the active and reactive power value presented in
Table 7 and
Table 8 represent the sum of per phase power, or in other words, the sums for the three-phase active and reactive power. For any load bus,
and
are presented, while
and
are presented for any generator bus. Lastly, for any transfer bus,
and
are given.
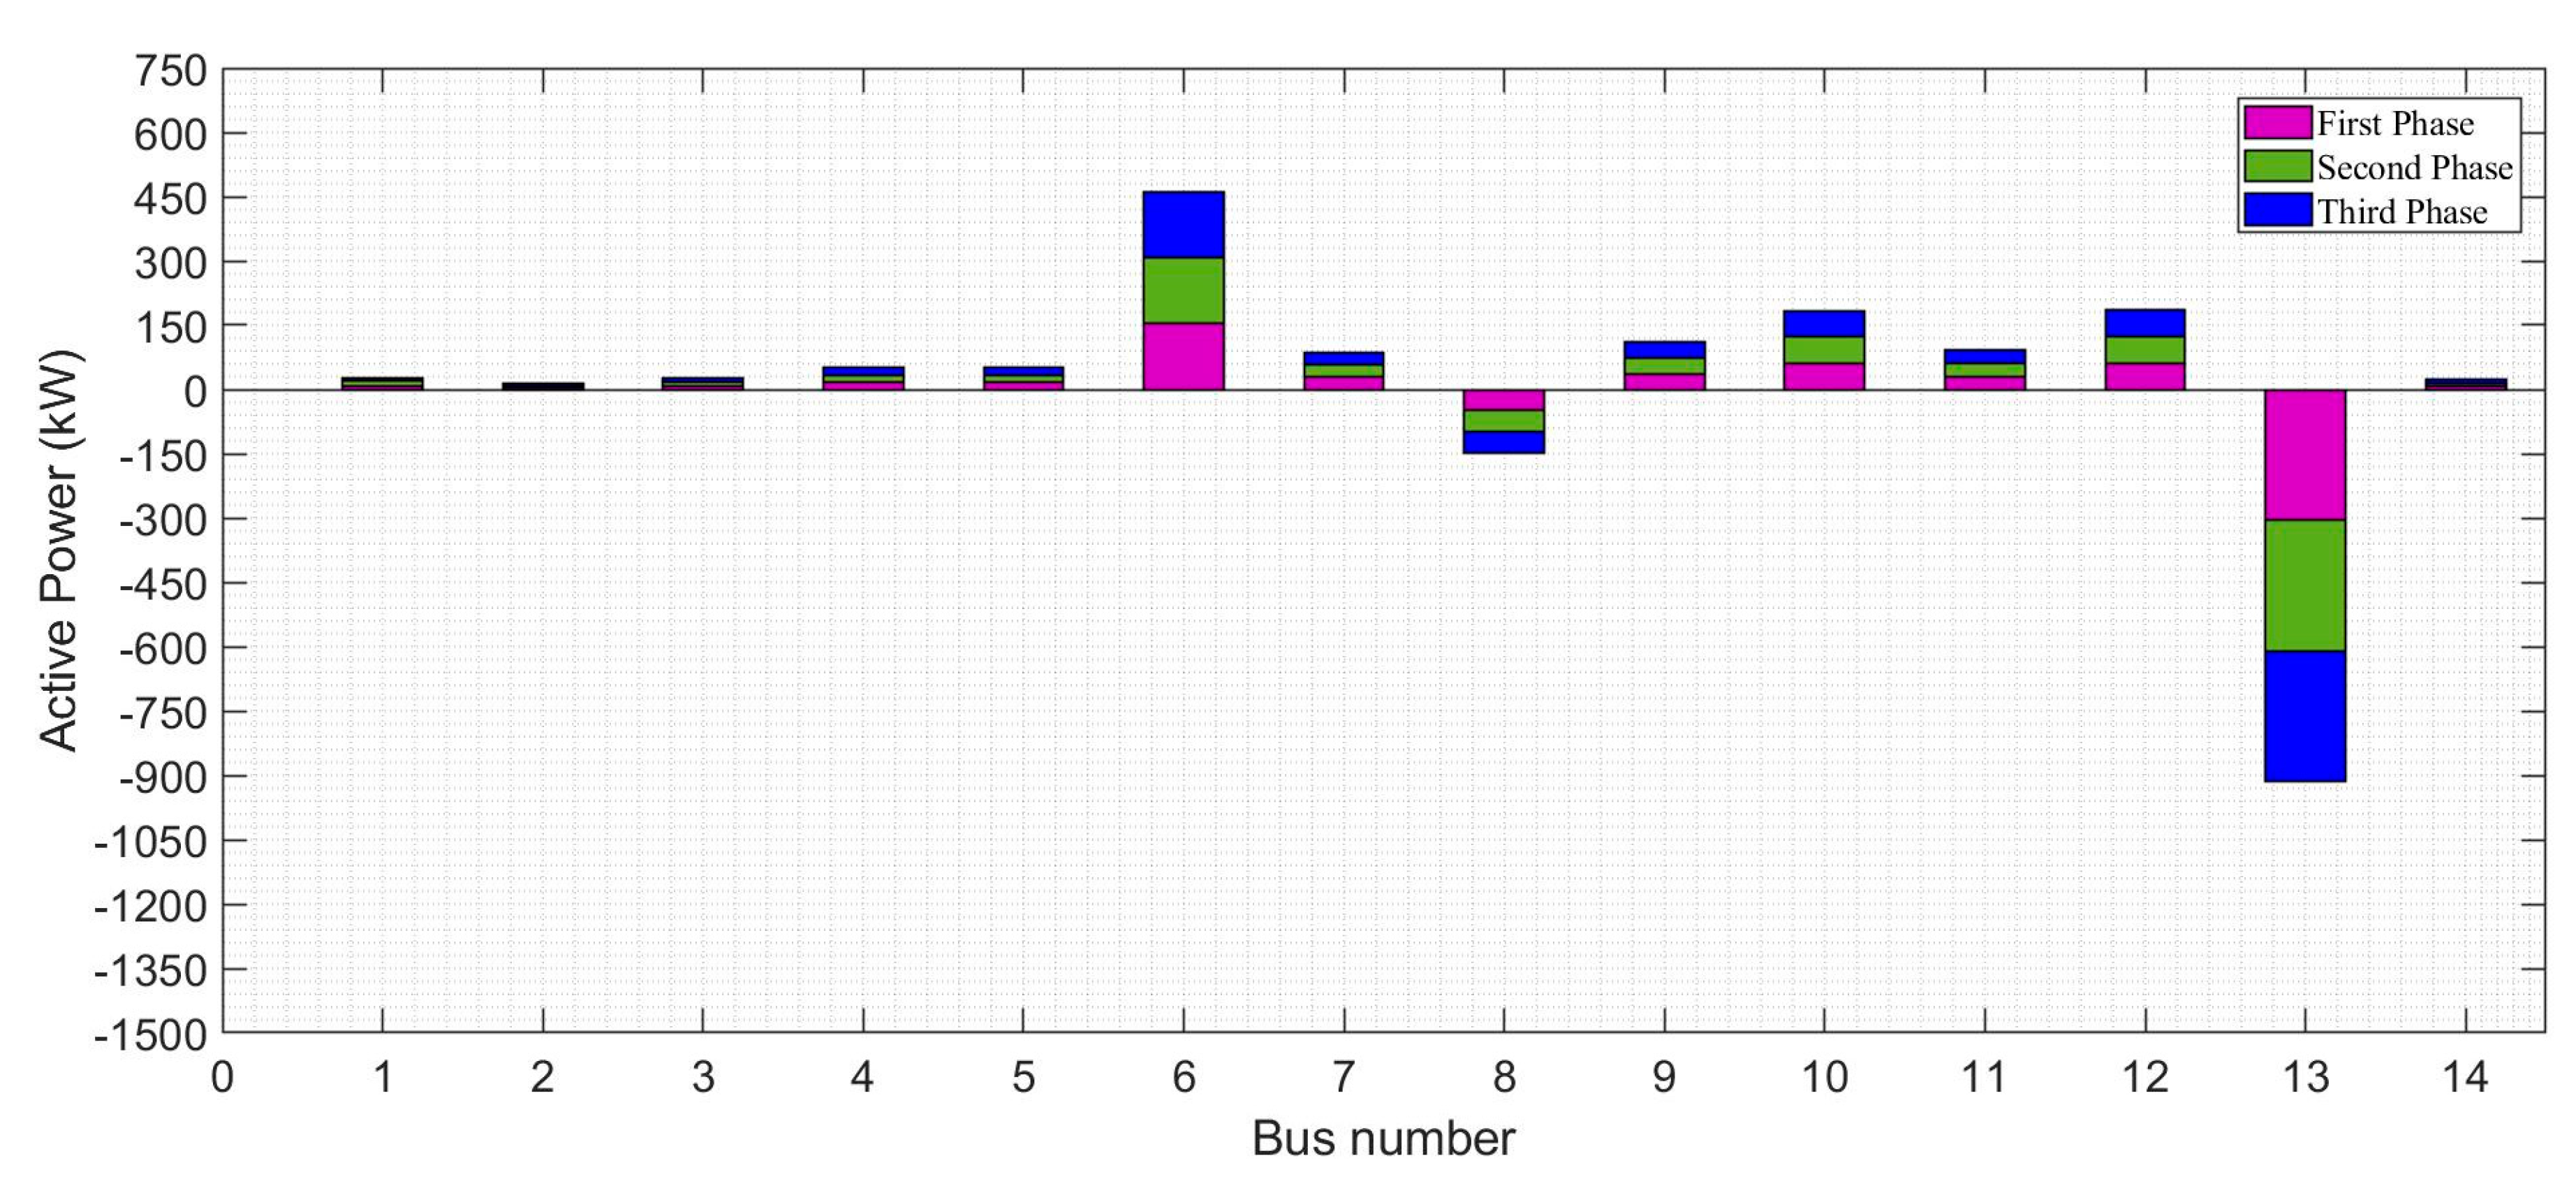
10. Active Power Balance per Bus
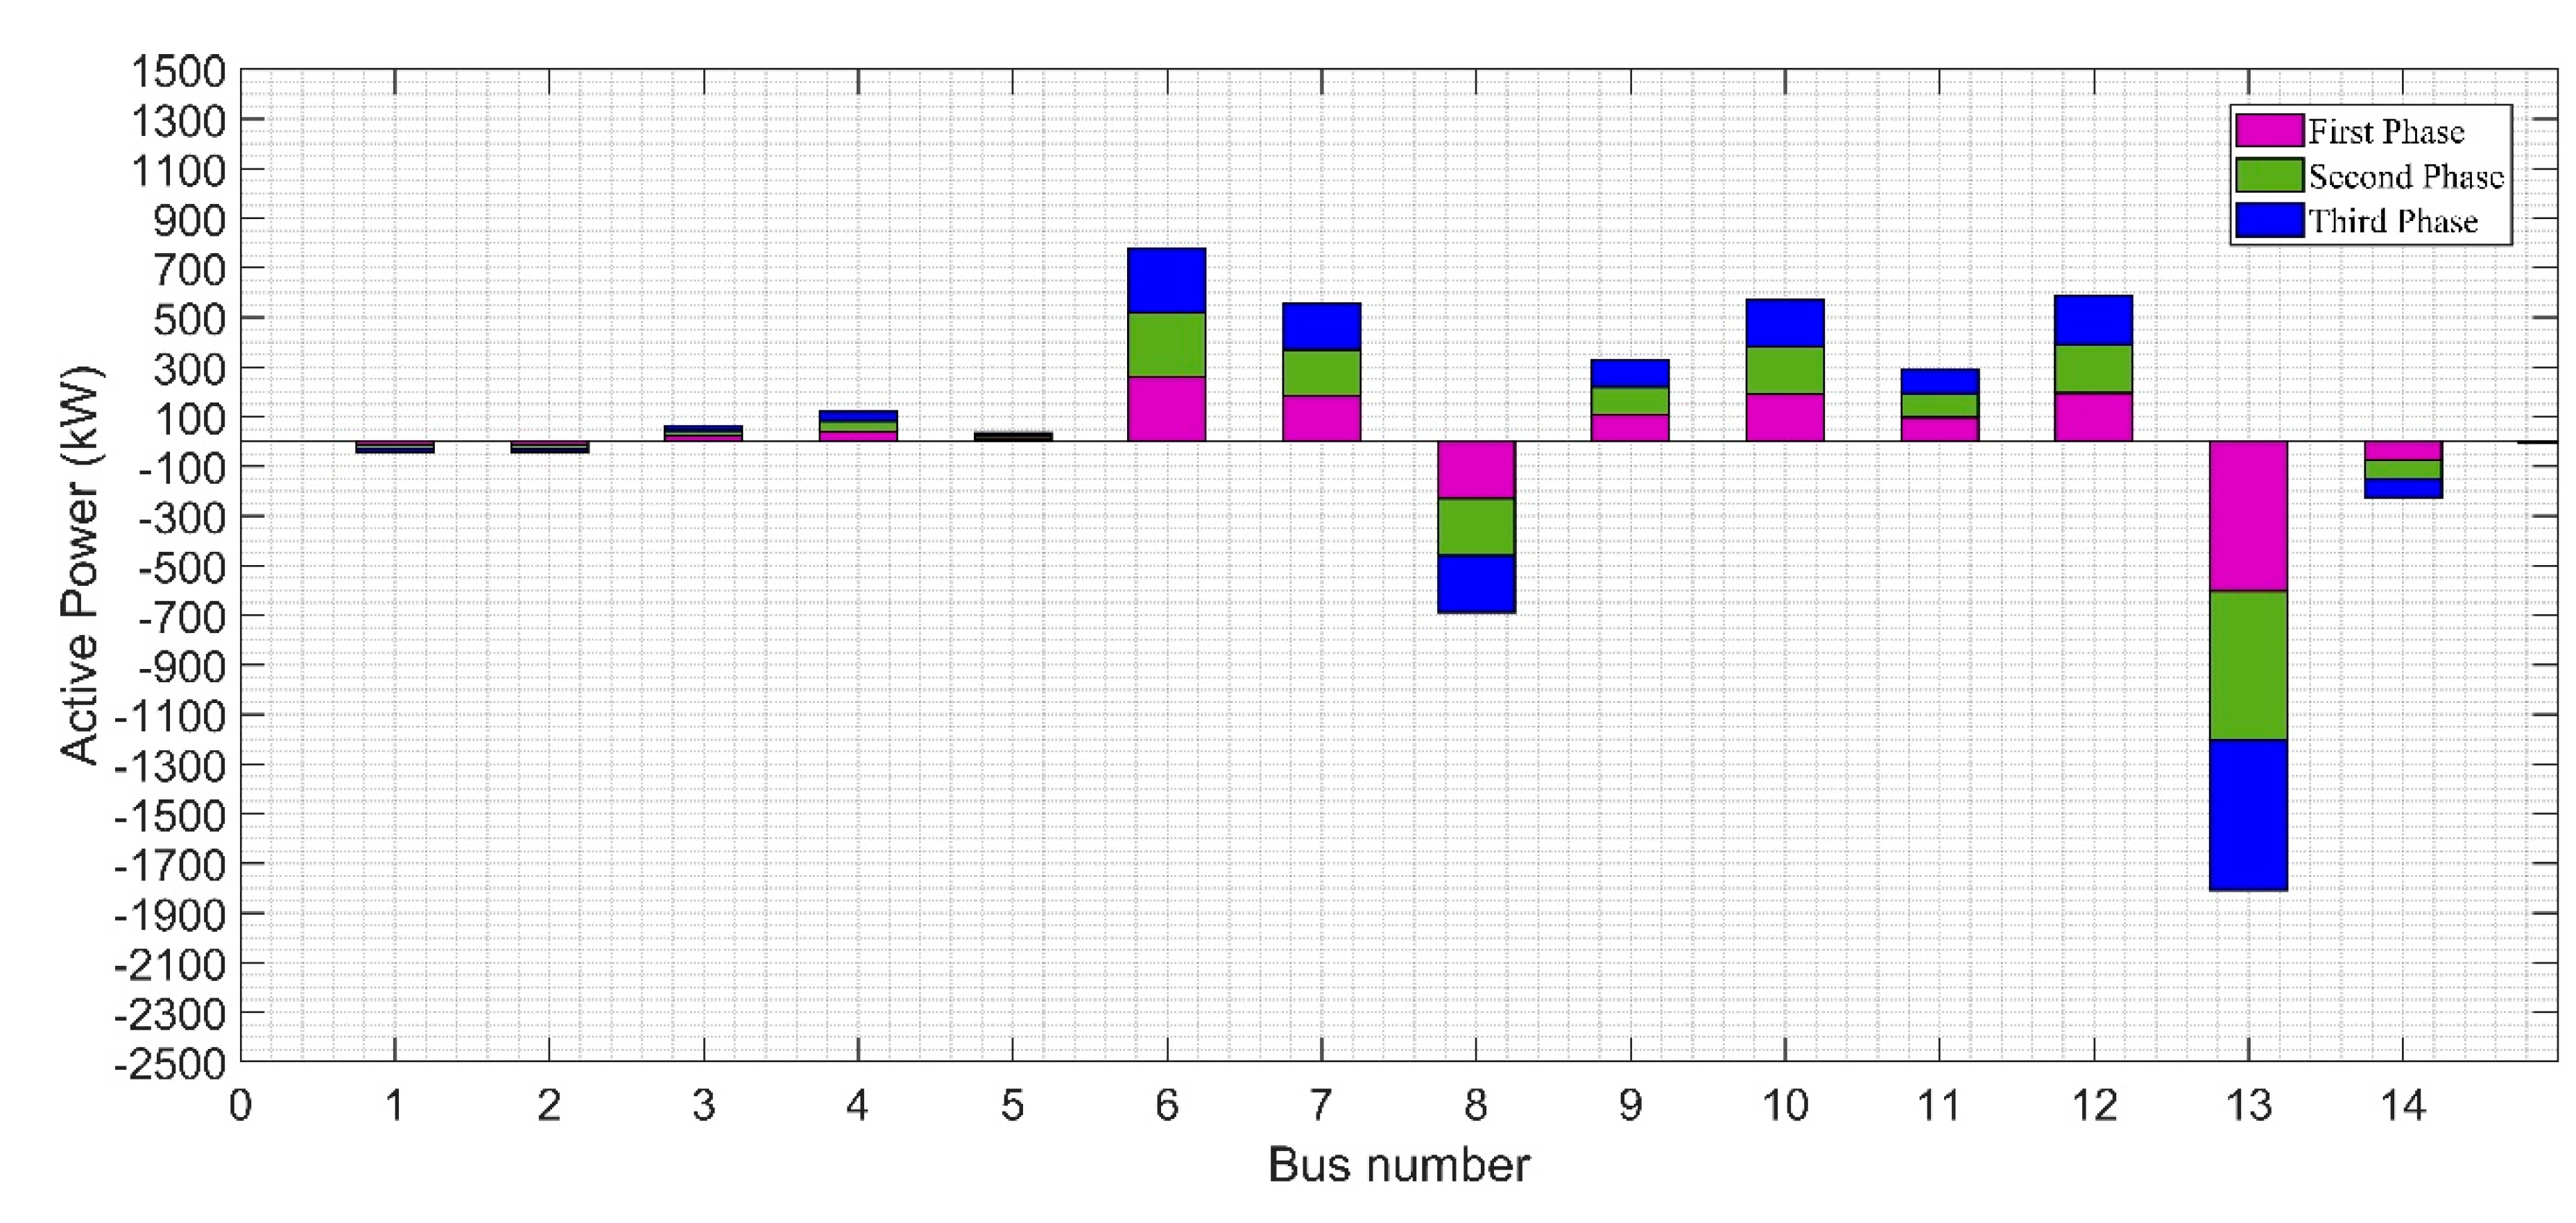
Figure 12 and
Figure 13 highlights the power production and consumption characteristics (in kVA) for every system bus, including the power level (kW) at the DC bus. A positive value on the graph indicates the power (load) drawn by the bus. Bus 14 has a negative power level; hence, there is a transfer to bus 14 from bus 9 acting as a source of power concerning the diesel generation.
Table 7 and
Table 8 describe these situations along with the residual negative capacity for generation specific to the bus. Considering the maximum demand situation in
Figure 12, there are six bus (1, 2, 6, 7, 13, and the DC bus) that generate power.
Figure 13 depicts the balance of power in the system concerning the minimum demand situation. At maximum demand, the power level for every bus decreases. For this situation, the characteristics of distributed generation are specified, leaving diesel generator 8 connected to the bus. At the same time, the remaining inactive power contribution is made through bus 13 connected to the grid.
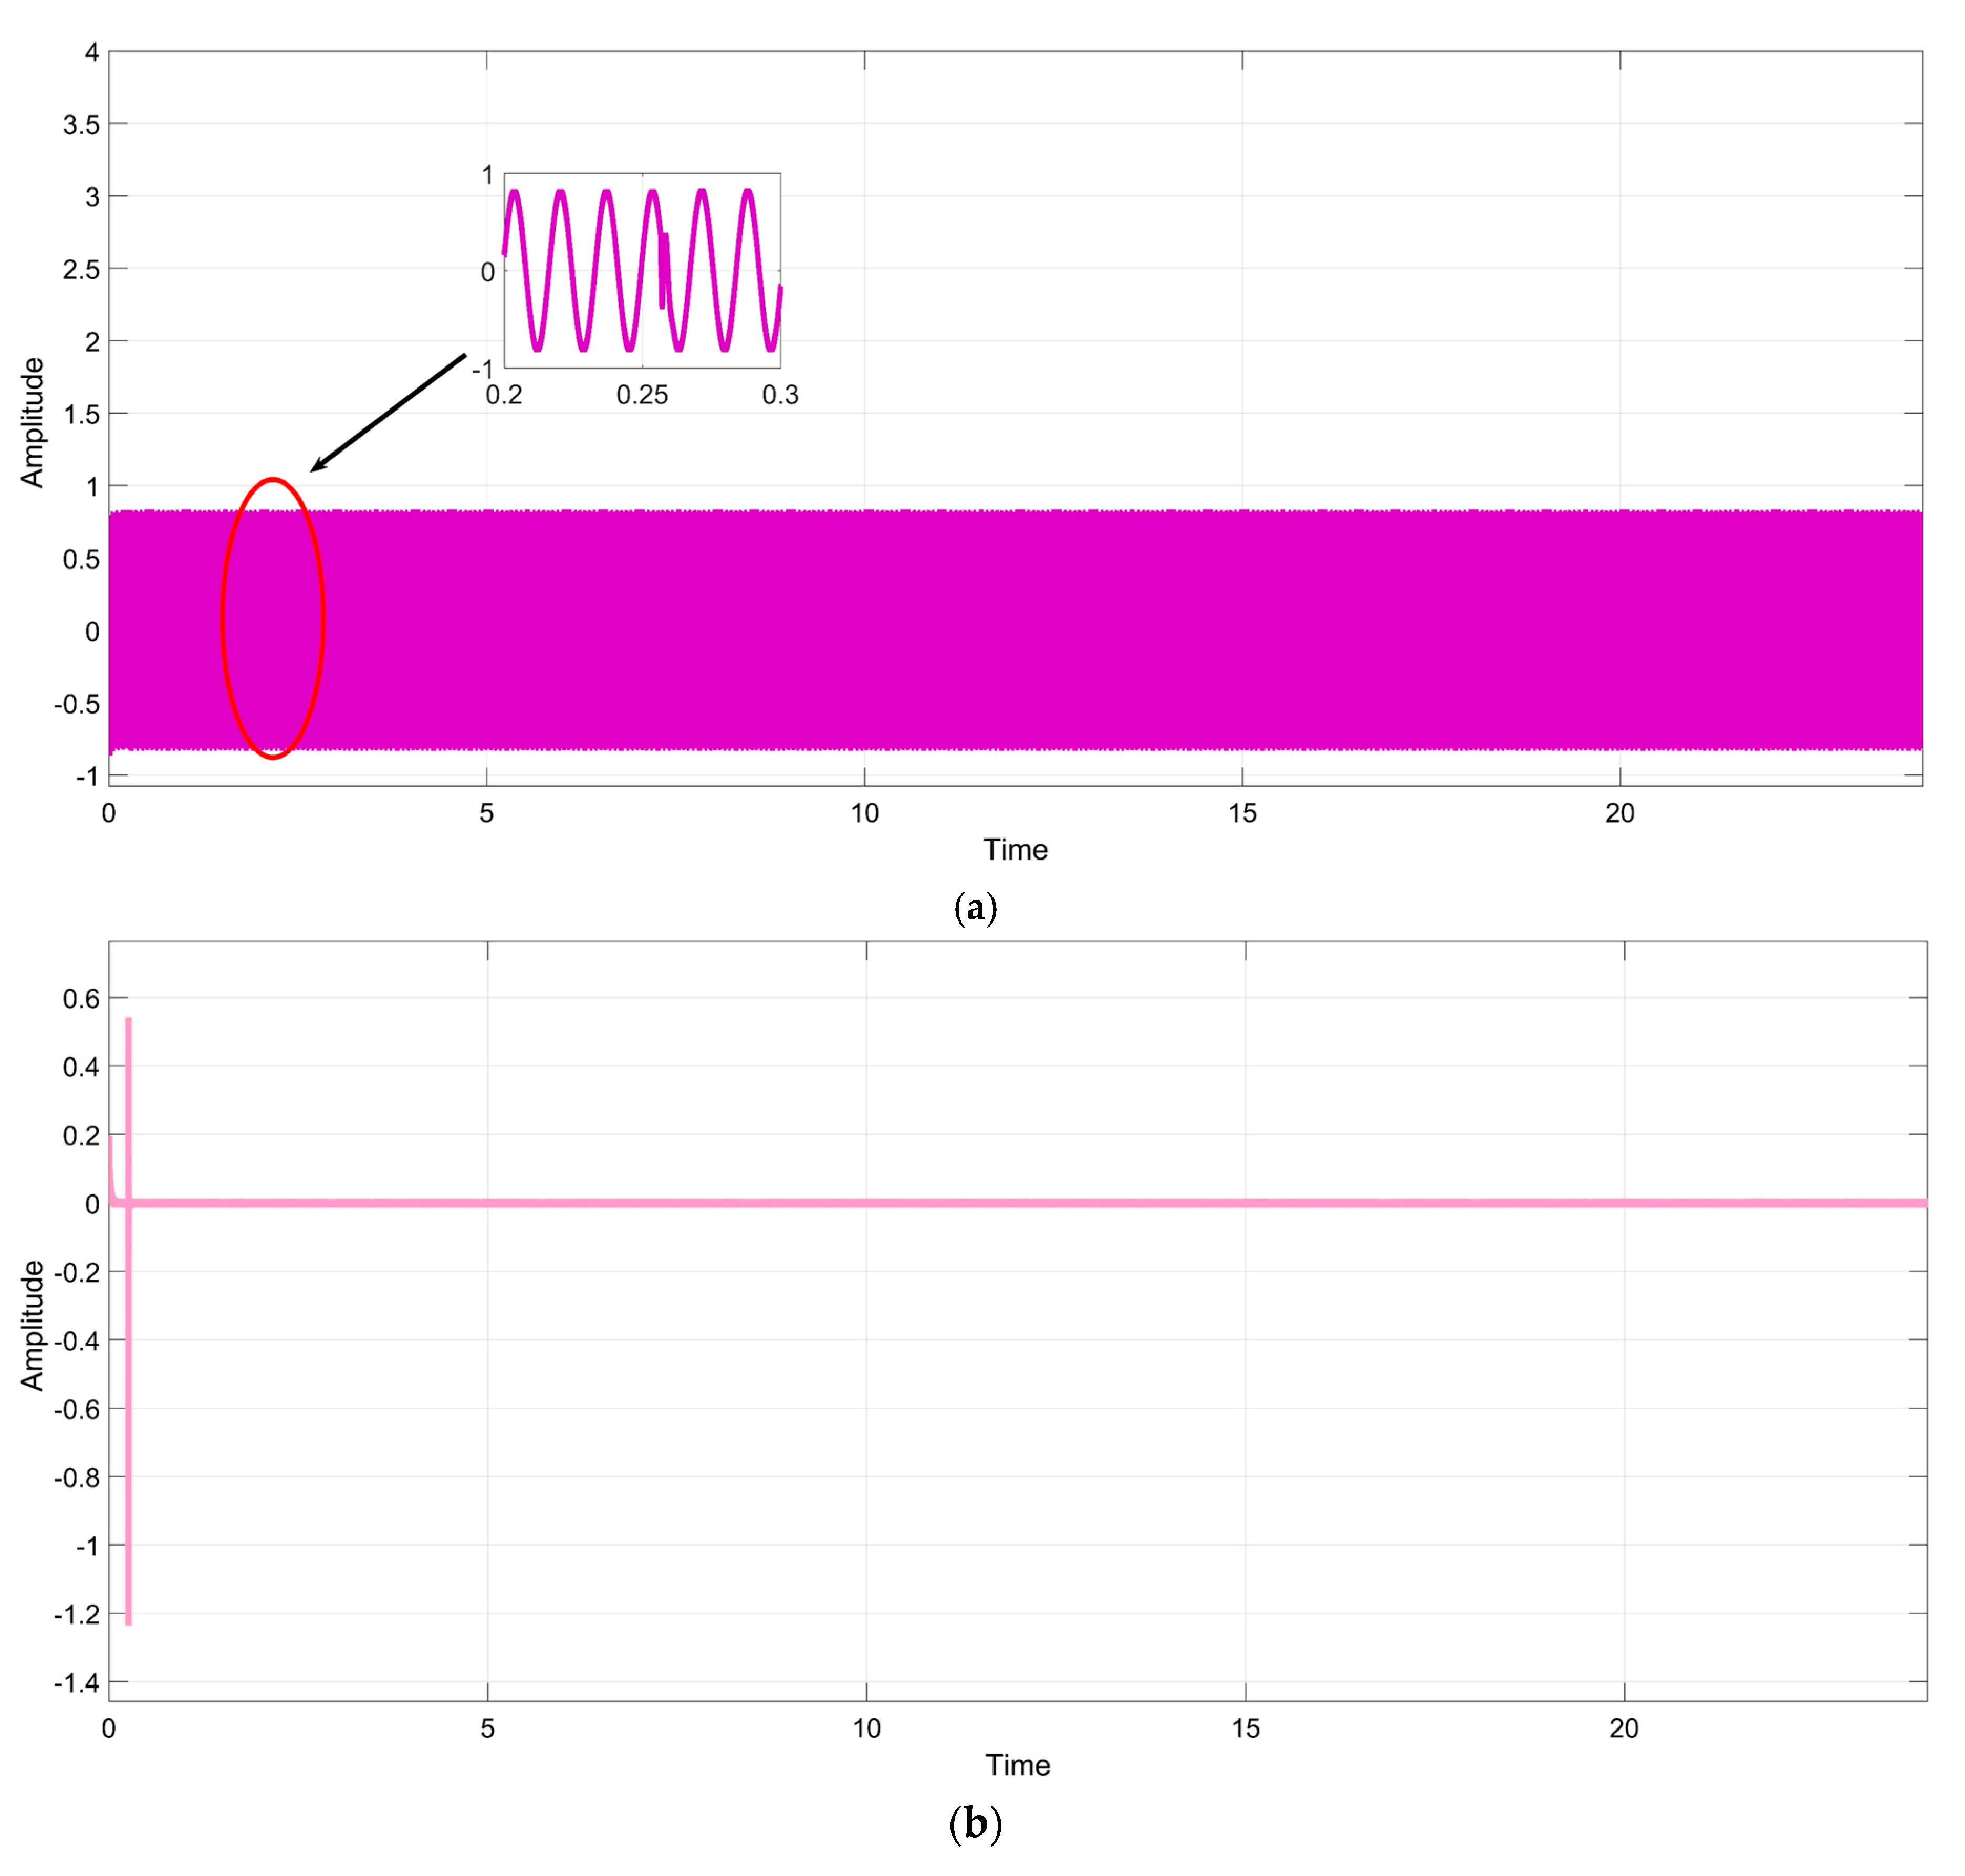
Figure 14 illustrates the PR controller’s output signal (a) and the error signal (b) that are produced during the 180-degree reference shift. The primary argument is that PR-controller has an output signal that is often less than one. As the pulse width modulation has an amplitude of one carrier, saturation is not achieved by the built PR controller in transitional and steady times.
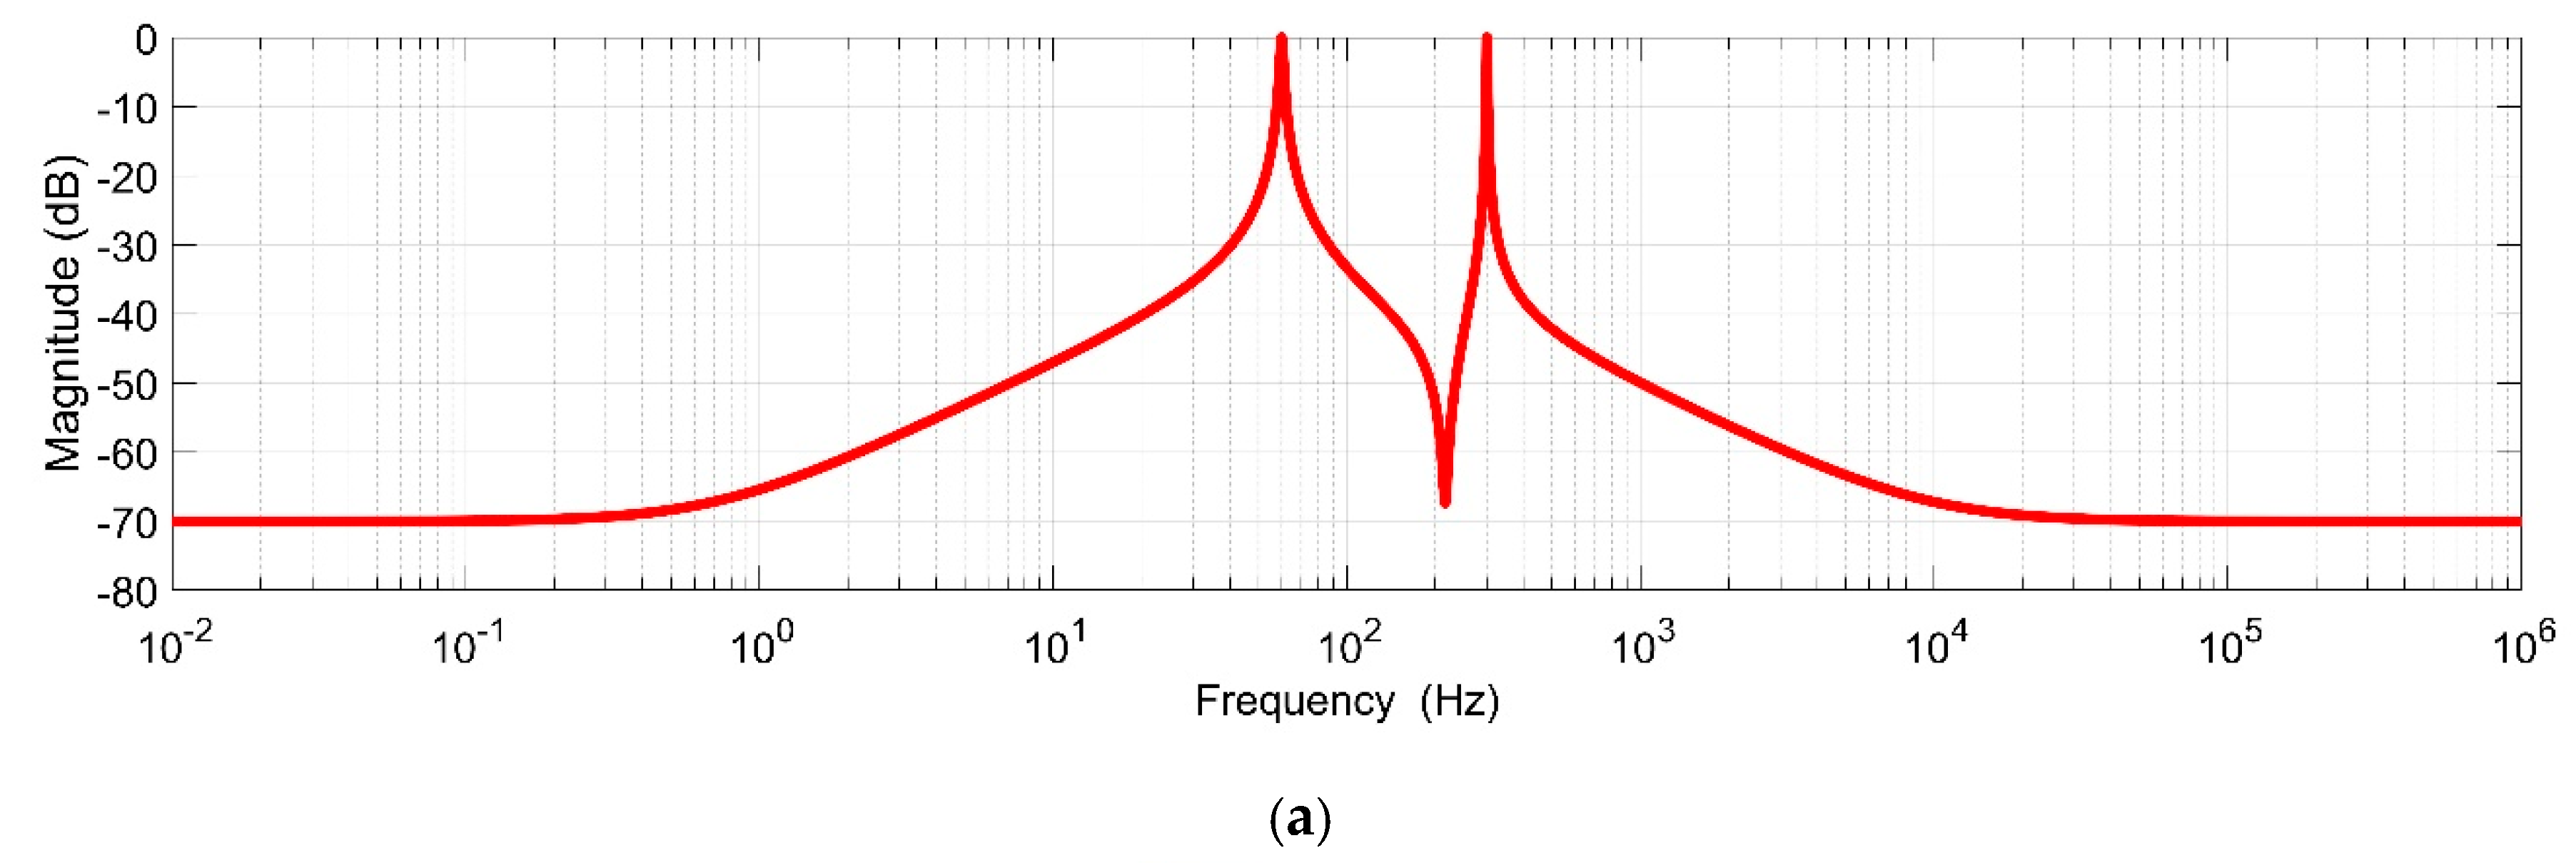
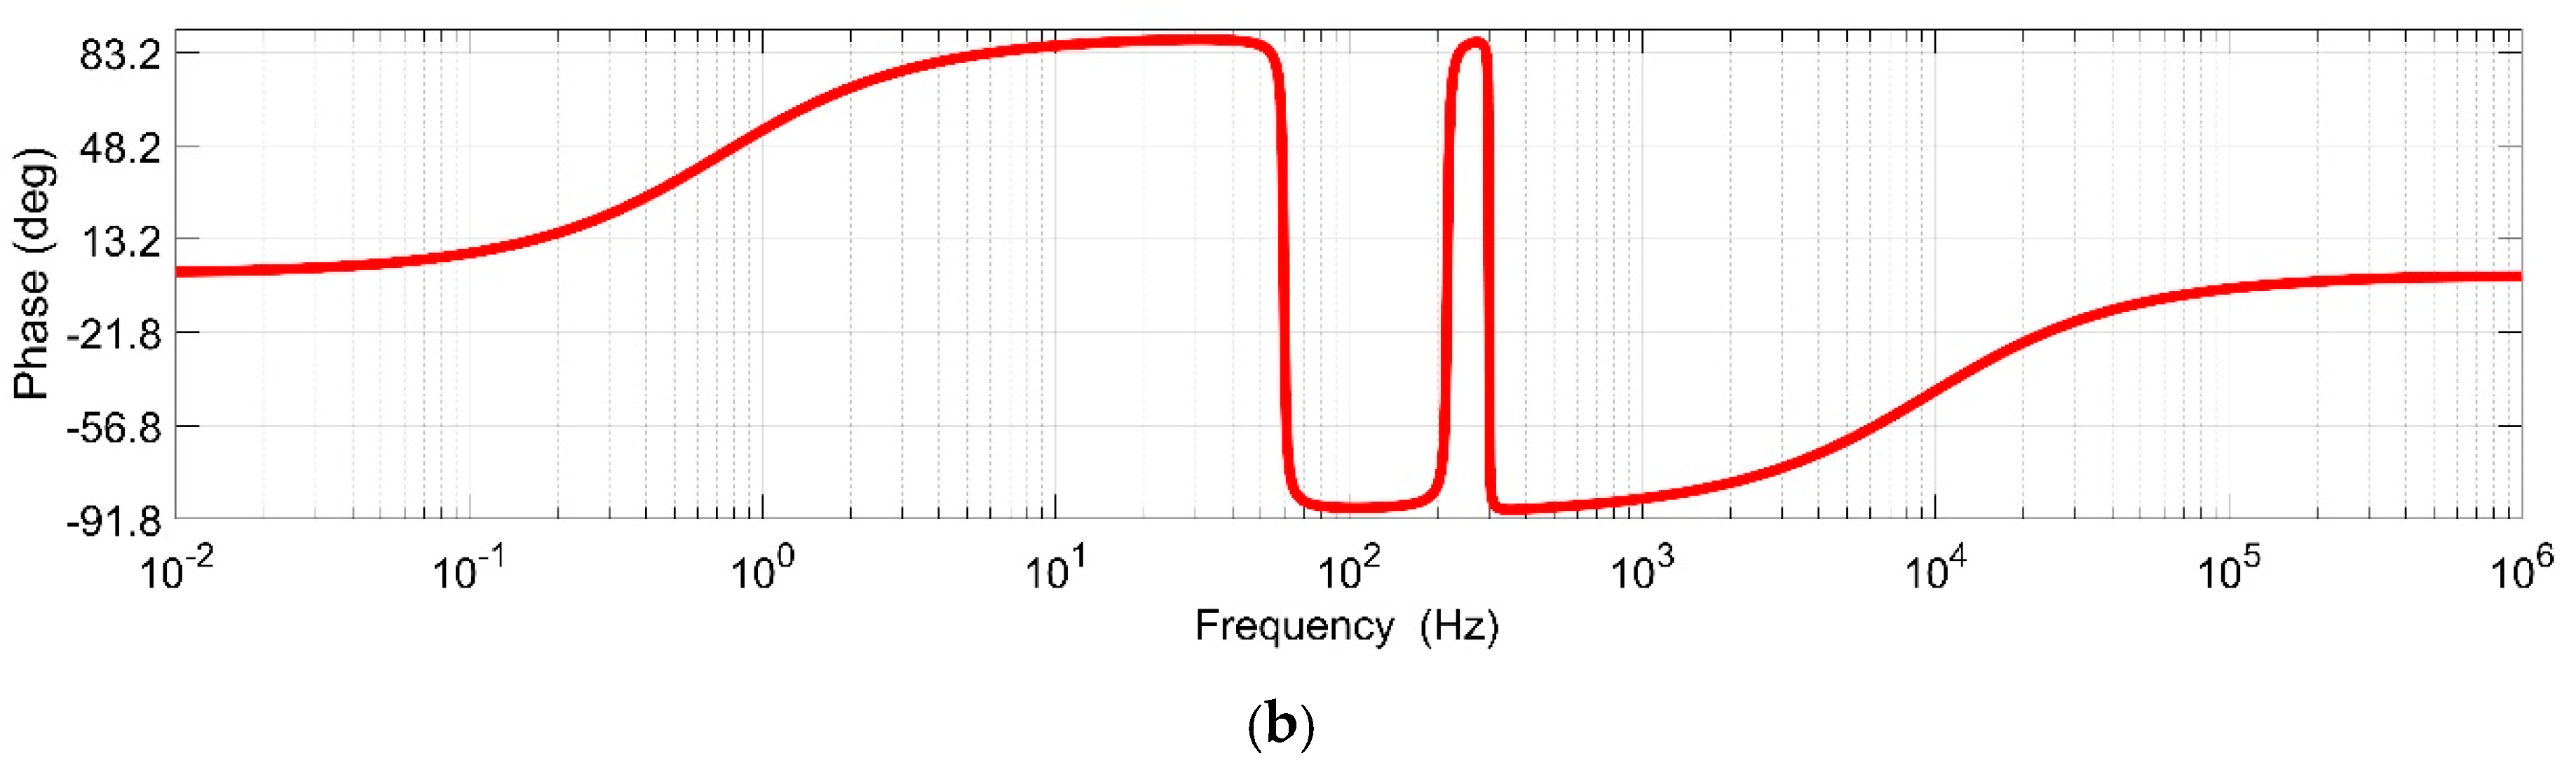
Figure 15a shows the magnitude response, and
Figure 15b shows the phase response of designed combined resonant paths.
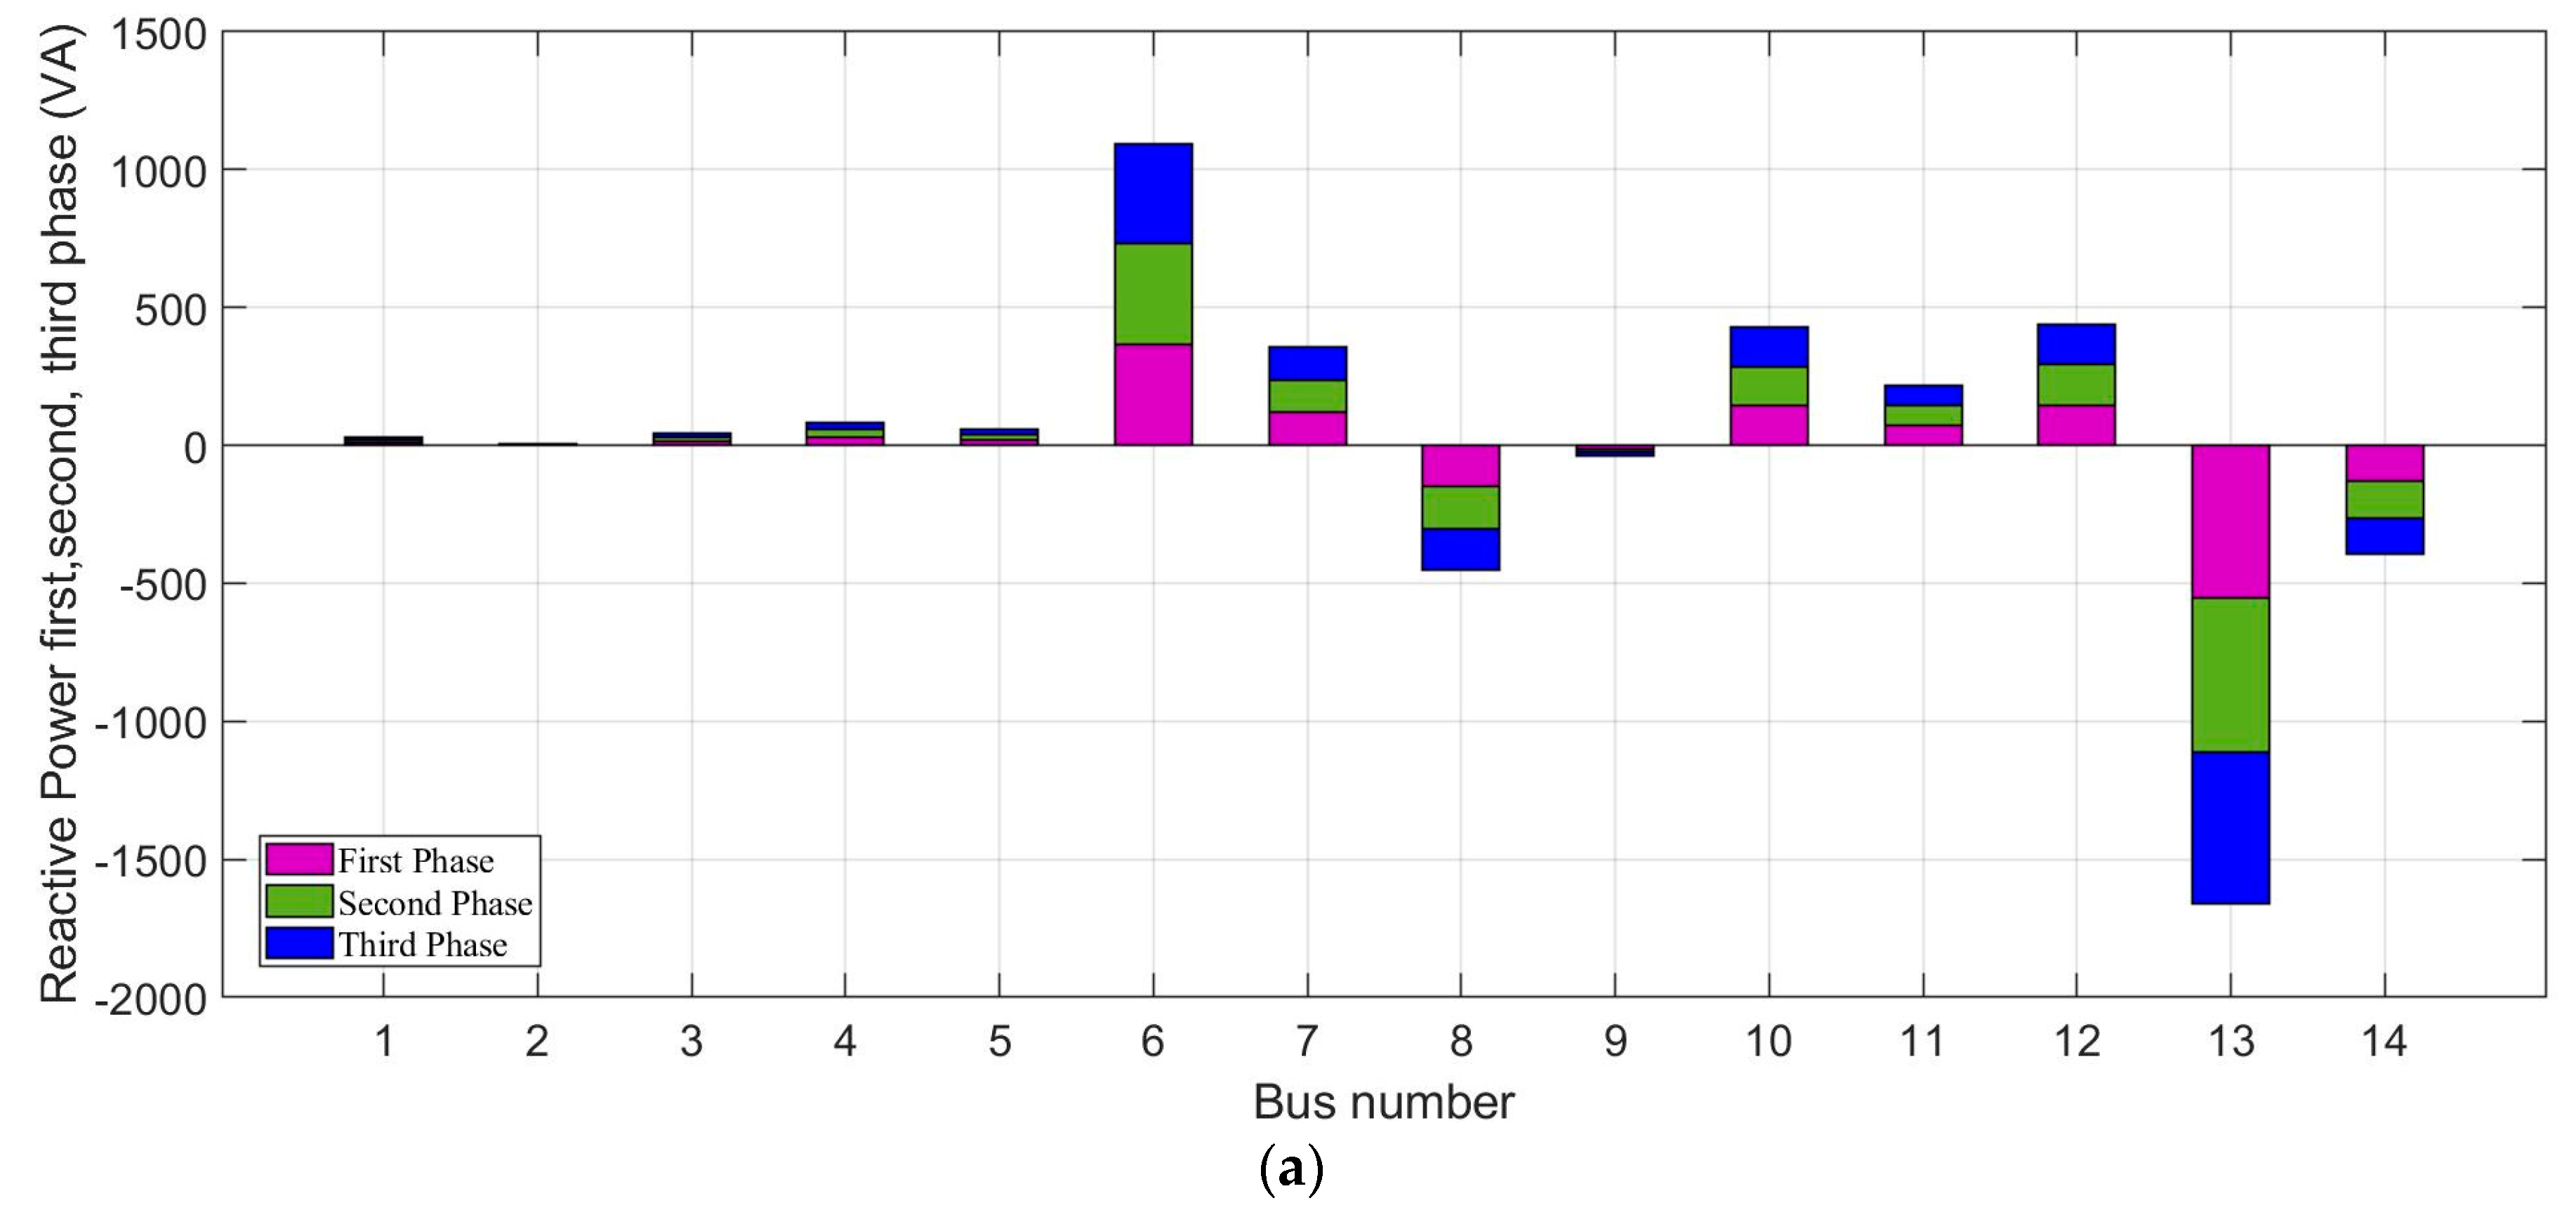
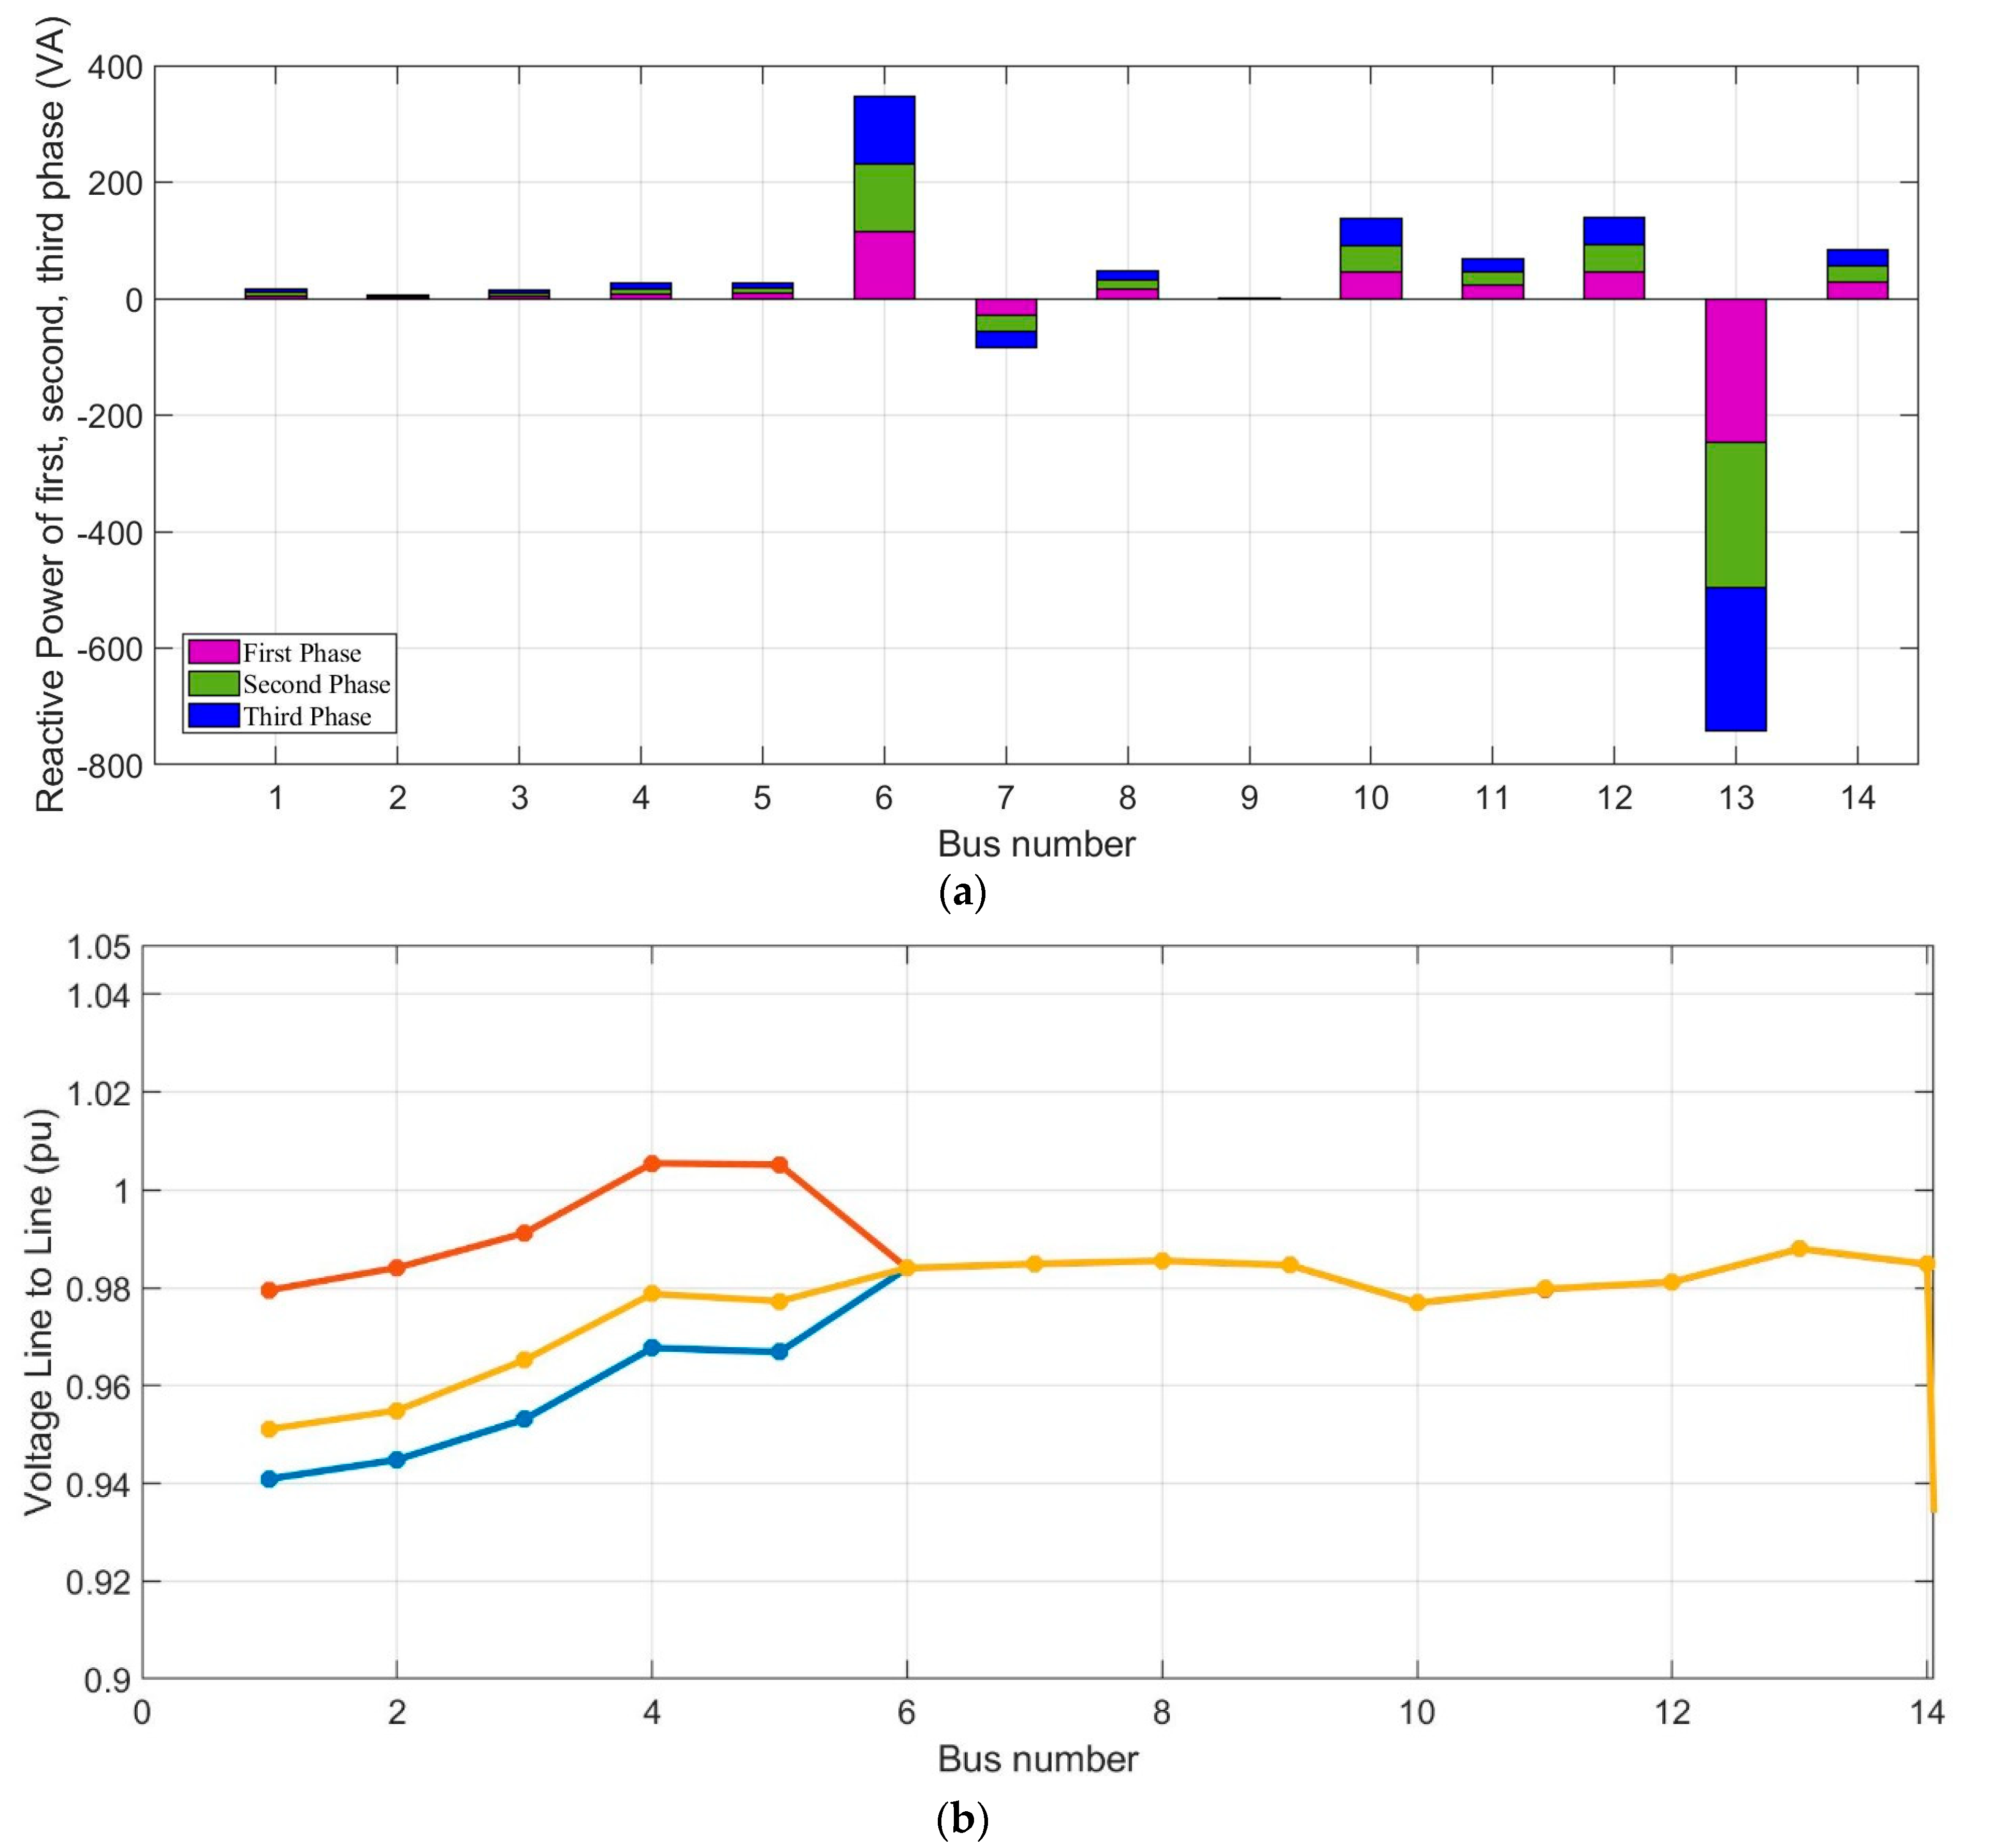
11. Analysis Reactive-Power Balance
Figure 16 and
Figure 17 highlight system characteristics at the maximum and minimum demand levels, respectively. Bus-specific voltage profiles, reactive power balances, changes in voltage phase angles, are depicted in the abovementioned figures. In both situations, it can be observed that there is an association between reactive injection and the voltage increment at the bus, where the present power generation compensates for reactive powers. The reactive powers of systems are observed using Bus8 having diesel generators, and Bus13 having external reactive power. Nevertheless, as depicted in
Figure 16, the maximum demand situation indicates the transfer of reactive power to buses 9 and 14.
Specific to this scenario, the power flow direction indicates negative power at these buses.
Table 7 and
Table 8 provide details specific to these situations. The analysis of reactive power compensation requires these crucial scenarios as the starting points to obtain voltage optimisation. Concerning maximum demand, the compensation values can be validated using an analysis of the contributions during minimum demand.
Figure 17 highlights the voltage characteristics concerning the specified case. Values are appropriate, and for certain buses, they exceed one p.u. In such cases, analyses should be performed during reactive power injection increase to optimise maximum demand situations.
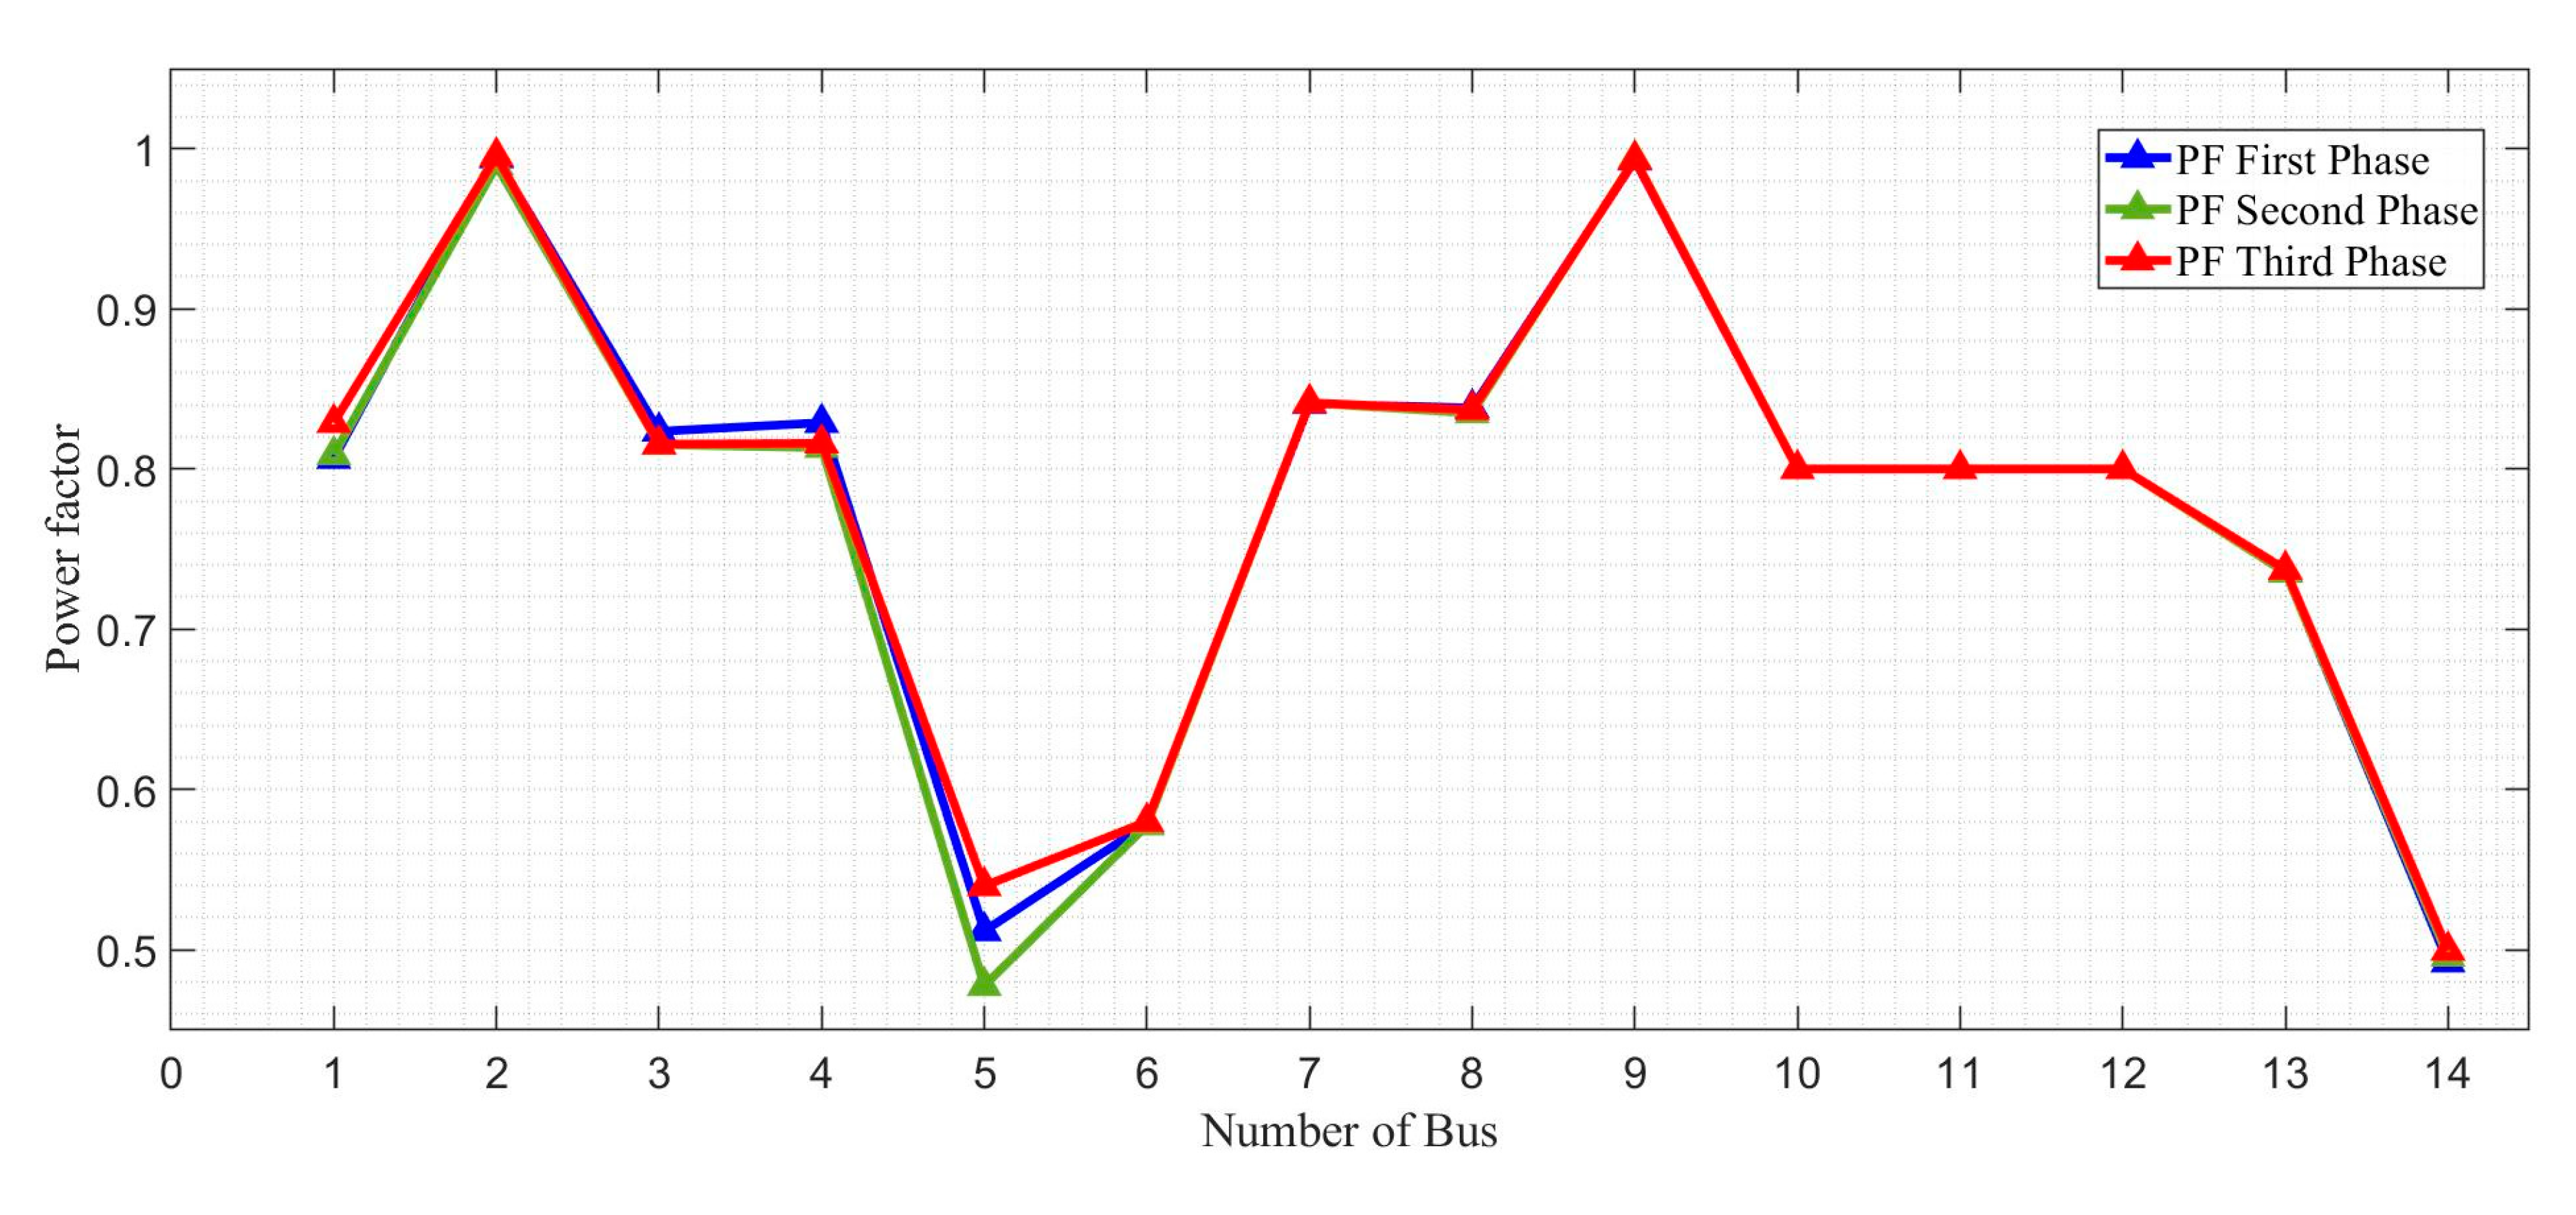
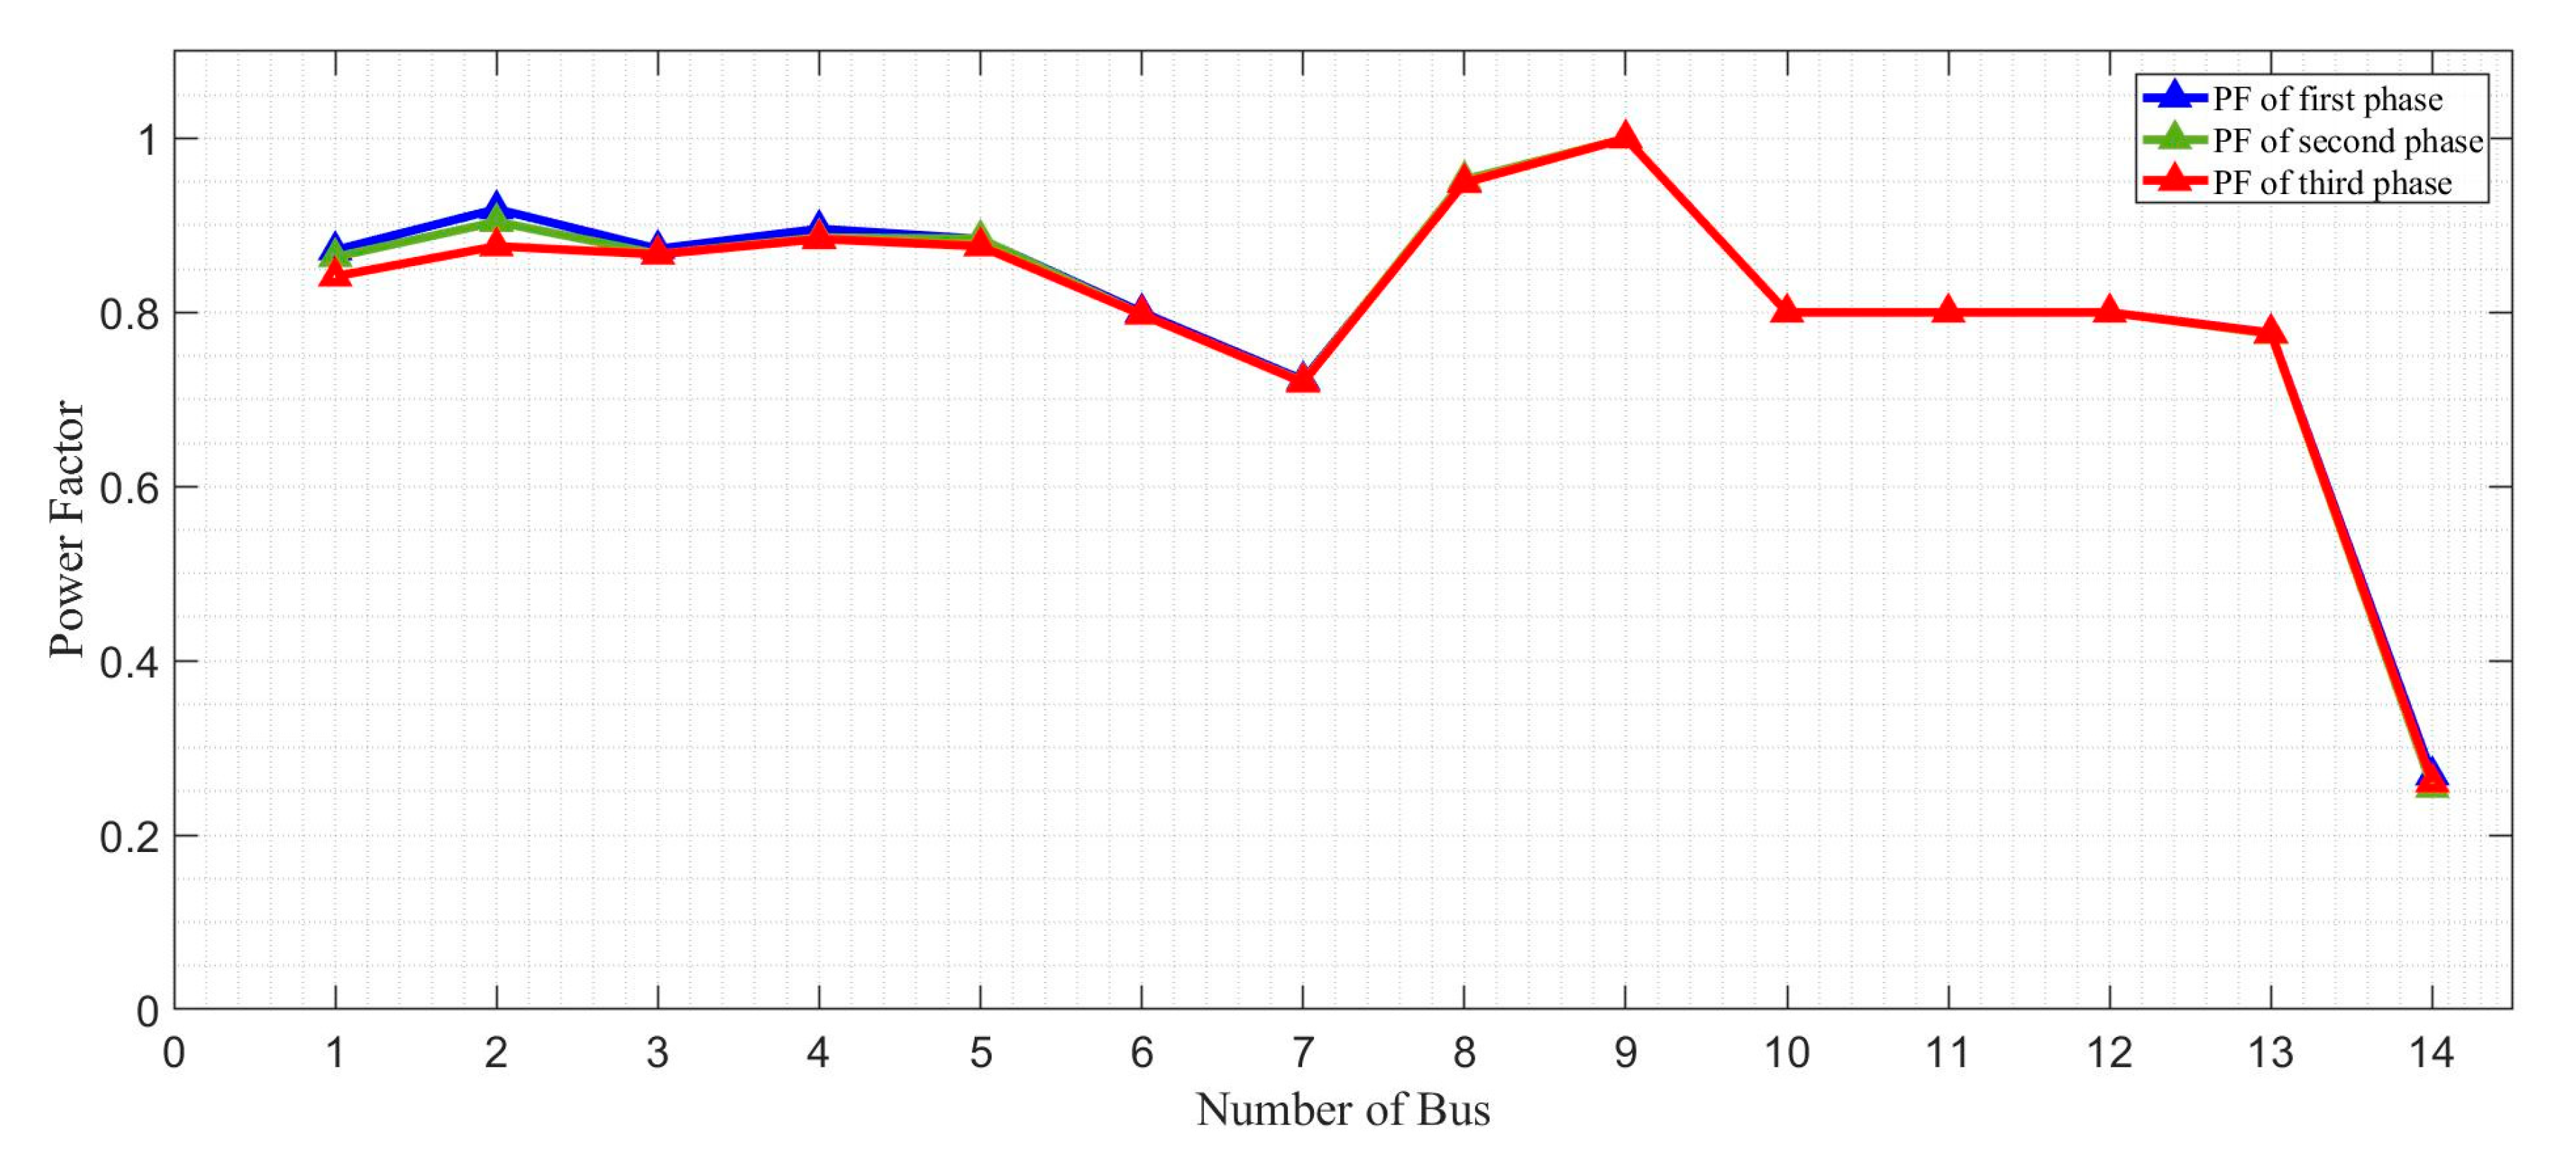
12. Buss Power Factor
The powers factors to any bus is one of the main variables to take into account when measuring the power flow of a device that needs compensation.
Figure 18 and
Figure 19 show the power-factor in minimum and maximum demand scenarios for each system bus.
Figure 19 demonstrates the scenario of high demand showing how bus 2 and bus 9 have a power factor of approximately 1. It is because bus 2 is only involved with a maximum demand obtained from the DC microgrid.
An important result is obtained by comparing the power factor for both scenarios (minimum and maximum demand). Most buses have a much better power factor than the maximum demand scenario under low demand conditions. The relationship of reactive power reduction for the maximum demand with the minimum demand scenario is the same as the reactive power reduction. The grid will continue to have the same power factor as the results of this analysis. However, the maximum demand is 0.73, while the minimum demand is 0.77.
The disparity in the power factors is shown by both situations in buses 5 and 6. The losses of active powers in photovoltaic is the result of this phenomenon. This study identifies potential contradictions in the variable power element only in terms of the compensation of the active power contribution to an electrical system. When only the active power is injected, the grid sees a deteriorating power factor requiring more criteria to compensate for the system.
14. Conclusions
This paper presents a novel cooperative controller for smart hybrid AC/DC microgrid inverters using the IEEE 14 test feeder as the basis and with major modifications. Included in the proposed hybrid microgrid are a one-line diagram and the essential data for both the 13.8-kV primary system and 0.22-kV secondary system. The design process for a digital PR current controller within a GCI is also presented in this paper. The process is made up of a systematic list for the computation of the resonant and proportional gains and the digital resonant path coefficients. After using the proposed procedure based on the PR current controller design, the paper provided an analysis of the frequency domain in the fictitious w-domain, which demonstrates that the proposed procedure satisfies the requirement of the GCI in current-controlled mode. Both a case study and a discussion illustrated the effectiveness of the design procedure, which makes it an appealing instrument for practical engineering. Two scenarios are included in the proposed system: the minimum power demand and the maximum power demand. For every scenario, the power flow results are published. All buses are equipped with their own measurement module. Calculation of the measurements related to the power quality, total harmonic distortion of voltage, and total harmonic distortion of current is performed, as well as its ability to calculate power factors and power line losses. Separate descriptions were given for the results gathered from the analysis of the two scenarios (maximum and minimum) based on the calculations by the proposed system, which allowed for a broader comprehension of the problem for every variable involved in the analysis of quality and efficiency of the power. Analysis of the existing competition for some variables was performed, particularly in the power factor. This is a result of the high penetration of photovoltaic generation, which intensifies the power factor experienced by the commercial entities offering the electric service in the mode linked to the grid.


