Article

Study on Damage of 4H-SiC Single Crystal through Indentation and Scratch Testing in Micro–Nano Scales

School of Mechanical and Precision Instrument Engineering, Xi’an University of Technology, Xi’an 710048, China
*
Authors to whom correspondence should be addressed.
Appl. Sci. 2020, 10(17), 5944; https://doi.org/10.3390/app10175944
Submission received: 14 July 2020 / Revised: 13 August 2020 / Accepted: 25 August 2020 / Published: 27 August 2020
(This article belongs to the Section Mechanical Engineering)

Abstract

:
In this paper, a series of indentation tests in which the maximum normal force ranged from 0.4 to 3.3 N were carried out to determine the fracture toughness of 4H-SiC single crystals. The results indicated that an appropriate ratio of the distance from the indentation center to the radial crack tip to the distance from the indentation center to the indentation corner is significant to calculate fracture toughness of 4H-SiC single crystals. The critical condition with no cracks on the edge of the indentation was obtained through a fitting method. The surface morphologies of the groove were analyzed by scanning electron microscopy (SEM). Plastic deformation was observed and characterized by the smooth groove without cracks and ductile chips on the edge of the groove in the initial stages of scratch. With increased normal force, median cracks, radial cracks, and microcracks appeared in turn, followed by the crack system no longer being able to stably extend, causing the brittle fracture to dominate the material removal. The size of the edge damages were measured through SEM and the experimental data highly agreed with the predicted curve. A modified calculation model considering elastic recovery of the sample by the indenter during the scratching process was suggested. These results prove that elastic recovery of 4H-SiC single crystals cannot be ignored during ultra-precision machining.

1. Introduction

Silicon carbide (SiC) is one of the world’s most popular materials due to its excellent physical, chemical, electronic, and mechanical performances, and is widely applied in industries including automobiles, spacecraft, high-speed trains, aviation, electrical systems, and optics [1,2,3,4,5,6,7,8]. The applications and corresponding properties of SiC are summarized in Table 1. Machining precision of these parts by SiC is often required to achieve a micrometer or nanometer level, but the hard and brittle properties of SiC make it difficult to manufacture them because microcracks and microdamages easily occur during processes such as grinding and wiresaw machining. SiC materials, especially SiC single crystals grown by physical vapor transport (PVT) or chemical vapor deposition (CVD), are also expensive; so the occurrence of cracks and damages causes not only performance degradation of these parts, but also increases cost.
Scratch and indentation technologies are common ways to study brittle material removal. Ge et al. [9] studied the material removal mechanism and crack propagation in single scratch and double scratch tests of single-crystal silicon carbide using abrasives on wiresaw machining. Zhang et al. [10] conducted scratching experiments to investigate the influence of heat on material removal and friction behaviors of reaction bonded SiC ceramics under different temperatures. Jian et al. [11] carried out a combination of micro- and nanoindentation techniques to investigate the indentation-induced pop-in effect and fracture behaviors in yttrium-stabilized zirconia(111) single crystals. Gao et al. [12] established an analytical model of an elastic stress field for brittle material during single abrasive scratching based on elasticity and indentation fracture mechanics.
A machining method known to be able to avoid fractures on SiC surfaces is ductile-regime machining, but the critical cutting depth of ductile-regime machining for SiC is about 100 nm, which is much larger than the machining accuracy of conventional machining methods used extensively in actual production [27]. In these machining methods, brittle removal is still the main approach. Above all, it is necessary to study the damage and fractures during SiC processing. In this paper, indentation tests were carried out to determine the fracture toughness of 4H-SiC single crystals. Critical condition with no cracks on the edge of the indentation was obtained through a fitting method. The material removal mechanism of 4H-SiC single crystals is discussed herein through ramp-normal force scratch tests. A modified calculation model considering elastic recovery of normal force during the scratching process is proposed, providing important technical parameters for the machining of 4H-SiC single crystals.

2. Development of Analytical Model

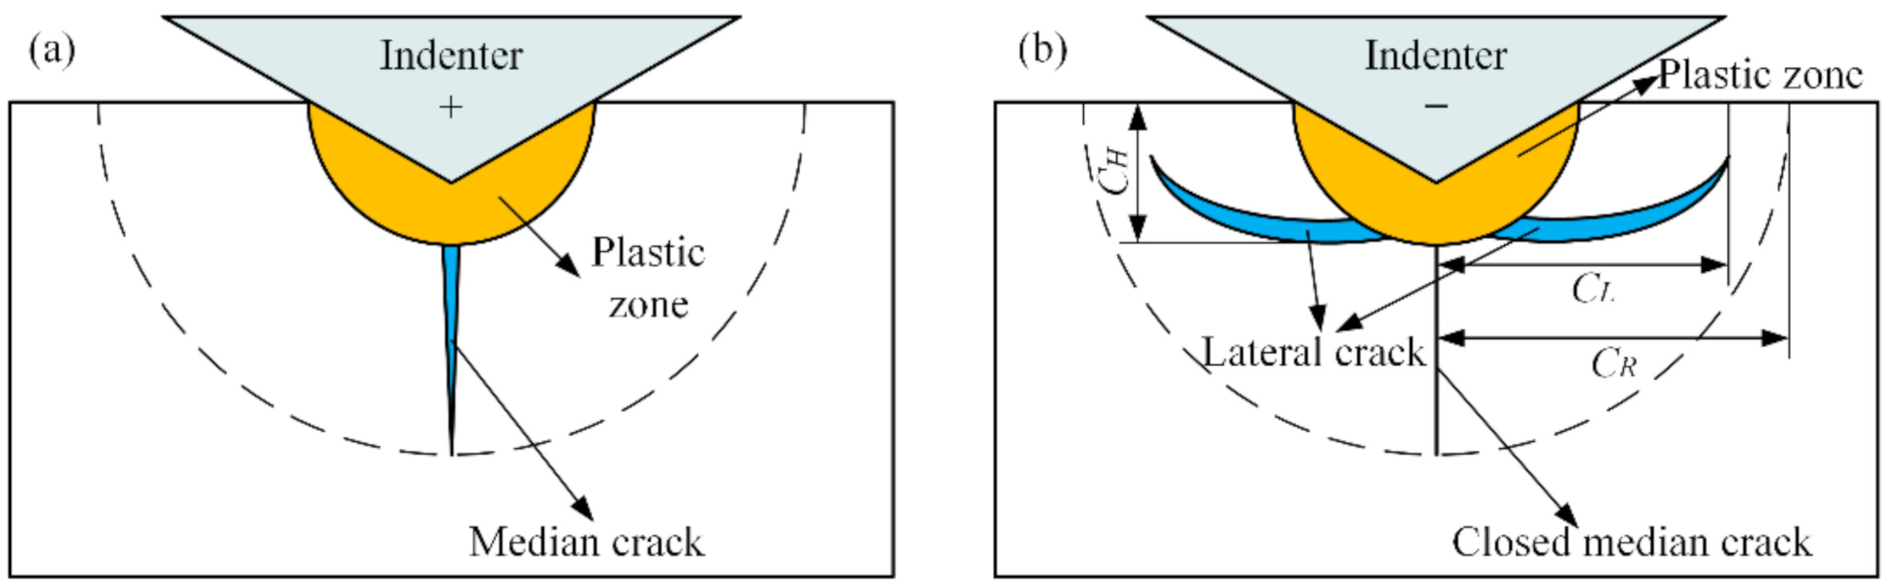
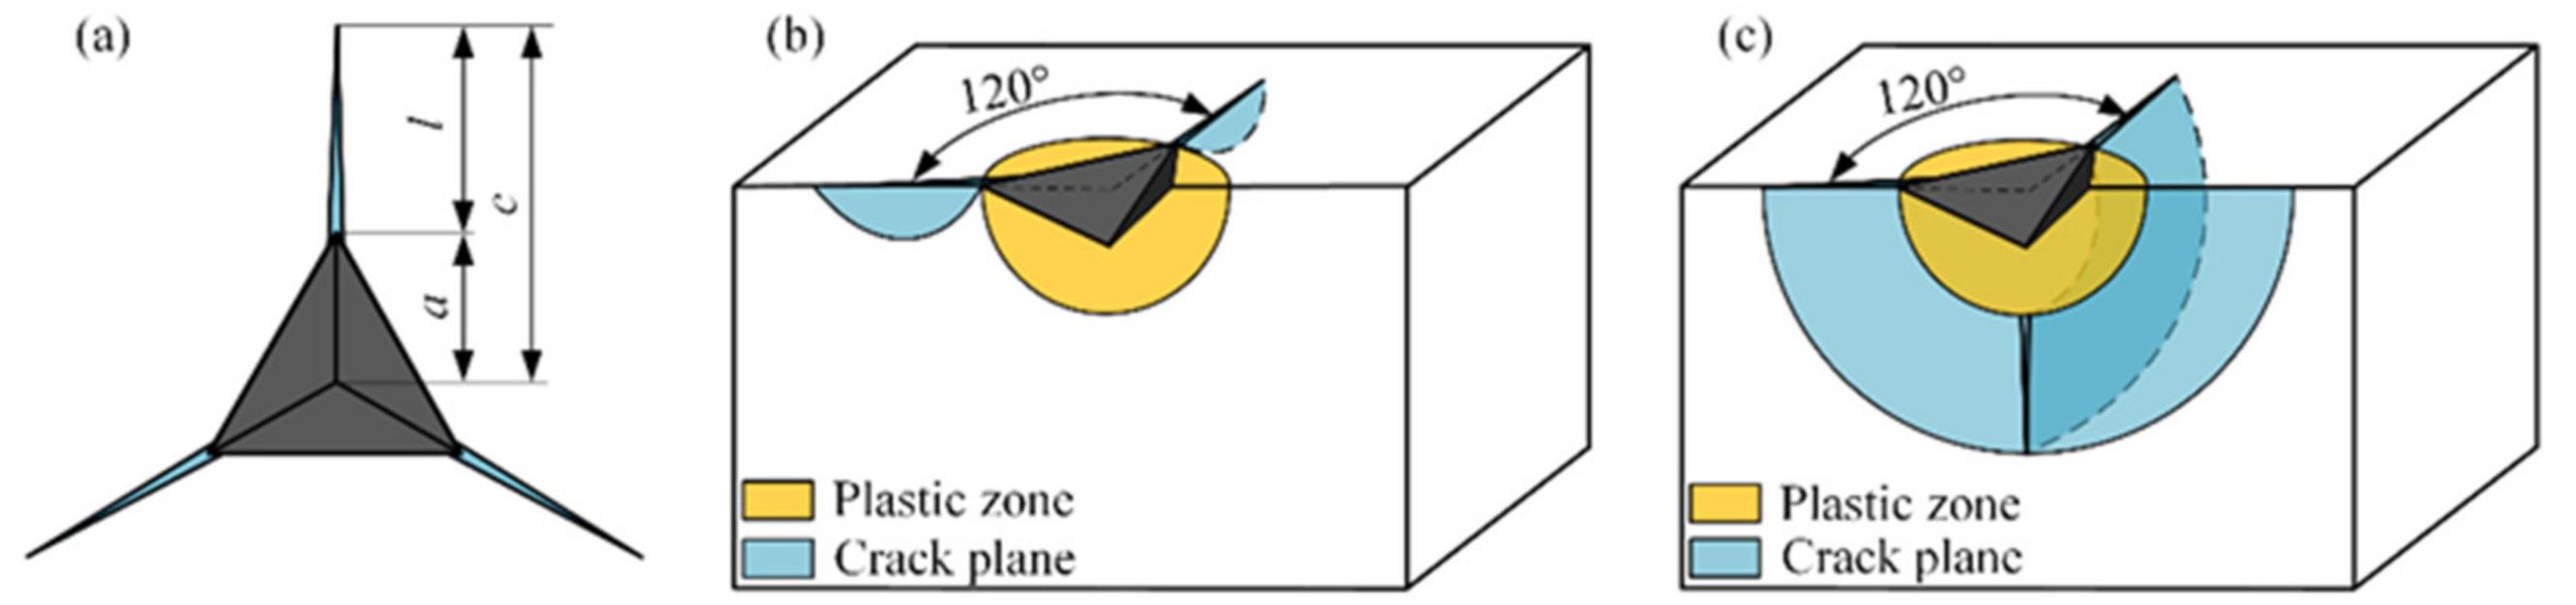
2.1. Indentation Crack System of Brittle Materials

The plastic deformation of brittle materials is well known. When the load applied to an indenter is small enough, the elasticity and plasticity behaviors of 4H-SiC single crystals can be verified via the nanoindentation test [28]. As the load is further increased, a median crack appears from the bottom of plastic zone, as shown in Figure 1. This median crack is closed during the process of unloading, initiating a lateral crack which propagates to the sample surface with progressive unloading [29]. The lateral crack length, CL, and the lateral crack depth, CH, are calculated using the following equations [30]:
C L = C 2 1 tan β 5 / 12 E 3 / 4 H K I C ( 1 ν 2 ) 1 / 2 1 / 2 F N 5 / 8
C H = C 2 1 tan β 1 / 3 E 1 / 2 H F N 1 / 2
where C2 is a dimensionless constant, E is the elastic modulus, H is the hardness, KIC is the fracture toughness, ν is the Poisson’s ratio, FN is the normal force applied to the indenter, and β is the half apical angle of the indenter.
Another crack system, the radial crack, can be caused in brittle material surfaces by sharp-edged indenters, such as Berkovich and Vickers indenters. The radial crack length is calculated using the following equation [31]:
C R = 0.12 E H 1 / 3 ( cot β ) 4 / 9 F N K I C 2 / 3

2.2. Scratch of Brittle Materials

Based on recent works [32,33], Figure 2 shows the schematic diagrams of scratching for brittle materials. According to the applied load from small to big, the whole scratch track can be divided into five stages, i.e., (a) the elastic stage, (b) the plastic stage, (c) the subsurface cracking stage, (d) the surface and subsurface cracking stage, and (e) the microabrasive stage. At the beginning of the loading process, the deformation behavior of brittle material is similar to plastic material, which includes elastic deformation and plastic deformation. With further load increase, the stress concentration causes a median crack in the bottom of the contact area. Furthermore, as the indenter continues forward, the residual stress of the area in the rear of the indenter causes other crack systems. As the crack grows, the surface of the sample deteriorates, and the formation of chips and debris can be observed at the end of scratching.
The edge damage size of the groove during the scratching process, s, is approximately equal to the median crack depth. It can be expressed as [34]
s = α k 1 + X e M X r M e ( cot β ) 2 / 3 E H 1 / 2 F N K I C 2 / 3
where αk is a correction coefficient (αk = 0.1336), e is a lateral load factor (e = 1.1), and X e M and X r M are indentation coefficients of elastic stress field and plastic stress field ( X e M = 0.032, X r M = 0.026), respectively.

2.3. Fracture Toughness Determination

In general, researchers divide fractures into three basic modes, i.e., the opening mode (I), the sliding mode (II), and the tearing mode (III) [35]. The fracture toughness, KIC, refers to the critical stress intensity factor of mode I, which can be described as the resistance of a material against crack propagation [36,37,38]. The measurement methods of the fracture toughness of brittle materials at the microscale to the nanoscale mainly include the indentation method (IM) [38,39], micropillar splitting [40,41], and microcantilever testing [42,43]. Numerous studies regarding the indentation method were carried out over the past half-century, starting with Palmqvist initially putting forward the potential values of indentation-induced cracking to characterize the toughness of brittle materials [44] because of its advantages such as simple operation, prepared sample facilities, and no sample shape or size requirements. However, so far, no single model exists that accurately describes the fracture toughness of most materials due to mechanical analysis complexity.
In an indentation test for Berkovich indenter of brittle material, the crack length of the indentation corner can be measured using a microscope to calculate the fracture toughness. There are two main crack systems illustrated in Figure 3. A method to compare the ratio of the length from the indentation center to the radial crack tip, c, to the distance from indentation center to the indentation corner, a, is used to identify the crack system. The Palmqvist crack system shown in Figure 3b tends to appear during tests when the ratio, c/a, is less than 2.5, in comparison with the other study results, which appear between 2 and 3 [45]. If the ratio, c/a, is more than 2.5, the crack can supposed to be resulting from the half-penny crack system, as shown in Figure 3c. The half-penny crack is considered to be the result of a Palmqvist crack propagating downward at a higher load in some brittle materials. A well-known equation developed by Lawn et al. which can be used to determine the fracture toughness of a half-penny crack is given in [46]
K I C = α E H 1 / 2 P c 3 / 2
where α is a constant related to indenter shape (for a Berkovich indenter, α = 0.036 [47]), E is the elasticity modulus, H is the hardness, and P is the maximum indentation load.
The fracture toughness calculation formula of a Palmqvist crack for a Berkovich indenter is given by Laugier [48,49]:
K I C = 1.073 x v a l 1 / 2 E H 2 / 3 P c 3 / 2
where xv is a constant (for Berkovich xv = 0.015) and l is the length of the crack.

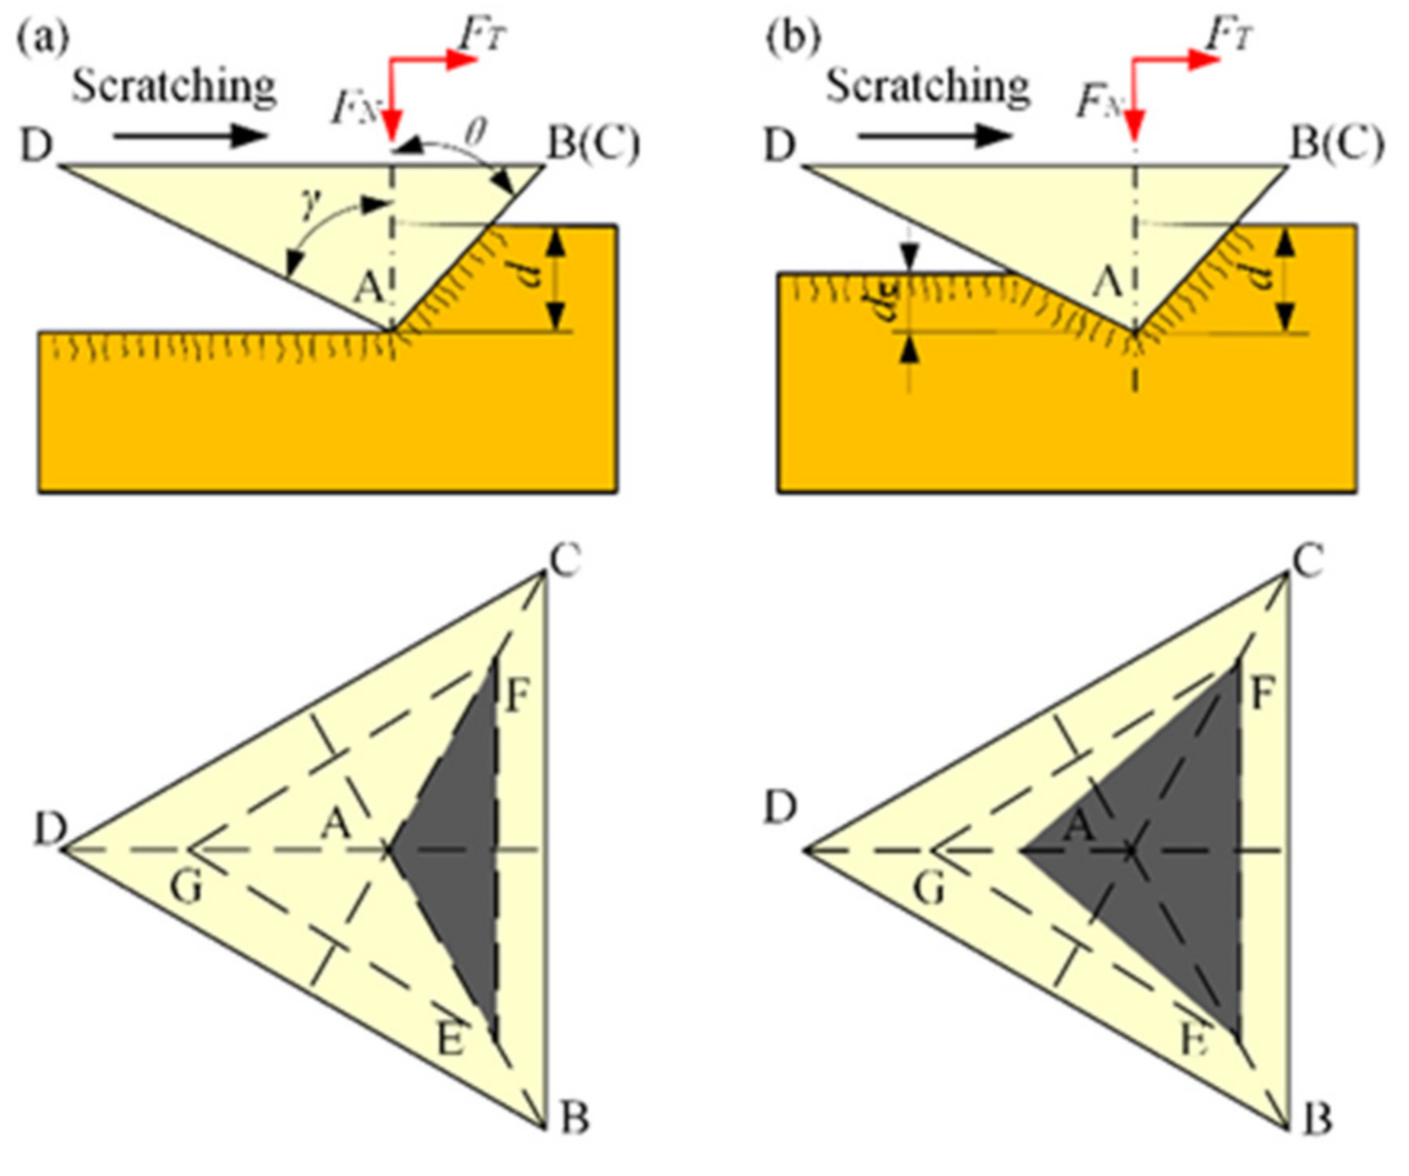
2.4. Normal Force of Scratching

For the available analysis of a scratching force, some major assumptions and simplifications are made in this study: (1) As a rigid body, the indenter does not deform during the process of scratching, and (2) the Berkovich indenter is a combination of a sphere and a triangular pyramid. The researchers often use the scratch hardness formula,
H = F N A
to calculate the normal force in the scratching process. The traditional method, without considering the elastic recovery in the scratching process, is shown in Figure 4a. The projected area, At, can be expressed as
A t = 3 tan θ ( d + d * ) 2
where θ is the angle between the edge plane and the centerline, d is the scratching depth, and d* is the distance from the nose vertex to the top of the ideal indenter; d* = R(1/sinβ − 1), where R is the indenter nose radius and γ is the angle between the edge line and the centerline [27].
The traditional normal force, FNt, can be obtained by combining Equations (7) and (8).
F N t = 3 H tan γ ( d + R sin β R ) 2
A modified method considering the elastic recovery in the scratching process is shown in Figure 4b. The projected area Aa can be expressed as
A a = 3 [ ( d e + d * ) tan γ + ( d + d * ) tan θ ] ( d + d * ) tan θ
where de is the part elastic recovery depth. There is a linear relationship between d and de. According to Chen’s study, the linear coefficient, ψ, is within the range of 35%–40% [50].
The modified normal force, FNt, can be obtained by combining Equations (7) and (10).
F N a = 3 H [ ( ψ d + R sin β R ) tan β + ( d + R sin β R ) tan θ ] ( d + R sin β R ) tan θ

3. Experimental Procedure

3.1. Materials and Instruments

A commercially available 4H-SiC single crystal wafer with a size of 10 × 10 × 0.5 mm3 was adopted in this study. All experiments were performed on the (0001) face of the wafer and the roughness of the experimental surface was less than 1 nm after chemical–mechanical polishing (CMP) treatment. A diamond Berkovich indenter with a nose radius of 4.95 µm was used in this study, and a standard fused quartz sample was employed to calibrate the area function.
Indentation and scratch experiments were performed on a nanomechanical test instrument (TI 950 Triboindenter, Hysitron, Minneapolis, MN, USA), as shown in Figure 5, with a load sensitivity of less than 30 nN and a displacement sensitivity of less than 0.2 nm. A focused ion beam milling combined with scanning electron microscopy (FIB-SEM) system (Helios NanoLab 600i, FEI, Hillsboro, OR, USA) was used to observe the surface topography of the sample and measure the crack length after the indentation and scratch tests.

3.2. Indentation Test Procedure

The indentation process included three stages, i.e., the loading stage, the holding stage, and the unloading stage. For each test, the loading and unloading times were 10 s and the holding time was 5 s. The indentation load changed at a constant rate during the loading and unloading stages. A series of indentations were conducted at a variety of maximum loads in the range of 0.1 to 3.4 N at room temperature. To ensure the reliability of the experimental data, each load was repeated 5 times. The thermal drift was kept below ± 0.1 nm/s for all indentations.

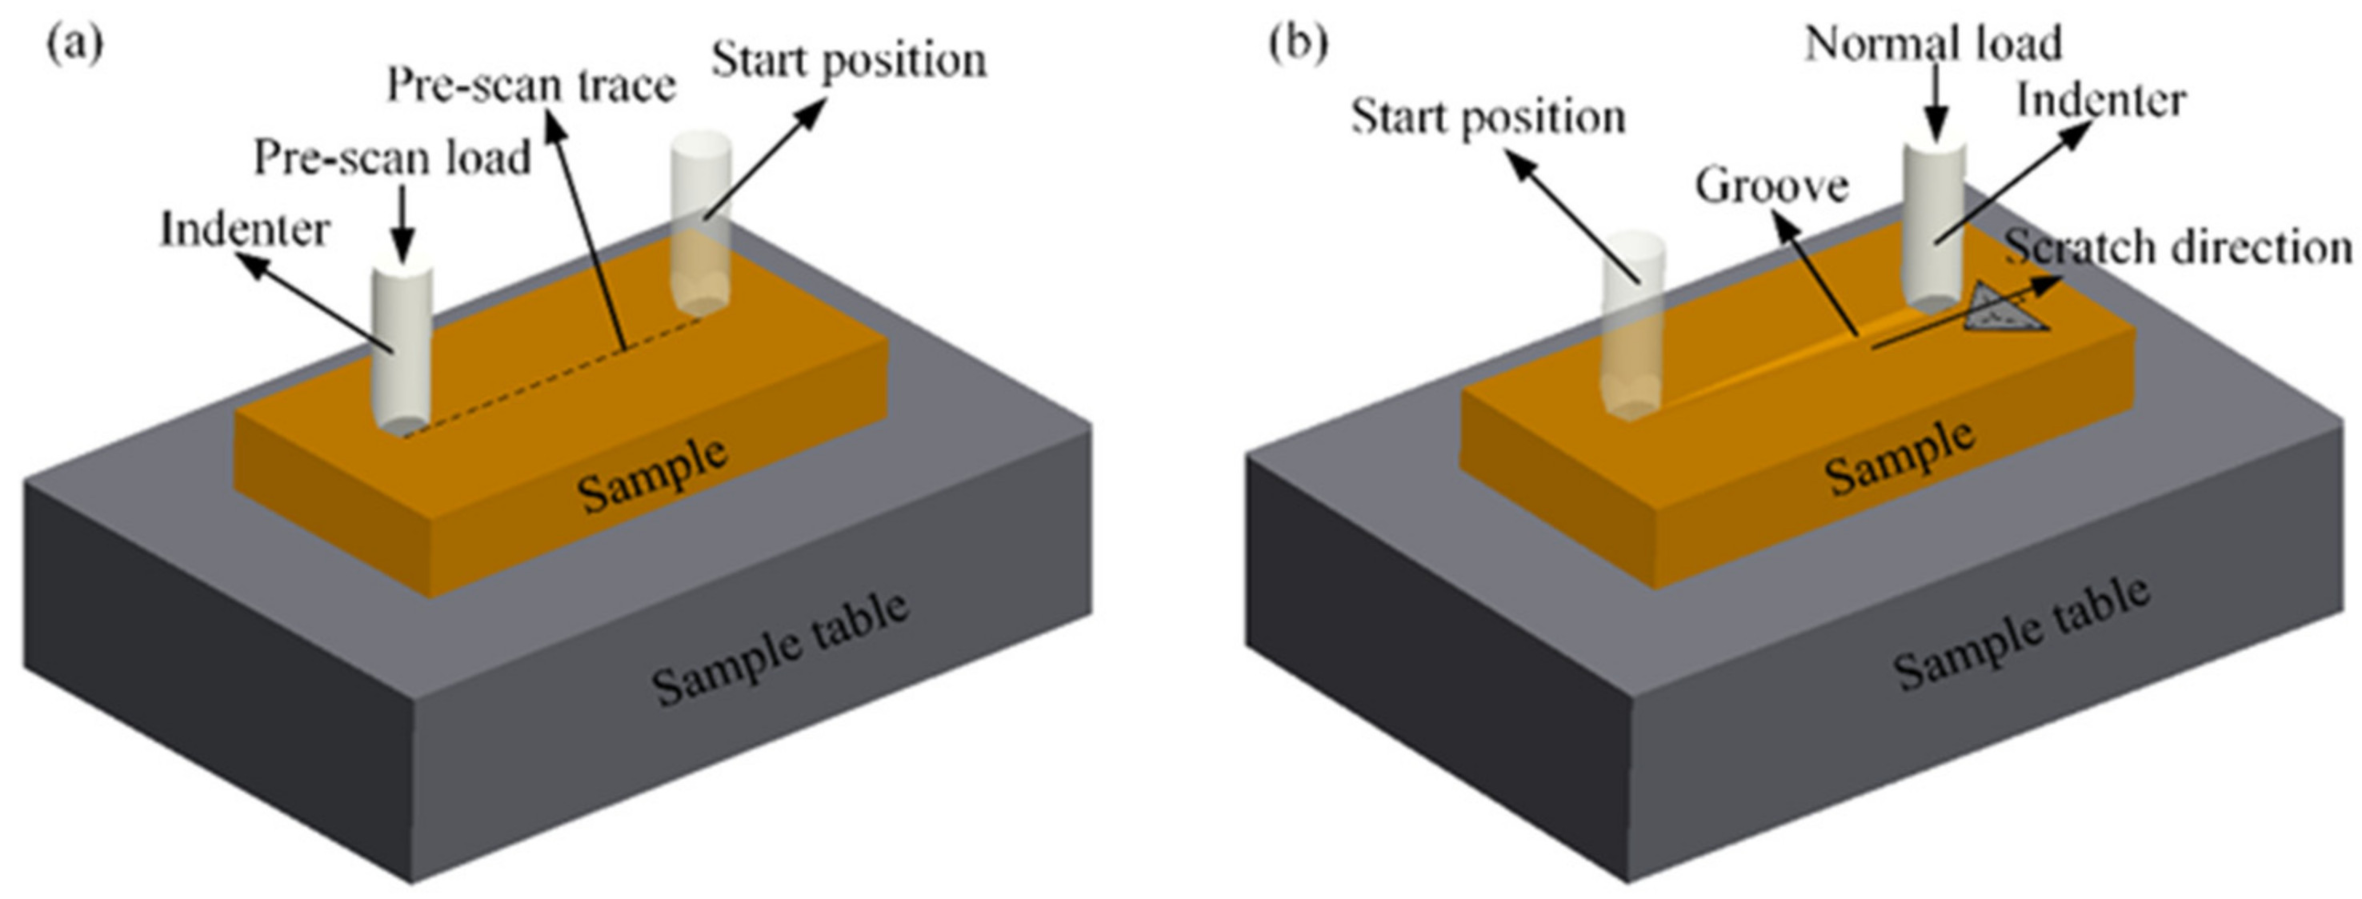
3.3. Scratch Test Procedure

The scratch process included two stages, i.e., the prescan stage and the scratching stage, as shown in Figure 6. In the prescan stage, the Berkovich indenter was scanned with a constant load of 0.1 mN. In the scratching stage, the normal load of the indenter increased linearly from 0 to 500 mN while the sample table moved at a constant velocity of 10 μm/s; the scratching length was 1000 µm. The scratch test parameters are shown in Table 2. The experiment was repeated 3 times under the same conditions to increase the reliance of the experimental data. The scratching direction was perpendicular to the edge of the normal projected equilateral triangle of the Berkovich indenter, as shown in Figure 6b.

4. Results

4.1. Indentation Results

Figure 7 shows the results of the indentation curves and corresponding SEM images for the 15 indentations. The radial cracks appeared at all of indentation corners throughout the SEM images, and the crack length, c, increased with more indentation load. The average crack lengths are detailed in Table 3. All radial cracks propagated along the projection direction of the Berkovich indenter edge. There were pop-in events (sudden depth bursts in the load-displacement curves) observed in all of the loading curves; however, the unloading curve was relatively smooth, except for the last indentation where peeling occurred under a greater load.

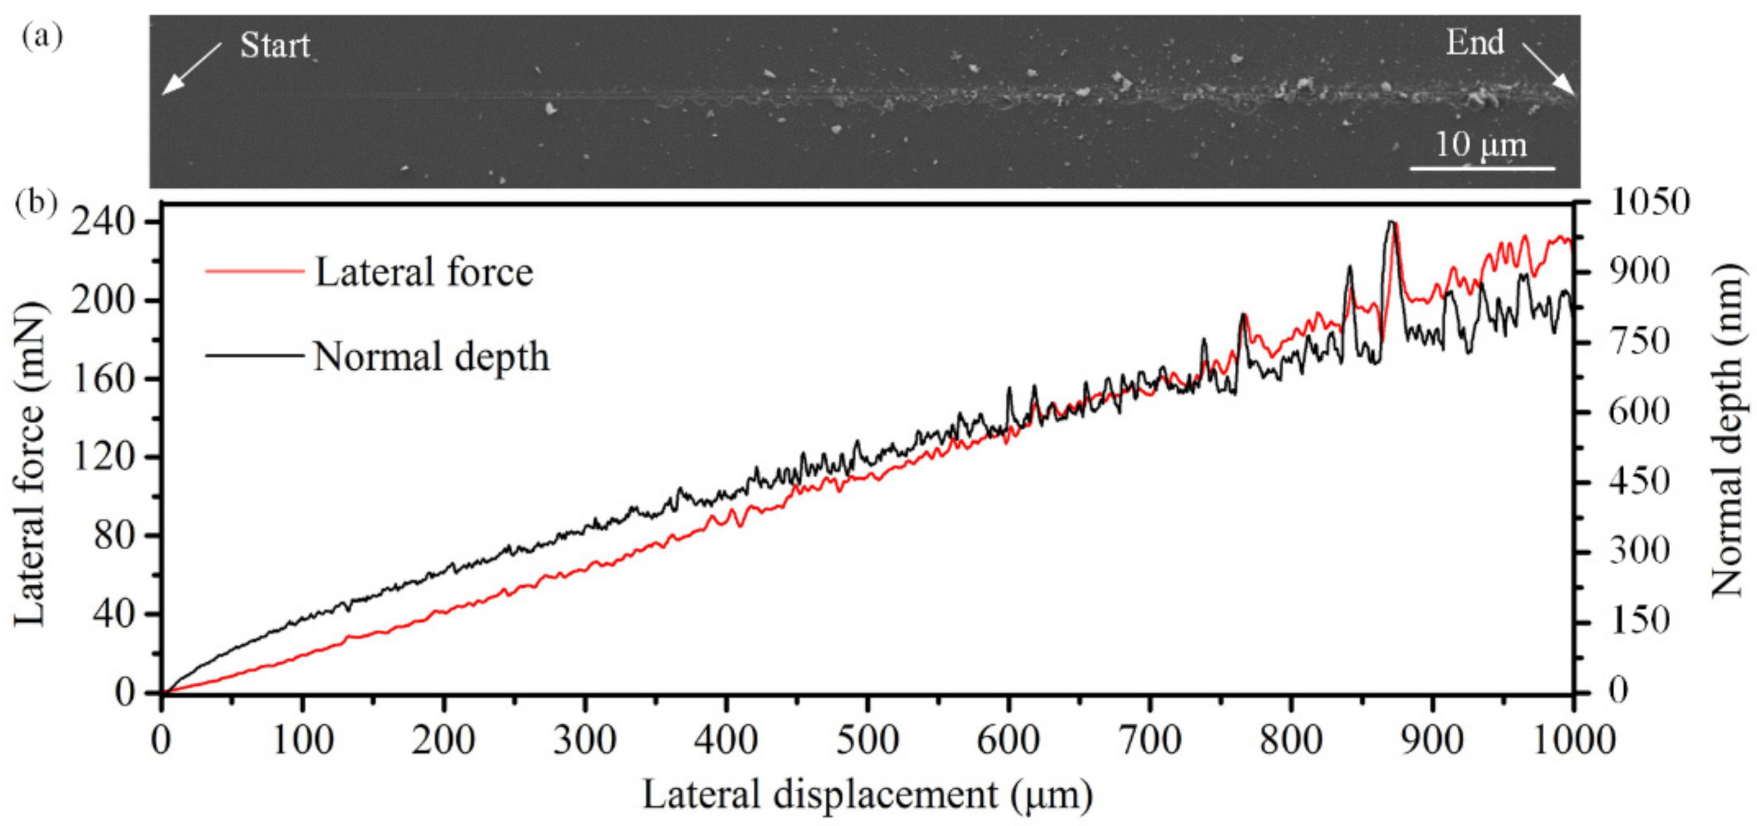
4.2. Scratch Results

Figure 8 shows the experimental results of a ramp-normal force scratch test on 4H-SiC single crystals with a Berkovich indenter. The SEM image of the scratched track is presented in Figure 8a. A typical scratch track, as described in Section 2.2, was performed. The lateral force and the normal depth increased with greater normal force, as shown in Figure 8b. When the peelings and debris were observed in the sample surface, both the lateral force versus lateral displacement curve and the normal depth versus lateral displacement curve began to show jagged fluctuations, which were more severe as the scratch continued. In addition, the location of the two curves showed identical jagged waves.

5. Analysis and Discussion

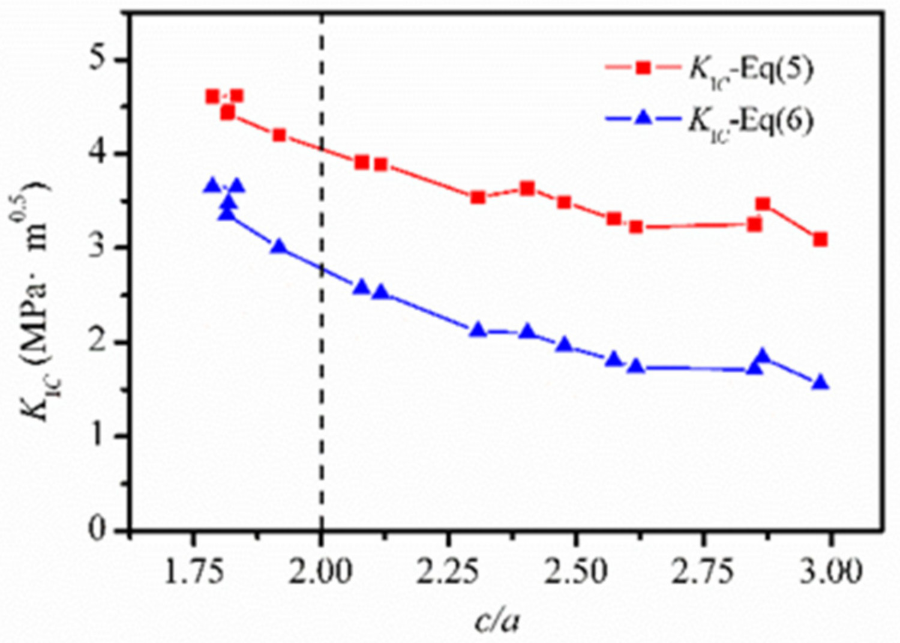
5.1. Determination of the Fracture Toughness

The indentation hardness and indentation modulus of 4H-SiC single crystals on the (0001) face without cracks were 35.81 GPa and 461.3 GPa, respectively [28]. The results in Section 4.1 were used in Equations (5) and (6) and the fracture toughness results of 4H-SiC single crystals on the (0001) face were obtained, as shown in Figure 9. With the increase of the c/a ratio, the fracture toughness values, whether from Equation (5) or Equation (6), showed a decreasing trend. When the value of the c/a ratio was small (i.e., less than 1.6), the nanogrooves on the sample surface after the CMP treatment and the cracks were hard to identify, as shown in Figure 10, leading to a large crack length measuring error and causing the calculated fracture toughness to be far away from the real value. The effect of the nanogrooves decreases as normal force increases, so this kind of situation with a small value of c/a ratio should be avoided. When the value of the c/a ratio was large (i.e., greater than 2.9), peeling and crack bifurcation were observed, as shown in Figure 7, leading to effective crack extension termination. From the above, an appropriate value of c/a ratio is significant to calculate the fracture toughness of 4H-SiC single crystals. Table 4 shows the results of fracture toughness of 4H-SiC single crystals using a c/a range of 2 to 2.5. Table 4 shows that a c/a ratio of 2, where the results of two calculations are the closest, used to determine the crack system of a 4H-SiC single crystal was reasonable. The fracture toughness of a 4H-SiC single crystal on the (0001) face was shown to be 3.42 MPa∙m1/2 via employment of Equation (5) (where the c/a ratio is less than 2) and 3.47 MPa∙m1/2 via employment of Equation (6) (where the c/a ratio is more than 2). These results demonstrated good agreement with other references, as shown in Table 5.

5.2. Critical Indentation Size

A near-linear relationship between a and c was obvious and is illustrated in Figure 11. The linear fitting method was used to obtain the fitting function, expressed as c = 3.35a–5.77. When c = 0, the condition was considered to be critical, with no crack on the edge of the indentation and a critical experimental fitting result of a of 1.72 μm.
According to Lawn’s research, a critical load of indentation exists for radial cracks [35]. The critical condition can be determined using the following equation:
a c = Θ K I C / H 2
where ac is the characteristic dimension of plastic impression and Θ is a dimensionless factor. Lawn also gave the critical values of SiC: ac = 2 μm. This result was close to the experimental fitting result.

5.3. Material Removal Mechanism

Figure 12 shows the partial enlarged SEM images of the scratch. Plastic deformation during the scratch test of SiC single crystals has been consistently described by many researchers when the scratching depth (or normal force effected on the indenter) is small enough [27]. As shown in Figure 12a, large ductile chips were observed on the edge of the scratch, with no cracks within the groove when the lateral displacement ranged from 128 to 134 μm (corresponding normal force ranging from 64 to 77 mN). The main deformation behavior was considered to be plastic in this stage.
As shown in Figure 12b, when the normal force increased to approximately 87 mN, a radial crack extended to the surface of the sample for the first time. Meanwhile, numerous microcracks perpendicular to the scratching direction were found within the groove, because the residual stress where the indenter impacted on the material subsurface caused median crack extension to the groove surface, thus forming the microcrack. As shown in Figure 12c, with the further increase in normal force, the radial cracks propagated steadily, and the distance between the two adjacent radial cracks decreased.
After that, as shown in Figure 12d, with the continuous increase in normal force, a number of microcracks propagated to the edge of groove and intersected with the radial cracks, possibly resulting in material removal in the form of peeling chips, thereby leading to the mode of removal changing from ductile to brittle. As shown in Figure 12e–f, with a sustained increase in normal force, the brittle fracture began to dominate the material removal, and a large amount of variably sized debris appeared because the crack system was no longer able to stably extend; instead, this was replaced by a dynamic fracture when the applied load exceeded the critical load [35]. The peeling chips and debris obviously contributed to the improvement of the material removal rate, but caused deterioration of the machining surface.
The edge damage sizes of five characteristic positions generated relatively large peeling of the scratched groove as measured by SEM and in Figure 13. Figure 14 shows the comparison of the predicted curve obtained from Equation (4) and the experimental data. The results indicated that the experimental data were consistent with the predicted curve.

5.4. Determination of Normal Force in Brittle Stage

When the normal force was more than 87 mN, a radial crack extended to the surface, as discussed in Section 5.3. Comparison of the experimental data showed that the normal force was more than 87 mN; traditional prediction and modified prediction are shown in Figure 15. The modified predicted curve closely matched the experimental data, but the traditional predicted curve was relatively far away from the experimental data. Abundant events of peeling and debris in the surface and subsurface cracking and microabrasive stages were observed, as shown in Figure 2, causing a change in the normal projected area between the indenter and sample. According to Equation (7), the change in the projected area can feedback to the normal force. These results prove that the elastic recovery of 4H-SiC single crystals cannot be ignored in micro–nano machining.

6. Conclusions

In this paper, indentation and scratch tests were conducted with a Berkovich indenter on the (0001) surface of 4H-SiC single crystals. The following conclusions were obtained.
  • The fracture toughness of 4H-SiC single crystals was evaluated by a series of indentation tests in which the maximum normal force ranged from 0.4 to 3.3 N. The values of fracture toughness, calculated by both Lawn’s equation and Laugier’s equation, decreased with increasing c/a ratio. An appropriate value of c/a ratio is significant to calculate fracture toughness of 4H-SiC single crystals.
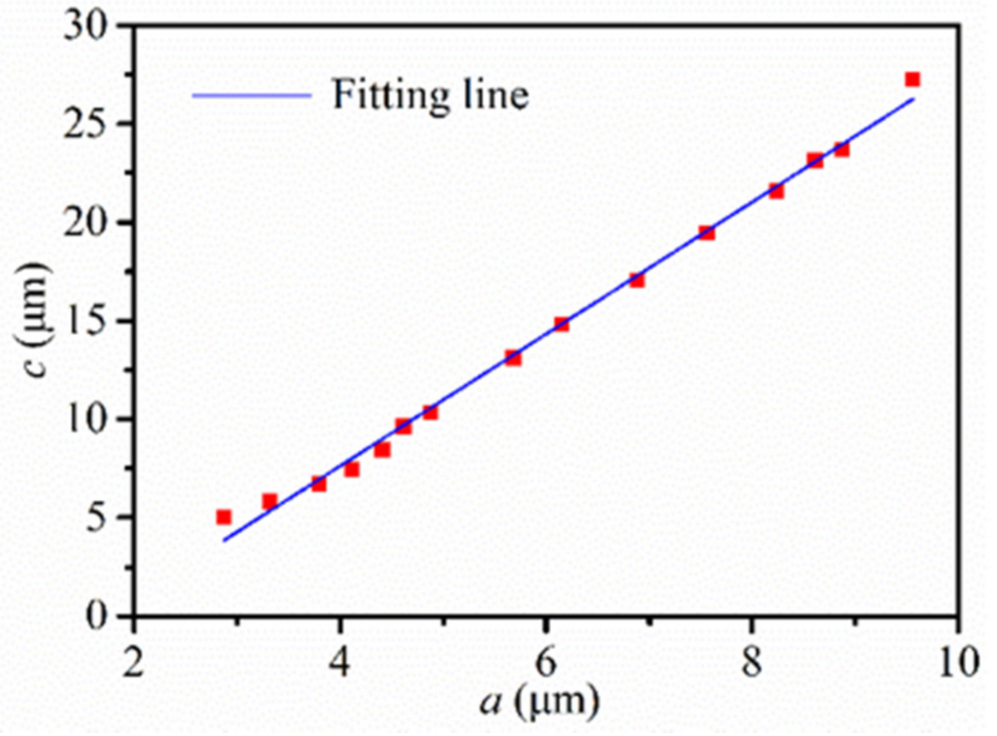
  • According to the linear relationship between a and c, a critical condition with no cracks on the edge of the indentation was obtained through the fitting method, and the experimental fitting results agreed well with Lawn’s results.
  • The surface morphologies of the groove were analyzed by SEM. Plastic deformation was observed and characterized by the smooth groove without cracks and ductile chips on the edge of the groove in the initial stages of the scratch. With the increase in normal force, median cracks, radial cracks, and microcracks appeared in turn. With a sustained increase in normal force, the crack system was not able to continue extending stably, and the brittle fracture dominated the material removal.
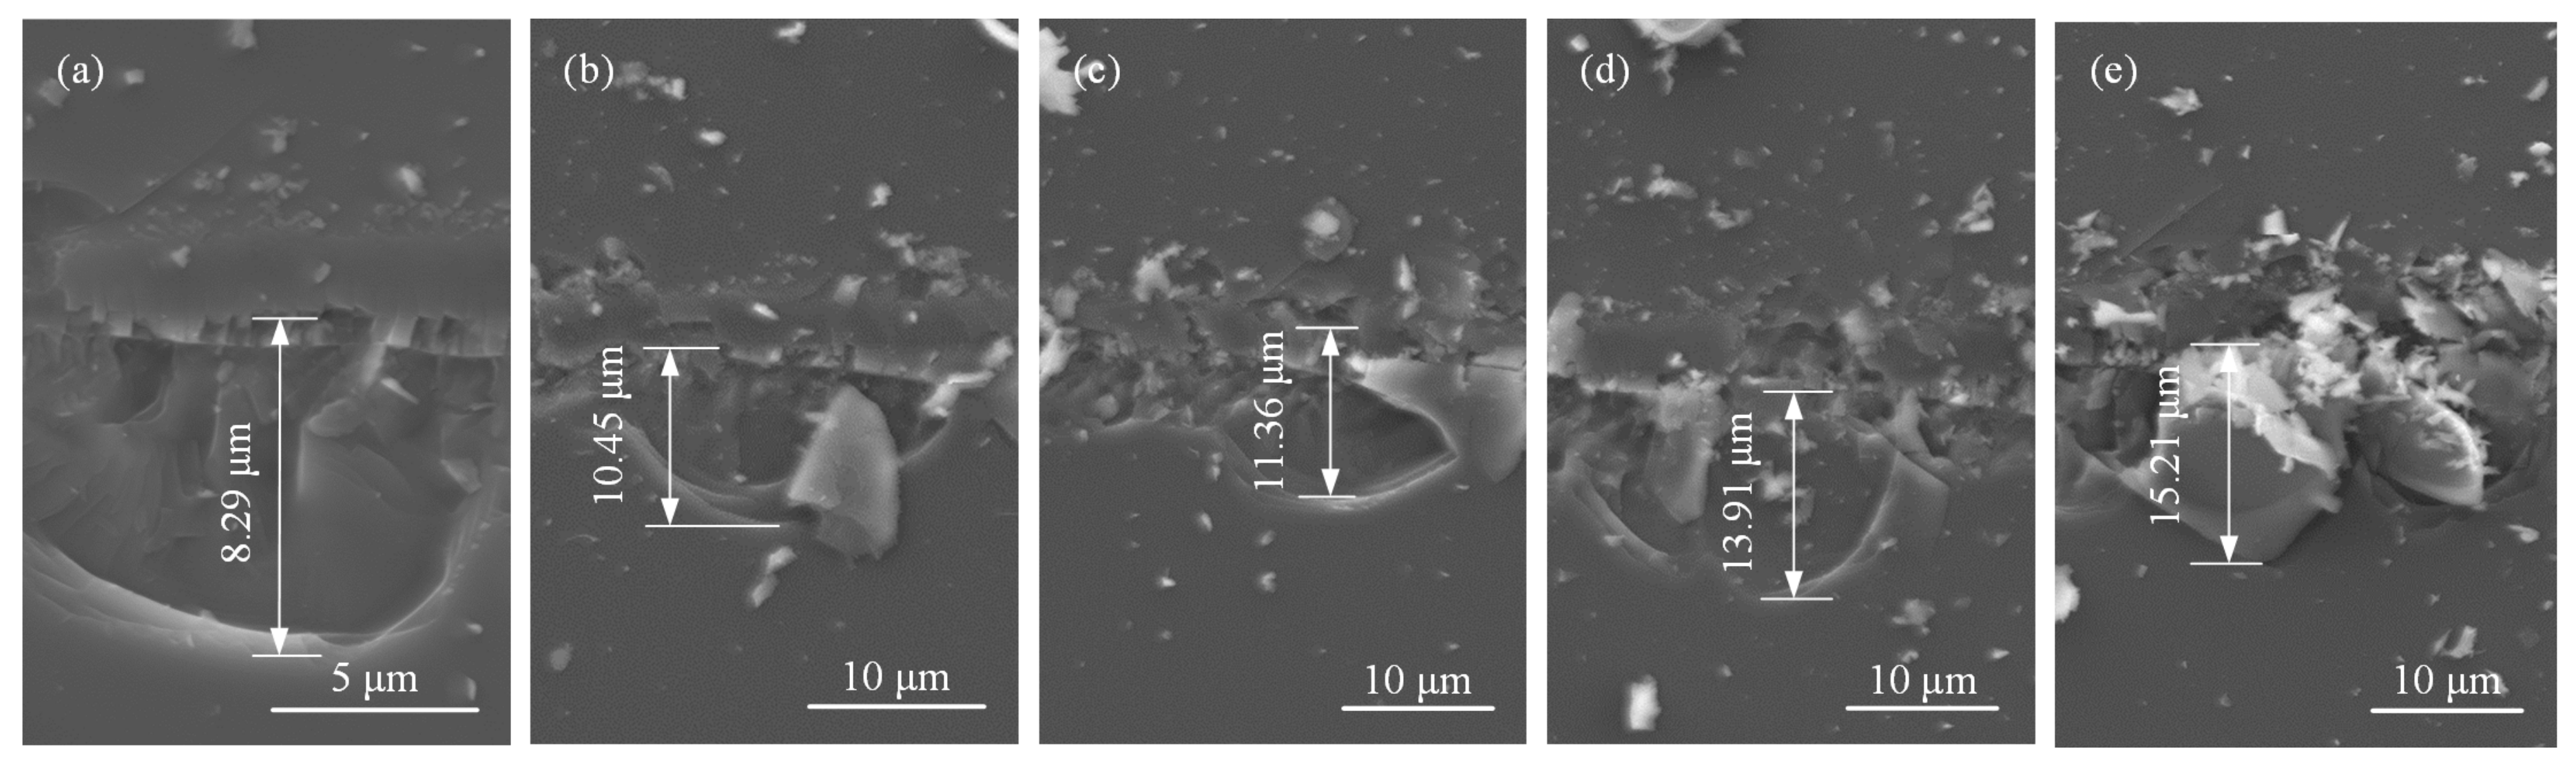
  • The sizes of the edge damage of five characteristic positions generated relatively large peeling of the scratched groove, which were measured using SEM, and the experimental data highly agreed with the predicted curve.
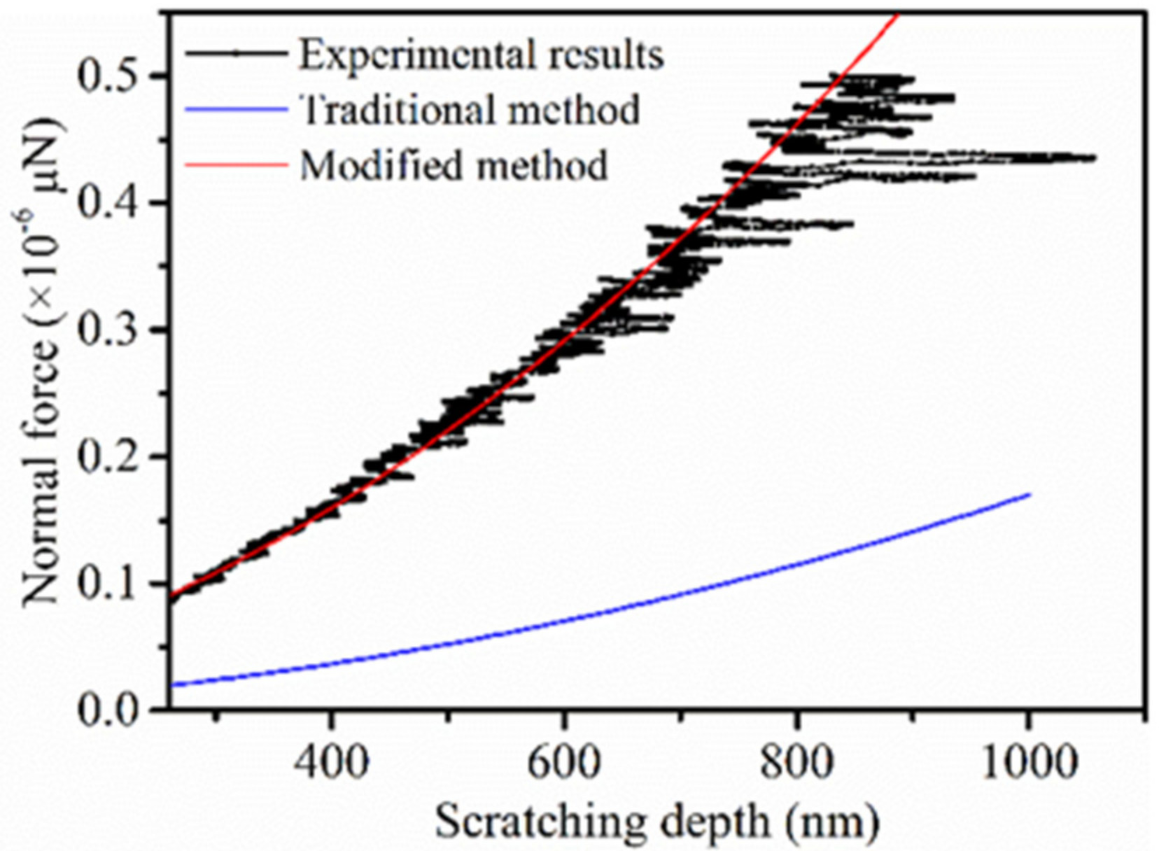
  • A modified calculation model considered the previously proposed elastic recovery of normal force during the scratching process. Compared with the traditional calculation model, the modified predicted curve was closer to the experimental data. These results prove that the elastic recovery of 4H-SiC single crystals cannot be ignored during micro–nano machining.

Author Contributions

Conceptualization, P.C. and S.L.; methodology, P.C. and Y.L.; validation, X.Y. and S.L.; investigation, P.C. and S.L.; data curation, P.C., S.L., and Y.L.; writing—original draft preparation, P.C.; writing—review and editing, S.L., X.Y., and Y.L.; visualization, P.C.; project administration, Y.L.; funding acquisition, Y.L. and S.L. All authors have read and agreed to the published version of the manuscript.

Funding

This research was funded by the National Nature Science Foundation of China (No. 51575442) and Shaanxi Provincial Natural Science Foundation (2016JZ011, 2019CGXNG-022).

Acknowledgments

The authors are grateful to the National Natural Science Foundation of China and Shaanxi Provincial Natural Science Foundation, which enabled research on the rails.

Conflicts of Interest

The authors declare no conflict of interest.

References

  1. Kumar, P.; Srivastava, V.K. Tribological behaviour of C/C–SiC composites—A review. J. Adv. Ceram. 2016, 5, 1–12. [Google Scholar] [CrossRef] [Green Version]
  2. Guo, X.; Xun, Q.; Li, Z.; Du, S. Silicon Carbide Converters and MEMS Devices for High-temperature Power Electronics: A Critical Review. Micromachines 2019, 10, 406. [Google Scholar] [CrossRef] [PubMed] [Green Version]
  3. Shcherban, N.D. Review on synthesis, structure, physical and chemical properties and functional characteristics of porous silicon carbide. J. Ind. Eng. Chem. 2017, 50, 15–28. [Google Scholar] [CrossRef]
  4. She, X.; Huang, A.Q.; Lucia, O.; Ozpineci, B. Review of Silicon Carbide Power Devices and Their Applications. IEEE Trans. Ind. Electron. 2017, 64, 8193–8205. [Google Scholar] [CrossRef]
  5. Mohankumar, P.; Ajayan, J.; Yasodharan, R.; Devendran, P.; Sambasivam, R. A review of micromachined sensors for automotive applications. Measurement 2019, 140, 305–322. [Google Scholar] [CrossRef]
  6. Duan, W.; Yin, X.; Li, Q.; Schlier, L.; Greil, P.; Travitzky, N. A review of absorption properties in silicon-based polymer derived ceramics. J. Eur. Ceram. Soc. 2016, 36, 3681–3689. [Google Scholar] [CrossRef]
  7. Momohjimoh, I.; Hussein, M.A.; Al-Aqeeli, N. Recent Advances in the Processing and Properties of Alumina(-)CNT/SiC Nanocomposites. Nanomaterials 2019, 9, 86. [Google Scholar] [CrossRef] [Green Version]
  8. Eom, J.-H.; Kim, Y.-W.; Raju, S. Processing and properties of macroporous silicon carbide ceramics: A review. J. Asian Ceram. Soc. 2018, 1, 220–242. [Google Scholar] [CrossRef] [Green Version]
  9. Wang, P.; Ge, P.; Ge, M.; Bi, W.; Meng, J. Material removal mechanism and crack propagation in single scratch and double scratch tests of single-crystal silicon carbide by abrasives on wire saw. Ceram. Int. 2019, 45, 384–393. [Google Scholar] [CrossRef]
  10. Rao, X.; Zhang, F.; Luo, X.; Ding, F.; Cai, Y.; Sun, J.; Liu, H. Material removal mode and friction behaviour of RB-SiC ceramics during scratching at elevated temperatures. J. Eur. Ceram. Soc. 2019, 39, 3534–3545. [Google Scholar] [CrossRef]
  11. Yen, C.-Y.; Jian, S.-R.; Tseng, Y.-C.; Juang, J.-Y. The deformation behavior and fracture toughness of single crystal YSZ(111) by indentation. J. Alloys Compd. 2018, 735, 2423–2427. [Google Scholar] [CrossRef]
  12. Li, X.; Gao, Y.; Ge, P.; Zhang, L.; Bi, W.; Meng, J. Nucleation location and propagation direction of radial and median cracks for brittle material in scratching. Ceram. Int. 2019, 45, 7524–7536. [Google Scholar] [CrossRef]
  13. Zhang, Z.; Yang, X.; Zheng, L.; Xue, D. High-performance grinding of a 2-m scale silicon carbide mirror blank for the space-based telescope. Int. J. Adv. Manuf. Technol. 2016, 89, 463–473. [Google Scholar] [CrossRef]
  14. Zheng, G.; Xu, L.; Zou, X.; Liu, Y. Excitation of surface phonon polariton modes in gold gratings with silicon carbide substrate and their potential sensing applications. Appl. Surf. Sci. 2017, 396, 711–716. [Google Scholar] [CrossRef] [Green Version]
  15. Widmann, M.; Niethammer, M.; Makino, T.; Rendler, T.; Lasse, S.; Ohshima, T.; Ul Hassan, J.; Tien Son, N.; Lee, S.-Y.; Wrachtrup, J. Bright single photon sources in lateral silicon carbide light emitting diodes. Appl. Phys. Lett. 2018, 112, 231103. [Google Scholar] [CrossRef]
  16. Regnat, G.; Jeannin, P.-O.; Frey, D.; Ewanchuk, J.; Mollov, S.V.; Ferrieux, J.-P. Optimized Power Modules for Silicon Carbide MOSFET. IEEE Trans. Ind. Appl. 2018, 54, 1634–1644. [Google Scholar] [CrossRef]
  17. Kargarrazi, S.; Elahipanah, H.; Rodriguez, S.; Zetterling, C.-M. 500 °C, High Current Linear Voltage Regulator in 4H-SiC BJT Technology. IEEE Electron. Device Lett. 2018, 39, 548–551. [Google Scholar] [CrossRef]
  18. Shen, Y.; Jones, A.H.; Yuan, Y.; Zheng, J.; Peng, Y.; VanMil, B.; Olver, K.; Sampath, A.V.; Parker, C.; Opila, E.; et al. Near ultraviolet enhanced 4H-SiC Schottky diode. Appl. Phys. Lett. 2019, 115, 261101. [Google Scholar] [CrossRef]
  19. Datye, A.; Lin, H.-T. Energy analysis of spherical and Berkovich indentation contact damage in commercial polycrystalline silicon carbide. Ceram. Int. 2017, 43, 800–809. [Google Scholar] [CrossRef] [Green Version]
  20. Behner, T.; Heine, A.; Wickert, M. Dwell and penetration of tungsten heavy alloy long-rod penetrators impacting unconfined finite-thickness silicon carbide ceramic targets. Int. J. Impact Eng. 2016, 95, 54–60. [Google Scholar] [CrossRef]
  21. Shi, Y.; Sun, Y.; Liu, J.; Tang, J.; Li, J.; Ma, Z.; Cao, H.; Zhao, R.; Kou, Z.; Huang, K.; et al. UV nanosecond laser machining and characterization for SiC MEMS sensor application. Sens. Actuators A Phys. 2018, 276, 196–204. [Google Scholar] [CrossRef]
  22. Cook, E.; Tomaino-Iannucci, M.; Bernstein, J.; Weinberg, M.; Choy, J.; Hobart, K.; Luna, L.; Tadjer, M.; Myers-Ward, R.; Kub, F.; et al. A High-Mass, Eight-Fold Symmetric Silicon Carbide Mems Gyroscope. Solid State Sens. Actuators Microsyst. Workshop 2018, 364–365. [Google Scholar] [CrossRef]
  23. Okojie, R.S.; Lukco, D.; Nguyen, V.; Savrun, E. 4H-SiC Piezoresistive Pressure Sensors at 800 °C With Observed Sensitivity Recovery. IEEE Electron. Device Lett. 2015, 36, 174–176. [Google Scholar] [CrossRef]
  24. Lu, X.; Lee, J.Y.; Lin, Q. High-frequency and high-quality silicon carbide optomechanical microresonators. Sci. Rep. 2015, 5, 17005. [Google Scholar] [CrossRef] [PubMed]
  25. Cooper, O.; Wang, B.; Brown, C.L.; Tiralongo, J.; Iacopi, F. Toward Label-Free Biosensing With Silicon Carbide: A Review. IEEE Access 2016, 4, 477–497. [Google Scholar] [CrossRef]
  26. Phan, H.P.; Zhong, Y.; Nguyen, T.K.; Park, Y.; Dinh, T.; Song, E.; Vadivelu, R.K.; Masud, M.K.; Li, J.; Shiddiky, M.J.A.; et al. Long-Lived, Transferred Crystalline Silicon Carbide Nanomembranes for Implantable Flexible Electronics. ACS Nano 2019, 13, 11572–11581. [Google Scholar] [CrossRef] [PubMed]
  27. Chai, P.; Li, S.; Li, Y. Modeling and Experiment of the Critical Depth of Cut at the Ductile-Brittle Transition for a 4H-SiC Single Crystal. Micromachines 2019, 10, 382. [Google Scholar] [CrossRef] [Green Version]
  28. Chai, P.; Li, S.; Li, Y.; Liang, L.; Yin, X. Mechanical Behavior Investigation of 4H-SiC Single Crystal at the Micro-Nano Scale. Micromachines 2020, 11, 102. [Google Scholar] [CrossRef] [Green Version]
  29. Lawn, B.R.; Swain, M.V. Microfracture beneath point indentations in brittle solids. J. Mater. Sci. 1975, 10, 113–122. [Google Scholar] [CrossRef]
  30. Marshall, D.; Lawn, B.; Evans, A. Elastic/Plastic Indentation Damage in Ceramics: The Lateral Crack System. J. Am. Ceram. Soc. 1982, 65, 561–566. [Google Scholar] [CrossRef]
  31. John, C.; Lambropoulos, S.D.J.; Ruckman, J. Material removal mechanisms from grinding to polishing. Ceram. Trans. 1999, 102, 113–128. [Google Scholar]
  32. Wasmer, K.; Ballif, C.; Gassilloud, R.; Pouvreau, C.; Rabe, R.; Michler, J.; Breguet, J.M.; Solletti, J.M.; Karimi, A.; Schulz, D. Cleavage Fracture of Brittle Semiconductors from the Nanometre to the Centimetre Scale. Adv. Eng. Mater. 2005, 7, 309–317. [Google Scholar] [CrossRef] [Green Version]
  33. Le Houérou, V.; Sangleboeuf, J.-C.; Dériano, S.; Rouxel, T.; Duisit, G. Duisit. Surface damage of soda–lime–silica glasses: Indentation scratch behavior. J. Non-Cryst. Solids 2003, 63, 54–63. [Google Scholar] [CrossRef]
  34. Wang, L.; Gao, Y.; Li, X.; Pu, T.; Yin, Y. Analytical prediction of subsurface microcrack damage depth in diamond wire sawing silicon crystal. Mater. Sci. Semicond. Process. 2020, 112, 105015. [Google Scholar] [CrossRef]
  35. Lawn, B. Fracture of Brittle Solids, 2nd ed.; Cambridge University Press: Cambridge, UK, 1993. [Google Scholar] [CrossRef]
  36. Hervas, I.; Montagne, A.; Van Gorp, A.; Bentoumi, M.; Thuault, A.; Iost, A. Fracture toughness of glasses and hydroxyapatite: A comparative study of 7 methods by using Vickers indenter. Ceram. Int. 2016, 42, 12740–12750. [Google Scholar] [CrossRef] [Green Version]
  37. Chen, Z.; Wang, X.; Giuliani, F.; Atkinson, A. Fracture Toughness of Porous Material of LSCF in Bulk and Film Forms. J. Am. Ceram. Soc. 2015, 98, 2183–2190. [Google Scholar] [CrossRef] [Green Version]
  38. Guo, H.; Jiang, C.B.; Yang, B.J.; Wang, J.Q. On the fracture toughness of bulk metallic glasses under Berkovich nanoindentation. J. Non-Cryst. Solids 2018, 481, 321–328. [Google Scholar] [CrossRef]
  39. Rao, X.; Zhang, F.; Luo, X.; Ding, F. Characterization of hardness, elastic modulus and fracture toughness of RB-SiC ceramics at elevated temperature by Vickers test. Mater. Sci. Eng. A 2019, 744, 426–435. [Google Scholar] [CrossRef] [Green Version]
  40. Ghidelli, M.; Sebastiani, M.; Johanns, K.E.; Pharr, G.M. Effects of indenter angle on micro-scale fracture toughness measurement by pillar splitting. J. Am. Ceram. Soc. 2017, 100, 5731–5738. [Google Scholar] [CrossRef]
  41. Bruns, S.; Petho, L.; Minnert, C.; Michler, J.; Durst, K. Fracture toughness determination of fused silica by cube corner indentation cracking and pillar splitting. Mater. Des. 2020, 186, 1–8. [Google Scholar] [CrossRef]
  42. Best, J.P.; Zechner, J.; Wheeler, J.M.; Schoeppner, R.; Morstein, M.; Michler, J. Small-scale fracture toughness of ceramic thin films: The effects of specimen geometry, ion beam notching and high temperature on chromium nitride toughness evaluation. Philos. Mag. 2016, 96, 3552–3569. [Google Scholar] [CrossRef]
  43. Ast, J.; Ghidelli, M.; Durst, K.; Göken, M.; Sebastiani, M.; Korsunsky, A.M. A review of experimental approaches to fracture toughness evaluation at the micro-scale. Mater. Des. 2019, 173, 107762. [Google Scholar] [CrossRef]
  44. Feng, Y.; Zhang, T. Determination of fracture toughness of brittle materials by indentation. Acta Mech. Solida Sin. 2015, 28, 221–234. [Google Scholar] [CrossRef]
  45. Zameer Abbas, S.; Ahmad Khalid, F.; Zaigham, H. Indentation fracture toughness behavior of FeCo-based bulk metallic glass intrinsic composites. J. Non-Cryst. Solids 2017, 457, 86–92. [Google Scholar] [CrossRef]
  46. Lawn, B.R.; Evans, A.G.; Marshall, D.B. Elastic/Plastic Indentation Damage in Ceramics: The Mediad/Radial Crack System. J. Am. Ceram. Soc. 1980, 63, 574–581. [Google Scholar] [CrossRef]
  47. Harding, D.S.; Oliver, W.C.; Pharr, G.M. Cracking During Nanoindentation and its Use in the Measurement of Fracture Toughness. MRS Proc. 1994, 356, 664–668. [Google Scholar] [CrossRef] [Green Version]
  48. Laugier, M.T. Palmqvist indentation toughness in WC-Co composites. J. Mater. Sci. Lett. 1987, 6, 897–900. [Google Scholar] [CrossRef]
  49. Garrido, M.A.; Giraldez, I.; Ceballos, L.; Rodriguez, J. On the possibility of estimating the fracture toughness of enamel. Dent. Mater. 2014, 30, 1224–1233. [Google Scholar] [CrossRef]
  50. Li, C.; Zhang, Q.; Zhang, Y.; Zhang, F.; Wang, X.; Dong, G. Nanoindentation and nanoscratch tests of YAG single crystals: An investigation into mechanical properties, surface formation characteristic, and theoretical model of edge-breaking size. Ceram. Int. 2020, 46, 3382–3393. [Google Scholar] [CrossRef]
  51. Gilles Orange, H.T.; Gilbert, F. Fracture Toughness of Pressureless Sintered Silicon Carbide: A Comparison of KIL Measurement Methods. Ceram. Int. 1987, 13, 159–165. [Google Scholar] [CrossRef]
  52. Henshall, J.L.; Rowcliffe, D.J.; Edington, J.W. Fracture Toughness of Single-Crystal Silicon Carbide. J. Am. Ceram. Soc. 1977, 60, 373–375. [Google Scholar] [CrossRef]
  53. Eswar Prasad, K.; Ramesh, K.T. Hardness and mechanical anisotropy of hexagonal SiC single crystal polytypes. J. Alloys Compd. 2019, 770, 158–165. [Google Scholar] [CrossRef]
Figure 1. Microfracture model for brittle materials: (a) loading and (b) unloading.
Applsci 10 05944 g001
Figure 2. Schematic diagrams of scratching for brittle materials using an increasingly linear load along the scratch track, where “a” represents the elastic stage, “b” the represents plastic stage, “c” represents the subsurface cracking stage, “d” represents the surface and subsurface cracking stage, and “e” represents the microabrasive stage.
Applsci 10 05944 g002
Figure 3. Illustration of typical radial crack propagation for a Berkovich indenter: (a) the top view of indentation-induced crack geometries, (b) the Palmqvist crack system, and (c) the half-penny crack system.
Applsci 10 05944 g003
Figure 4. Diagram of the scratching process: (a) traditional analysis of normal force and (b) modified analysis of normal force.
Applsci 10 05944 g004
Figure 5. Photographs of the Ti 950 Triboindenter. (a) The apparatus used for the indentation tests. (b) The apparatus used for the scratch tests.
Applsci 10 05944 g005
Figure 6. Schematic diagrams of the scratch test: (a) prescan stage and (b) scratching stage.
Applsci 10 05944 g006
Figure 7. Different loads vs. indentation depth curves and corresponding SEM images.
Applsci 10 05944 g007
Figure 8. Experimental results of a ramp-load scratch test on 4H-SiC single crystals with a Berkovich indenter: (a) SEM image of the scratch track and (b) normal depth and lateral force as a function of lateral displacement.
Applsci 10 05944 g008
Figure 9. Relationship between c/a and KIC.
Applsci 10 05944 g009
Figure 10. The SEM morphology with a normal force of 0.2 N.
Applsci 10 05944 g010
Figure 11. Linear fitting curve of a and c.
Applsci 10 05944 g011
Figure 12. Surface morphologies of cracks and damages with different lateral displacements: (a) lateral displacement ranging from 128 to 134 μm, (b) lateral displacement ranging from 171 to 177 μm, (c) lateral displacement ranging from 220 to 238 μm, (d) lateral displacement ranging from 290 to 294 μm, (e) lateral displacement ranging from 430 to 444 μm, and (f) lateral displacement ranging from 556 to 570 μm.
Applsci 10 05944 g012
Figure 13. Edge damage size generated relatively large peeling as measured by SEM: (a) FN = 0.172 N, (b) FN = 0.252 N, (c) FN = 0.299 N, (d) FN = 0.385 N, and (e) FN = 0.473 N.
Applsci 10 05944 g013
Figure 14. Comparison of predicted edge damage size and experimental results.
Applsci 10 05944 g014
Figure 15. The normal force of comparison of experimental data, traditional prediction, and modified prediction in the brittle scratching process.
Applsci 10 05944 g015
Table 1. The applications and corresponding properties of silicon carbide (SiC).
ApplicationsPropertiesInstance and Reference
Optical materialHigh specific rigidity, high thermal stabilitySpace-based astronomy telescope [13], grating [14]
DeviceLarge band gap, high temperature, high frequencyEmitting diode [15], Metal-Oxide-Semiconductor Field-Effect Transistor (MOSFET) [16], Bipolar Junction Transistor (BJT) [17], Schottky diodes [18]
Composite and coatingHigh hardness, high strength, wear resistancepistons, valve heads, bearings [19], armor [20]
Porous materialHigh porosity, less volume density, high mechanical strengthWater filtration, filters, polymer matrix composites [3,8]
Micro-Electro-Mechanical System (MEMS)High temperature, corrosive environment, high radiationAccelerometer [21], gyroscope [22], pressure sensors [23], resonator [24]
BiosensorBiocompatibility, chemically inertBiochemical detection systems [25], implantable flexible electronics [26]
Table 2. Scratch test parameters.
Test ParametersUnitsValues
Prescan loadmN0.1
Load rangemN0–500
Scratch lengthμm1000
Scratch velocityμm/s4
Table 3. Average indentation results of five trials.
NumberFmax (N)Average a (μm)Average c (μm)Standard Deviation of cc/a
10.42.875.010.311.75
20.53.325.810.511.75
30.63.806.720.531.77
40.74.127.470.651.82
50.84.418.460.661.92
60.94.629.610.752.08
714.8810.330.692.12
81.35.6813.110.682.31
91.66.1514.790.912.40
101.96.8917.060.822.48
112.27.5619.460.772.57
122.58.2421.560.792.62
132.88.6124.540.852.85
143.18.8725.421.322.87
153.49.5628.492.392.98
Table 4. The fracture toughness of SiC according to different c/a ratios.
c/a ratioKIC-Equation (5) (MPa∙m1/2)KIC-Equation (6) (MPa∙m1/2)
2.03.423.47
2.13.283.43
2.23.173.37
2.33.043.35
2.42.943.3
2.52.833.27
Table 5. The fracture toughness of SiC measured by different methods.
SampleMethodKIC (MPa∙m1/2)Reference
α-SiCChevron notched beam (CVNB)3.03[51]
6H-SiC (0001)Single edge notched beam (SENB)3.3[52]
4H-SiC (0001)Indentation for Berkovich indenter3.33[53]
4H-SiC (0001)Indentation for Berkovich indenter3.42Present (Equation (5))
4H-SiC (0001)Indentation for Berkovich indenter3.47Present (Equation (6))

