Article

Novel Faulted Section Location Method for Distribution Network Based on Status Information of Fault Indicating Equipment

Key Laboratory of Power System Intelligent Dispatch and Control of Ministry of Education, Shandong University, Jinan 250061, China
*
Author to whom correspondence should be addressed.
Appl. Sci. 2020, 10(17), 5910; https://doi.org/10.3390/app10175910
Submission received: 13 July 2020 / Revised: 13 August 2020 / Accepted: 25 August 2020 / Published: 26 August 2020
(This article belongs to the Section Energy Science and Technology)

Abstract

:
This paper proposes a novel faulted section location method for power distribution networks based on the status information collected by fault-indicating equipments. It has an advantage that it does not need to analyze and calculate any electrical parameters, and it is not affected by fault types and system parameters, so this method can be easily applied to power distribution networks. Firstly, a novel method for automatically constructing a line list is proposed in this paper—it can represent the topology structure of the power distribution line and the status information of fault-indicating equipment. Based on the line list, a topology search algorithm is proposed in the method to locate the faulted section. Considering that information loss will cause errors in the line list, an information loss detection algorithm is proposed to detect and correct the wrong status of fault-indicating equipments. Then, different fault conditions such as single fault, multiple faults, distributed generations in system and information loss condition are tested in power distribution networks with different topologies, and the simulation results indicate that the proposed method can deal with each case well. Moreover, the proposed fault location method has an advantage that the running time does not necessarily increase when the node scale is expanded.

1. Introduction

Distribution networks are becoming more intelligent and complex with the development of the society. According to statistics, almost 80% of faults are observed in distribution networks [1]. More importantly, distribution networks are connected with users directly, so the study on fast and accurate fault location method of distribution networks is particularly important.
Various fault location methods have been proposed before. The impedance method is simple in principle and requires less investment, but it is easily affected by transition resistance and branches [2,3,4,5]. The traveling wave method requires high accuracy of the measuring equipments, but the cost of equipment is very high. Moreover, it is necessary to install equipment on multiple branches, and it is difficult to accurately synchronize the multi-terminal traveling wave signals, so this method is also difficult to apply in the distribution network [6,7,8]. Other fault location methods that have been proposed include minimum fault reactance methods [9,10], the genetic algorithm [11,12], and the pattern recognition method [13,14]. In [11], the classical genetic algorithm has good fault tolerance, but for the random iteration and lack of guidance, it is easy to fall into a local optimum. Reference [12] improved the classical genetic algorithm proposed in Reference [11], through searching the solution space by multiple-population collaboratively and improving the convergence conditions, meaning that the possibility of falling into a local optimum was reduced. However, when distribution networks are expanded to hundreds or thousands of nodes, the calculation work will increase greatly, and the accuracy of the results will also be reduced. Some researchers use pattern recognition methods, and the already-trained artificial neural networks are applied to judge the faulted section [13,14]. However, when the topology of distribution network changes, the artificial neural networks will take a lot of time to be retrained.
As more and more feeder terminal equipments, such as feeder terminal units (FTUs) and fault indicators (FIs), are applied in power distribution networks, using fault status signals collected by feeder terminal equipments to achieve accurate and fast fault location has become an important research topic. In addition, distributed generations applied in distribution networks and information loss of equipments have put forward higher requirements for the research of fault location [15,16].
So far, scholars from different countries have proposed some fault location methods based on information of FTUs. In [17], a fault location method based on the measurement of sparse voltage amplitude was proposed, it uses the voltage information of some measuring points. Although the number of required measuring points is reduced by the Bayesian compressed sensing theory, the selection of measuring points is very strict. When the topology of distribution network changes, all measuring points need to be reselected, so this method is not suitable for the distribution network if the topology structure changes frequently. The method of linear integer programming was used to locate the fault point in [18], which improves the fault tolerance performance of swarm intelligence algorithm. But the author only considered single power supply when designing the mathematical model of distribution networks, and the constructed function is not applicable to the distribution networks with distribution generations (DGs). When DG provides a fault current in a reverse direction, this method will not be applicable for this condition. In [19,20], fault location methods that take DGs into consideration were proposed. Both methods can eliminate the influence of distorted information on the results, so the methods have high fault tolerance performance. However, the author of Reference [19] only took the case of single fault into consideration when designing the mathematical model of distribution networks; if there are multiple faults at the same time, the mathematical model is not applicable. Meanwhile, the method proposed in Reference [20] is only applicable to the opened-loop distribution networks, when the distribution network is under closed-loop operation, it cannot locate multiple faults occur at the same time. Reference [21] proposed a fault segment location algorithm based on Bayesian estimation which can solve the problem of single fault and multiple faults. It also uses the overcurrent information collected by FTUs, but this method requires high accuracy of information. When the status information is lost, it will output wrong results, so this algorithm does not have good fault tolerance performance. In [22], a fault location method based on Improved Cuckoo Search Algorithm was proposed. The author considered the fault tolerance of fault location and the possible signal loss condition. However, this method cannot detect the nodes with information loss—this will lead to it missing a lot of valuable information. For example, if a piece of equipment often loses information, this indicates that the equipment may need to be repaired. In the above references, each of the methods has some shortcomings.
In this paper, considering all the shortcomings of the methods mentioned above, a novel faulted section location method for distribution network based on status information of fault-indicating equipments is introduced. The five novelties of this method are as follows:
  • The method in this paper is different from others which analyzed electrical quantity. It uses status information of fault-indicating equipment, so it does not need to analyze and calculate any electrical parameters, and it is not affected by the fault type or fault resistance.
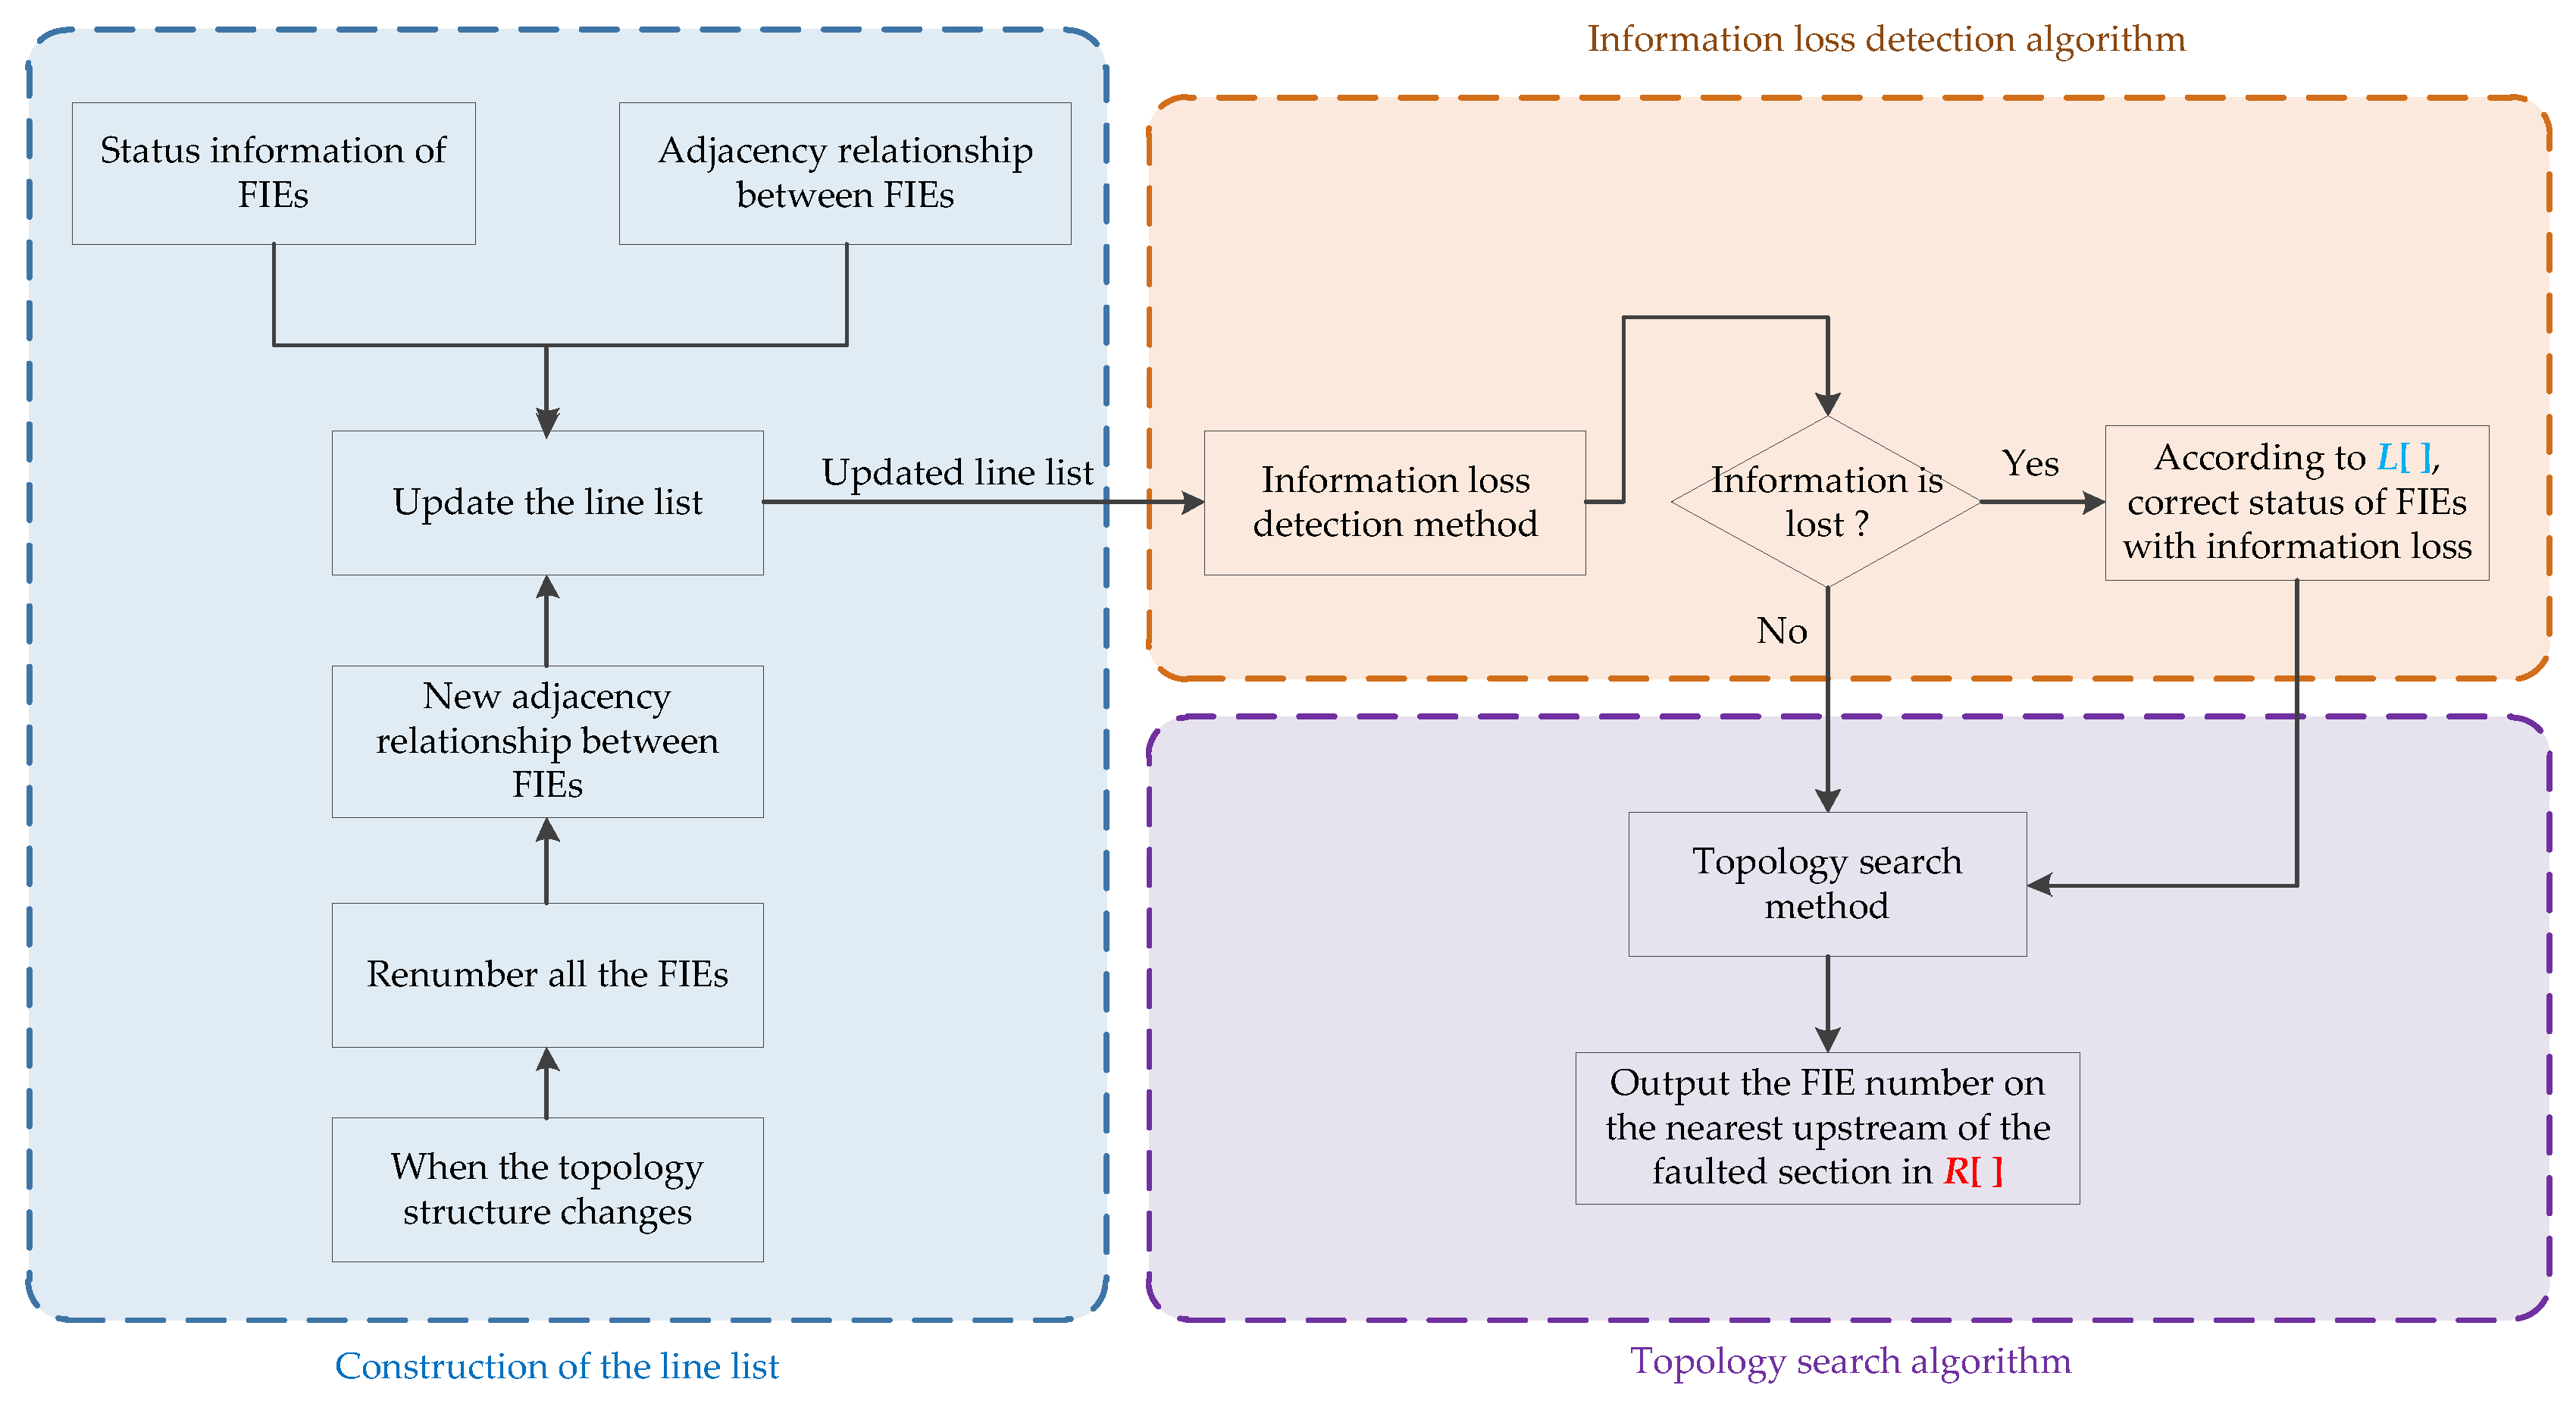
  • A line list is proposed in the method and it can be constructed automatically to represent the topology of the distribution network and status information of fault-indicating equipment. Moreover, it can be updated automatically when the topology of distribution network changes. Therefore, it is suitable for the distribution networks with frequent topology structure changes.
  • A topology search algorithm is proposed in the method to locate the faulted section; it is not only applicable for single fault, but also for multiple faults on different branches. Simulation results indicate that the proposed topology search algorithm is suitable for distribution networks with distributed generations. Therefore, the fault location method in this paper is applicable for solving complex fault conditions in distribution networks.
  • Considering that the loss of information may lead to errors in the line list, an information loss detection algorithm is proposed in the method to detect and correct the wrong status of fault-indicating equipments. It can eliminate the possibility of a local optimal solution for the topology search algorithm in advance, so it greatly improves the accuracy of fault location results.
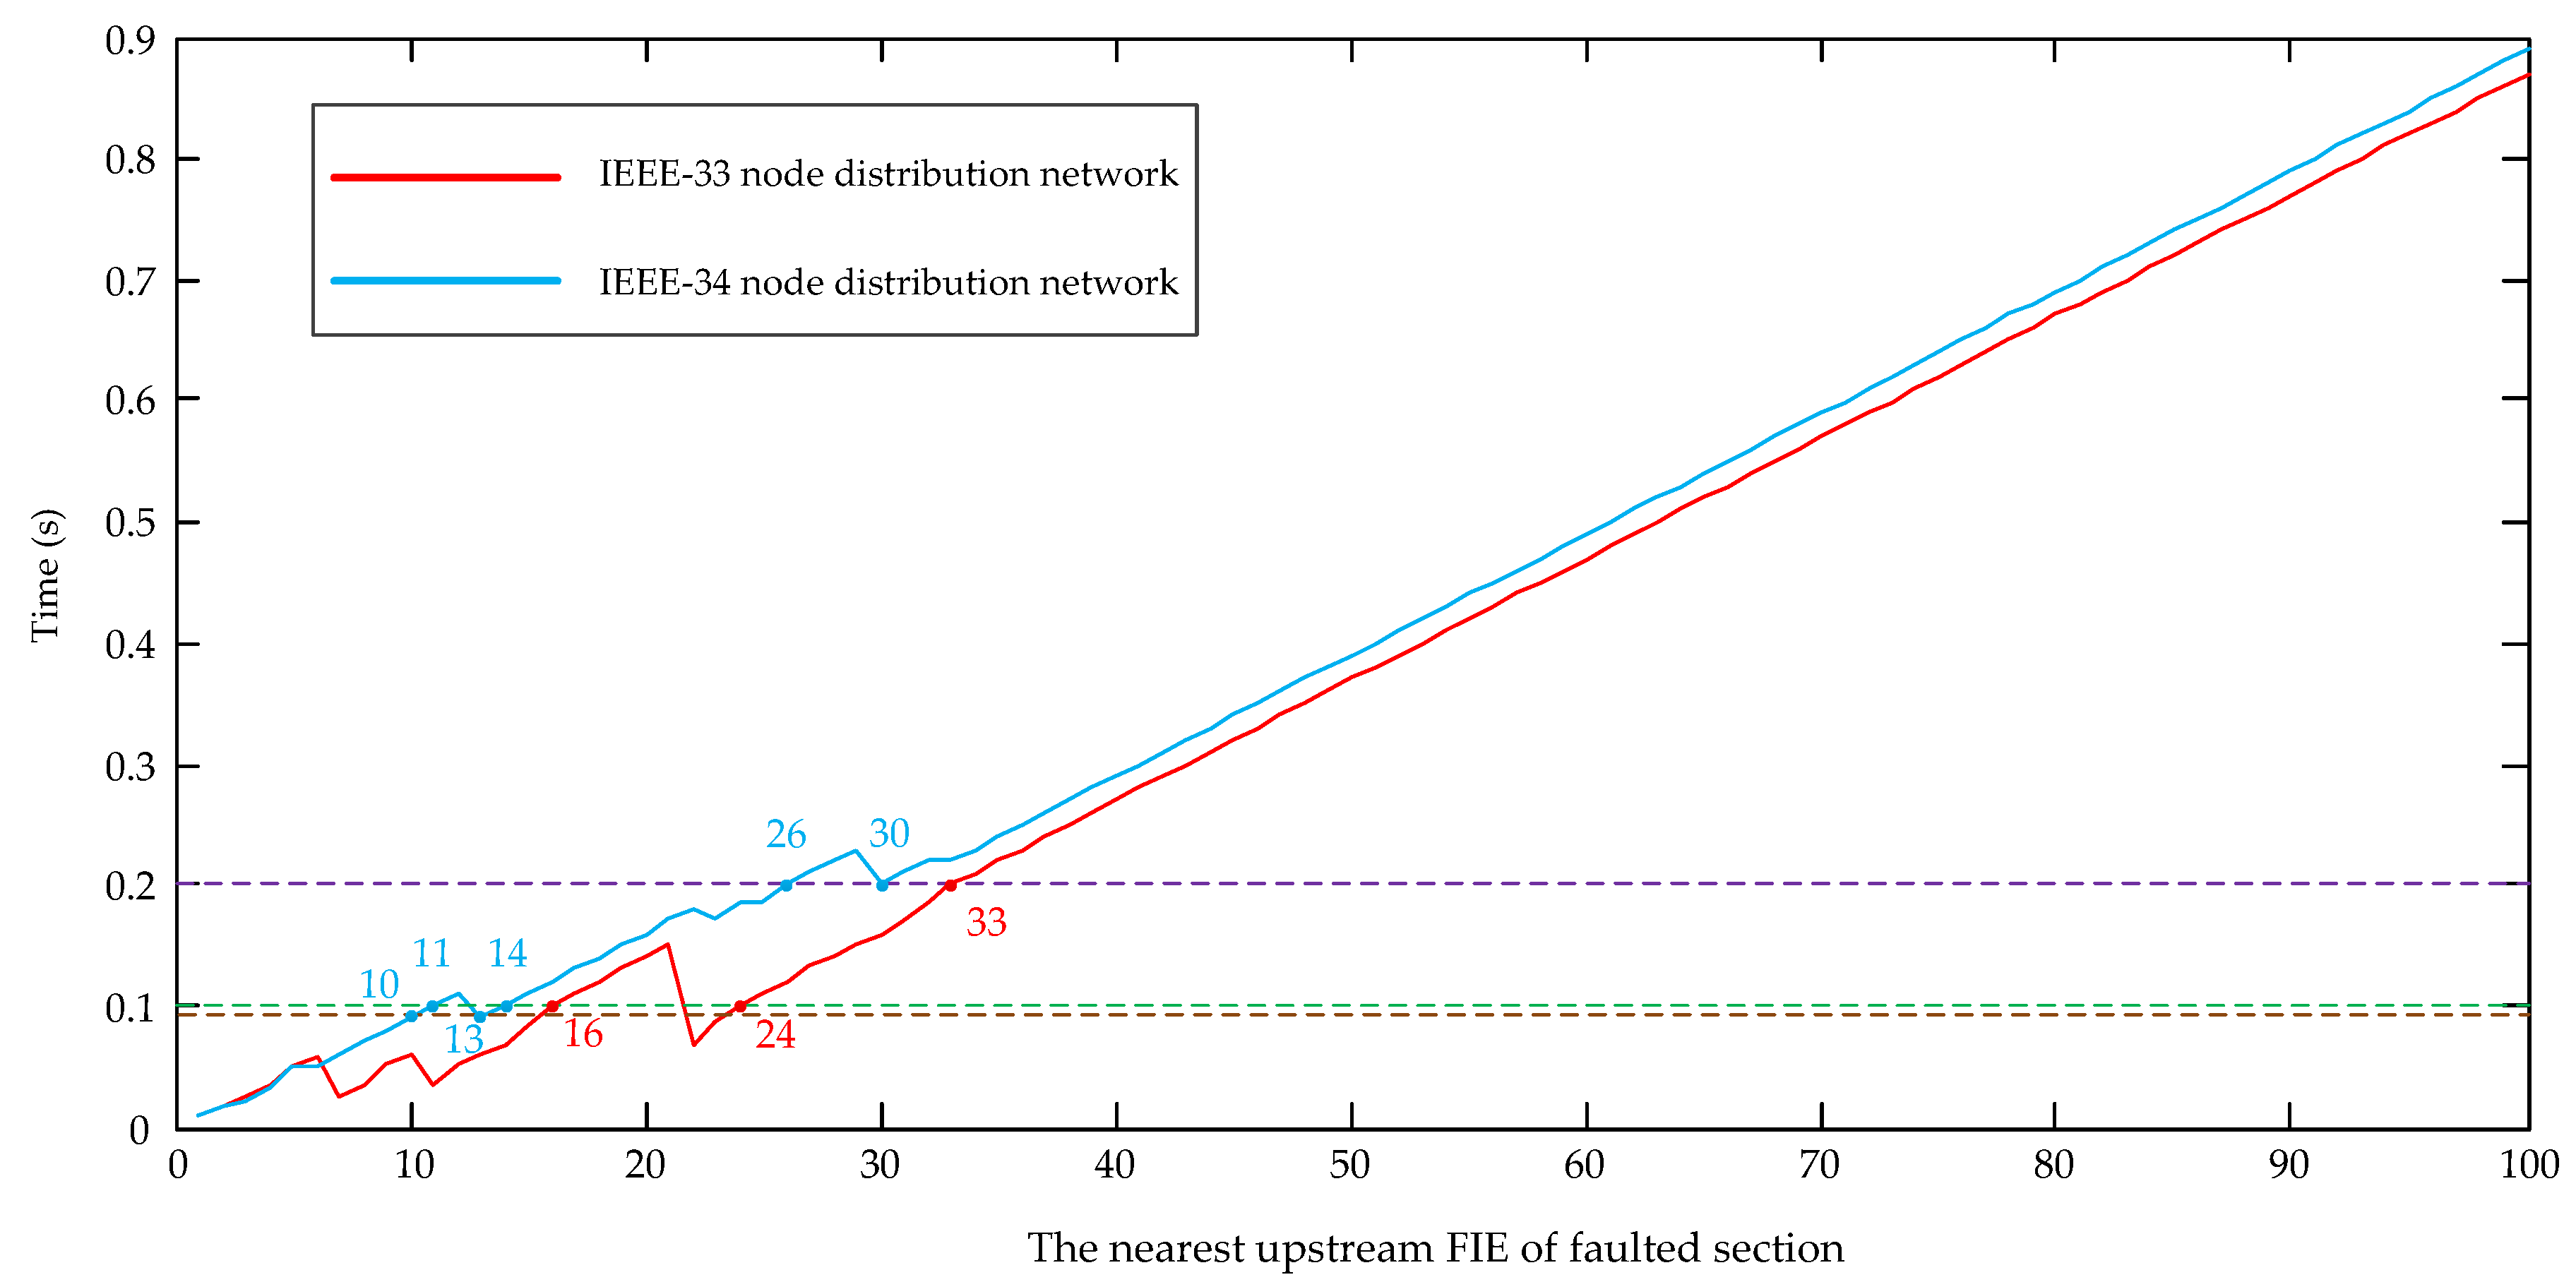
  • Based on amount of simulation results, the proposed fault location method has an advantage that the running time of algorithms does not necessarily increase when the node scale is expanded.
The remainder of this paper is arranged as follows. Section 2.1 defines the status of fault-indicating equipment according to the fault current direction. In order to describe the topology structure of power distribution lines and the status of fault-indicating equipments, a method for constructing the line list is proposed in Section 2.2. Section 3.1 proposes a topology search algorithm to locate the faulted section, which can deal with single fault and multiple faults on different branches well. In Section 3.2, considering the possibility of information loss, an information loss detection method is proposed to correct the line list. In Section 4, different fault conditions are simulated to test the proposed method in the IEEE-33 node distribution network and IEEE-34 node distribution network. In Section 5, the proposed method is compared with other fault location methods in various complex conditions.

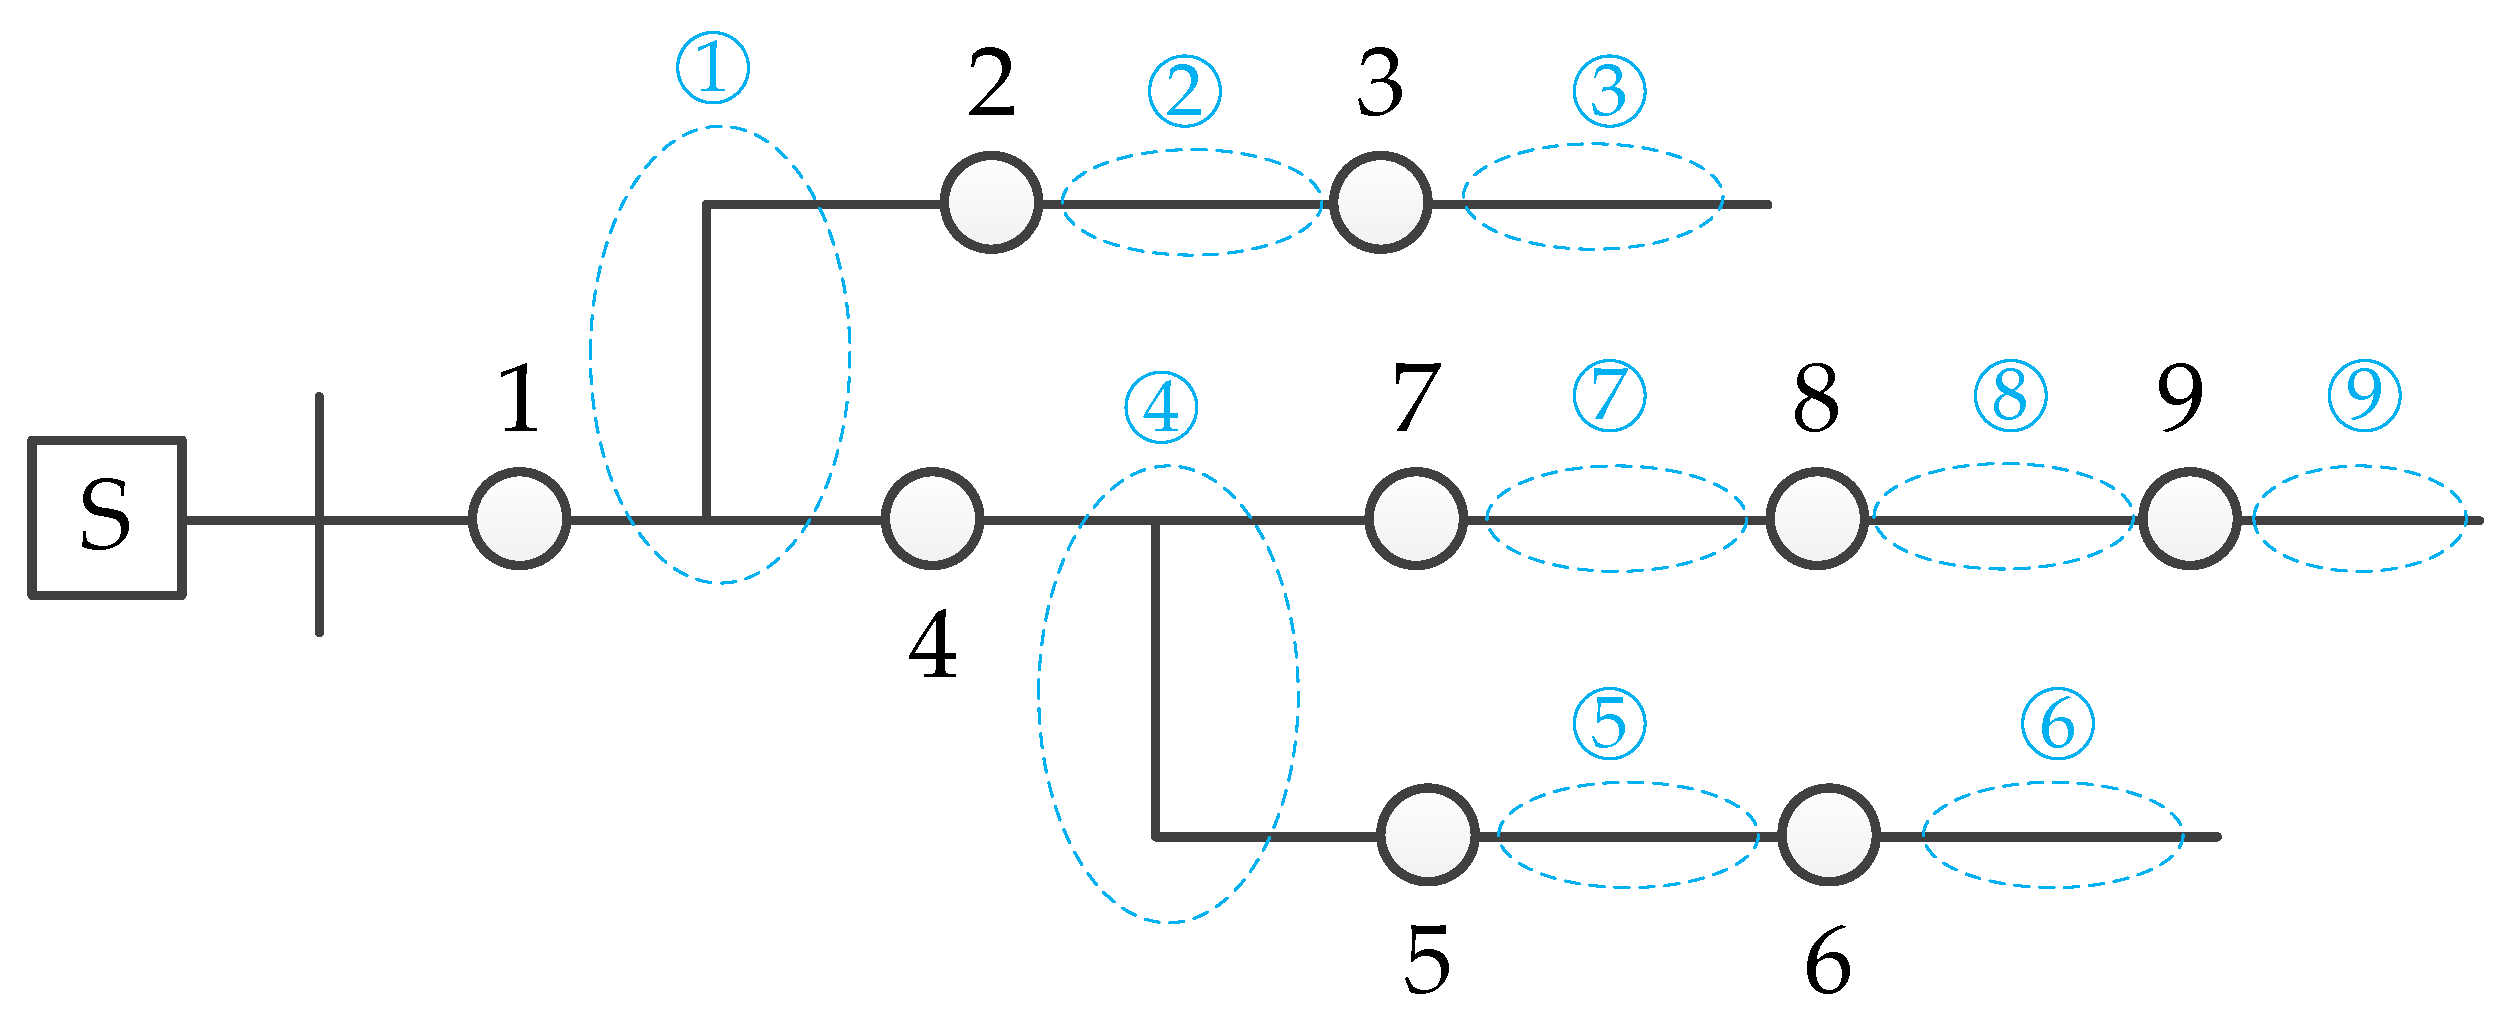
2. Description of Line Topology

In this section, a method to definite the status of fault-indicating equipment and a method for constructing the line list are introduced.

2.1. Definition of Equipment Status

With increasing use of intelligent measuring equipment such as feeder terminal units (FTUs) and fault indicators (FIs), it makes distribution networks more intelligent. Generally speaking, FTUs are installed at switches, and fault indicators are installed on feeders. In this paper, FTUs and fault indicators are collectively referred to as fault-indicating equipment (FIE). When a fault occurs, there will be a fault current flowing from the substation to the fault point. Then, the fault-indicating equipment can collect the overcurrent information and report it to the control center.
S t a t u s = { 1 ,             FIE   is   forward triggered 0 ,                       FIE   is   not   triggered 1 ,           FIE   is   reverse triggered
Additionally, distributed generations will also provide a fault current to the fault point. In order to distinguish the direction of fault current, the positive direction is defined as from the substation to the end of the line. When the fault-indicating equipment detects a fault current flowing from the substation to the fault point, it is forward-triggered, and the status of FIE is defined as “1”. When it detects a fault current flowing in the reverse direction, it is reverse-triggered, and the status is defined as “−1”. When there is no fault current detected, the status is defined as “0”. The three kinds of status can be represented as Equation (1).

2.2. Construction of Line List

For an open-loop power distribution networks with multiple power supplies, it can be divided into many single-power radiation-type distribution networks with the help of regional division theory [23,24].
In this paper, the concepts of “upstream” and “downstream” are used to clearly represent the adjacency relationship between FIEs. Taking a radial distribution network shown in Figure 1 as an example, FIE-2 is closer to the substation than FIE-3, so FIE-2 is on the upstream of FIE-3, and FIE-3 is on the downstream of FIE-2. When there is a branch, FIE-2 and FIE-4 are both on the downstream of FIE-1, and FIE-4 is on the upstream of FIE-5 and FIE-7.
In the topology of a power distribution line, each FIE is regarded as a node to divide the line into sections, then we can locate the faulted section by finding out the nearest equipment’s number at first. For example, if the fault location result indicates FIE-2, it can represent that there is a fault on Section 2. First, we number each FIE in the defined positive direction. Then, through communication among adjacent FIEs, the number of upstream and downstream FIEs can be automatically identified and filled into the line list. In this way, a line list can be constructed automatically to describe the location and status of all fault-indicating equipments in a distribution line. The line list of Figure 1 is shown in Table 1.
In addition, when the topology of a power distribution line changes, we only need to renumber all the FIEs in the line, then through the communication among adjacent FIEs, a new line list will be constructed automatically.

3. Fault Location Method

In this section, a topology search algorithm to locate the faulted section is introduced. Considering information loss will cause errors in the line list, an information loss detection algorithm is proposed to detect and correct the wrong status. Both algorithms have been implemented programmatically in MATLAB, and the flow chart of the fault location method is shown in Figure 2.

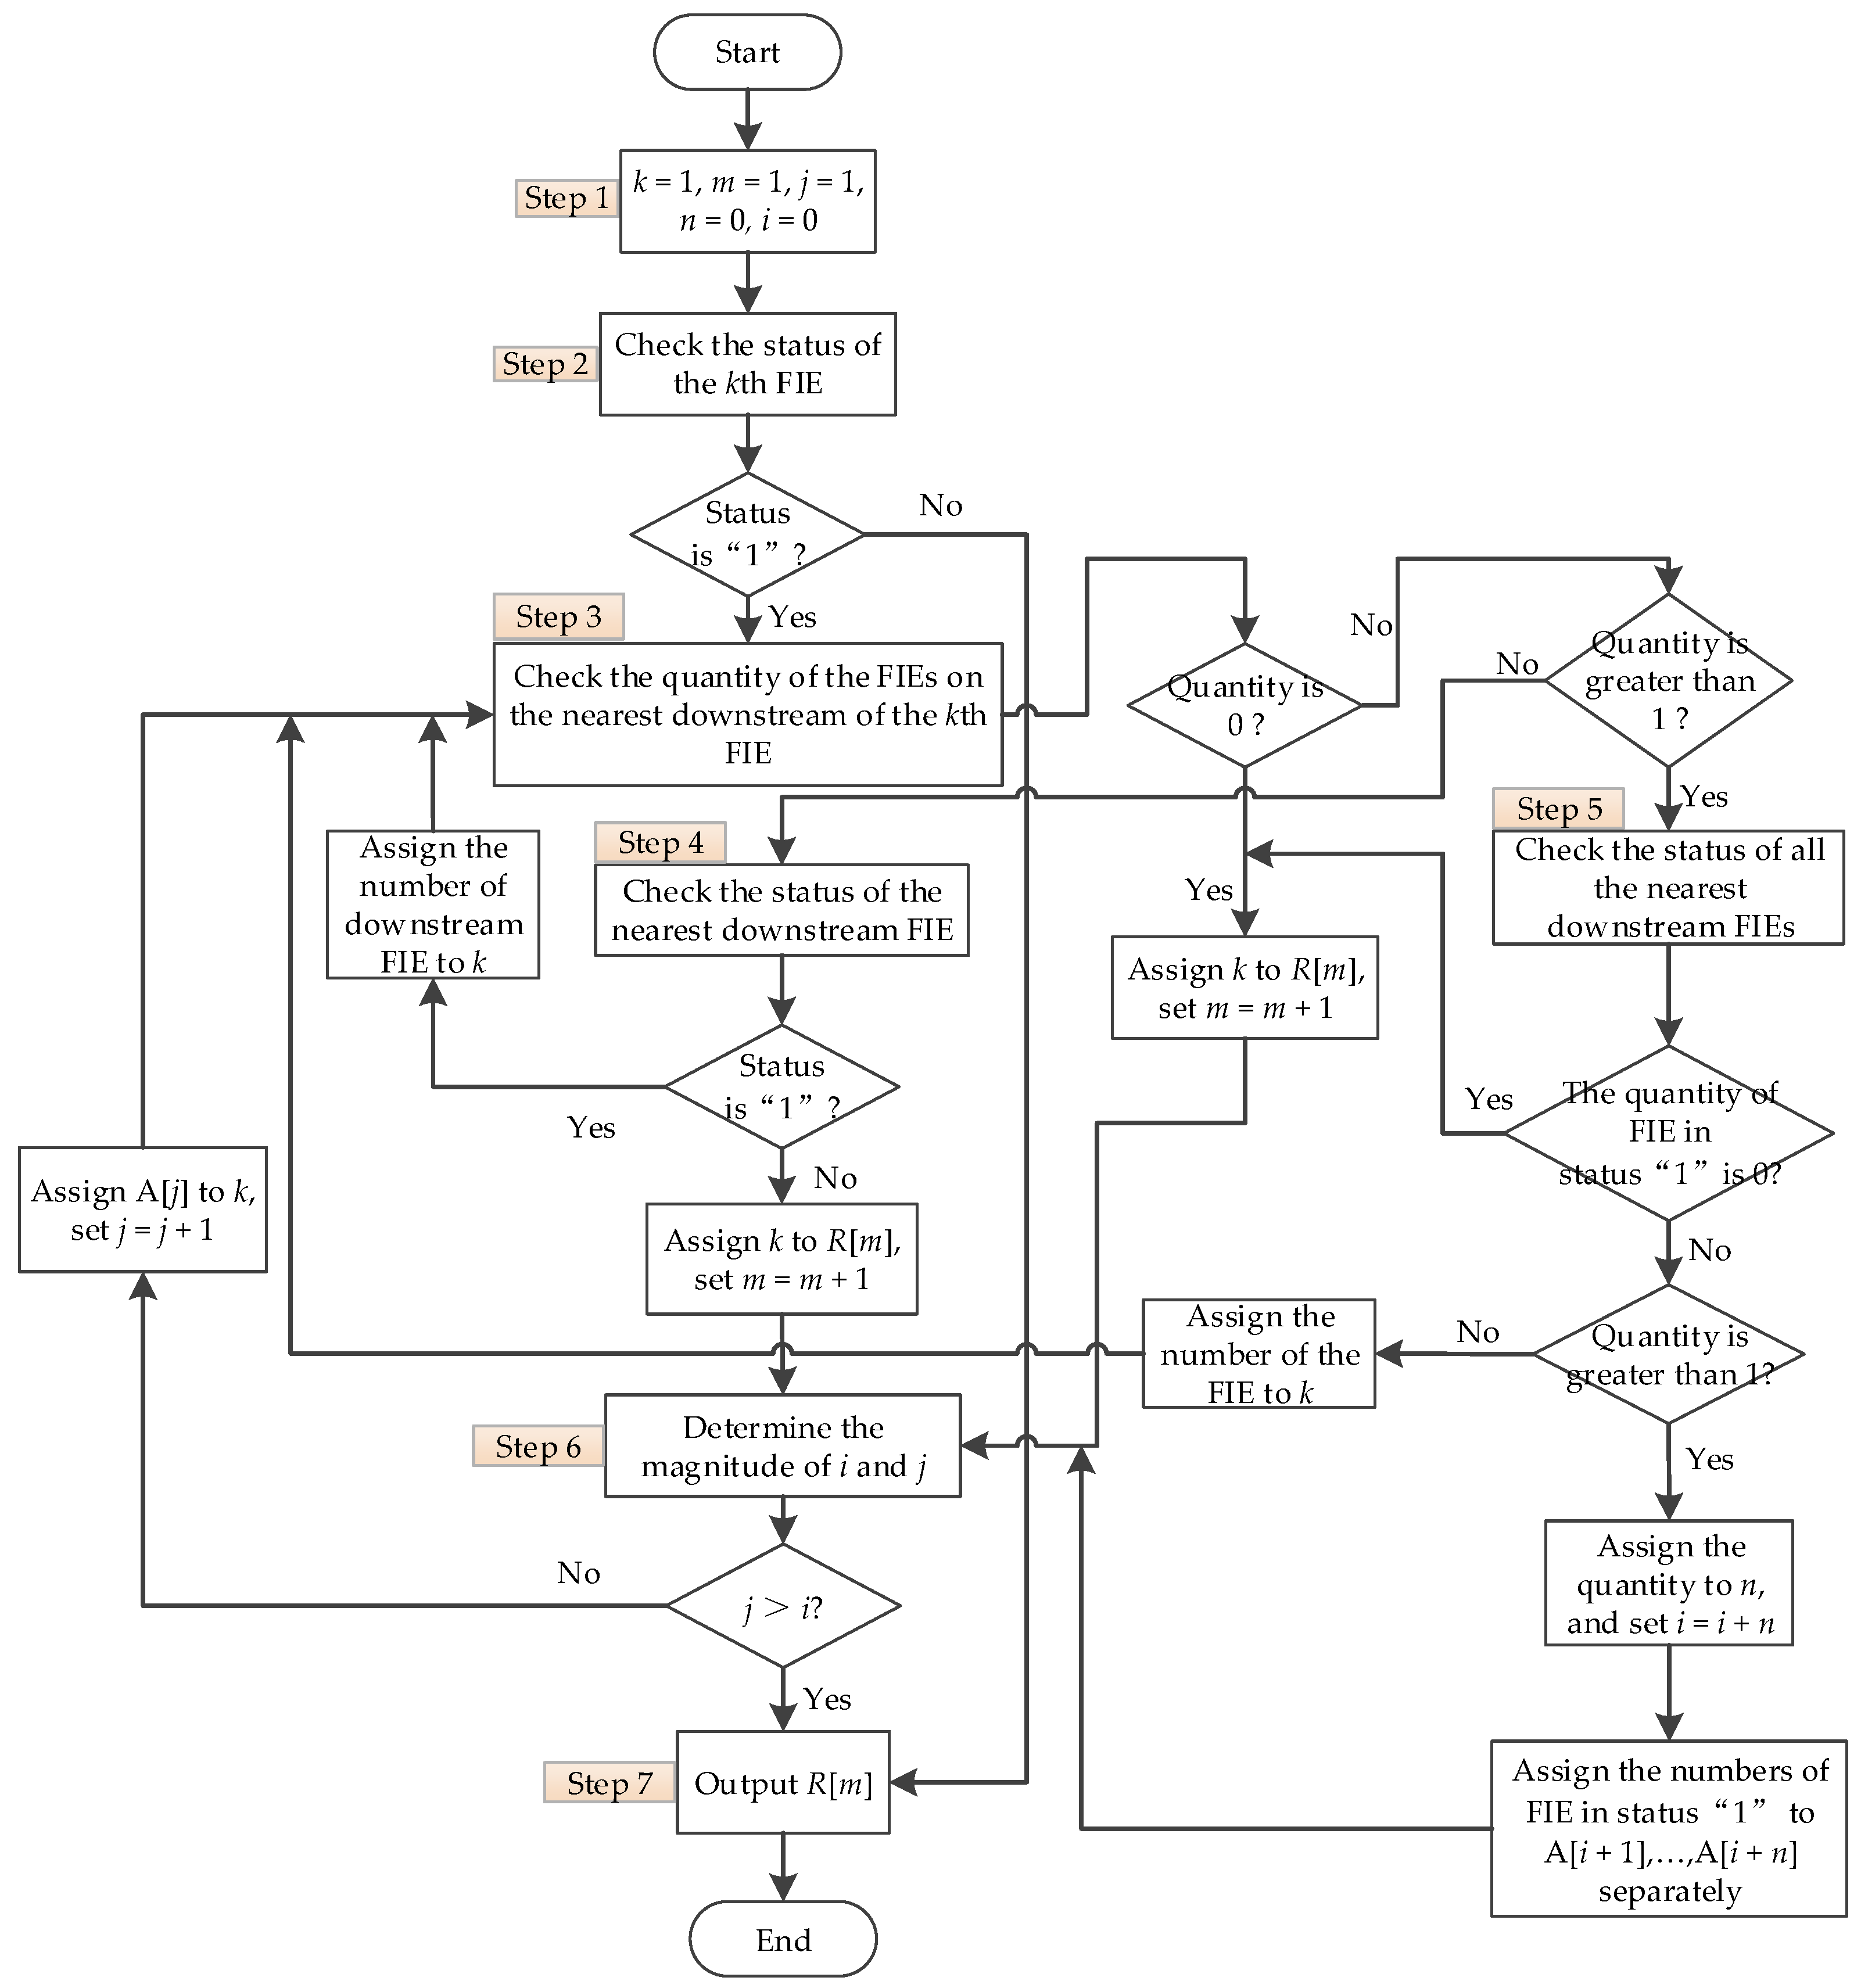
3.1. Topology Search Algorithm

When a fault occurs in the power distribution line, there will be a fault current flowing from the substation to the fault point, then the FIEs between the substation and the fault point will be triggered. Generally speaking, the faulted section is on the nearest downstream of the last triggered FIE. So, if the last triggered fault-indicating equipment is identified, the faulted section can be located. Based on the line list proposed in Section 2.2, a topology search algorithm to find out the last triggered fault-indicating equipment is proposed. This algorithm is not only applicable to single fault, but also to multiple faults on different branches.
In this method, there are five variables: i, j, k, m, n. Variable k represents the equipment number of fault-indicating equipment in the iteration process. Variables j, k, m and n are iteration parameters to record the times of iterations and judgment conditions. Array R[] is used to record the equipment number of the last triggered fault-indicating equipment. Array A[] is used to store the triggered equipment number of a branch during the iteration process.
The procedure for the topology search algorithm is explained in detail in the following steps, and the flow chart of this method is shown in Figure 3.
Step 1
Set the initial values of k, j and m as 1; set the initial values of i and n as 0;
Step 2
Check the status of the kth FIE. If the status is “1”, then continue to the next step; if the status is not “1”, go to step 7;
Step 3
Check the quantity of the FIEs that are on the nearest downstream of the kth FIE. If there is only one equipment, then continue to the next step; if there are more than one piece of equipment, go to step 5; if there is no equipment, assign k to R[m] and set m = m + 1, then go to step 6;
Step 4
Check the status of the nearest downstream equipment. If the status is not “1”, assign k to R[m] and set m = m + 1, then go to step 6; if the status is “1”, then assign the equipment number of the downstream FIE to k and go back to step 3;
Step 5
Check the status of all the nearest downstream FIEs. If the status of all FIEs is not “1”, assign k to R[m] and set m = m + 1, then go to step 6; if the quantity of FIEs in status “1” is greater than 1, assign the quantity of FIEs in status “1” to n, and assign the numbers of them to A[i + 1], …, A[i + n] separately, then set i = i + n, go to step 6; if there is only one FIE in status “1”, assign its number to k and go back to step 3;
Step 6
Determine the magnitude of i and j. If j > i, go to step 7; otherwise, assign A[j] to k and set j = j + 1, then go back to step 3;
Step 7
Stop the iteration and output R[]. Each number in R[] means that there is a fault on the nearest downstream section of the fault-indicating equipment.

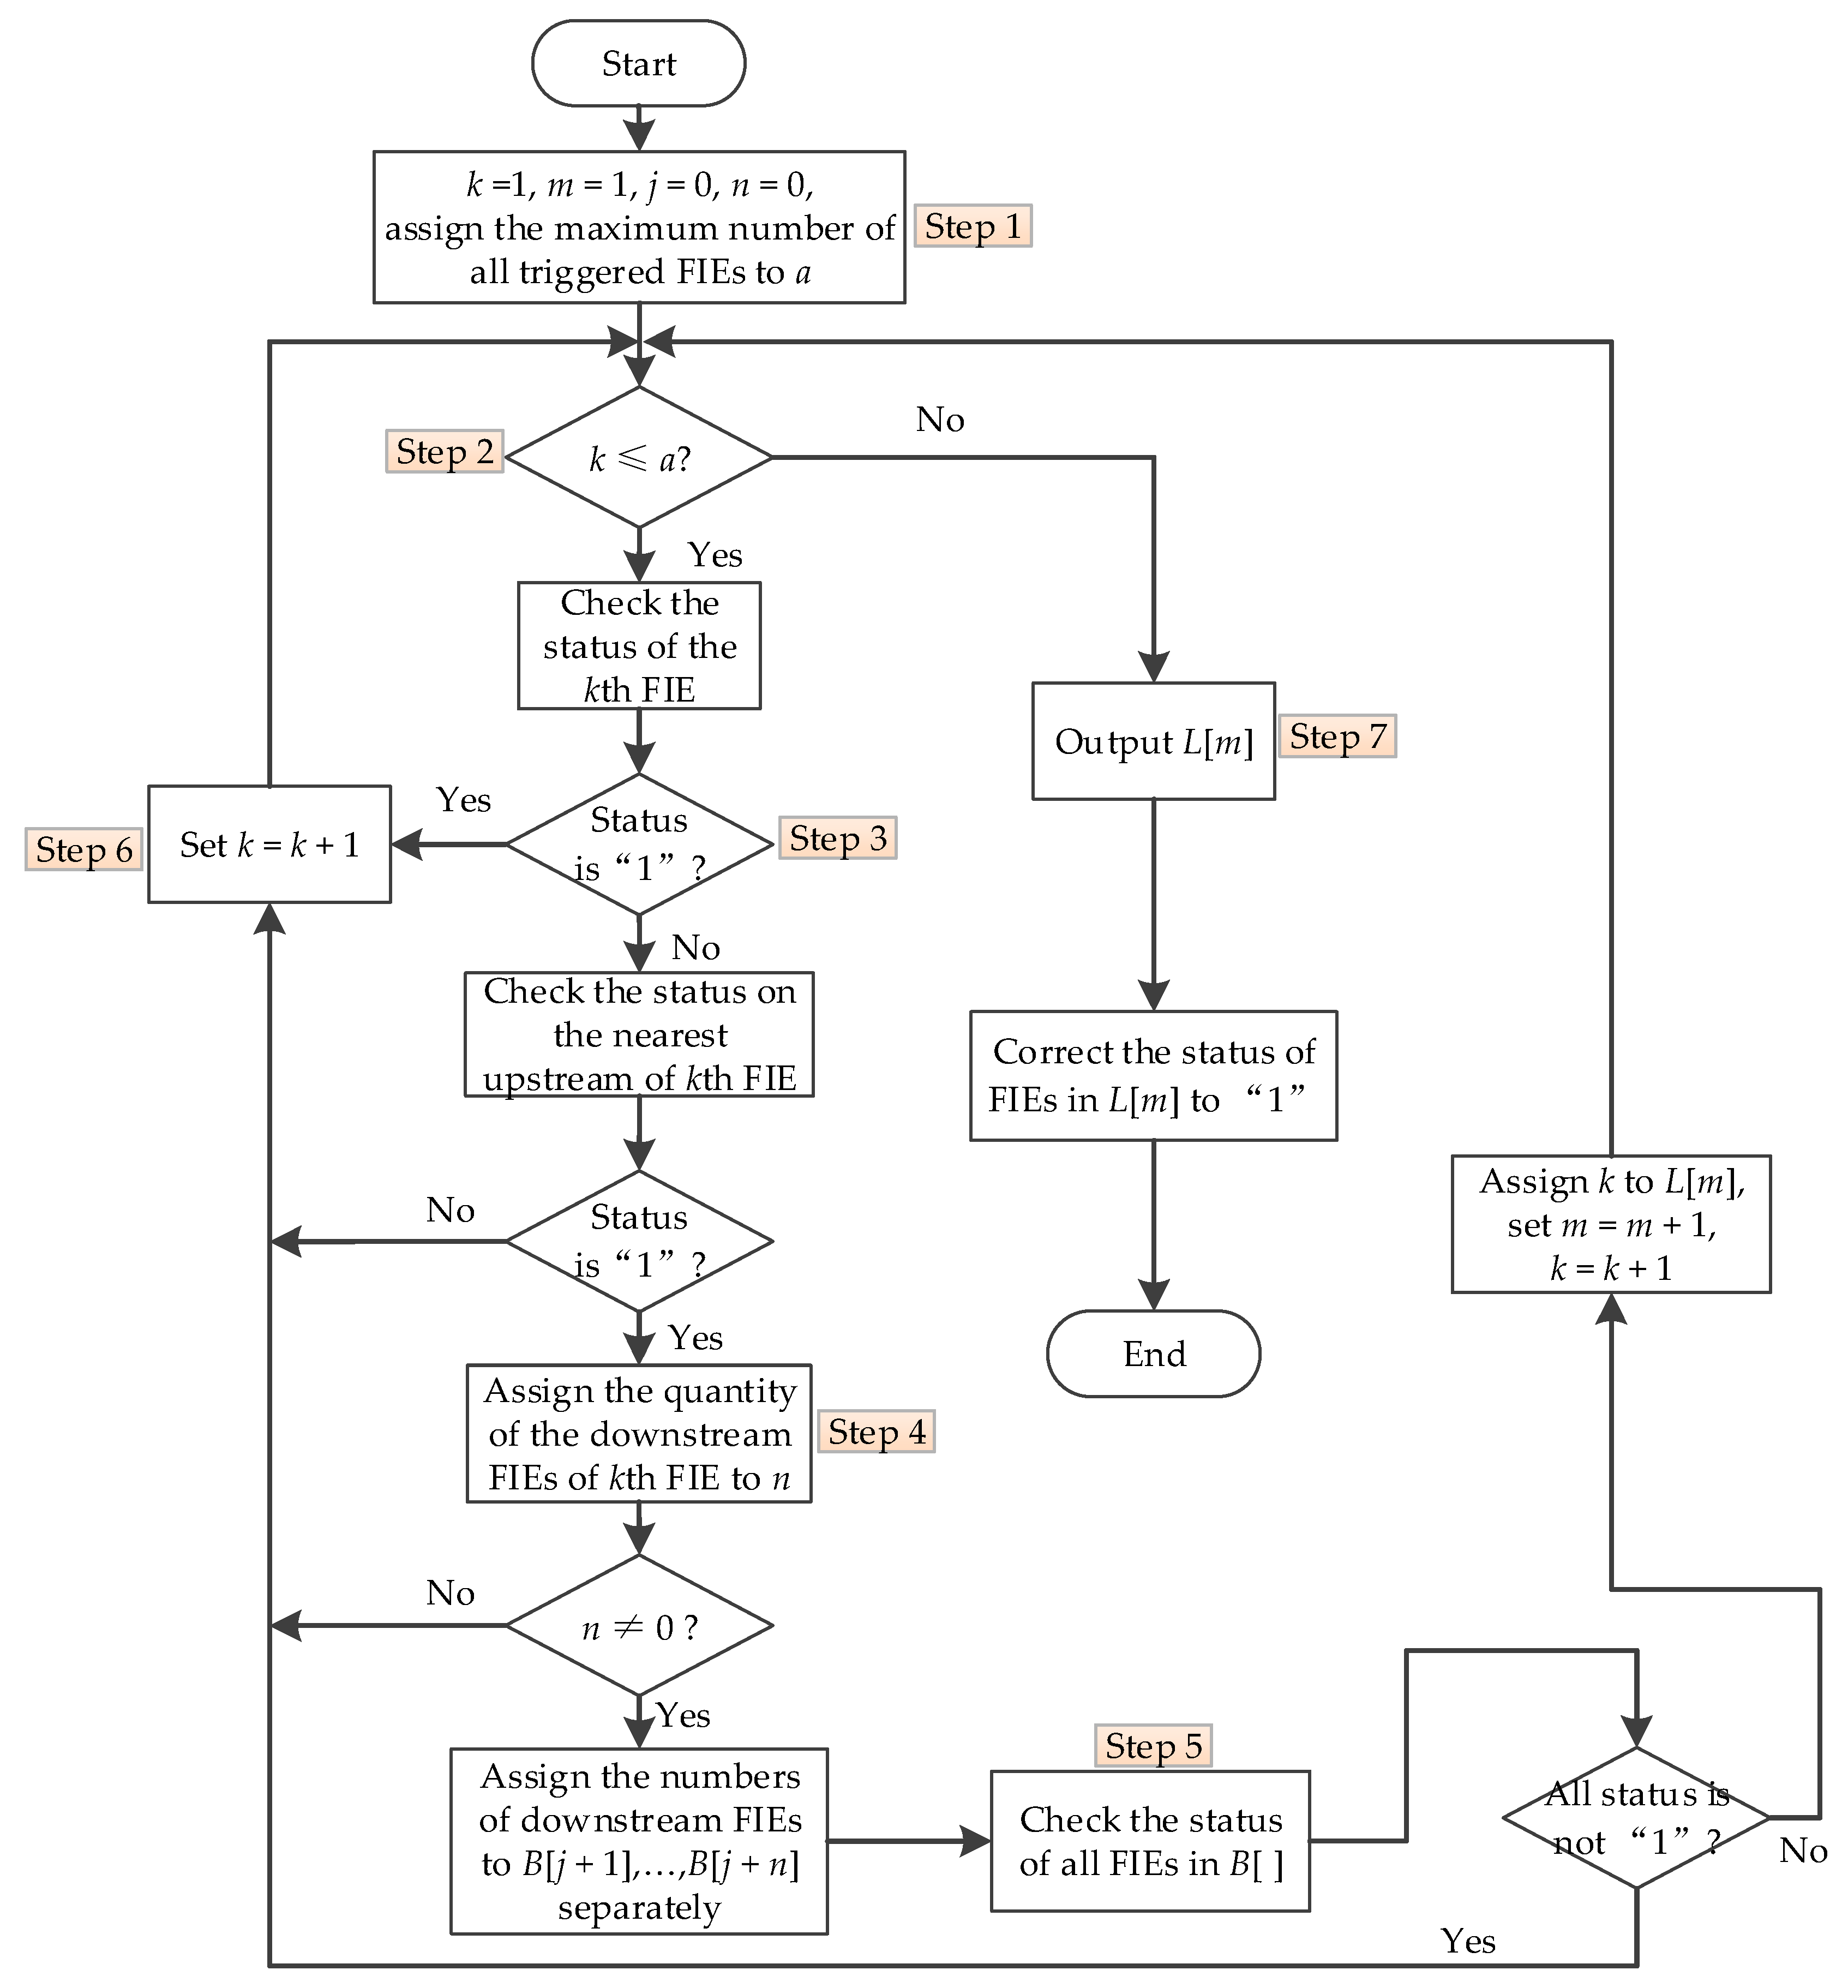
3.2. Information Loss Detection Algorithm

Considering that FTUs and FIs are installed outdoors, information loss often occurs in the process of information collection and transmission. This may cause errors in the line list and lead to a local optimum of the topology search algorithm. Therefore, this section proposes an information loss detection algorithm to detect the FIE with information loss and correct the wrong status in the line list. This can eliminate the possibility of local optimal for the topology search algorithm in advance, so it improves the accuracy of fault location method. Moreover, if a piece of fault-indicating equipment often loses status information, this indicates that the equipment may need to be repaired.
In this method, there are five variables: j, k, m, n, a. Variable k represents the equipment number of fault-indicating equipment in the iteration process. Variable a represents the maximum number of all triggered FIEs. Variables j, m and n are iteration parameters to record the times of iterations and judgment conditions. Array L[] is used to record the equipment number of the FIE with information loss. Array B[] is used to store the equipment number of a branch during iteration process.
The procedure for the information loss detection algorithm is explained in detail in the following steps, and the flow chart of the method is shown in Figure 4.
Step 1
Determine the maximum number of all triggered FIEs in the line list, and assign the value of quantity to a. Set the initial values of k and m as 1; set the initial values of j and n as 0;
Step 2
If ka, check the status of the kth FIE and continue to next step; if k > a, go to step 7;
Step 3
If the status of the kth FIE is “1”, set k = k + 1 and go back to step 2; if the status of the kth FIE is not “1”, check the status of the FIE which is on the nearest upstream of the kth FIE; if the status is “1”, continue to next step; otherwise, go to step 6;
Step 4
Check the quantity of the FIEs that are on the nearest downstream of the kth FIE, and assign the quantity of the FIEs to n. If n ≠ 0, assign the number of the nearest downstream FIE to B[j + 1], …, B[j + n] separately, then go to step 5; if n = 0, go to step 6;
Step 5
Check the status of all the FIE in B[]. If the status of all FIEs is not “1”, continue to next step; if the quantity of FIEs in status “1” is greater than 1 or equal to 1, assign k to L[m], set m = m + 1 and k = k + 1, then go back to step 2;
Step 6
Set k = k + 1, then go back to step 2;
Step 7
Stop the iteration and output L[]. Each equipment number in L[] means that the information of this FIE is lost, then correct the status of this FIE to “1”. If there are no equipment numbers in L[], it means there is no information loss equipment.

4. Simulation Analysis

In this section, different types of simulations are carried out to verify the validity of the proposed fault location method. Considering space limitation, several examples of each fault type tested in the IEEE-33 node distribution network and the IEEE-34 node distribution network are shown in this paper.

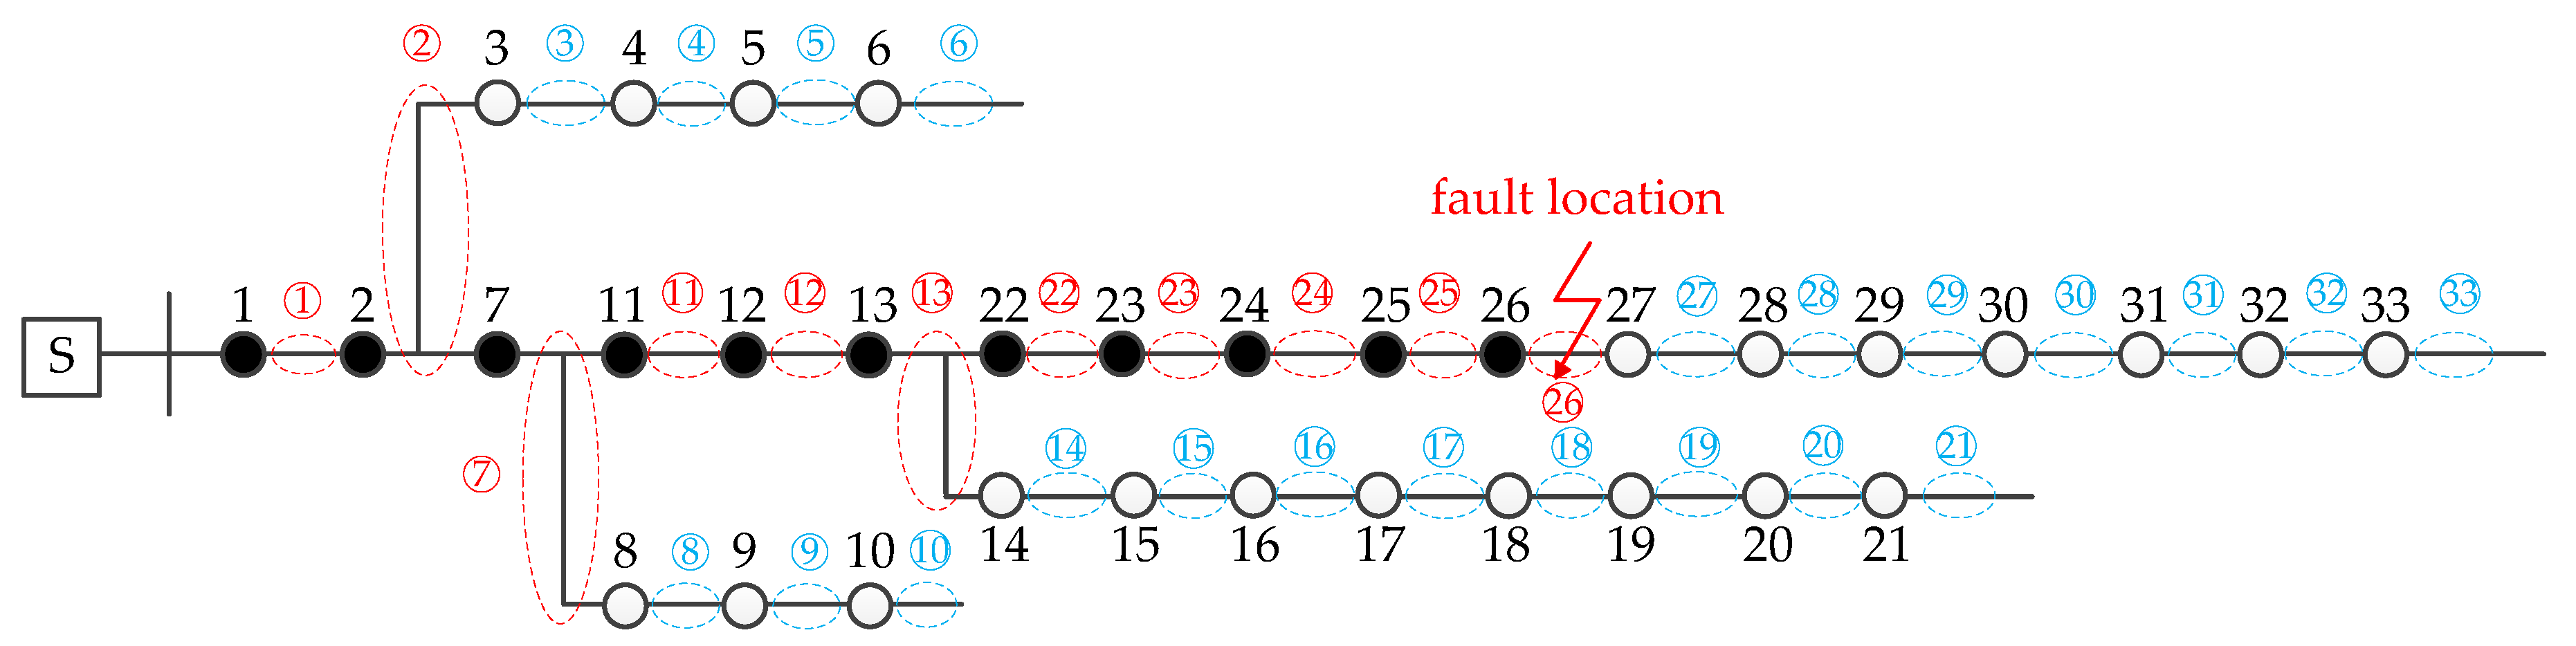
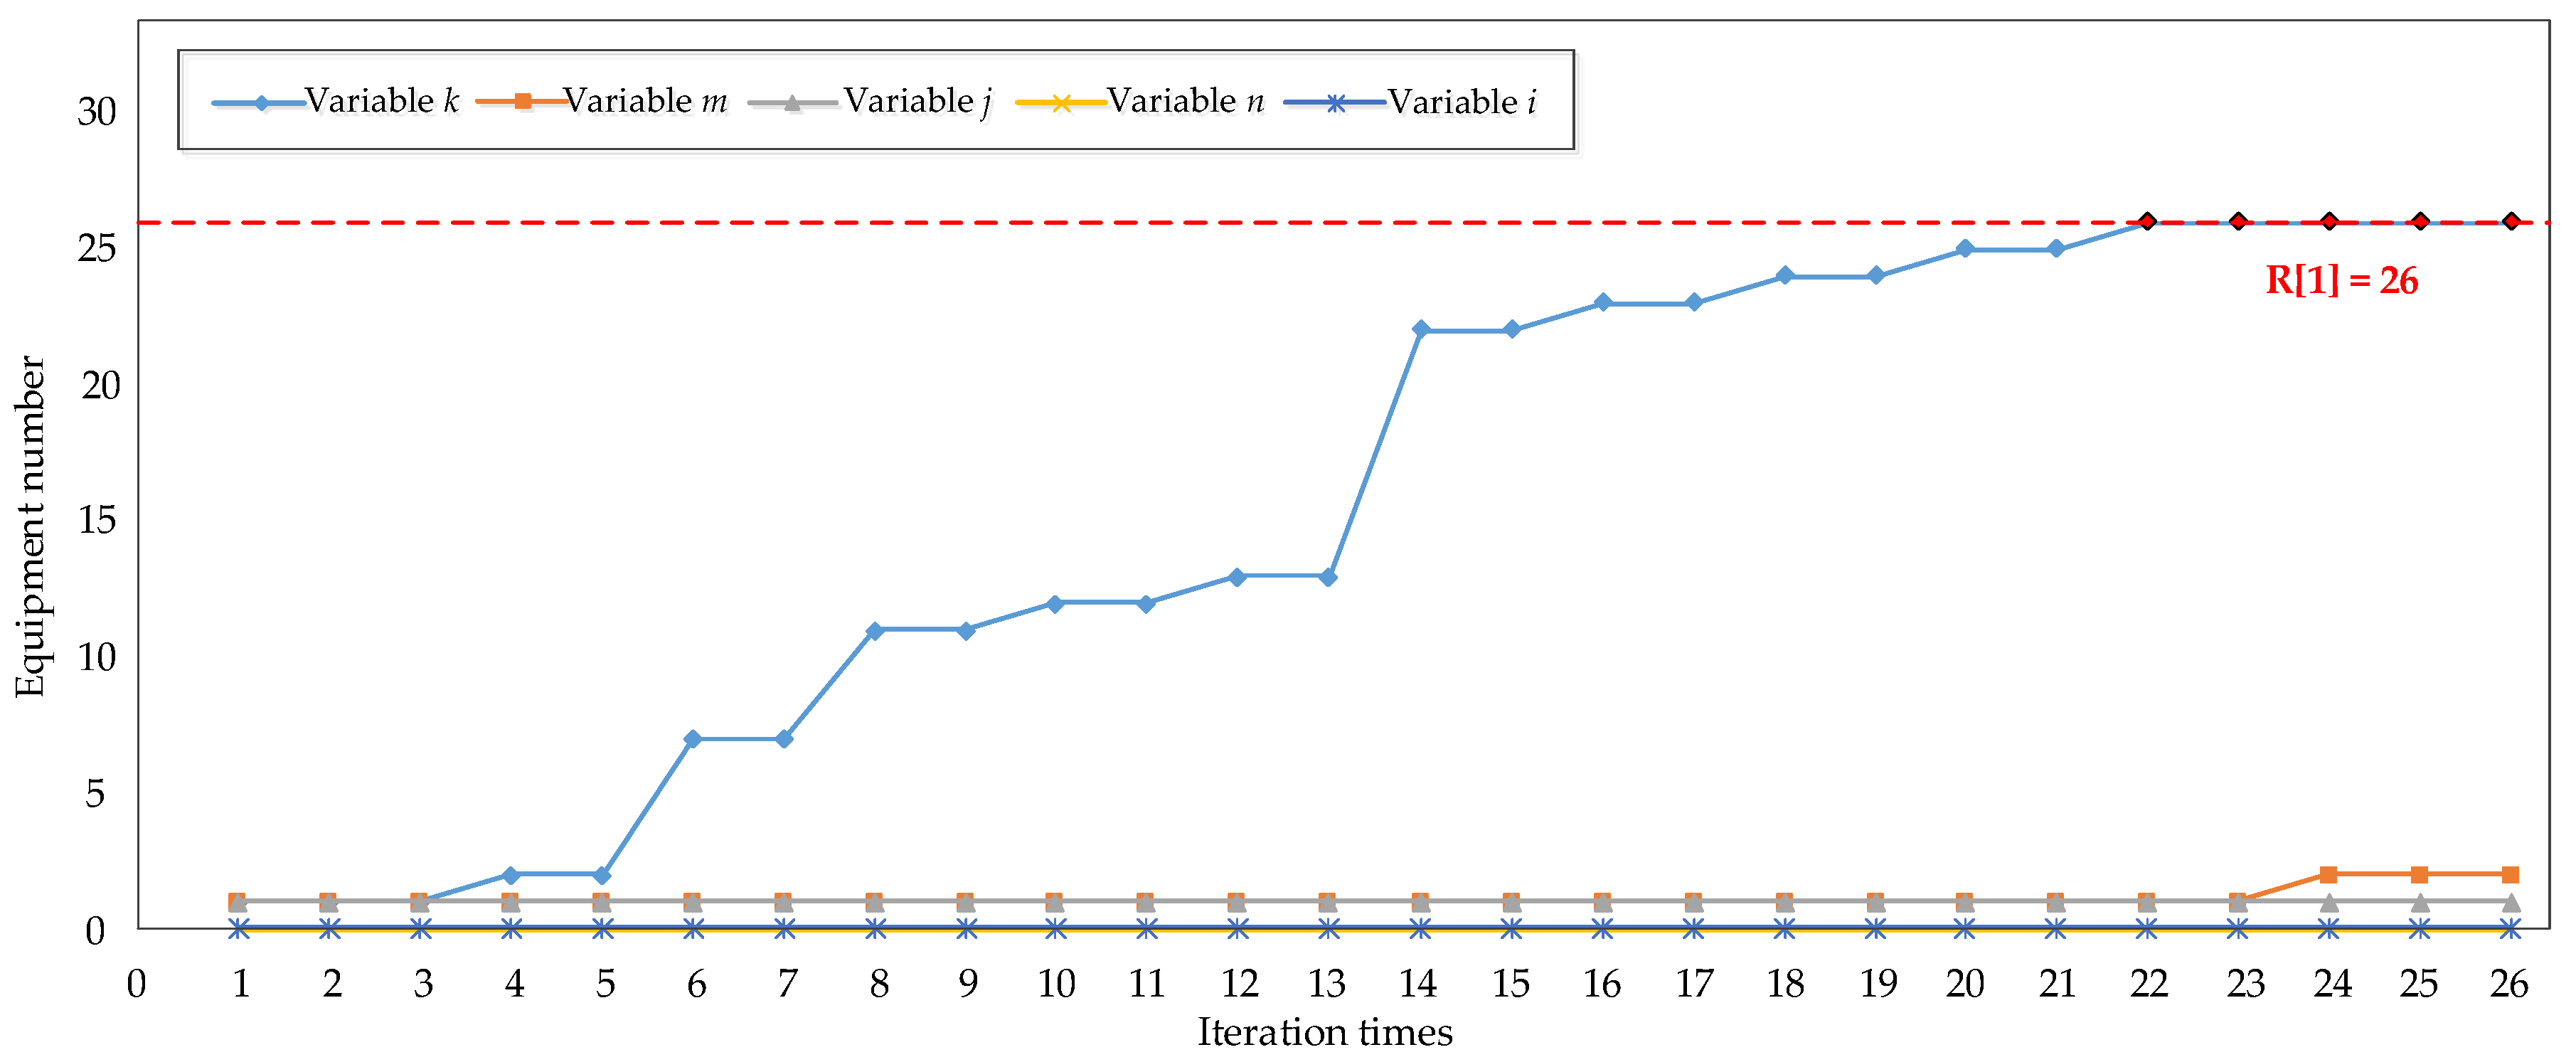
4.1. Test Case 1: Single Fault

In Figure 5, assume that a single fault is on the nearest downstream section of FIE-26 in the IEEE-33 node distribution network. Then, there will be a fault current flowing from the substation to the fault point, and the fault-indicating equipment between the substation and fault point will be forward-triggered—this equipment includes FIE-1, 2, 7, 11, 12, 13, 22, 23, 24, 25, 26. According to the definition of equipment’s status in Section 2.1, the status of triggered FIEs is defined as “1”, and the status of not triggered FIEs is defined as “0”. Then, the line list in this case is shown in Table 2—it will be sent to the topology search algorithm to locate the faulted section.
By applying the topology search algorithm proposed in Section 3.1, the iterative process in MATLAB is shown in Figure 6, and the operation steps of the topology search algorithm and the fault location result are shown in Table 3. It can be seen in Figure 6 and Table 3, the final result array R[1] = 26 correctly indicates that the fault point is on the nearest downstream section of FIE-26, which is consistent with the fault location we set in Figure 5. This proves that the fault location method can effectively locate a single fault.

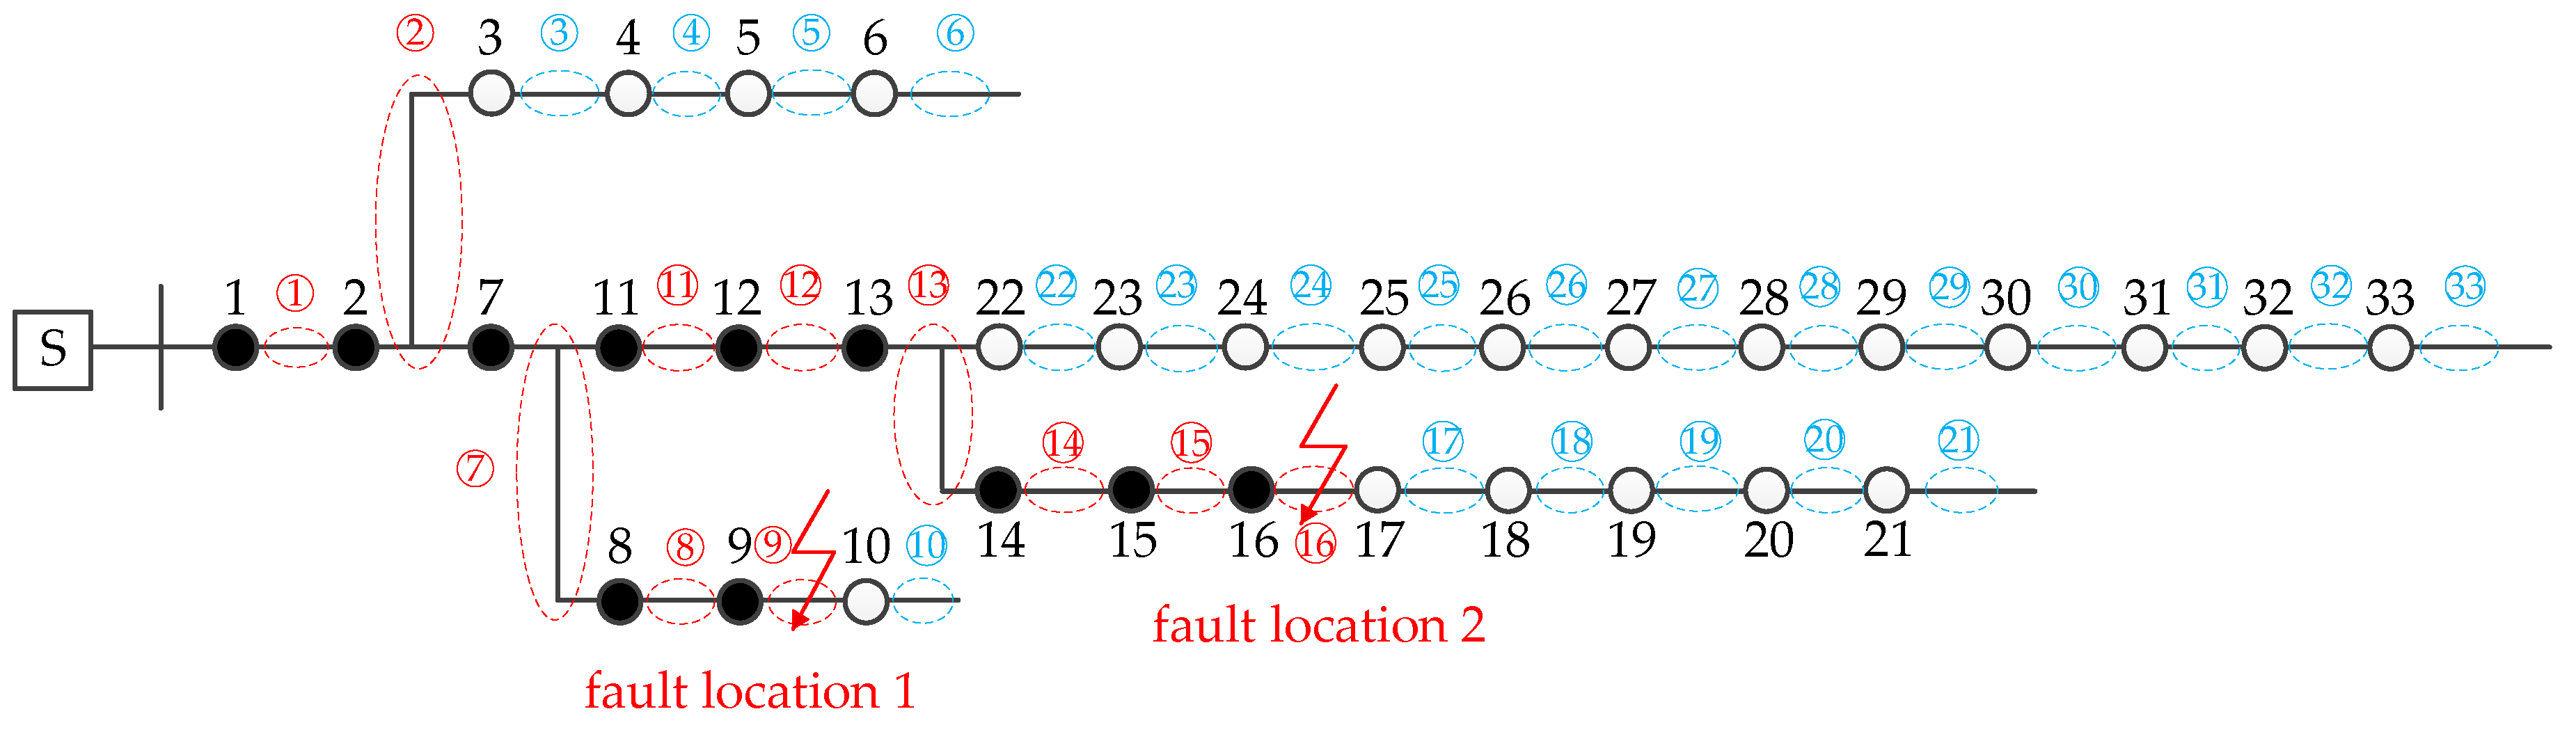
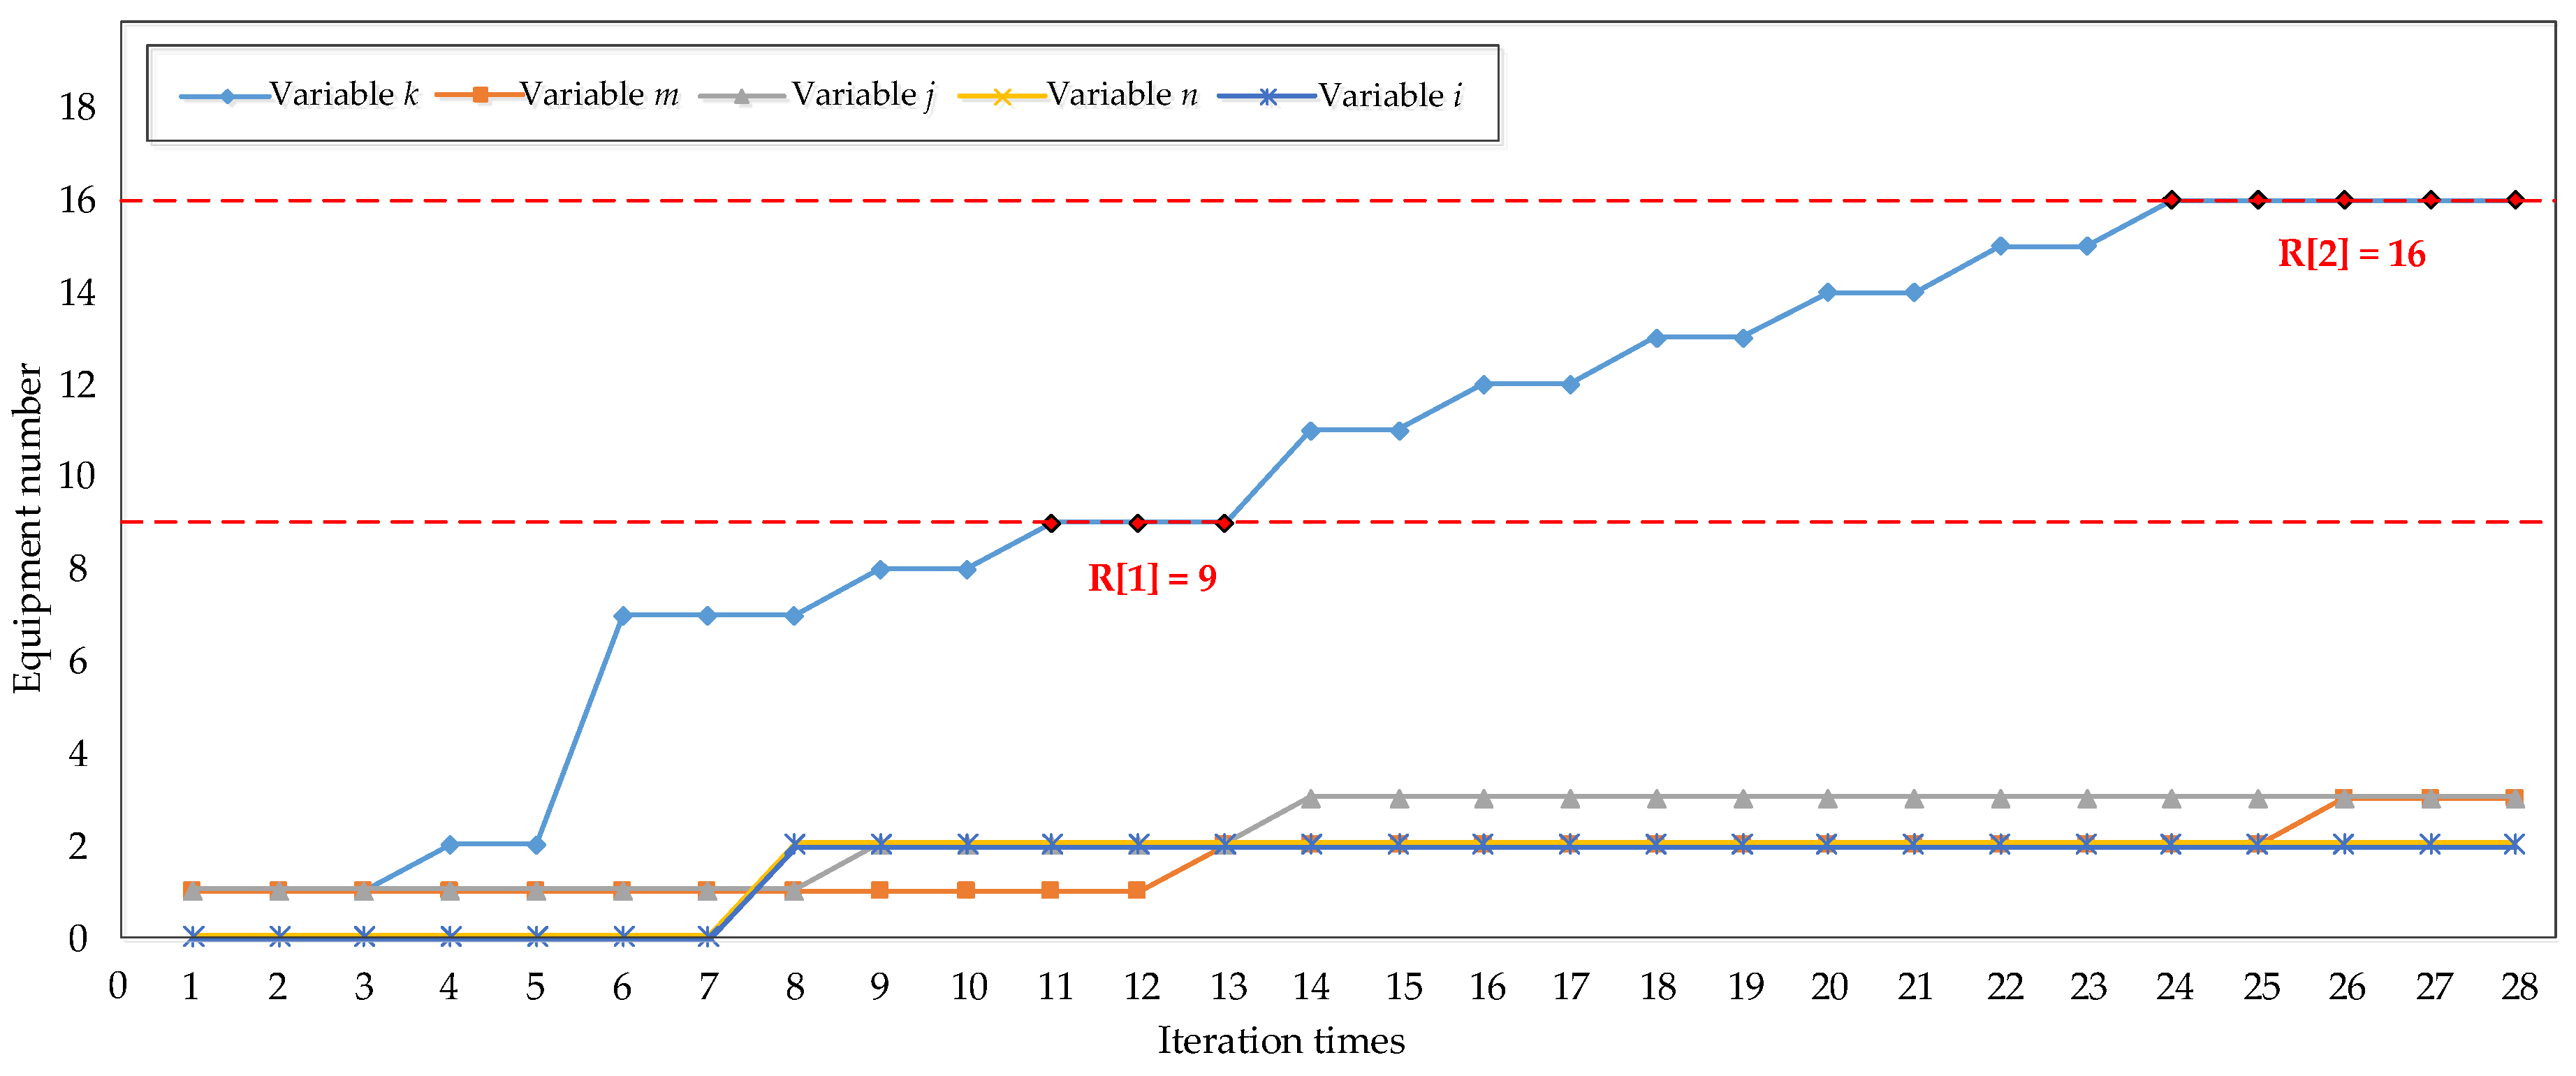
4.2. Test Case 2: Multiple Faults

In Figure 7, there are multiple faults that occur in the distribution network at the same time. Assuming that a fault point is on the nearest downstream section of FIE-9, another fault point is on the nearest downstream section of FIE-16. Then, there will be a fault current flowing from the substation to fault location 1 and another fault current flowing from the substation to fault location 2. Then, the fault-indicating equipment between the substation and fault points will be forward-triggered, including FIE-1, 2, 7, 8, 9, 11, 12, 13, 14, 15, 16. Then, the line list in this case is shown in Table 4—it will be sent to the topology search algorithm to locate the faulted sections.
By applying the algorithm proposed in Section 3.1, the iterative process in MATLAB is shown in Figure 8, and the operation steps of the topology search algorithm and the fault location result are shown in Table 5. The final result array R[1] = 9 correctly indicates that fault location 1 is on the nearest downstream section of FIE-9, and another final result array R[2] = 16 correctly indicates that fault location 2 is on the nearest downstream section of FIE-16, which is consistent with the fault points we set in Figure 7. This proves that the fault location method can effectively locate multiple faults occurring at the same time.

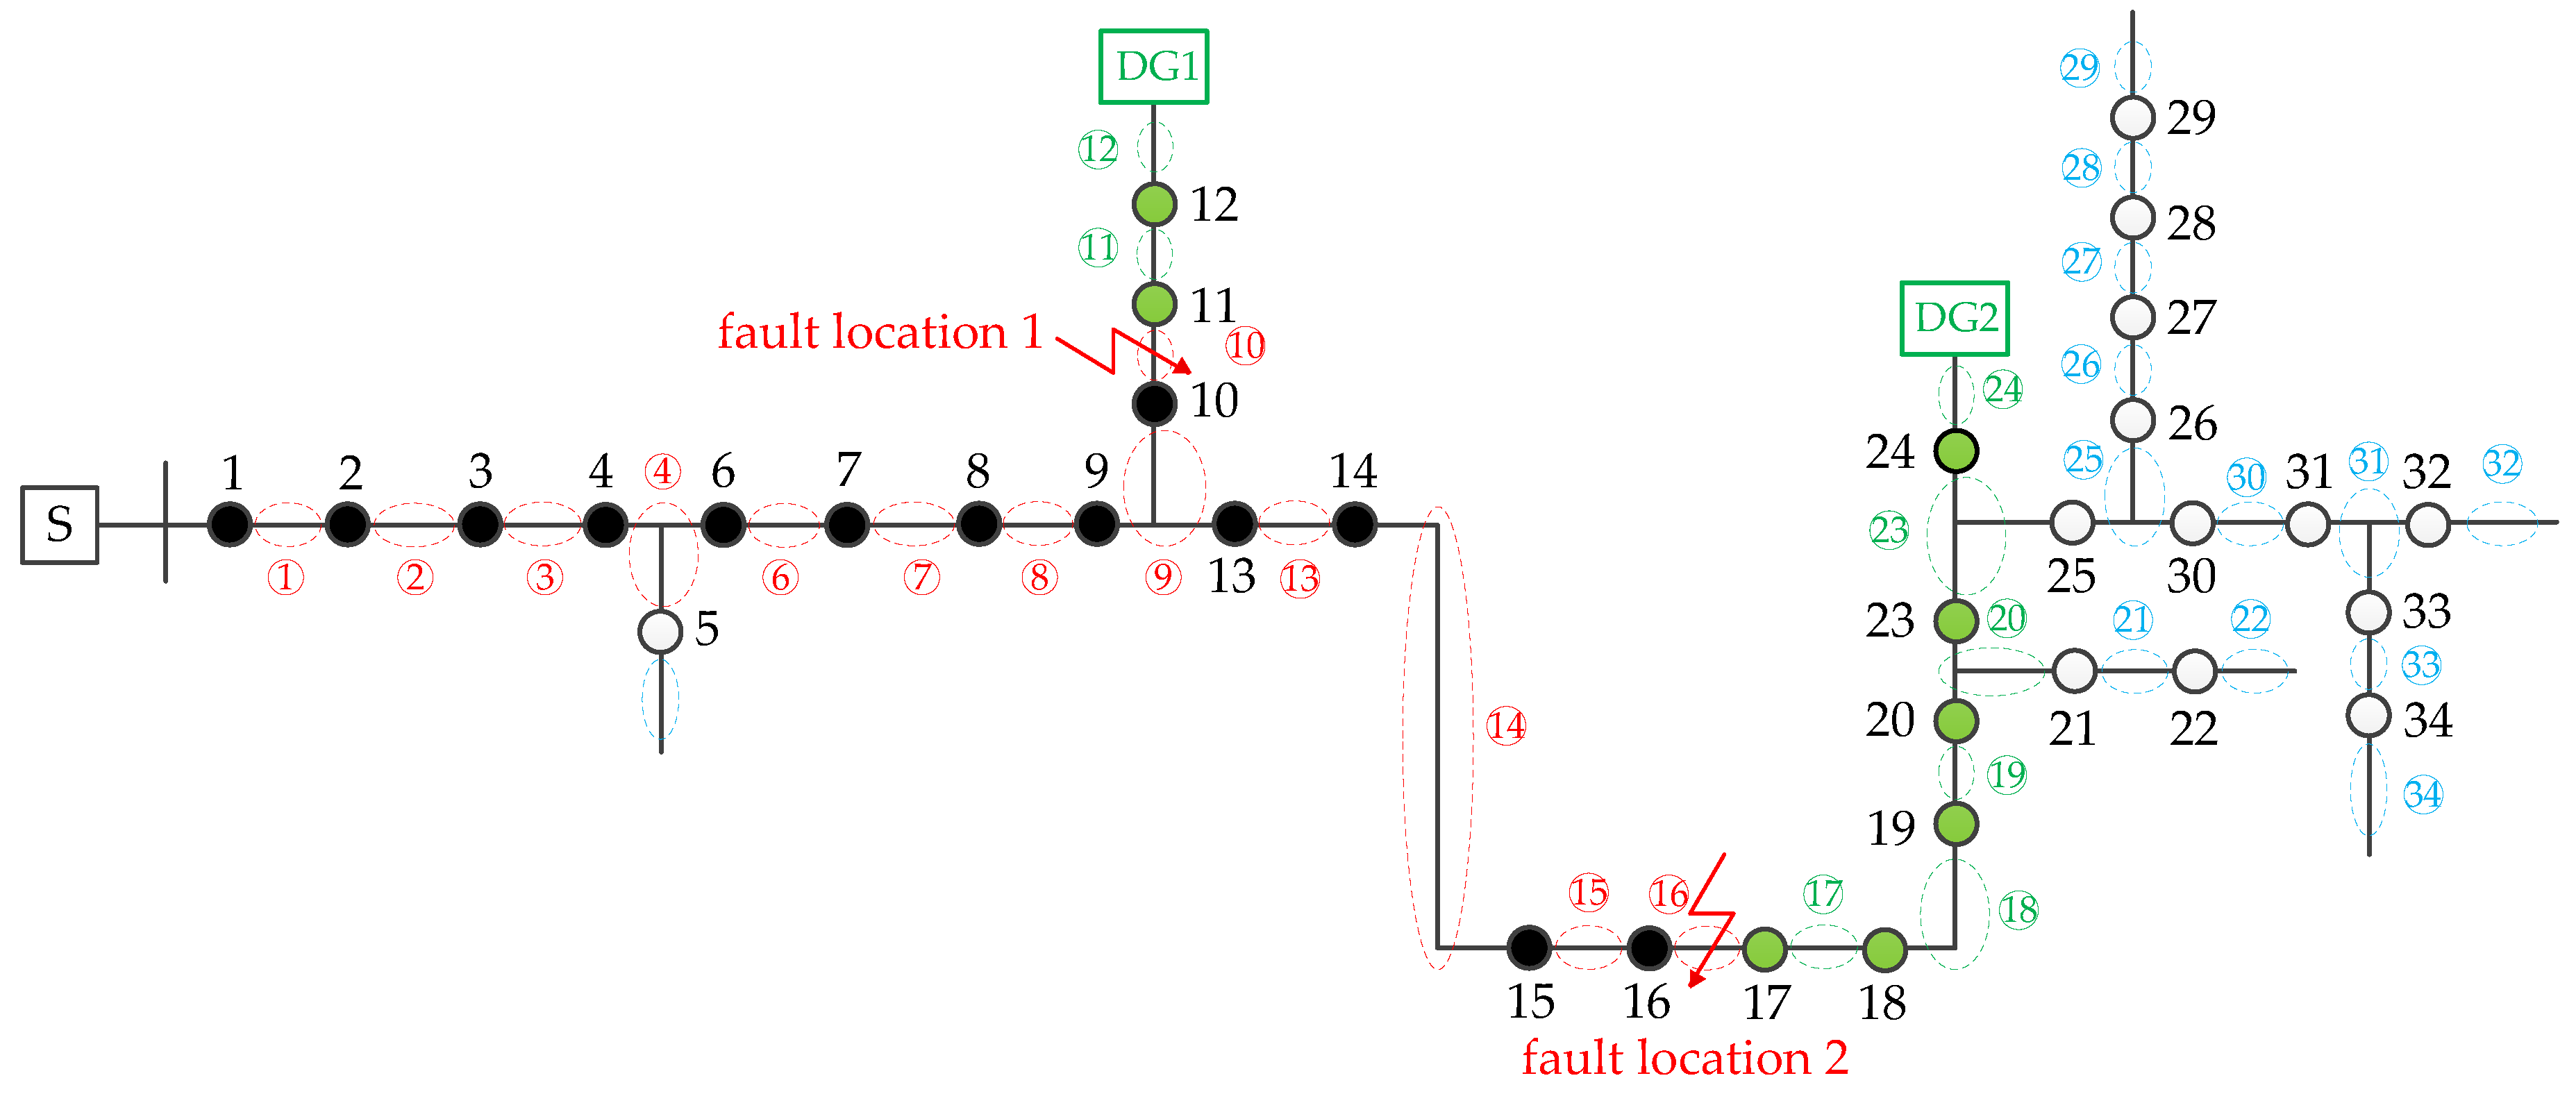
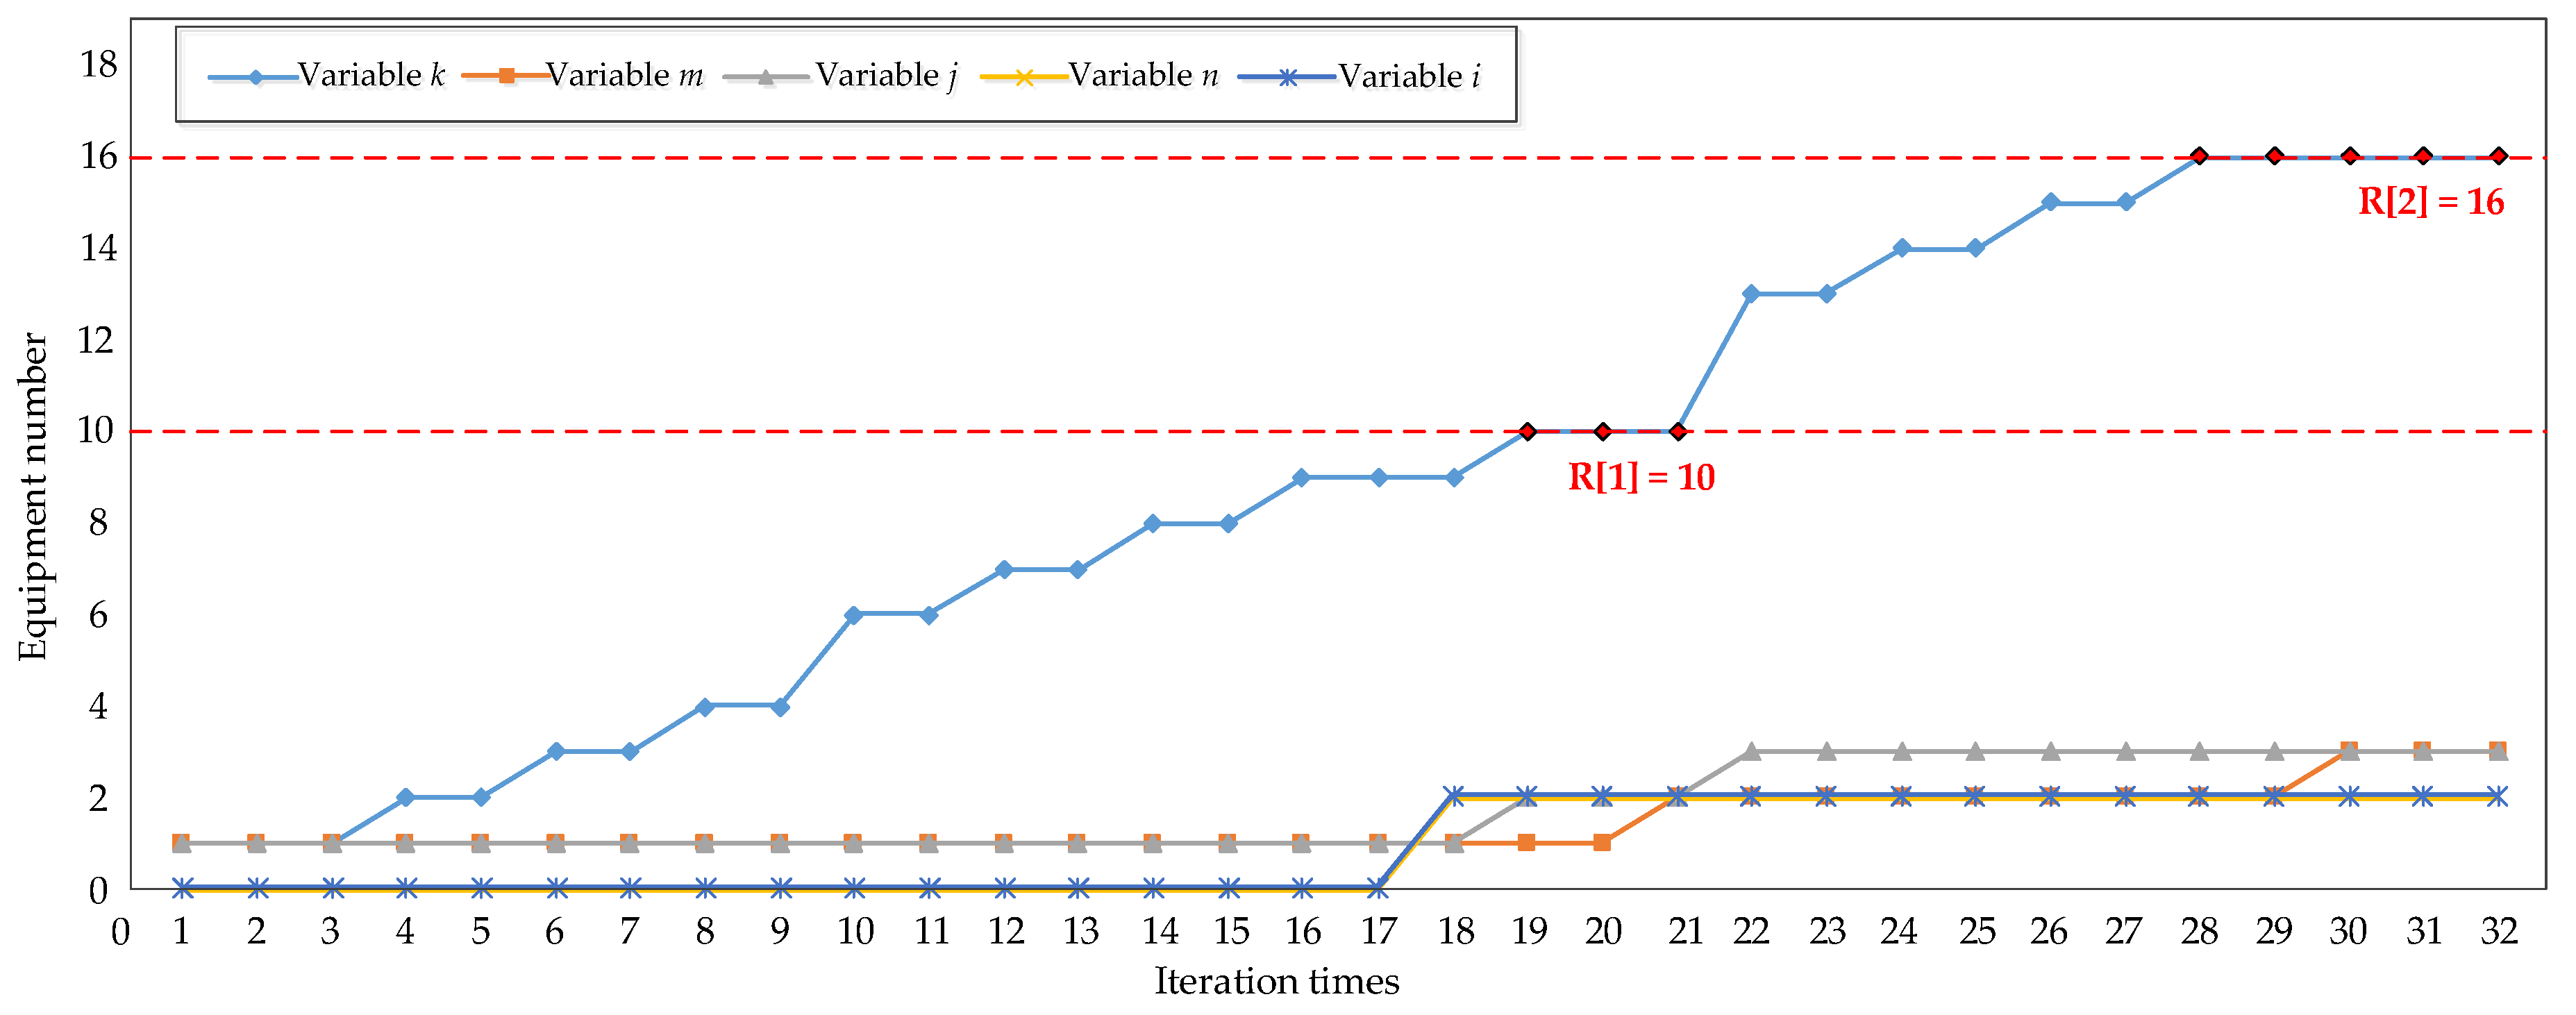
4.3. Test Case 3: DGs in Power Distribution Network

In order to test the performance of the proposed method for the condition of DGs in distribution networks, Figure 9 is an example of the IEEE-34 node distribution network with two distributed generations. Assuming that a fault point is on the nearest downstream section of FIE-10, another fault point is on the nearest downstream section of FIE-16. Then, there will be a fault current flowing from the substation to fault location 1 and another fault current flowing from the substation to fault location 2. Then, the fault-indicating equipment between the substation and fault points will be forward-triggered, including FIE-1, 2, 3, 4, 6, 7, 8, 9, 10, 13, 14, 15, 16, and the status of forward-triggered FIE is defined as “1”.
However, there are two DGs in this distribution network—they will also provide a fault current to the fault points, which will cause the FIEs between DGs and the fault points to be reverse-triggered, namely FIE-11, 12, 17, 18, 19, 20, 23, 24, and the status of reverse-triggered FIEs is defined as “−1”. Then, the line list in this case is shown in Table 6.
The iterative process in MATLAB is shown in Figure 10, and the operation steps of the topology search algorithm and the fault location result are shown in Table 7. The final result array R[1] = 10 correctly indicates that fault location 1 is on the nearest downstream section of FIE-10, and another final result array R[2] = 16 correctly indicates that fault location 2 is on the nearest downstream section of FIE-16, which is consistent with the fault points we set in Figure 9. This proves that the proposed fault location method can also correctly locate multiple fault points when there are DGs in distribution networks.

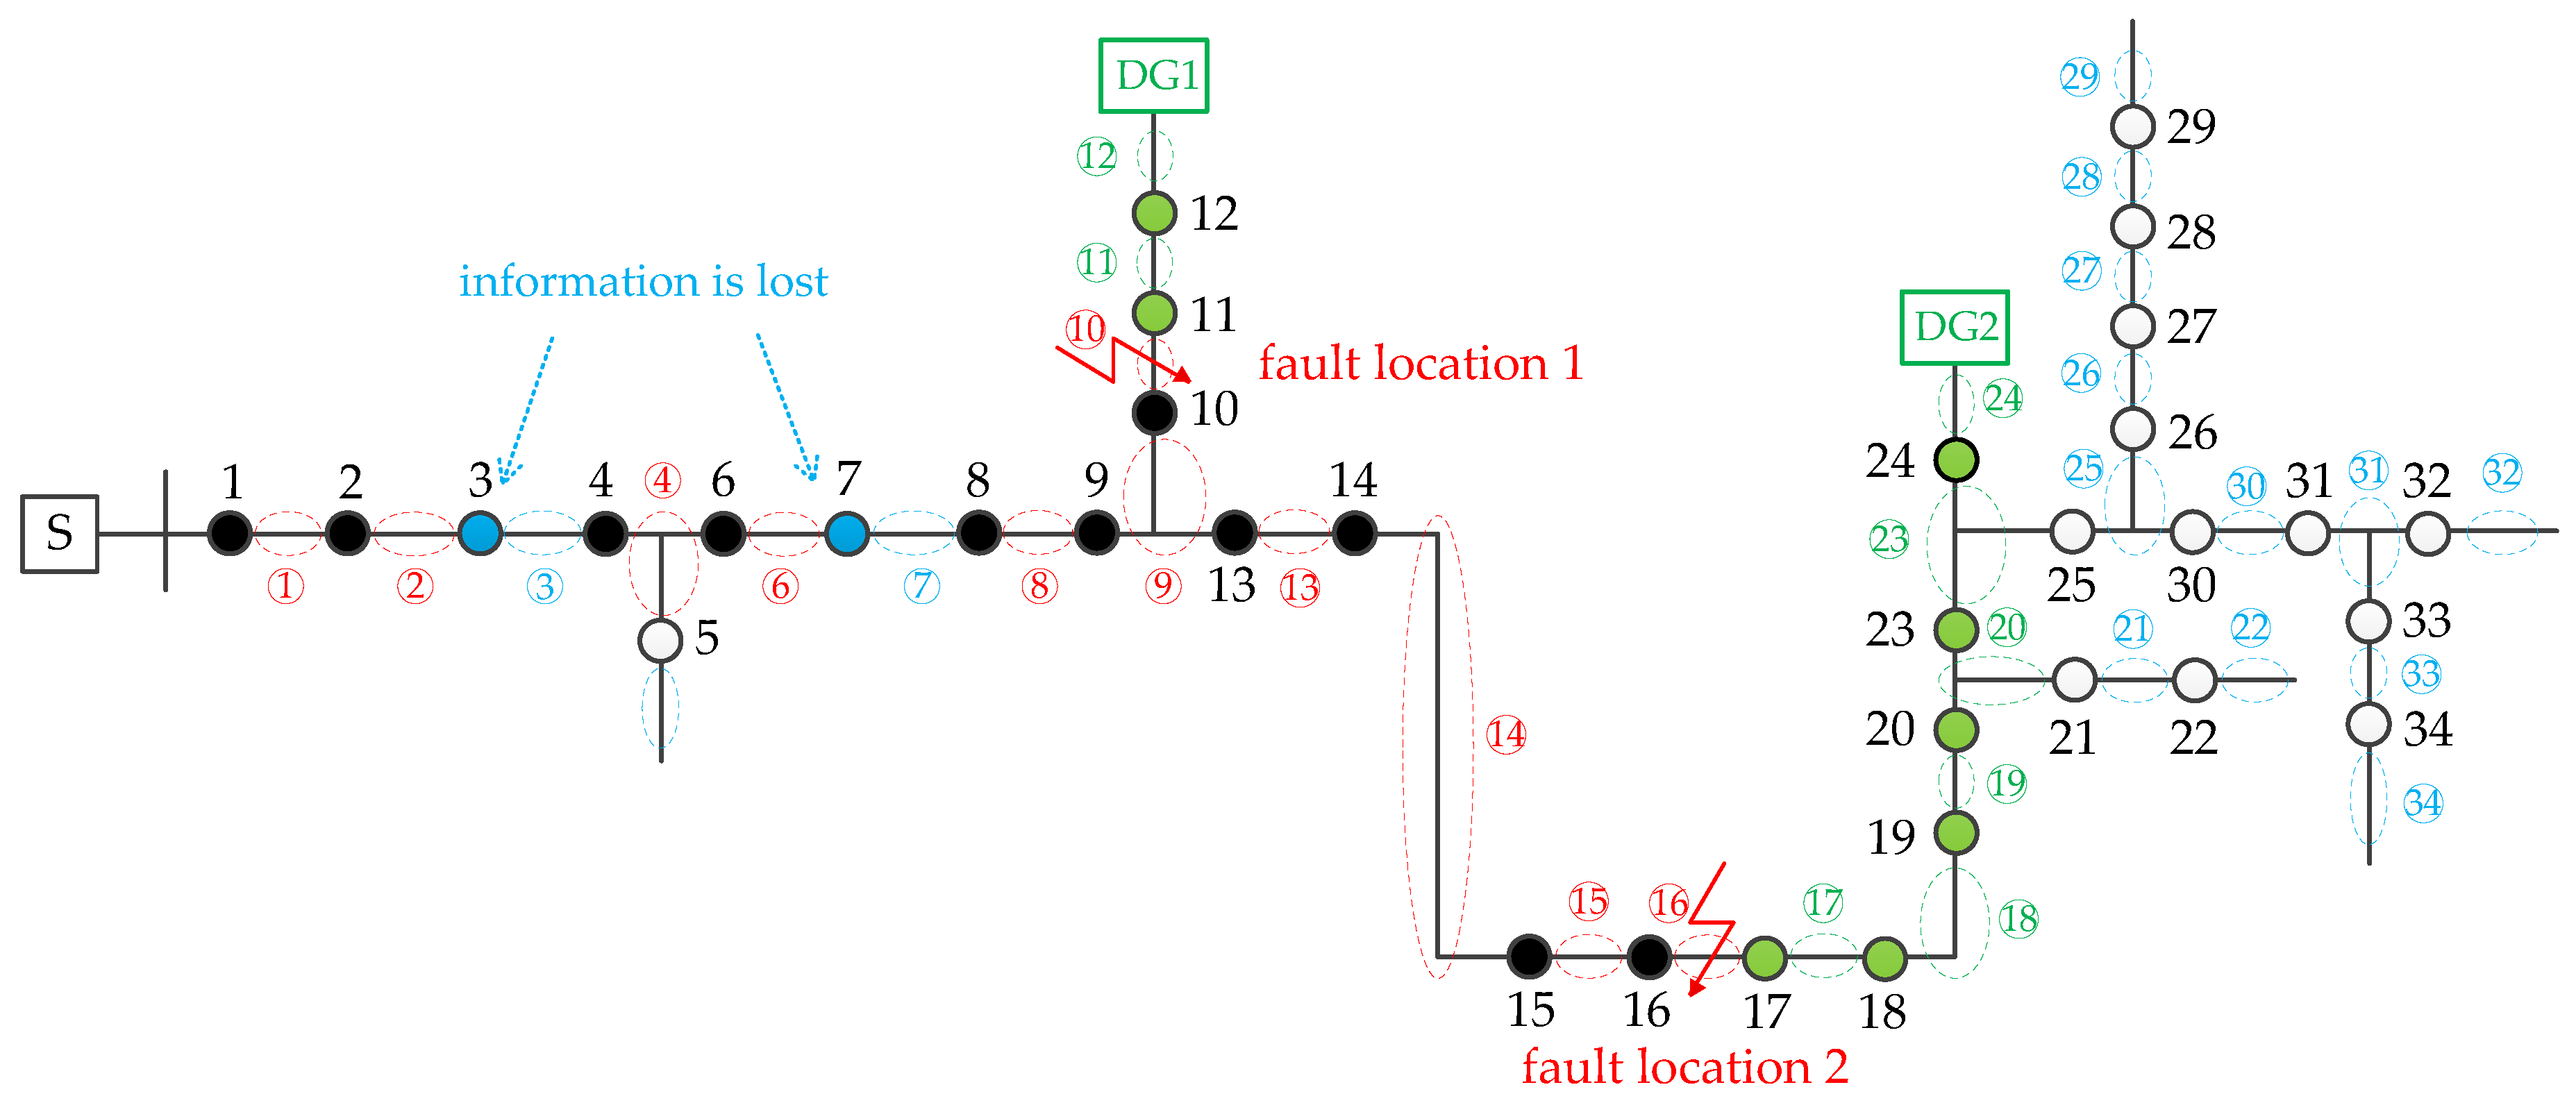
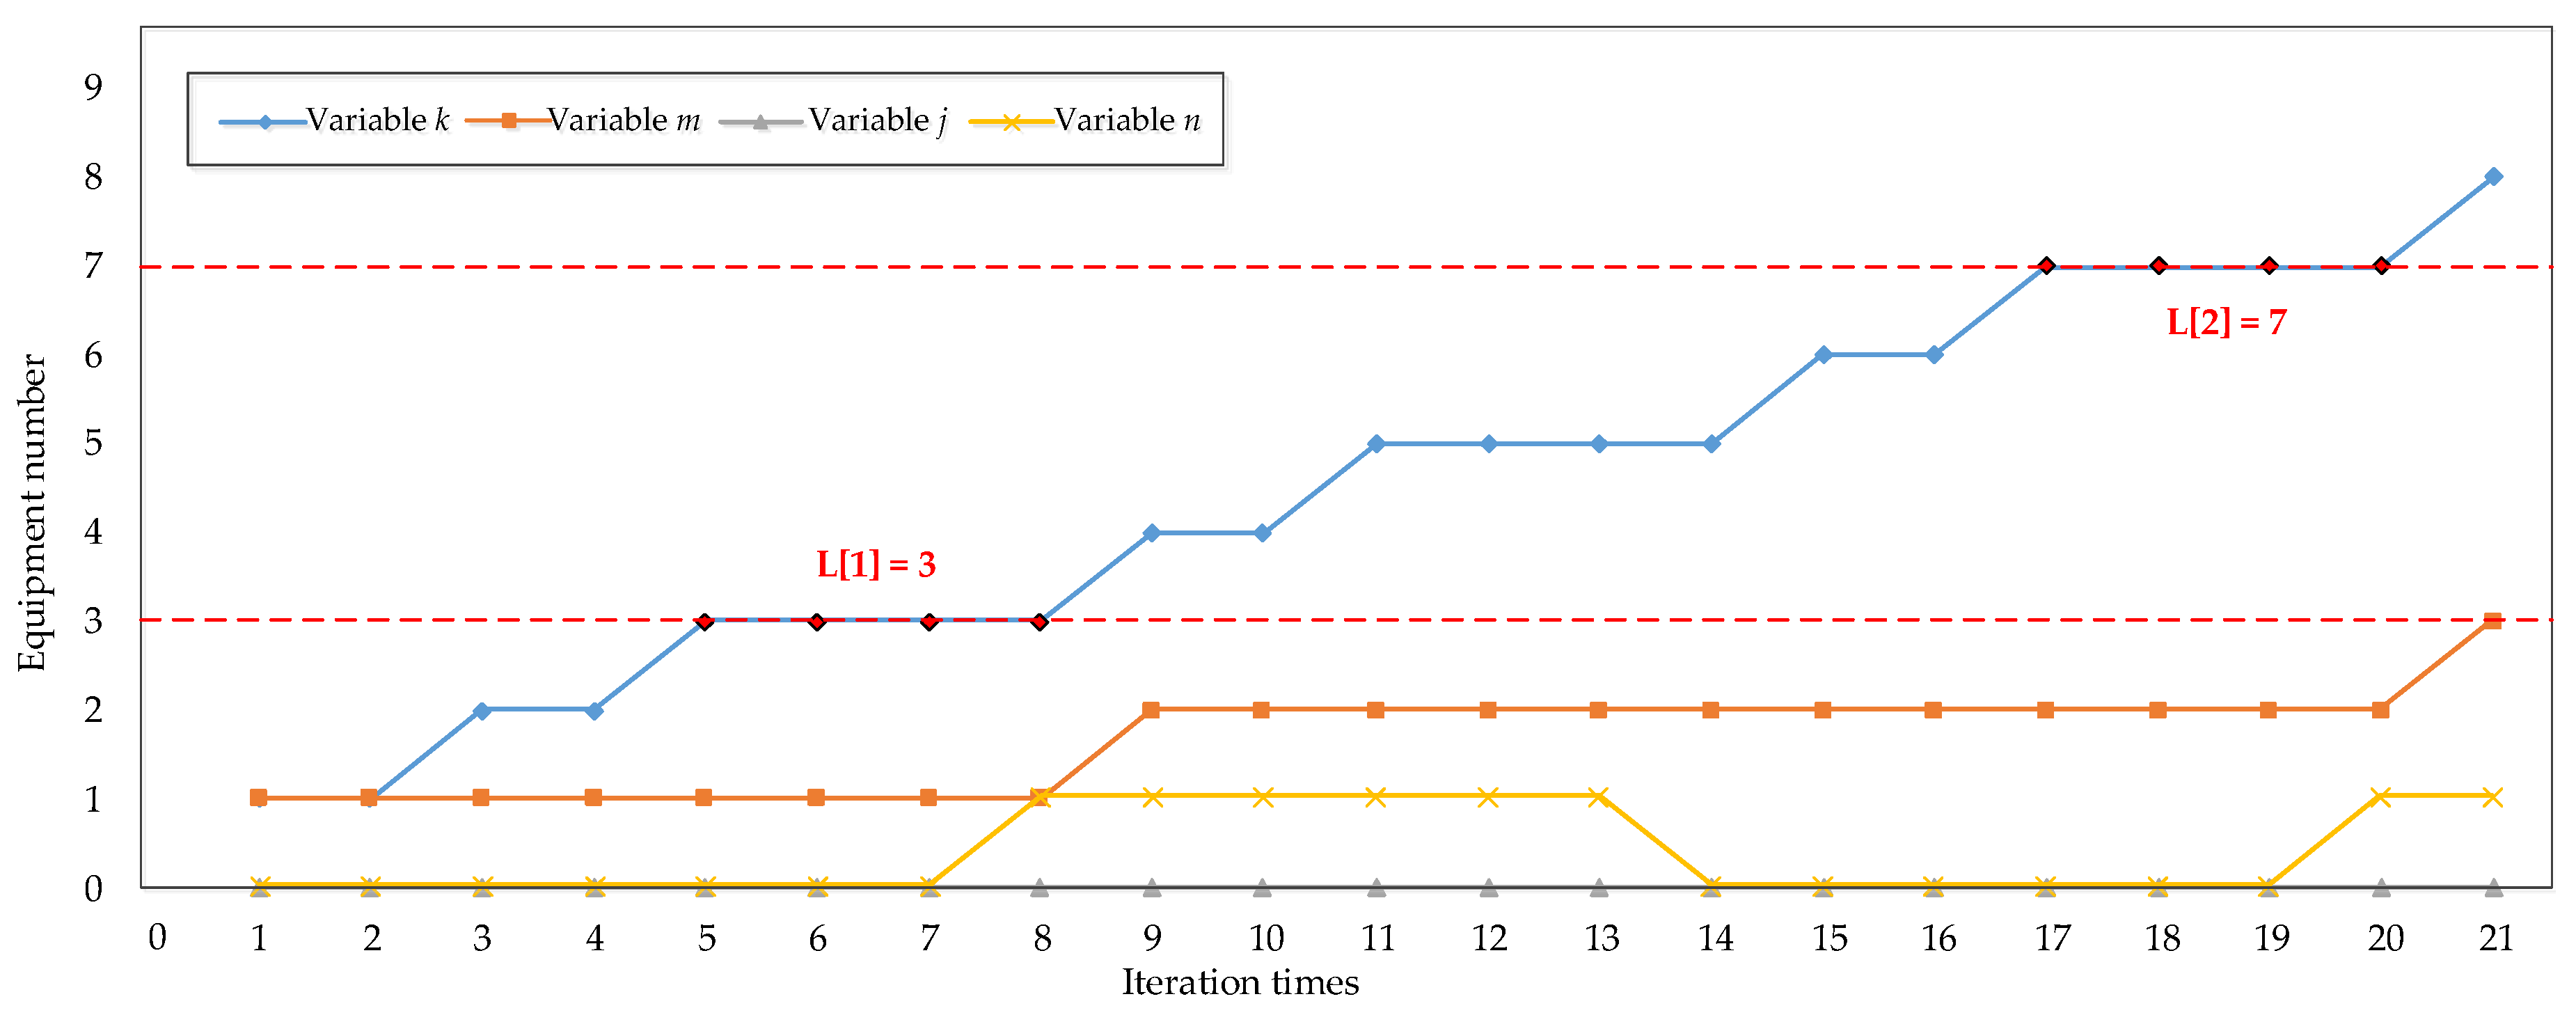
4.4. Test Case 4: Information Loss Condition

In order to test the performance of the proposed method for information loss conditions, as shown in Figure 11, this case adds information loss on the basis of Figure 9. Assuming that the information of FIE-3 and FIE-7 is lost, then the status of them will be “0” in the updated line list. The line list in this case is shown in Table 8.
By applying the information loss detection algorithm proposed in Section 3.2, the iterative process in MATLAB is shown in Figure 12, while the operation steps of the information loss detection algorithm and the results are shown in Table 9. The result arrays L[1] = 3 and L[1] = 7 correctly indicate that the information of FIE-3 and FIE-7 is lost. After that, the information loss detection algorithm will correct the status of FIE-3 and FIE-7 to “1” in the line list and send the updated line list to the topology search algorithm. The operation steps of the topology search algorithm are shown in Section 4.3.

5. Discussion

5.1. Comparison with Other Fault Location Methods

As more and more feeder terminal devices are applied in power distribution networks, scholars from different countries have proposed some fault location methods based on the fault information collected by FTUs. In addition, complex fault conditions in power distribution networks have put forward higher requirements for the research of fault location. Whether the faulted section can be effectively located in various complex situations has become an important criterion for testing a fault location method.
As shown in Table 10, the fault location method proposed in this paper is compared with other methods in various complex conditions, and all of the methods taken into comparison use fault information collected by FTUs. It is necessary to be mentioned in advance that if the judgment conditions of the methods do not need to be changed artificially when the topology of distribution network changes, the method can be considered that it is suitable for different topologies automatically. Then, we set a “√” for this method in Table 10. If the faulted section can be effectively located when part of the information is lost, we set a “√” for this method. If the method can detect and report the equipment with information loss, we set a “√” for this method. The comparison result indicates that the proposed method has the following advantages at the same time:
  • The proposed fault location method is not only applicable for single fault, but also for multiple faults at the same time.
  • The simulation results show that the proposed method can also effectively locate the fault point when there are distributed generations in the distribution network.
  • The line list proposed in the method can be updated automatically when the topology of distribution network changes, so it is suitable for the distribution networks with the topology structure changes frequently.
  • The information loss detection algorithm can report the fault-indicating equipment with information loss and correct the wrong status of equipment in the line list, which greatly improves the accuracy of the fault location results. Moreover, with the help of this feature, if a piece of equipment often loses information, this indicates that the equipment may need to be repaired.
In summary, the fault location method proposed in this paper is applicable for solving complex fault conditions in power distribution networks.

5.2. Influence of the Fault Position and Line Structure

In order to test the influence of the fault position and topology of power distribution line on the rate of the proposed method, expand the node scale to 100 after FIE-33 in the IEEE-33 node distribution network, and expand the node scale to 100 after FIE-34 in the IEEE-34 node distribution network. Then, set a single fault on the nearest downstream section of each FIE, each case is simulated 10 times and take the average time of the simulations—the results are shown in Figure 13.
As shown in Figure 13, the running time will increase as the FIE is far away from the substation, because the topology search algorithm starts detection from the substation side each time. Take the running time of about 0.1 s as an example—it corresponds to FIE-16 and FIE-24 in the IEEE-33 node distribution network, and there are eight FIEs on both upstream lines. Take the running time of about 0.2 s as an example, it corresponds to FIE-33 in the IEEE-33 node distribution network, there are 17 FIEs on the upstream line. Likewise, the time of about 0.1 s corresponds to FIE-11 and FIE-14 in the IEEE-34 node distribution network, and there are nine FIEs on both upstream lines. The time of about 0.2 s corresponds to FIE-26 and FIE-30 in the IEEE-34 node distribution network, and there are 18 FIEs on both upstream lines. Therefore, the results prove that the proposed method can be affected by the quantity of upstream FIEs.
In addition, there are eight FIEs on the upstream line of FIE-16 and FIE-24 in the IEEE-33 node distribution network, and the running time is about 0.1 s. There are also eight FIEs on the upstream line of FIE-10 and FIE-13 in the IEEE-34 node distribution network, but the running time is less than 0.1 s. This is because of the difference in line structure—if there are more branches, the running time will also increase slightly.
Therefore, we can draw the following conclusion that no matter how many nodes there are in the distribution line, the running time is only affected by the quantity of upstream FIEs and branches. In future work, we will continue to improve the fault location method, such as defining multiple start detection points in the main line to divide the distribution line into multiple sections, which will reduce the running time by multiple times.

6. Conclusions

A novel faulted section location method for a distribution network based on status information of fault-indicating equipment is proposed in this paper. Considering that a lot of feeder terminal units (FTUs) and fault indicators (FIs) are applied in power distribution networks, it provides great convenience for collecting the fault information. However, the method for analyzing electrical quantity is more complex because it is easily affected by fault types and system parameters. Therefore, the method in this paper uses status information of FTUs and FIs, which can reduce the difficulty of applying this method in distribution networks. Furthermore, considering topology structure changes frequently in distribution networks, a method for automatically constructing the line list is proposed, which can dynamically represent the topology structure of power distribution line.
In this paper, based on the iterative search method, a topology search algorithm and an information loss detection algorithm are proposed. Considering that information loss may lead to a local optimum, the information loss detection algorithm can eliminate the possibility of a local optimum for the topology search algorithm in advance, which improves the accuracy of the fault location method. Different fault conditions are simulated in MATLAB, and the results prove that the proposed method is applicable for solving complex fault cases in distribution networks.
Moreover, we also study the factors that affect the rate of the proposed method, and we find an advantage that the running time only depends on the quantity of the FIEs and branches between the substation and fault points. When the node scale is expanded, the running time does not necessarily increase. Therefore, the fault location method proposed in this paper can achieve a fast and accurate fault location in power distribution networks.

Author Contributions

This paper was a collaborative effort between the authors. The individual contributions can be stated as follows. Formal analysis, G.L. and J.Z.; Funding acquisition, Q.C.; Investigation, J.Z.; Project administration, Q.C.; Software, G.L.; Supervision, Q.C.; Writing—original draft, G.L. All authors have read and agreed to the published version of the manuscript.

Funding

This work was supported by the National Natural Science Foundation of China (No. 51877123).

Conflicts of Interest

The authors declare no conflict of interest.

References

  1. Mora- Florez, J.; Cormane-Angarita, J.; Ordonez-Plata, G. K-means algorithm and mixture distributions for locating faults in power systems. Electr. Power Syst. Res. 2009, 79, 714–721. [Google Scholar] [CrossRef]
  2. Jia, K.; Ren, Z.; Li, L.; Xuan, Z.; Thomas, D. High-frequency transient comparison based fault location in distribution systems with DGs. IET Gener. Transm. Distrib. 2017, 11, 4068–4077. [Google Scholar] [CrossRef]
  3. Personal, E.; García, A.; Parejo, A.; Larios, D.F.; Biscarri, F.; León, C. A comparison of impedance-based fault location methods for power underground distribution systems. Energies 2016, 9, 1022. [Google Scholar] [CrossRef] [Green Version]
  4. Gabr, M.A.; Ibrahim, D.K.; Ahmed, E.S.; Gilany, M.I. A new impedance-based fault location scheme for overhead unbalanced radial distribution networks. Electr. Power Syst. Res. 2017, 142, 153–162. [Google Scholar] [CrossRef]
  5. Gazzana, D.S.; Ferreira, G.D.; Bretas, A.S.; Carniato, A.; Passos, L.F.N.; Ferreira, A.H.; Silva, J.E.M. An integrated technique for fault location and section identification in distribution systems. Electr. Power Syst. Res. 2014, 115, 65–73. [Google Scholar] [CrossRef]
  6. Muzzammel, R. Traveling waves-based method for fault estimation in HVDC transmission system. Energies 2019, 12, 3614. [Google Scholar] [CrossRef] [Green Version]
  7. Jiang, L.; Chen, Q.; Huang, W.; Wang, L.; Zeng, Y.; Zhao, P. Pilot protection based on amplitude of directional travelling wave for voltage source converter-high voltage direct current (VSC-HVDC) transmission lines. Energies 2018, 11, 2021. [Google Scholar] [CrossRef] [Green Version]
  8. Lopes, F.V.; Dantas, K.M.; Silva, K.M.; Costa, F.B. Accurate two-terminal transmission line fault location using traveling waves. IEEE Trans. Power Deliv. 2018, 33, 873–880. [Google Scholar]
  9. Orozco-Henao, C.; Bretas, A.S.; Chouhy-Leborgne, R.; Herrera-Orozco, A.R.; Marin-Quintero, J. Active distribution network fault location methodology: A minimum fault reactance and Fibonacci search approach. Int. J. Electr. Power Energy Syst. 2017, 84, 232–241. [Google Scholar] [CrossRef]
  10. Grajales-Espinal, C.; Mora-Florez, J.; Perez-Londono, S. Advanced fault location strategy for modern power distribution systems based on phase and sequence components and the minimum fault reactance concept. Electr. Power Syst. Res. 2016, 140, 933–941. [Google Scholar] [CrossRef]
  11. Du, H.; Sun, Y.; Liu, H.; Dong, W. Fault section diagnosis and isolation of distribution networks based on genetic algorithm. Power Syst. Technol. 2000, 24, 52–55. [Google Scholar]
  12. Liu, P.; Li, X. Fault-section location of distribution network containing distributed generation based on the multiple-population genetic algorithm. Power Syst. Prot. Control 2016, 44, 36–41. [Google Scholar]
  13. Lin, X.; Ke, S.; Li, L.; Weng, H.; Han, X. A fault diagnosis method of power systems based on improved objective function and genetic algorithm-tabu search. IEEE Trans. Power Deliv. 2010, 25, 1268–1274. [Google Scholar] [CrossRef]
  14. Meshal, A.; Manar, M.; Ahmad, S. Fault location in multi-ring distribution network using artificial neural network. Electr. Power Syst. Res. 2003, 64, 87–92. [Google Scholar]
  15. Shen, S.; Lin, D.; Wang, H.; Hu, P.; Jiang, K.; Lin, D.; He, B. An adaptive protection scheme for distribution systems with DGs based on optimized thevenin equivalent parameters estimation. IEEE Trans. Power Deliv. 2017, 32, 411–419. [Google Scholar]
  16. Santos, W.C.; Lopes, F.V.; Brito, N.S.D.; Souza, B.A. High-impedance fault identification on distribution networks. IEEE Trans. Power Deliv. 2017, 32, 23–32. [Google Scholar]
  17. Jia, K.; Li, L.; Yang, Z.; Zhao, G.; Bi, T. Research on distribution network fault location based on Bayesian compressed sensing theory. Proc. CSEE 2019, 39, 3475–3486. [Google Scholar]
  18. Guo, Z.; Xu, Q.; Hong, J.; Mao, X. Integer linear programming based fault section diagnosis method with high fault-tolerance and fast performance for distribution network. Proc. CSEE 2017, 37, 786–795. [Google Scholar]
  19. Shen, G.; Zhang, Y.; Qiu, H.; Wang, C.; Wen, F.; Salam, M.A.; Weng, L.; Yu, B.; Chen, J. Fault diagnosis with false and/or missing alarms in distribution systems with distributed generators. Energies 2018, 11, 2579. [Google Scholar] [CrossRef] [Green Version]
  20. He, R.; Hu, Z.; Li, Y.; Wang, T. Fault section location method for DG-DNs based on integer linear programming. Power Syst. Technol. 2018, 42, 3684–3692. [Google Scholar]
  21. Zheng, C.; Zhu, G. Distribution network fault segment location algorithm based on Bayesian estimation in intelligent distributed control mode. Power Syst. Technol. 2020, 44, 1561–1567. [Google Scholar]
  22. Huang, X.; Xie, Z.; Huang, X. Fault location of distribution network base on improved Cuckoo Search Algorithm. IEEE Access. 2020, 8, 2272–2283. [Google Scholar] [CrossRef]
  23. Fei, J.; Dan, Y.D. Study of the automatic fault location system in the distribution network. Proc. CSEE 2000, 20, 32–40. [Google Scholar]
  24. Guo, Z.; Chen, B.; Liu, C.; Xun, K.; Li, J. Fault location of distribution network based on genetic algorithm. Power Syst. Technol. 2007, 31, 88–92. [Google Scholar]
Figure 1. A typical radial distribution network.
Applsci 10 05910 g001
Figure 2. Flow chart of fault location method.
Applsci 10 05910 g002
Figure 3. Flow chart of the topology search algorithm.
Applsci 10 05910 g003
Figure 4. Flow chart of the information loss detection algorithm.
Applsci 10 05910 g004
Figure 5. Single fault in the IEEE-33 node distribution network.
Applsci 10 05910 g005
Figure 6. Iterative process of test case 1.
Applsci 10 05910 g006
Figure 7. Multiple faults in the IEEE-33 node distribution network.
Applsci 10 05910 g007
Figure 8. Iterative process of test case 2.
Applsci 10 05910 g008
Figure 9. Multiple faults in the IEEE-34 node distribution network with distribution generations (DGs).
Applsci 10 05910 g009
Figure 10. Iterative process of test case 3.
Applsci 10 05910 g010
Figure 11. Information loss in the IEEE-34 node distribution network.
Applsci 10 05910 g011
Figure 12. Iterative process of test case 4.
Applsci 10 05910 g012
Figure 13. Simulation results of expanded distribution network.
Applsci 10 05910 g013
Table 1. The line list of Figure 1.
Equipment NumberStatus of
Equipment
Upstream
Equipment
Downstream
Equipment
10-2 and 4
2013
302-
4015 and 7
5046
605-
7048
8079
908-
Table 2. The line list of Figure 5.
Equipment NumberStatusUpstream
Equipment
Downstream
Equipment
Equipment NumberStatusUpstream
Equipment
Downstream
Equipment
1121801719
2113 and 71901820
30242001921
403521020
50462211323
6052312224
7128 and 112412325
80792512426
908102612527
10092702628
1117122802729
12111132902830
1311214 and 223002931
14013153103032
15014163203133
160151733032
1701618
Table 3. The operation steps of test case 1.
StepkmjniR[]A[]StepkmjniR[]A[]
(1)11100 (5)221100
(2)11100 (3)221100
(3)11100 (4)231100
(4)21100 (3)231100
(3)21100 (4)241100
(5)71100 (3)241100
(3)71100 (4)251100
(5)111100 (3)251100
(3)111100 (4)261100
(4)121100 (3)261100
(3)121100 (4)262100R[1] = 26
(4)131100 (6)262100R[1] = 26
(3)131100 (7)262100R[1] = 26
Table 4. The line list of Figure 7.
Equipment NumberStatusUpstream
Equipment
Downstream
Equipment
Equipment NumberStatusUpstream
Equipment
Downstream
Equipment
1121801719
2113 and 71901820
30242001921
403521020
50462201323
6052302224
7128 and 112402325
81792502426
918102602527
10092702628
1117122802729
12111132902830
1311214 and 223002931
14113153103032
15114163203133
161151733032
1701618
Table 5. The operation steps of test case 2.
StepkmjniR[]A[]StepkmjniR[]A[]
(1)11100 (3)112322R[1] = 9A[1] = 8; A[2] = 11
(2)11100 (4)122322R[1] = 9A[1] = 8; A[2] = 11
(3)11100 (3)122322R[1] = 9A[1] = 8; A[2] = 11
(4)21100 (4)132322R[1] = 9A[1] = 8; A[2] = 11
(3)21100 (3)132322R[1] = 9A[1] = 8; A[2] = 11
(5)71100 (5)142322R[1] = 9A[1] = 8; A[2] = 11
(3)71100 (3)142322R[1] = 9A[1] = 8; A[2] = 11
(5)71122 A[1] = 8; A[2] = 11(4)152322R[1] = 9A[1] = 8; A[2] = 11
(6)81222 A[1] = 8; A[2] = 11(3)152322R[1] = 9A[1] = 8; A[2] = 11
(3)81222 A[1] = 8; A[2] = 11(4)162322R[1] = 9A[1] = 8; A[2] = 11
(4)91222 A[1] = 8; A[2] = 11(3)162322R[1] = 9A[1] = 8; A[2] = 11
(3)91222 A[1] = 8; A[2] = 11(4)163322R[1] = 9; R[2] = 16A[1] = 8; A[2] = 11
(4)92222R[1] = 9A[1] = 8; A[2] = 11(6)163322R[1] = 9; R[2] = 16A[1] = 8; A[2] = 11
(6)112322R[1] = 9A[1] = 8; A[2] = 11(7)163322R[1] = 9; R[2] = 16A[1] = 8; A[2] = 11
Table 6. The line list of Figure 9.
Equipment NumberStatusUpstream
Equipment
Downstream
Equipment
Equipment NumberStatusUpstream
Equipment
Downstream
Equipment
11218−11719
211319−11820
312420−11921 and 23
4135 and 62102022
50422032
614723−12024 and 25
716824−123
81792502326 and 30
91810 and 132602527
1019112702628
11−110122802729
12−11129028
1319143002531
14113153103032 and 33
151141632031
16115173303134
17−1161834033
Table 7. The operation steps of test case 3.
StepkmjniR[]A[]StepkmjniR[]A[]
(1)11100 (3)91100
(2)11100 (5)91122 A[1] = 10; A[2] = 13
(3)11100 (6)101222 A[1] = 10; A[2] = 13
(4)21100 (3)101222 A[1] = 10; A[2] = 13
(3)21100 (4)102222R[1] = 10A[1] = 10; A[2] = 13
(4)31100 (6)132322R[1] = 10A[1] = 10; A[2] = 13
(3)31100 (3)132322R[1] = 10A[1] = 10; A[2] = 13
(4)41100 (4)142322R[1] = 10A[1] = 10; A[2] = 13
(3)41100 (3)142322R[1] = 10A[1] = 10; A[2] = 13
(5)61100 (4)152322R[1] = 10A[1] = 10; A[2] = 13
(3)61100 (3)152322R[1] = 10A[1] = 10; A[2] = 13
(4)71100 (4)162322R[1] = 10A[1] = 10; A[2] = 13
(3)71100 (3)162322R[1] = 10A[1] = 10; A[2] = 13
(4)81100 (4)163322R[1] = 10; R[2] = 16A[1] = 10; A[2] = 13
(3)81100 (6)163322R[1] = 10; R[2] = 16A[1] = 10; A[2] = 13
(4)91100 (7)163322R[1] = 10; R[2] = 16A[1] = 10; A[2] = 13
Table 8. The line list of Figure 11.
Equipment NumberStatusUpstream
Equipment
Downstream
Equipment
Equipment NumberStatusUpstream
Equipment
Downstream
Equipment
11218−11719
211319−11820
302420−11921 and 23
4135 and 62102022
50422032
614723−12024 and 25
706824−123
81792502326 and 30
91810 and 132602527
1019112702628
11−110122802729
12−11129028
1319143002531
14113153103032 and 33
151141632031
16115173303134
17−1161834033
Table 9. The operation steps of test case 4.
StepkmjnL[]B[]StepkmjnL[]B[]
(1)1100 (2)5201L[1] = 3B[1] = 4
(2)1100 (3)5201L[1] = 3B[1] = 4
(3)2100 (4)5200L[1] = 3B[1] = 4
(2)2100 (6)6200L[1] = 3B[1] = 4
(3)3100 (2)6200L[1] = 3B[1] = 4
(2)3100 (3)7200L[1] = 3B[1] = 4
(3)3100 (2)7200L[1] = 3B[1] = 4
(4)3101 B[1] = 4(3)7200L[1] = 3B[1] = 4
(5)4201L[1] = 3B[1] = 4(4)7201L[1] = 3B[1] = 4
(2)4201L[1] = 3B[1] = 4(5)8301L[1] = 3; L[2] = 7B[1] = 4
(3)5201L[1] = 3B[1] = 4
Table 10. Comparison with other fault location methods.
ConditionsSingle
Fault
Multiple
Faults
DG in NetworkTopology ChangesInformation LossReport Equipment with Information Loss
Methods
Proposed method
Method of [17]
Method of [18]
Method of [19]
Method of [20]
Method of [21]
Method of [22]

