Article

Automatic Segmentation of Macular Edema in Retinal OCT Images Using Improved U-Net++

School of Computer and Information Engineering, Heilongjiang University of Science and Technology, Harbin 150022, China
*
Author to whom correspondence should be addressed.
Appl. Sci. 2020, 10(16), 5701; https://doi.org/10.3390/app10165701
Submission received: 15 July 2020 / Revised: 14 August 2020 / Accepted: 14 August 2020 / Published: 17 August 2020
(This article belongs to the Special Issue Image Processing Techniques for Biomedical Applications)

Abstract

:

Featured Application

An effective and automatic macular edema segmentation method can accurately segment macular edema, which can better assist ophthalmologists in diagnosing and rapidly and effectively screening eye patients, which is of benefit to eye patients.

Abstract

The number and volume of retinal macular edemas are important indicators for screening and diagnosing retinopathy. Aiming at the problem that the segmentation method of macular edemas in a retinal optical coherence tomography (OCT) image is not ideal in segmentation of diverse edemas, this paper proposes a new method of automatic segmentation of macular edema regions in retinal OCT images using the improved U-Net++. The proposed method makes full use of the U-Net++ re-designed skip pathways and dense convolution block; reduces the semantic gap of the feature maps in the encoder/decoder sub-network; and adds the improved Resnet network as the backbone, which make the extraction of features in the edema regions more accurate and improves the segmentation effect. The proposed method was trained and validated on the public dataset of Duke University, and the experiments demonstrated the proposed method can not only improve the overall segmentation effect, but also can significantly improve the segmented precision for diverse edema in multi-regions, as well as reducing the error of the number of edema regions.

1. Introduction

The macular region is located in the center of the retina and is the most critical and sensitive part where more than 90% of the cones are concentrated, being responsible for determining the light, shape, and color vision of the human. Macular edema occurs in the macular region, and it is one of the three major retinal diseases. It is mainly caused by the rupture of vascular epithelial cells and mural cells between the blood vessels and the retina, causing damage to the retinal fluid transport cells, which can cause unclear vision and vision loss, deformation of sight, and even blindness in severe cases.
Spectral domain optical coherence tomography (SD-OCT) is a non-invasive imaging mode that is typically used to achieve a high-resolution (6 µm) cross-section scan of biological tissue with a depth of penetration (0.5–2 mm) [1]. Figure 1a shows the normal retina optical coherence tomography (OCT) image, Figure 1b shows the OCT image of macular edema, and Figure 1c shows red regions in the image that are annotations of edema lesions. For the past two decades, optical coherence tomography has been recognized as one of the most important instruments in ophthalmic diagnosis. Ophthalmologists can screen and diagnose ocular patients by the number and size of cysts in the macular region.
However, the segmentation of macular edema in OCT images has always been a challenge for clinicians because of the high acquisition rate of the OCT system, which generates a large amount of 3D data, and each 3D volume contains hundreds of 2D B-scan images [2]. It requires a long processing time to manually annotate each B-scan image and is unrealistic for clinical applications. In addition to the above difficulties, both the image noise and severe retinopathy can lead to the boundary between healthy tissue and diseased tissue to spread highly [3]. This diffusion may lead to inconsistent manual annotation results among the different experts, and manual segmentation of edema regions will become very subjective. Therefore, in the past 10 years, many scholars have conducted important research on segmentation and detection of macular edema in retinal OCT images, obtaining many remarkable semi-automatic and automatic segmentation methods. There are two main categories: (1) those based on traditional methods, and (2) those based on deep learning.
For the traditional method, in 2005, Fernandez used a deformable model to delineate filled regions in OCT images of patients with the age related macular degeneration [4]. In 2010, Quellec and Sonka et al. reported a three-dimensional analysis method of retinal layer texture, which can identify fluid-filled regions in SD-OCT of the macula [5]. In 2013, Zheng et al. proposed a four-step process of first segmenting all low-reflection regions in an image as candidate regions, and then performed pre-processing, coarse segmentation, fine segmentation, and quantitative analysis on the candidate regions to automatically segment the intraretinal fluid (IRF) and the subretinal fluid (SRF) [6]. In 2015, Xu et al. well used a layer-dependent stratified sampling strategy to segment the intraretinal and subretinal fluid in OCT images [7]. Chiu et al. modified the dynamic programming-based approach to classify the layers and segment fluid using the kernel regression-based approach, and then fine-estimated them using the graph-based dynamic programming approach in the second phase [2]. Following a similar path, in 2016, on the basis of graph segmentation technology, Karri et al. proposed a structured random forest method to learn layer-specific edges and to enhance segmentation [8]. In the same year, Chiu et al. modified a method on the basis of dynamic programming by considering the spatial dependence of a frame and its two adjacent frames [9]. This has made some great contributions to the segmentation of macular edema in retinal OCT images.
With the improvement of graphics processing unit performance and the proposal of new deep neural network models, deep neural network has been widely used in medical image segmentation, as well as in other fields. In 2015, full convolutional neural network (FCN) [10] presented excellent performance in image segmentation tasks. In 2017, on the basis of FCN and fully connected conditional random field (CRF), Bai et al. proposed a new method for segmentation of macular edema in OCT images [11]. The framework uses a convolution layer to extract and predict the pixel category of the input image, using fine-tuning to exploit the learning convolution kernel of the classification network to complete the segmentation task; then, according to the fully connected CRF model of image and FCN, the feature vector of heat map is outputted, including the pixel positions and values in different channels, and finally each pixel is classified, generating an amended prediction map as the final output.
In 2015, U-Net came out, wherein its skip connection structure combines deep and shallow features, improves segmentation accuracy, and is widely used in the field of medical images [12]. The application effect is better than other frameworks in small datasets of medical image segmentation, such as neural structures, kidneys [13], and liver tumor [14]. In 2017, Roy et al. proposed ReLayNet [15], which is suitable for OCT macular edema segmentation by the U-Net as a framework. The network segmented the edema region with OCT images and achieved good segmentation results. In 2018, Venhuizen et al. proposed a two-stage full convoluted neural network based on U-Net [16]—the first stage network was used to extract retinal regional features, and the second stage network was used to combine retinal information extracted in the previous stage for edema segmentation. In 2019, Li et al. improved the network parameters and loss function of U-Net in order to solve the imbalance problem if the categories in retinal OCT images, and added batch normalization (BN) between the convolution block and the activation function, which further improved the accuracy [17]. In 2020, on the basis of U-Net, Chen et al. used multi-scale convolution instead of ordinary 3 × 3 convolution to achieve the adaptive field of the image. The channel attention module is embedded in the model, so that it can ignore irrelevant information and focus on key information in the channels. [18]. In 2020, Liu et al. took advantage of the multi-scale input, multi-scale side output, and dual attention mechanism, presenting an enhanced nested U-Net architecture (MDAN-UNet) and achieving great performance with multi-layer segmentation and multi-fluid segmentation [19]. In same year, Xie et al. used image enhancement and the improved 3D U-Net to achieve a fast and automated hyperreflective foci segmentation method, obtaining good segmentation results [20]. Recently, Mohamed et al. integrated the segmentation of region of interest (RoI), proposing a HyCAD hybrid learning system for classification of diabetic macular edema, choroidal neovascularization, and drusen disorders [21].
At present, due to the loss of shallow features and the influence of image noise, the existing segmentation methods have not achieved a more ideal segmentation effect on the whole and diverse edema lesions. Therefore, this paper proposes a new method for automatic segmentation of macular edema regions in retinal OCT images on the basis of improved U-Net++. This method makes full use of U-Net++’s redesigned skip connections and dense convolutional blocks, reducing the semantic loss of feature maps in the encoder/decoder subnetwork. By improving the U-Net++ network and using ResNet as the backbone network, the overall segmentation accuracy is not only further improved, but also the accuracy of segmentation for diverse edemas is significantly improved because the ResNeSt is used to reduce the loss of features in the transmission process.
The paper is organized as follows: Section 2 introduces the fully convolutional neural network U-Net++ and explains the proposed method, Section 3 describes the experimental settings and shows experimental results and comparative analysis, Section 4 presents the discussion, and Section 5 draws the conclusion of the study.

2. Materials and Methods

This paper used the improved U-Net++ to perform two-level semantic segmentation of each pixel for the OCT image and segmented the edema region and background region.
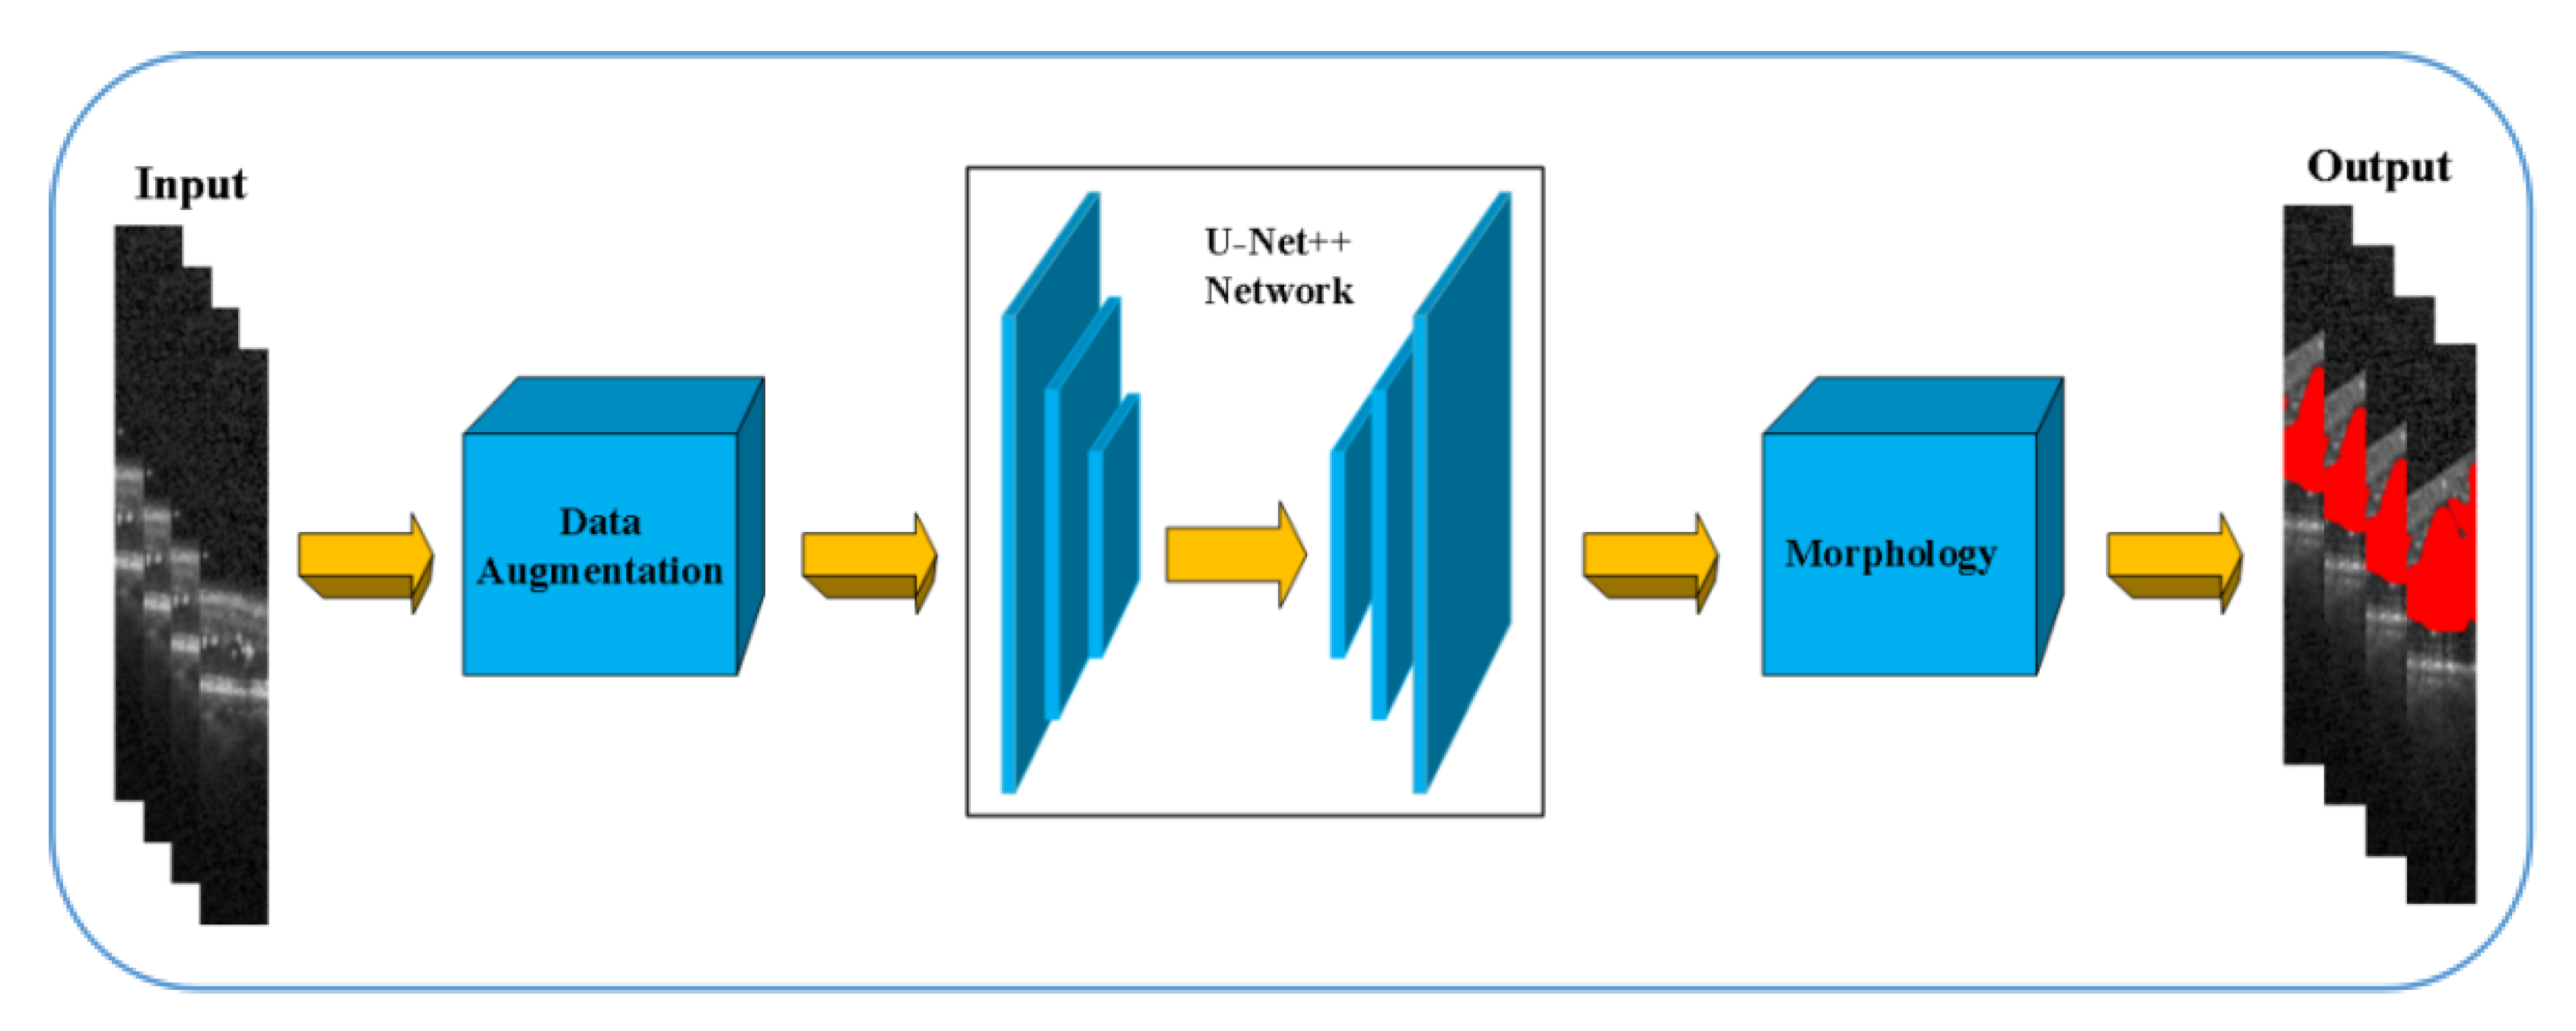
The overall flow chart of the proposed method is shown in Figure 2; the proposed framework consists of three stages. In the first stage, the data are augmented by operations such as flipping, cropping, and translation. Thus, the generalization ability of the model is improved by increasing the amount of training data, and its robustness is also improved by increasing data noise. The second stage, a new U-Net++ network architecture, is used to train and segment images. The final stage uses the morphology for post-processing refinement.

2.1. U-Net++ Network Architecture

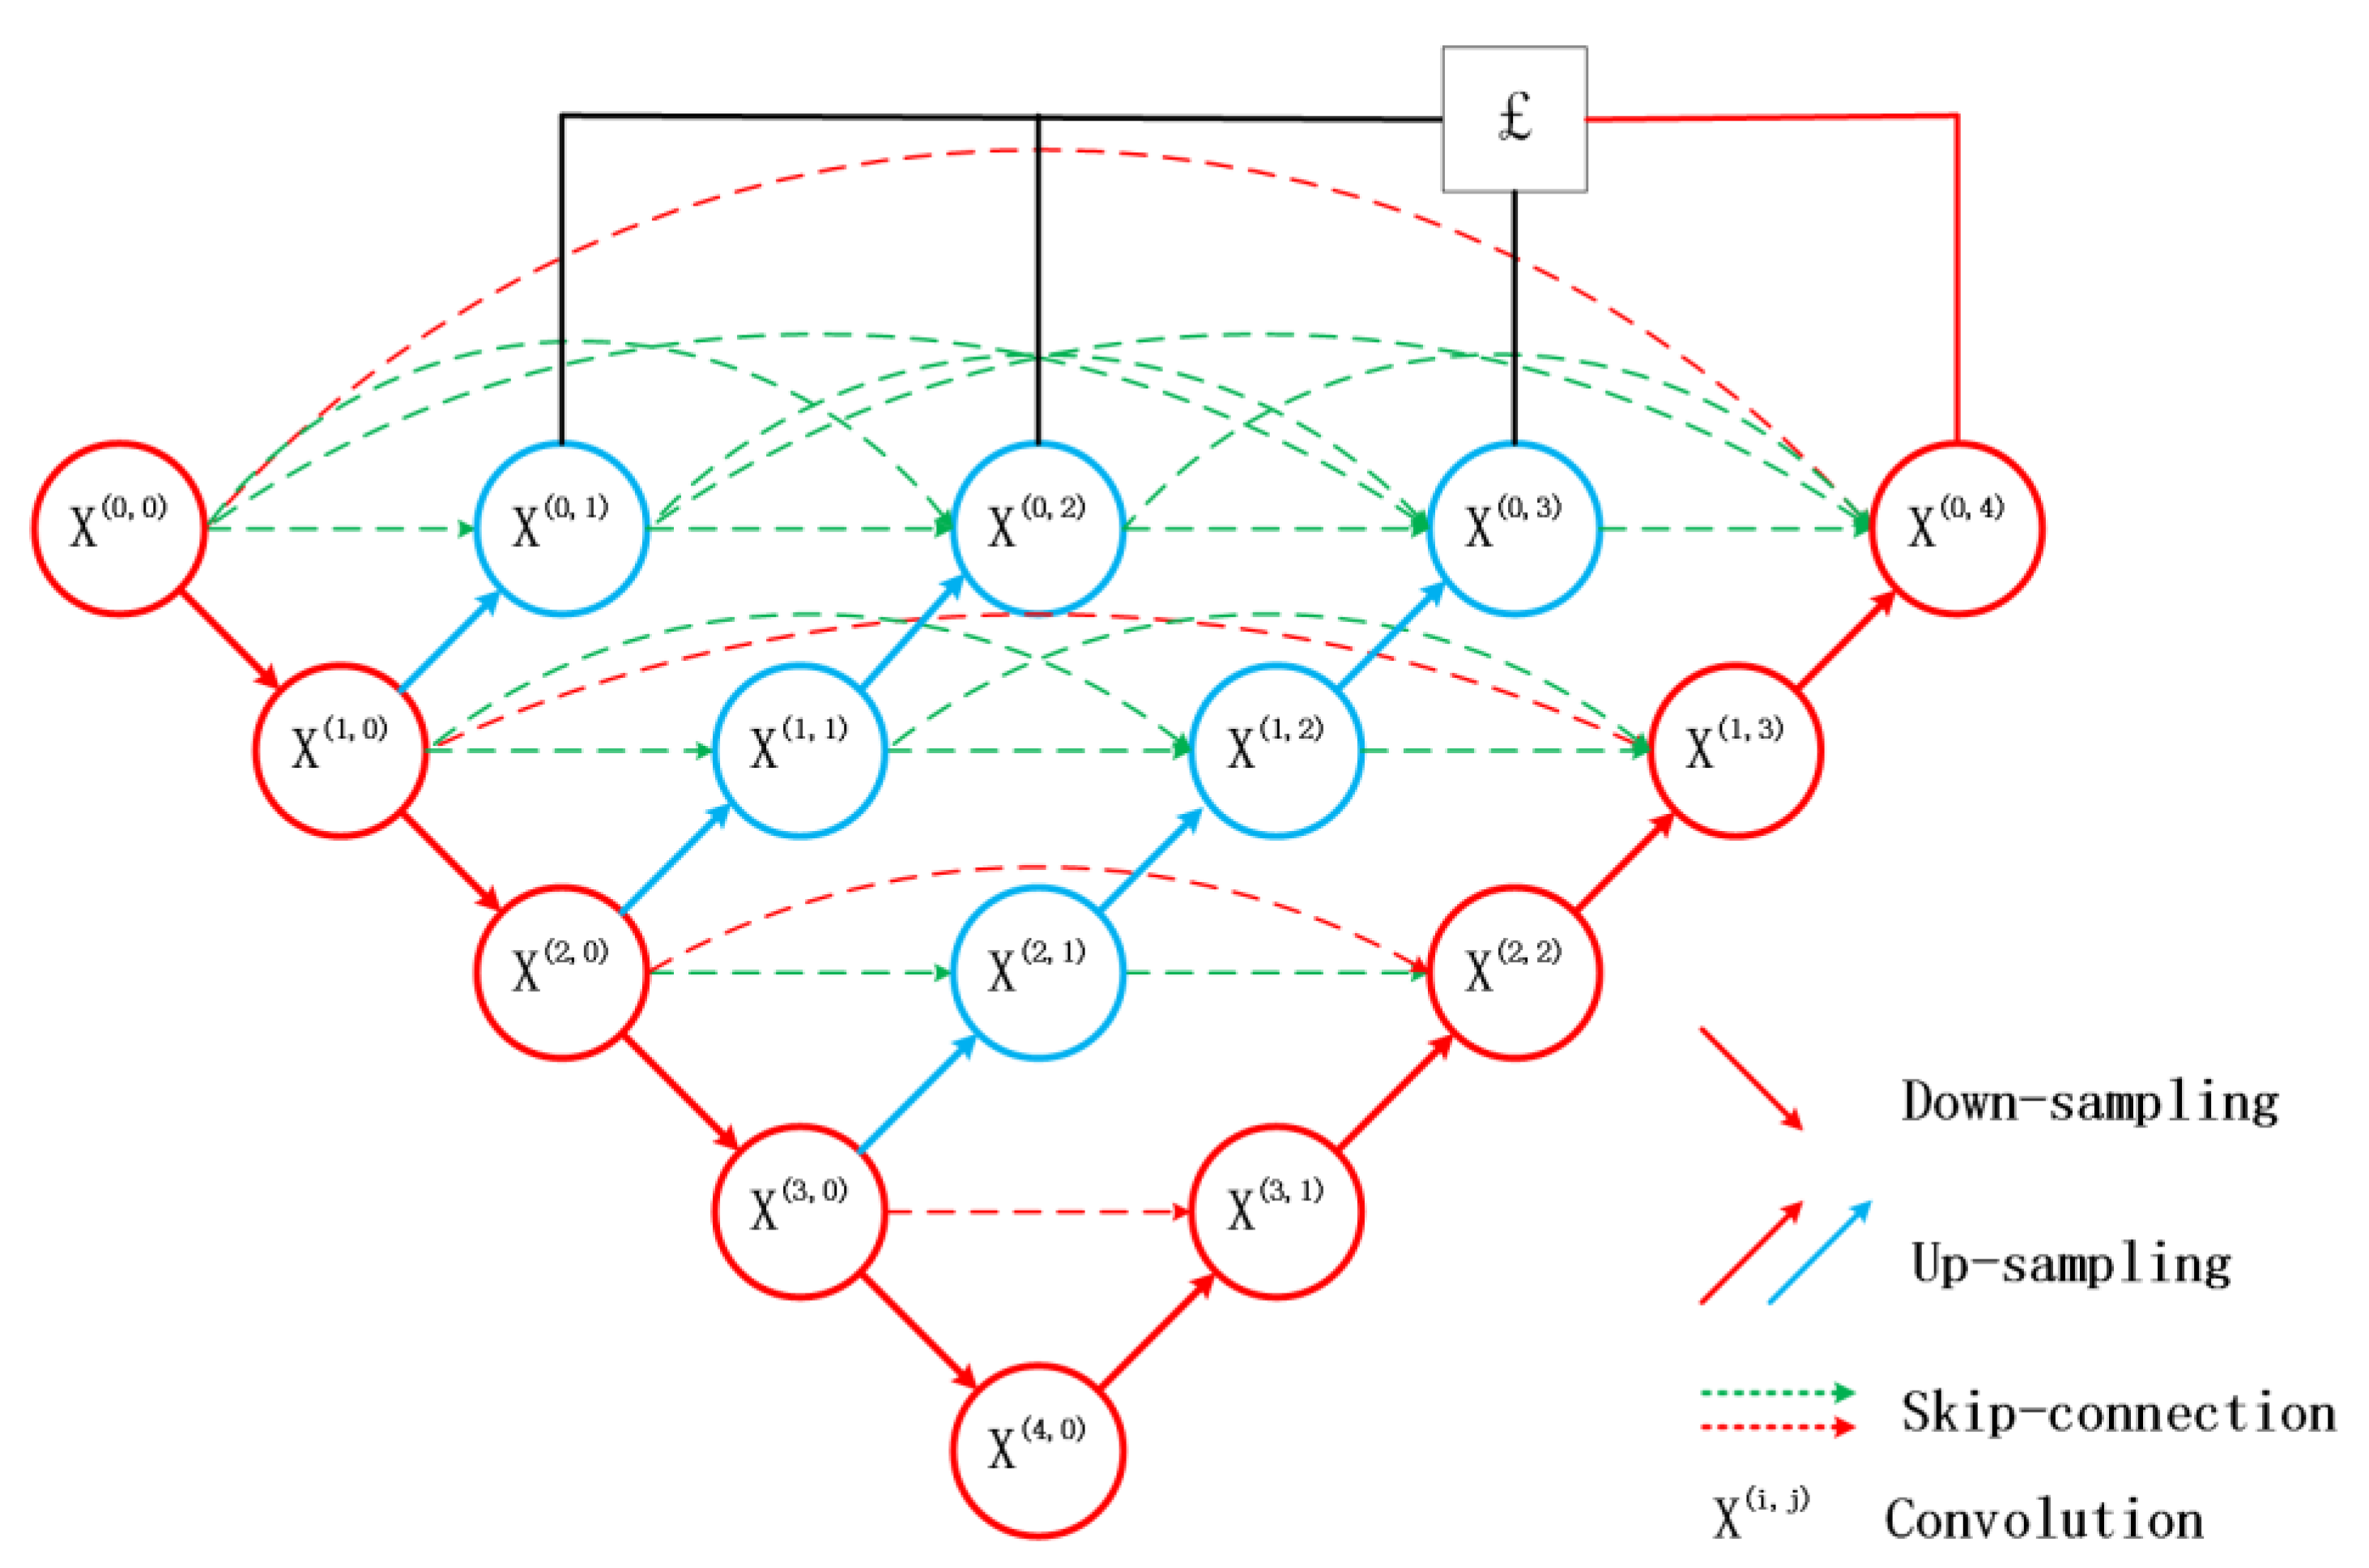
The H-denseunet network was proposed by Li et al. [22]. Drozdzal systematically studied the importance of short skip connections [23]. The network’s redesigned skip connection can retain image features better, effectively preventing the features loss of the diverse lesions in medical image segmentation. Inspired by this, U-Net++ was proposed by Zhou et al., and has greatly improved the skip connection part of the U-Net network [24]. The network structure is shown in Figure 3, as follows:
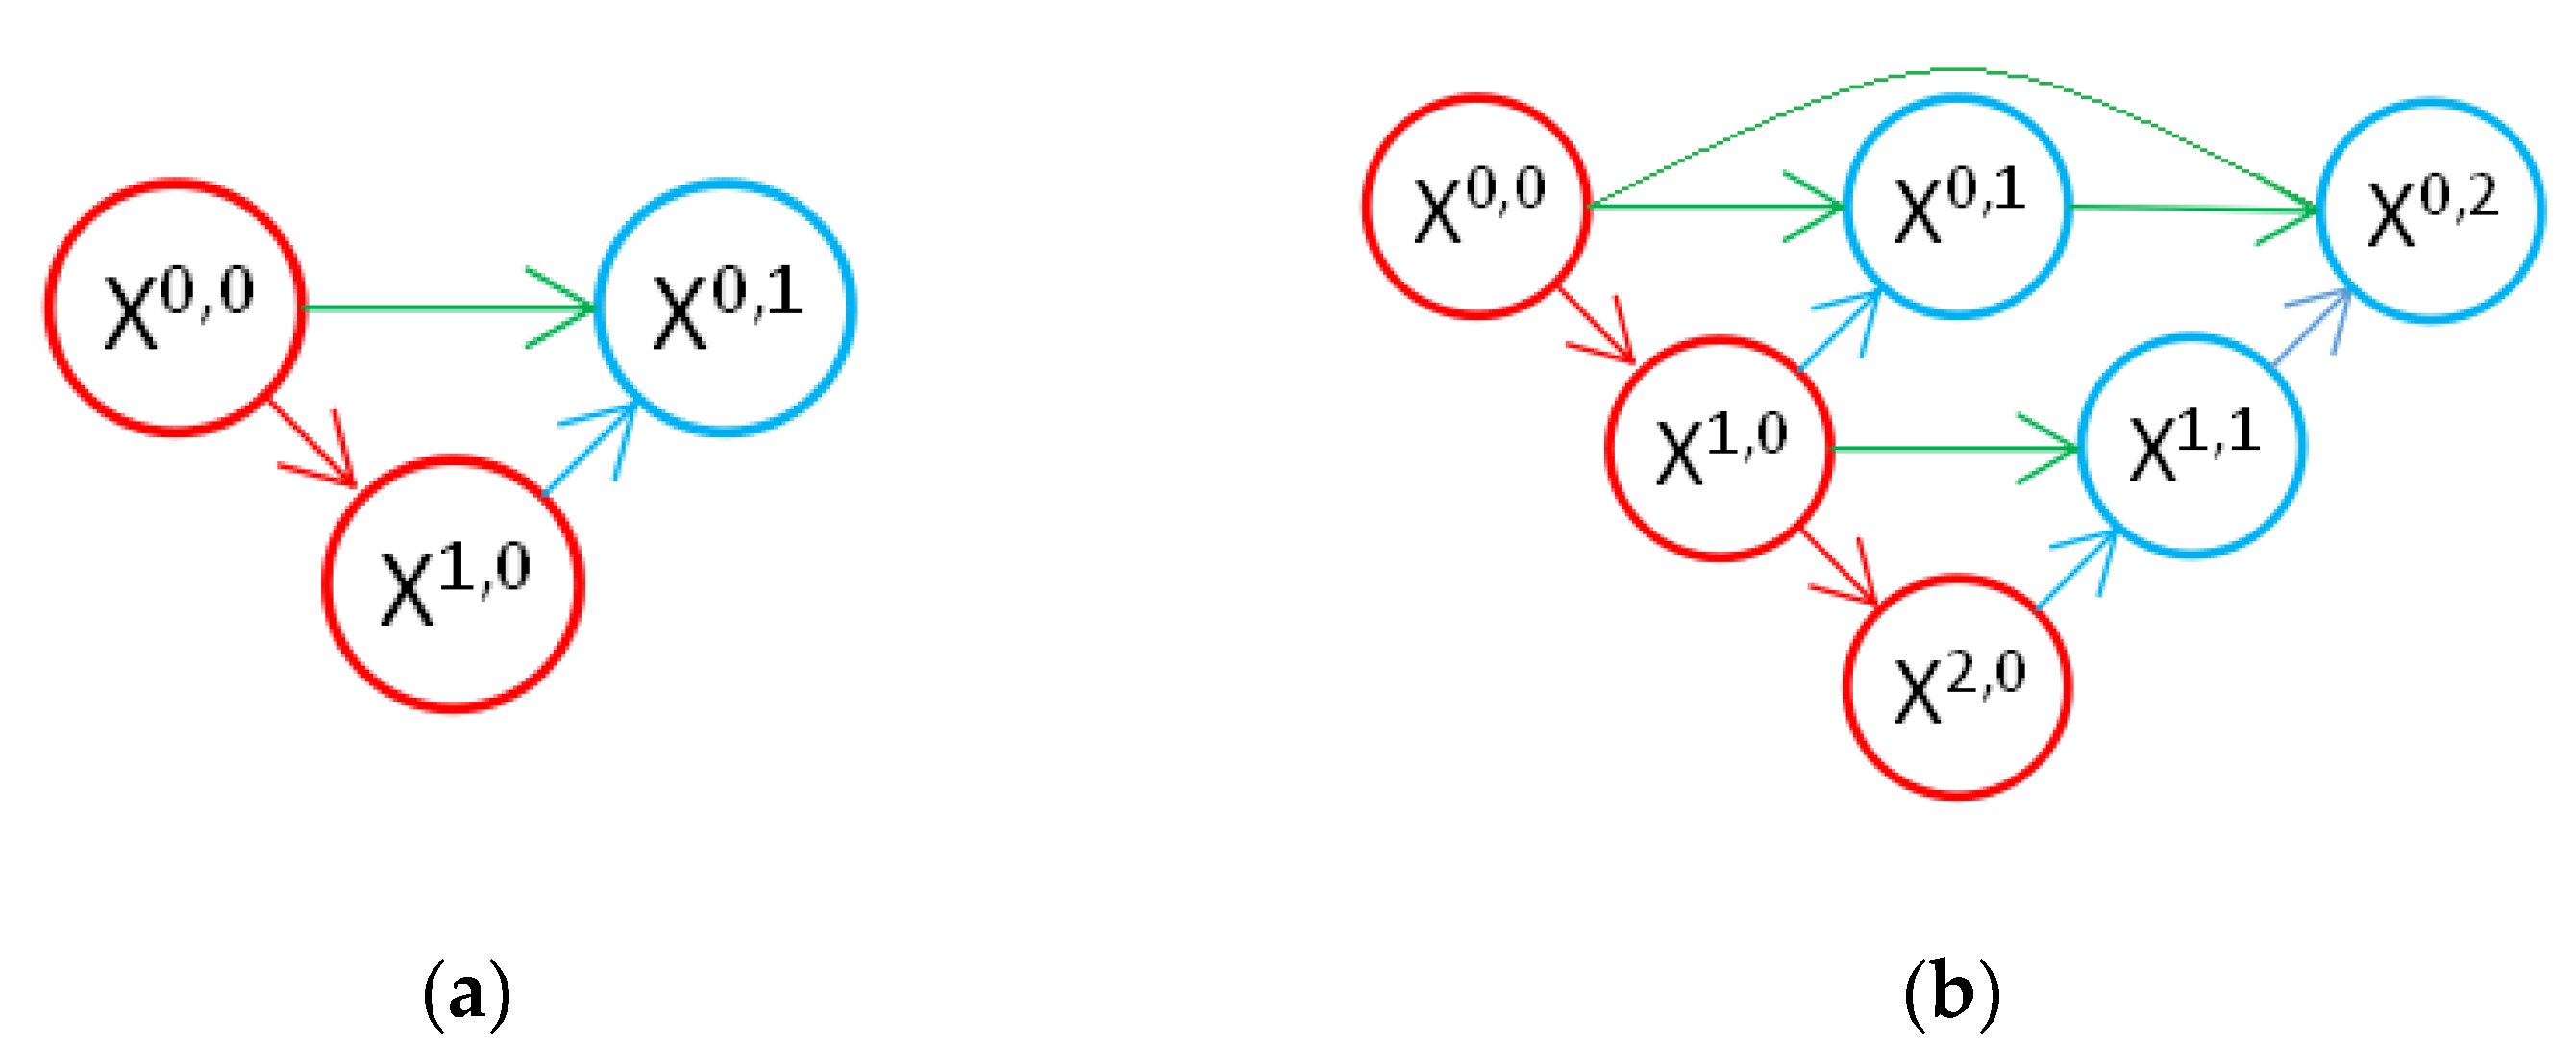
In the figure, the red part represents the original U-Net; the green and blue parts are respectively the skip connection and up-sampling parts of u-net + +, which are different from u-net; and the black part indicates the depth supervision. As can be seen from the figure, U-Net++ starts from the encoder sub-net or backbone network by the decoder sub-net. The redesigned skip connection of the pathways transforms the connectivity of the encoder and decoder sub-networks. In U-Net, the feature map of the encoder is directly received in the decoder, while they go through a dense convolutional block in U-Net++, and the number of convolutional layers depend on the pyramid level. Both the first and the second layer’s structure diagrams of the network are shown in Figure 4:
From Equation (1), the skip pathways are as follows. Let x(i,j) represent the output of this layer, i refer to the down-sampling layer along the encoding direction, and j refer to the dense convolution layer along the skip path direction. This pile of feature maps is represented by x(i,j), and the calculation is shown in Equation (1):
x ( i , j ) = { H ( x ( i 1 , j ) ) , j = 0 H ( [ [ x ] ( i , k ) ] k = 0 j 1 , U ( x ( i + 1 , j 1 ) ) ) , j = 1
where the function H(·) is a convolution operation, an activation function U(·) represents an up-sampling layer, and the bracket [ ] represents a cascade layer.
Essentially, the dense convolutional blocks make the semantic level of the encoder feature map closer to the feature map required in the decoder. Assuming that the received encoder feature map is semantically similar to the corresponding decoder feature map, the optimizer will become an easier optimization problem.
In terms of loss function, the combination of binary cross-entropy and Dice coefficient is referred to as the loss function, as shown in Equation (2).
L ( Y , Y ^ ) = 1 N b = 1 N 1 2 Y b log ( Y ^ b ) + 2 Y b Y ^ b Y b + Y ^ b
where Y ^ b and Y b respectively represent the flattening prediction probability and flattening basic fact of the b image, and N refers to the batch size.
Due to the nested skip path, U-Net ++ forms a full-resolution graph at multiple semantic levels [25], which can be deeply supervised, enabling the model to run in two modes: (1) precise mode, where the output is averaged from all split branches, and (2) fast model, where the final segmentation graph only selects one of the split branches; this selection determines the degree of model pruning and speed gain, and is simplified during prediction.

2.2. The Proposed Method

2.2.1. Data Augmentation

Through flipping, cropping, panning, and rotating operations, the data will be expanded from 110 images to 1100 images, which could improve the generalization and robustness ability of the model.

2.2.2. The Improved U-Net++ Network

U-Net++ has the outstanding improvement in feature transmission and combination of deep and shallow layers, but there is no improvement in feature extraction. There are some diverse edema regions whose features may lose. In order to extract edema features better and improve segmentation effects, this paper conducted a two-stage optimization improvement on the U-net++ and the backbone network part. First of all, due to the residual block design of the Residual Network (ResNet), the network will not degrade with the deepening of the layer, and thus it is more suitable as a backbone network than other networks. Then, the selected ResNet backbone network was further improved in the two aspects of information flow through the network and shortcut, so that the segmentation accuracy of the model in the diverse edema region was improved.
There are many networks that can be selected as the backbone, such as VGGNet, ResNet, DetNet, and DenseNet. Among them, ResNet is a powerful convolutional neural network (CNN) architecture [26]. Its main structure is several ResBlocks (residual block). The specific design of the ResBlock can solve the problem of network degradation caused by the deepening of the network, making thousands of layers of networks possible, and has been widely used in various tasks. In this paper, after optimization and comparison, the ResNet was used as the backbone of U-Net++ to achieve the best results.
Table 1 lists the ResNet structure of 34 layers and 101 layers. It is shown that the network structure can be divided into two parts, five main Conv layers (including ResBlocks) and an end phase. In the five main phases, each Conv layer contain several blocks except Conv1. The ResNet34 network’s Conv2 layer has three ResBlocks, Conv3 has four ResBlocks, Conv4 has six ResBlocks, and Conv5 has three ResBlocks.
As shown in Figure 5, this proposed method uses ResNet’s Conv1, Conv2, Conv3, Conv4, and Conv5 as U-Net++’s backbone, instead of X(0,0), X(1,0), X(2,0), X(3,0), and X(4,0), and changes all 3 × 3 × n to 7 × 3 × 64 convolutional blocks that are used for feature extraction, ensuring the receptive field of the last encoder block includes the entire retinal region. The 1 × 1 × n convolution block becomes 1 × 1 × 64. The improved network will significantly improve the segmentation effect of macular edema, compared with the previous U-Net++. The second step of improvement is to learn from ResNeSt [27], which is the latest network proposed in April 2020, which makes ResNet trainable network reach more than 3000 layers and has improved accuracy. The ResNeSt network has made the following improvements [27].
(1) Improved information flow through the network.
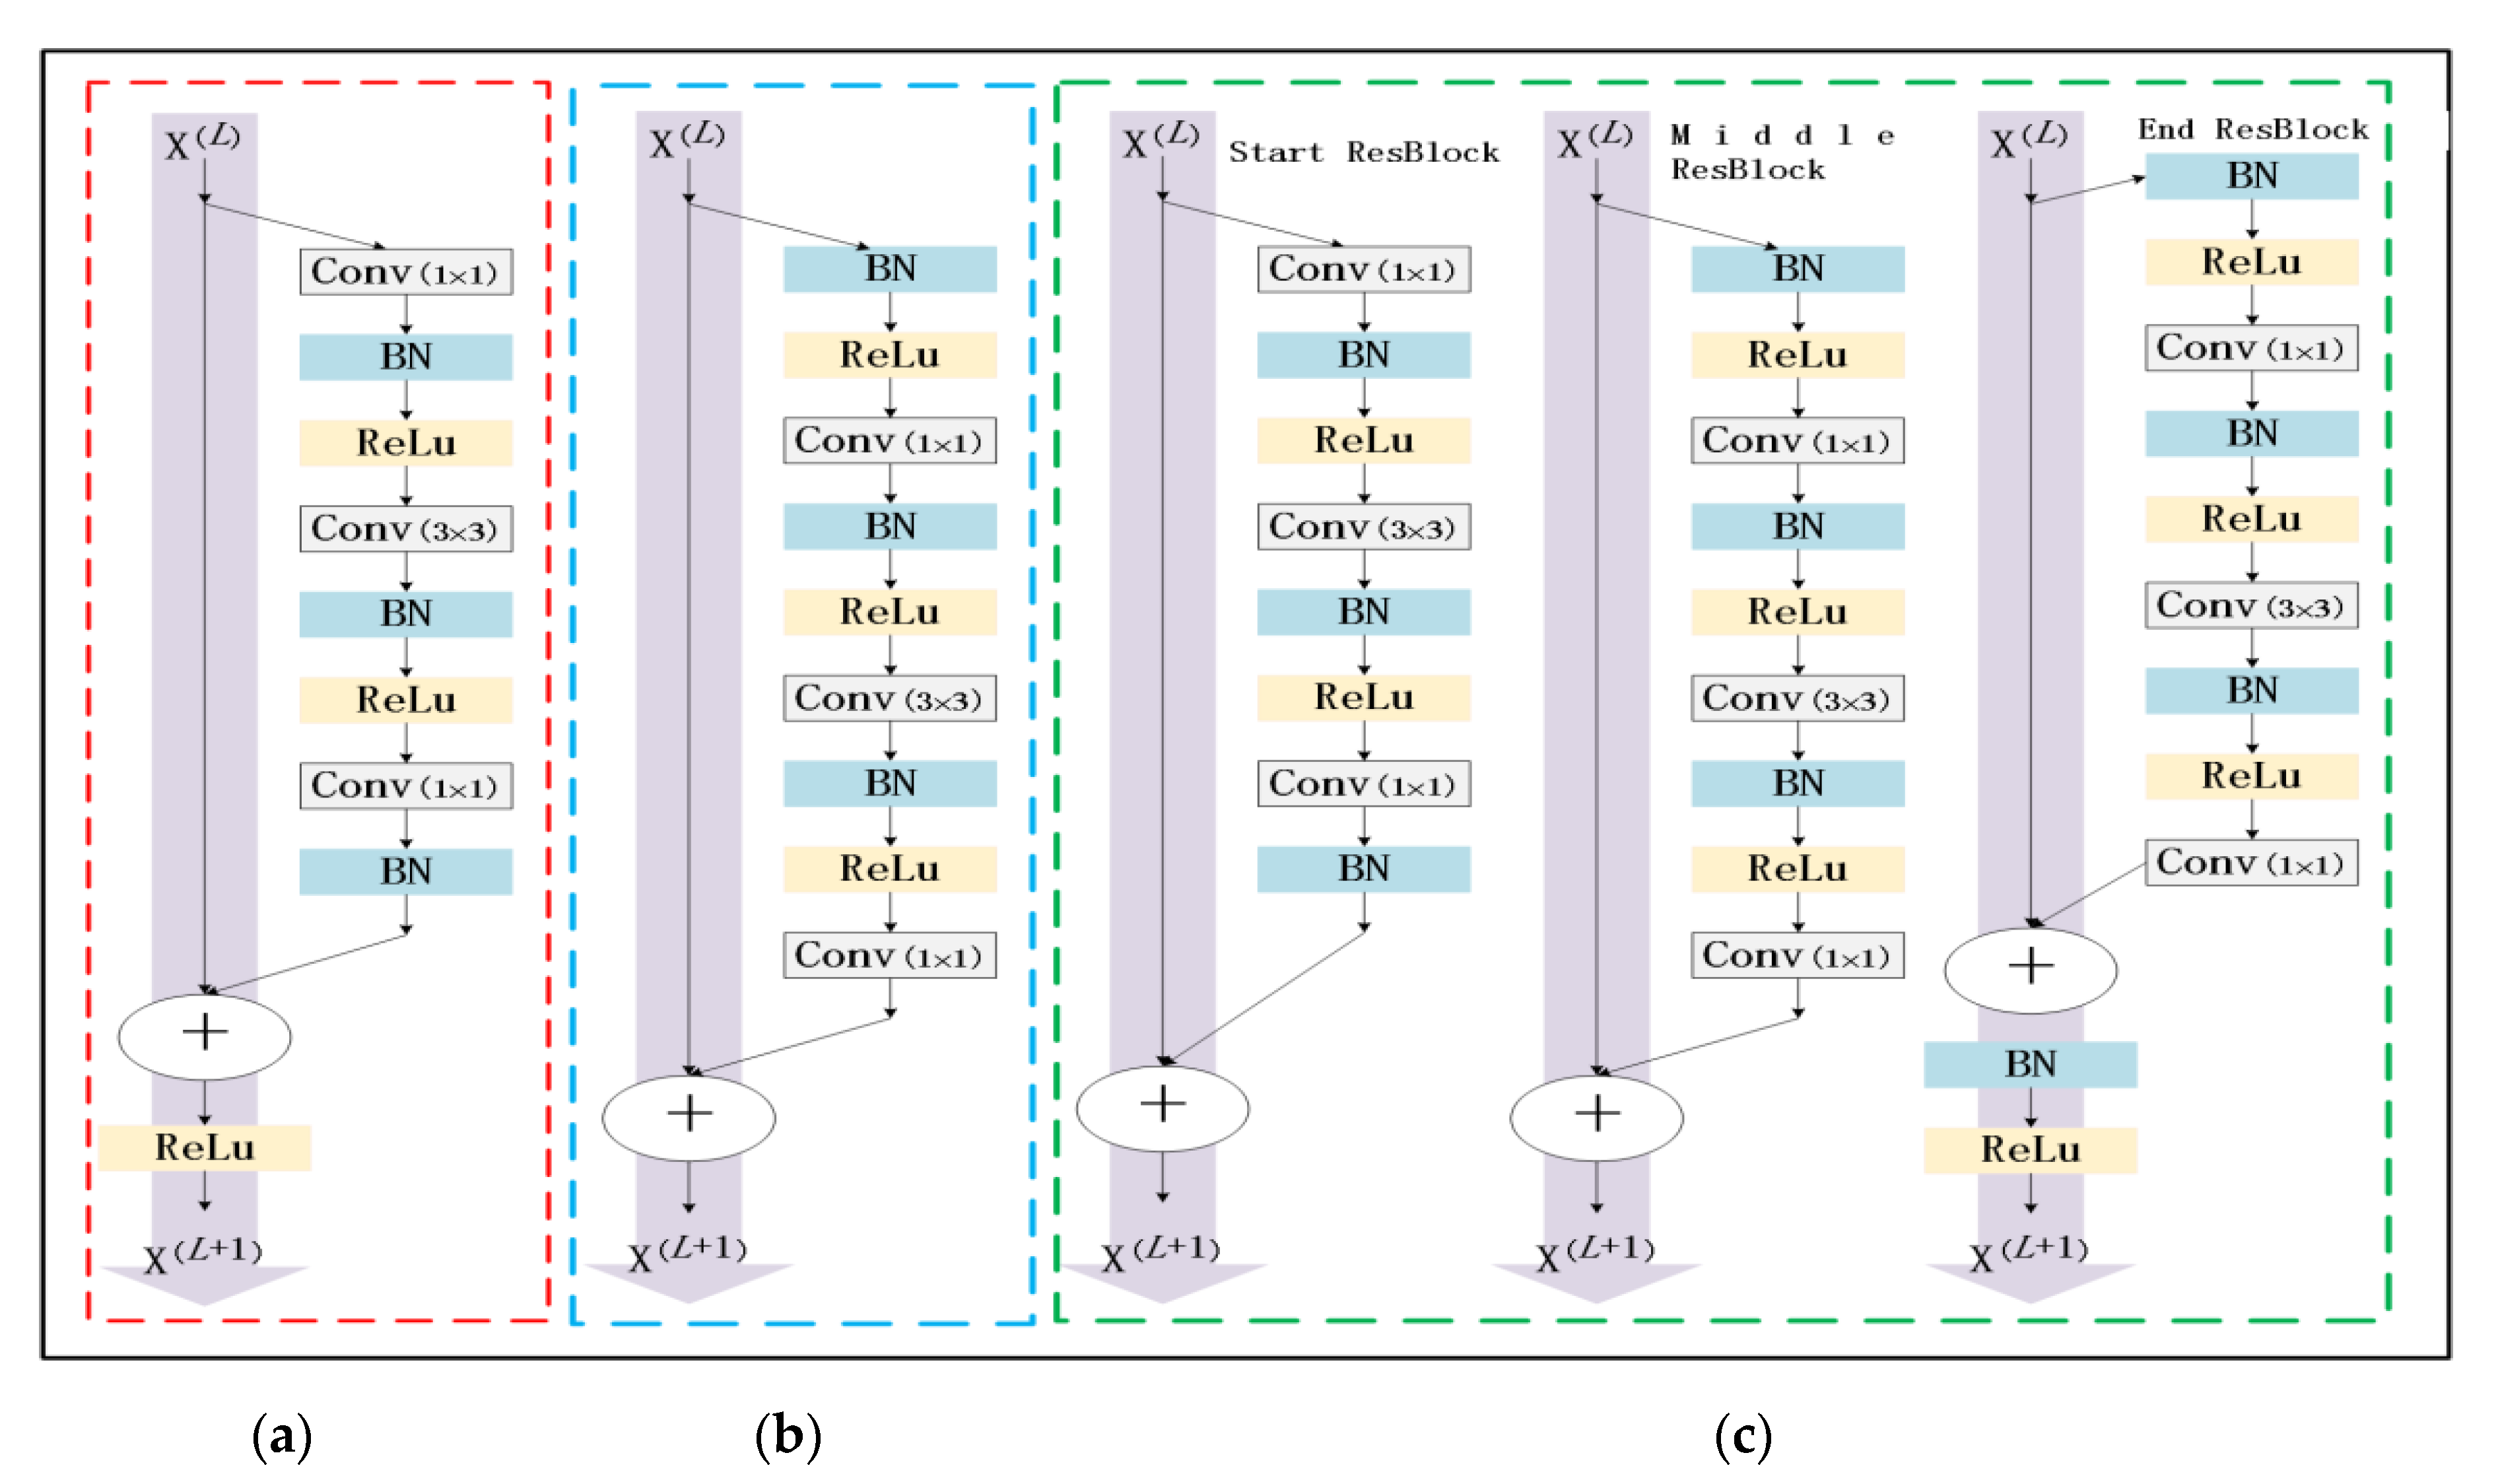
As shown in Figure 6a, the main structure of ResNet is ResBlock block. Each ResBlock contains two 1 × 1 and one 3 × 3 convolutions, and then three ReLU layers are added. The large gray arrow represents the direct connection of information; there is also a ReLU activation layer on the main channel of the gray arrow. The ReLU at this position will clear the negative weight, especially at the beginning of training, because there will be a large amount of negative weight, and thus the ReLU will have a negative impact on information transmission. To solve this problem, the pre-activation [28] is proposed by an improved method, as shown in Figure 6b. By changing the positions of BN and ReLU, the ReLU is removed in the straight connected path, and placed in the ResBlock. However, this method increases the learning difficulty, the lack of non-linearity between blocks, and limits the learning ability.
ResNeSt solves the above problem by segmenting the network structure. Taking ResNet-50 as an example, as shown in Figure 6c: ① divide the network structure into three parts, four main stages (Conv2-5), one start (Conv1), and an ending phase (ending); ② each stage in the four main stages can contain several Blocks, and each stage is divided into three parts: one start ResBlock, several middle ResBlocks, and one end ResBlock. According to the different positions of the stage, each ResBlock has a different design.
(2) Improved projection shortcut.
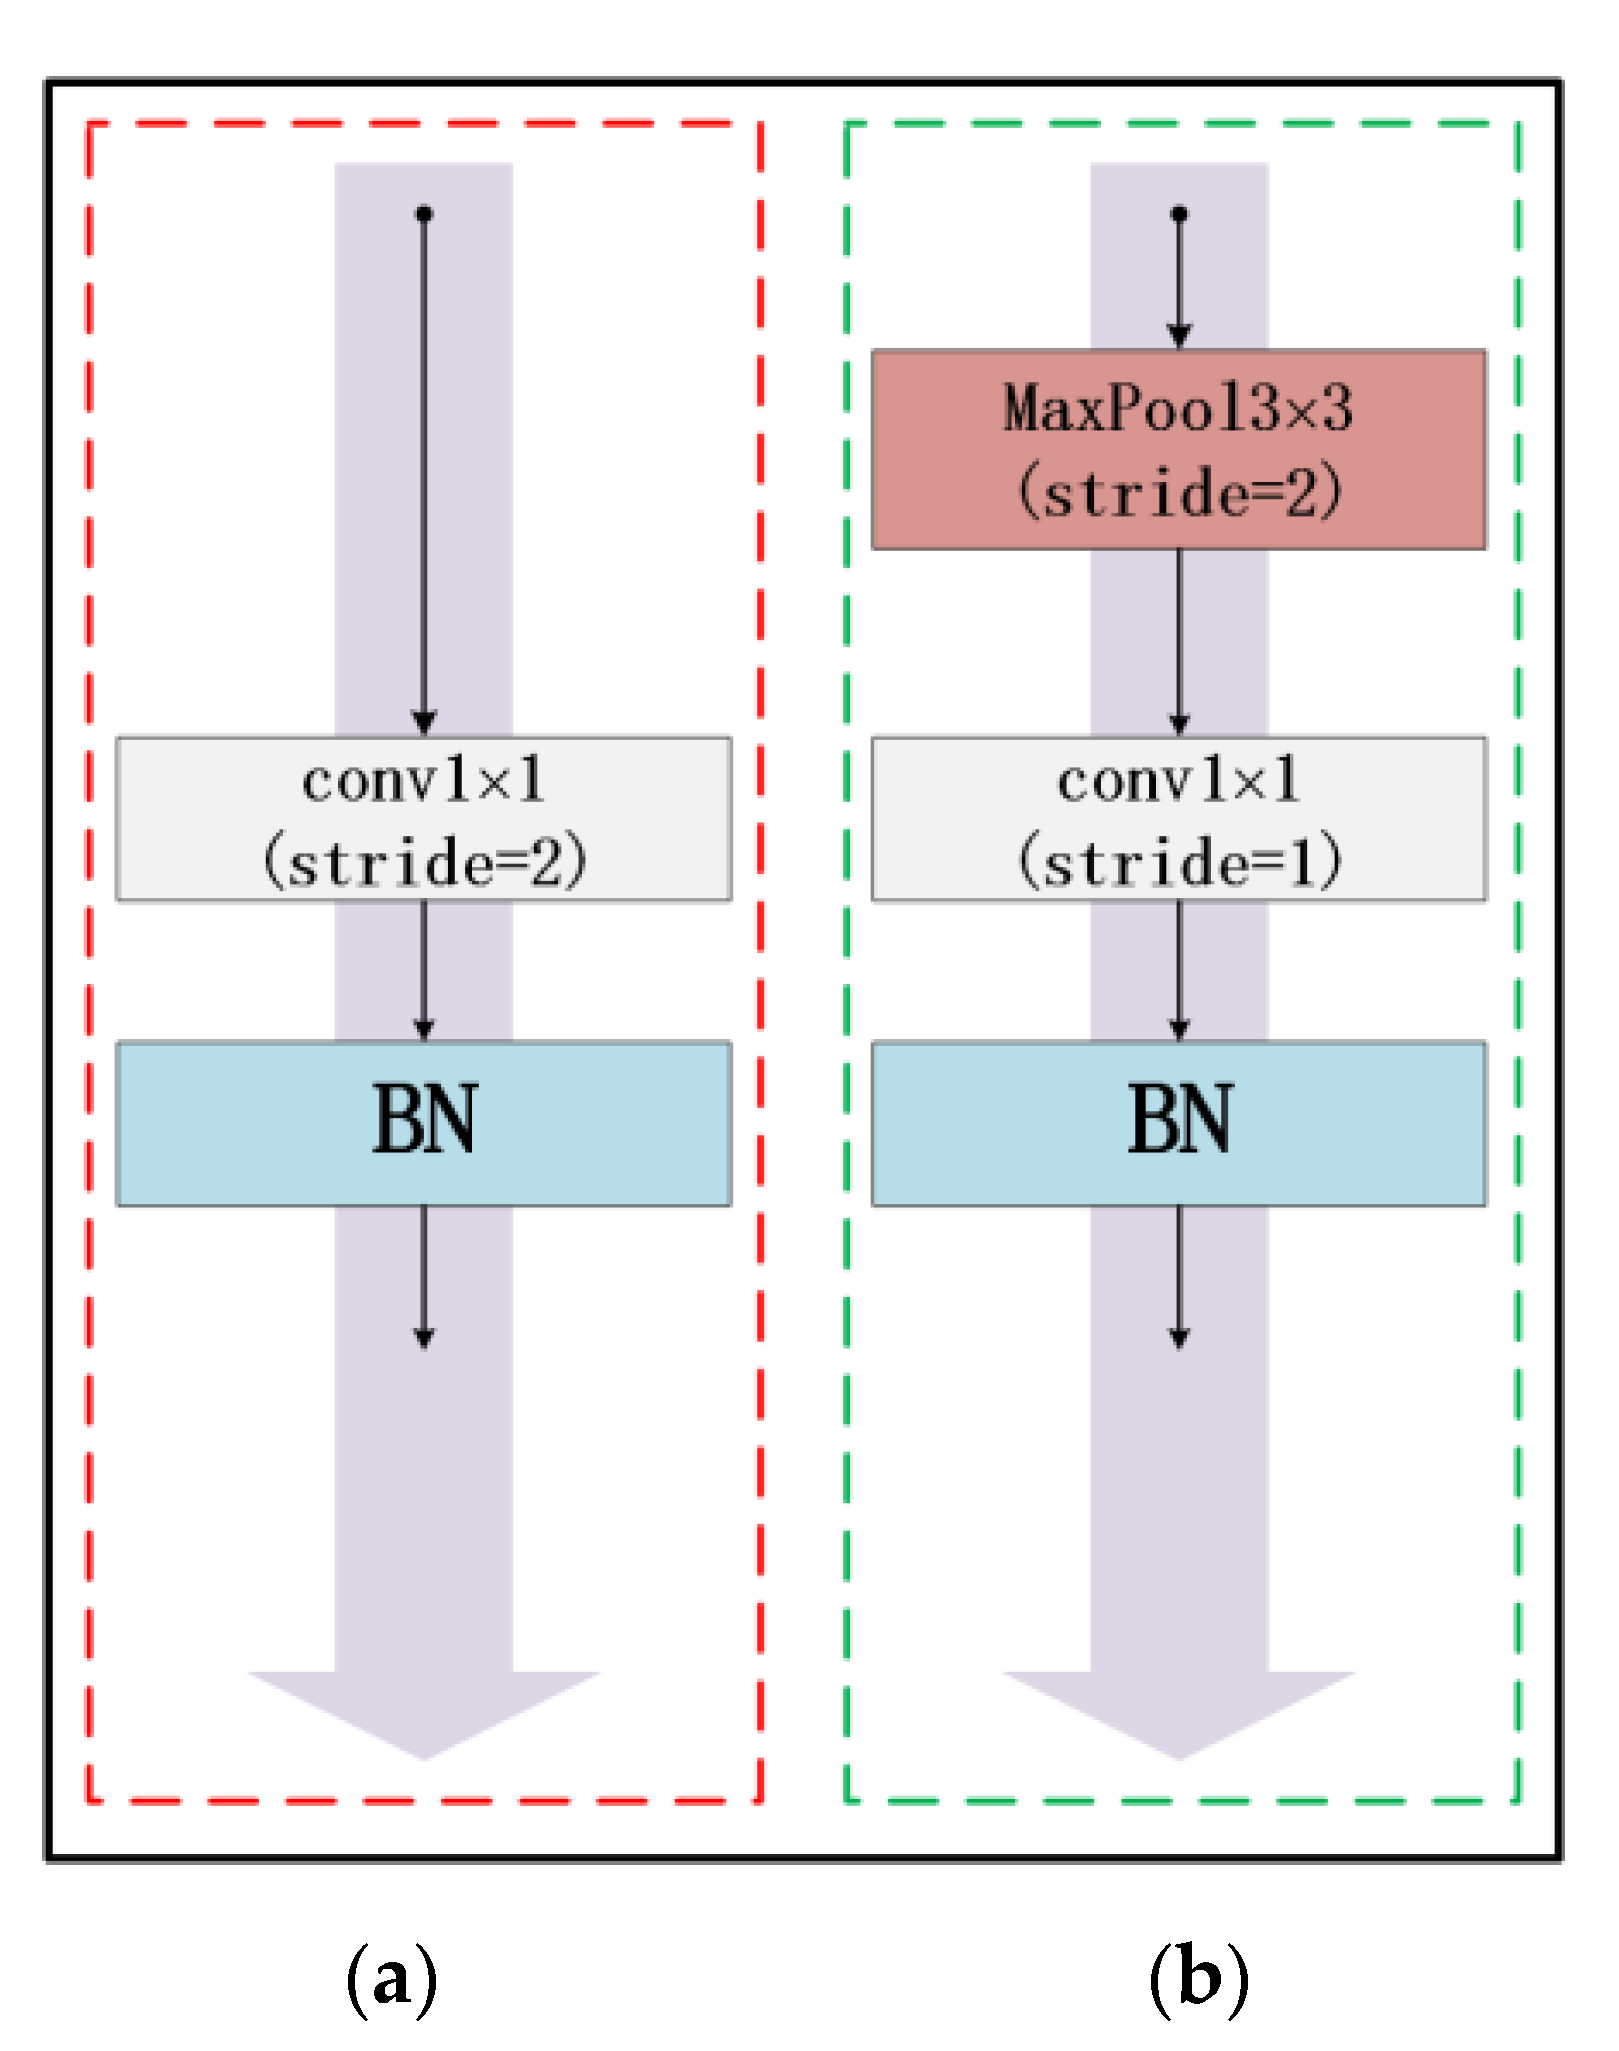
In the original ResNet architecture, as shown in Figure 7a, if the superior input x and output dimensions do not match, a 1 × 1 convolution with a step size of 2 is used to adjust the dimensions, and thus both channel and spatial matching information can be achieved by the 1 × 1 convolution. However, the architecture will lose 75% of important information, and the remaining 25% of the information will not have meaningful screening criteria. It also introduces noise and causes information loss, which will negatively affect the main channel flow information.
As shown in Figure 7b, ResNeSt considers all information from feature mapping. ResNeSt first uses the 3 × 3 max pooling layer of stride = 2, then uses 1 × 1 convolution of stride = 1 for channel projection, connecting with BN and finally selecting the element with the highest activation degree in the next step in order to reduce information loss.

2.3. Morphology Opening Operation

To solve the problems of connection at small breakpoints and some unsmooth edema regions after network segmentation, this paper uses morphological operation to remove image noise, eliminate small objects, and separate target region at fine points, so that it can achieve refined segmentation results [29].
The proposed algorithm flow is shown as Algorithm 1.
Algorithm 1. The proposed algorithm.
  • Data Augmentation of dataset.
  • Input dataset in U-Net++.
  • While w has not converged do
  •    for t = 0, 1, …, n do
  •       Sample {Xi}m, {Yi}mPdata(X, Y) a batch from the dataset
  •       Gw(mce) ← ∇wLossmce(Pdata(X, Y))
  •       Gw(dice) ← ∇wLossdice(Pdata(X, Y))
  •       ww + ξ(Gw(mce) + Gw(dice))
  •    end for
  • end while
  • Output segmented OCT image.
where n represents the number of iterations, m represents the batch size, and w represents the network parameter.

3. Experimental Results

3.1. Dataset

The proposed method was evaluated on the dataset of DME (diabetic macular edema) patients published at Duke University [30]. The dataset consists of 110 SD-OCT B-scan images with a size of 512 × 740, obtained from 10 patients with DME (11 B-scans per patient). The 11 B-scans of each patient are concentrated at the fovea and five frames on each side of the fovea (fovea slice was scanned at ±2, ±5, ±10, ±15, and ± 20 on each side of the fovea slice). These 110 B-scan images were annotated for retinal layers and regions of edema by two experts. This paper used the annotations of expert 1 as the ground truth for training the network and evaluation on the proposed method.

3.2. Evaluation Metrics

The proposed algorithm uses the Dice, Iou, Recall R, and Precision P as the evaluation metrics, which are respectively shown in Equations (3)–(6). The higher the values, the better the model.
  D i c e = 2 a r e a ( S 1 S 2 ) a r e a ( S 1 ) + a r e a ( S 2 )
  I o u = a r e a ( S 1 S 2 ) a r e a ( S 1 S 2 )
  R = T P T P + F N
  P = T P T P + F P
where S1 is the edema region predicted by the network, S2 is the annotated edema region by the expert 1, TP is the true number of pixels for the predicted edemas, and FN is the number of pixels with true edemas predicted as non-edemas. FP is the number of pixels where non-edemas are predicted to be edemas.

3.3. Experimental Settings and Results

The experiment uses the open source deep learning toolbox Tensorflow1.14.0 as the framework. Firstly, we randomly selected 70% of the original dataset as the training set, 20% as the validation set, and 10% as the test set. Then, the three nonoverlapping datasets were individually expanded to 10 times by flipping, cropping, panning, and rotating operations. The training set was trained 200 times. The batch size of each training was 2, and output the Dice every two iterations. The final results were the average of five different training experiments, which repeated with different, random subsets of images to assess the robustness of the segmentation performance.
The segmentation results of the proposed method were compared with expert 2 and two recent methods on the Duke dataset. The results are shown in Table 2 and Figure 8 and Figure 9. The other two methods were FCN [11] and ReLayNet [15]. FCN is segmentation results by the full convolution neural network, and ReLayNet is segmentation results by U-Net. Table 2 summarizes the test results; the Dice score of the proposed method was 0.80, Iou: 0.78, recall: 0.84, precision: 0.80—all of which achieved the highest value. It is worth noting that there were slightly different annotations between the two experts, since expert 2 achieve the lowest score.
Figure 8 illustrates the comparison diagram of confusion matrix, which reflects the segmentation effect of each category. In each cell, both the average number of pixels and the percentage corresponds to the first row and the second row, respectively, and the diagonal is the recall of each category. It can be seen that the recall of the proposed method is increased by 2% compared to ReLayNet, and the number of pixels correctly segmentation in the edema region is 74 more than ReLayNet in each test set.
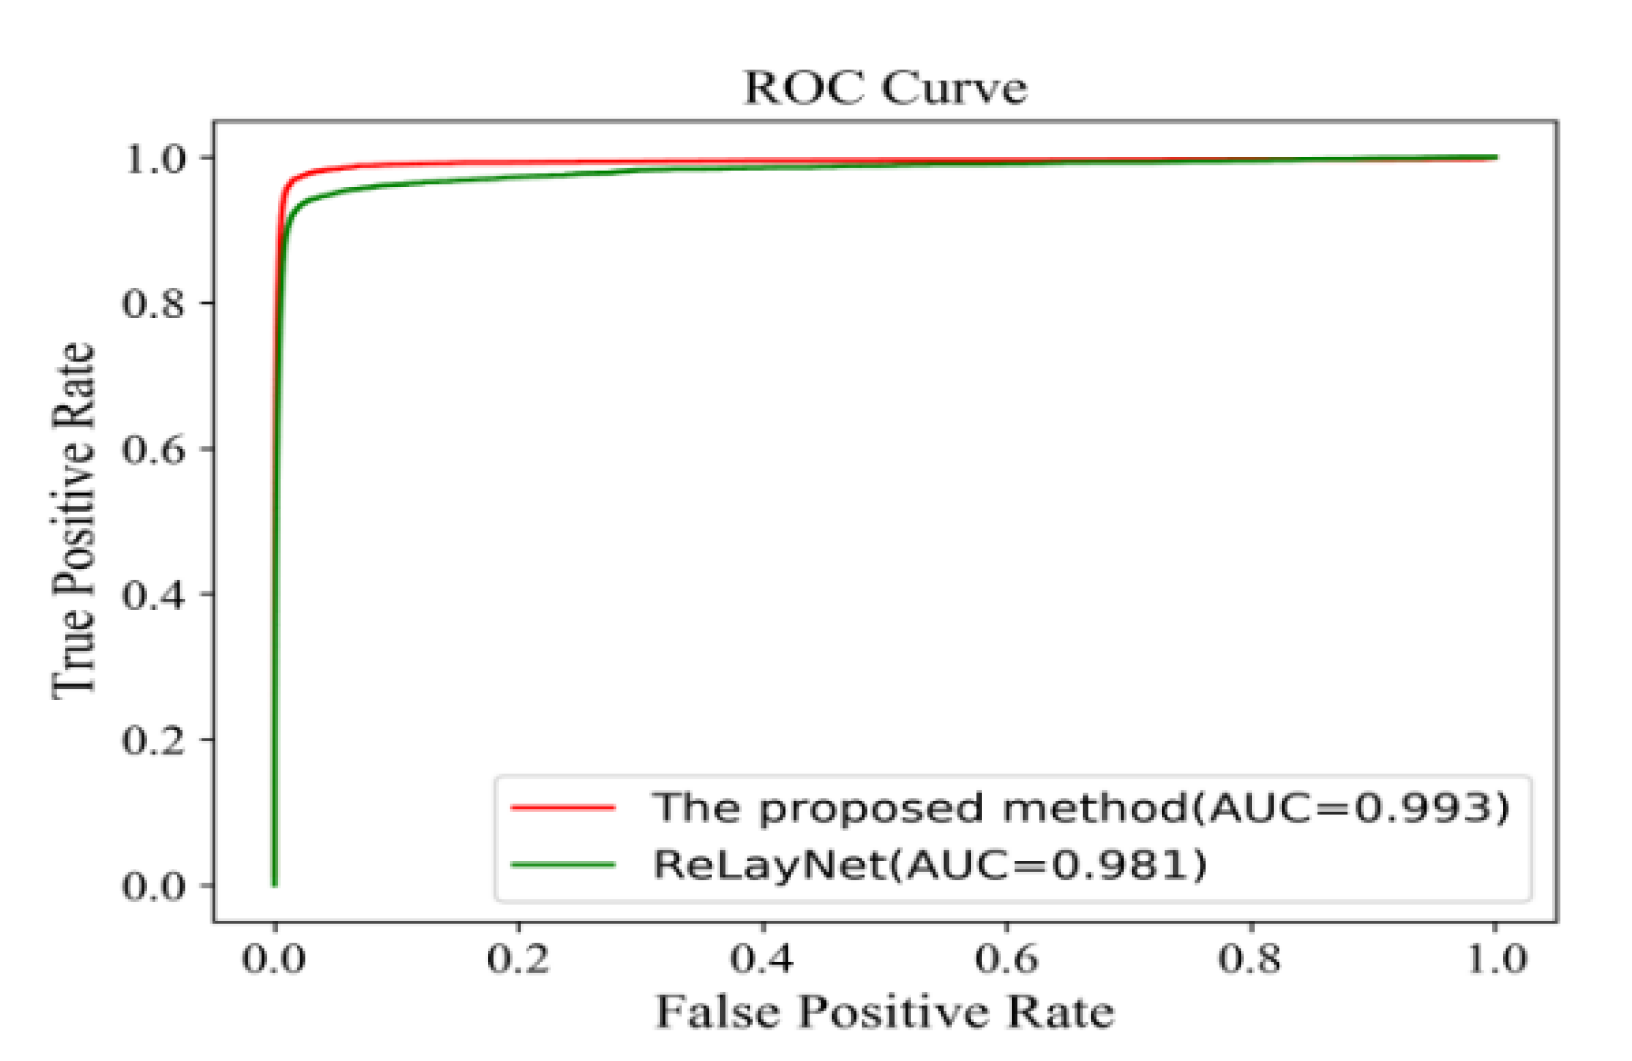
Figure 9 illustrates the comparison of receiver operating characteristic (ROC) curves. Since the dataset contains highly unbalanced classes, the coverage of macular edema is relatively small, and thus the ROC curve is used as the evaluation standard to visualize the model performance, and the area under the ROC curve (AUC) is used to evaluate the ROC curve. In Figure 9, it shows that the AUC of the proposed method is significantly better than that of the ReLayNet. The AUC of 0.993 of the proposed method was higher than the 0.981 of the RelayNet.
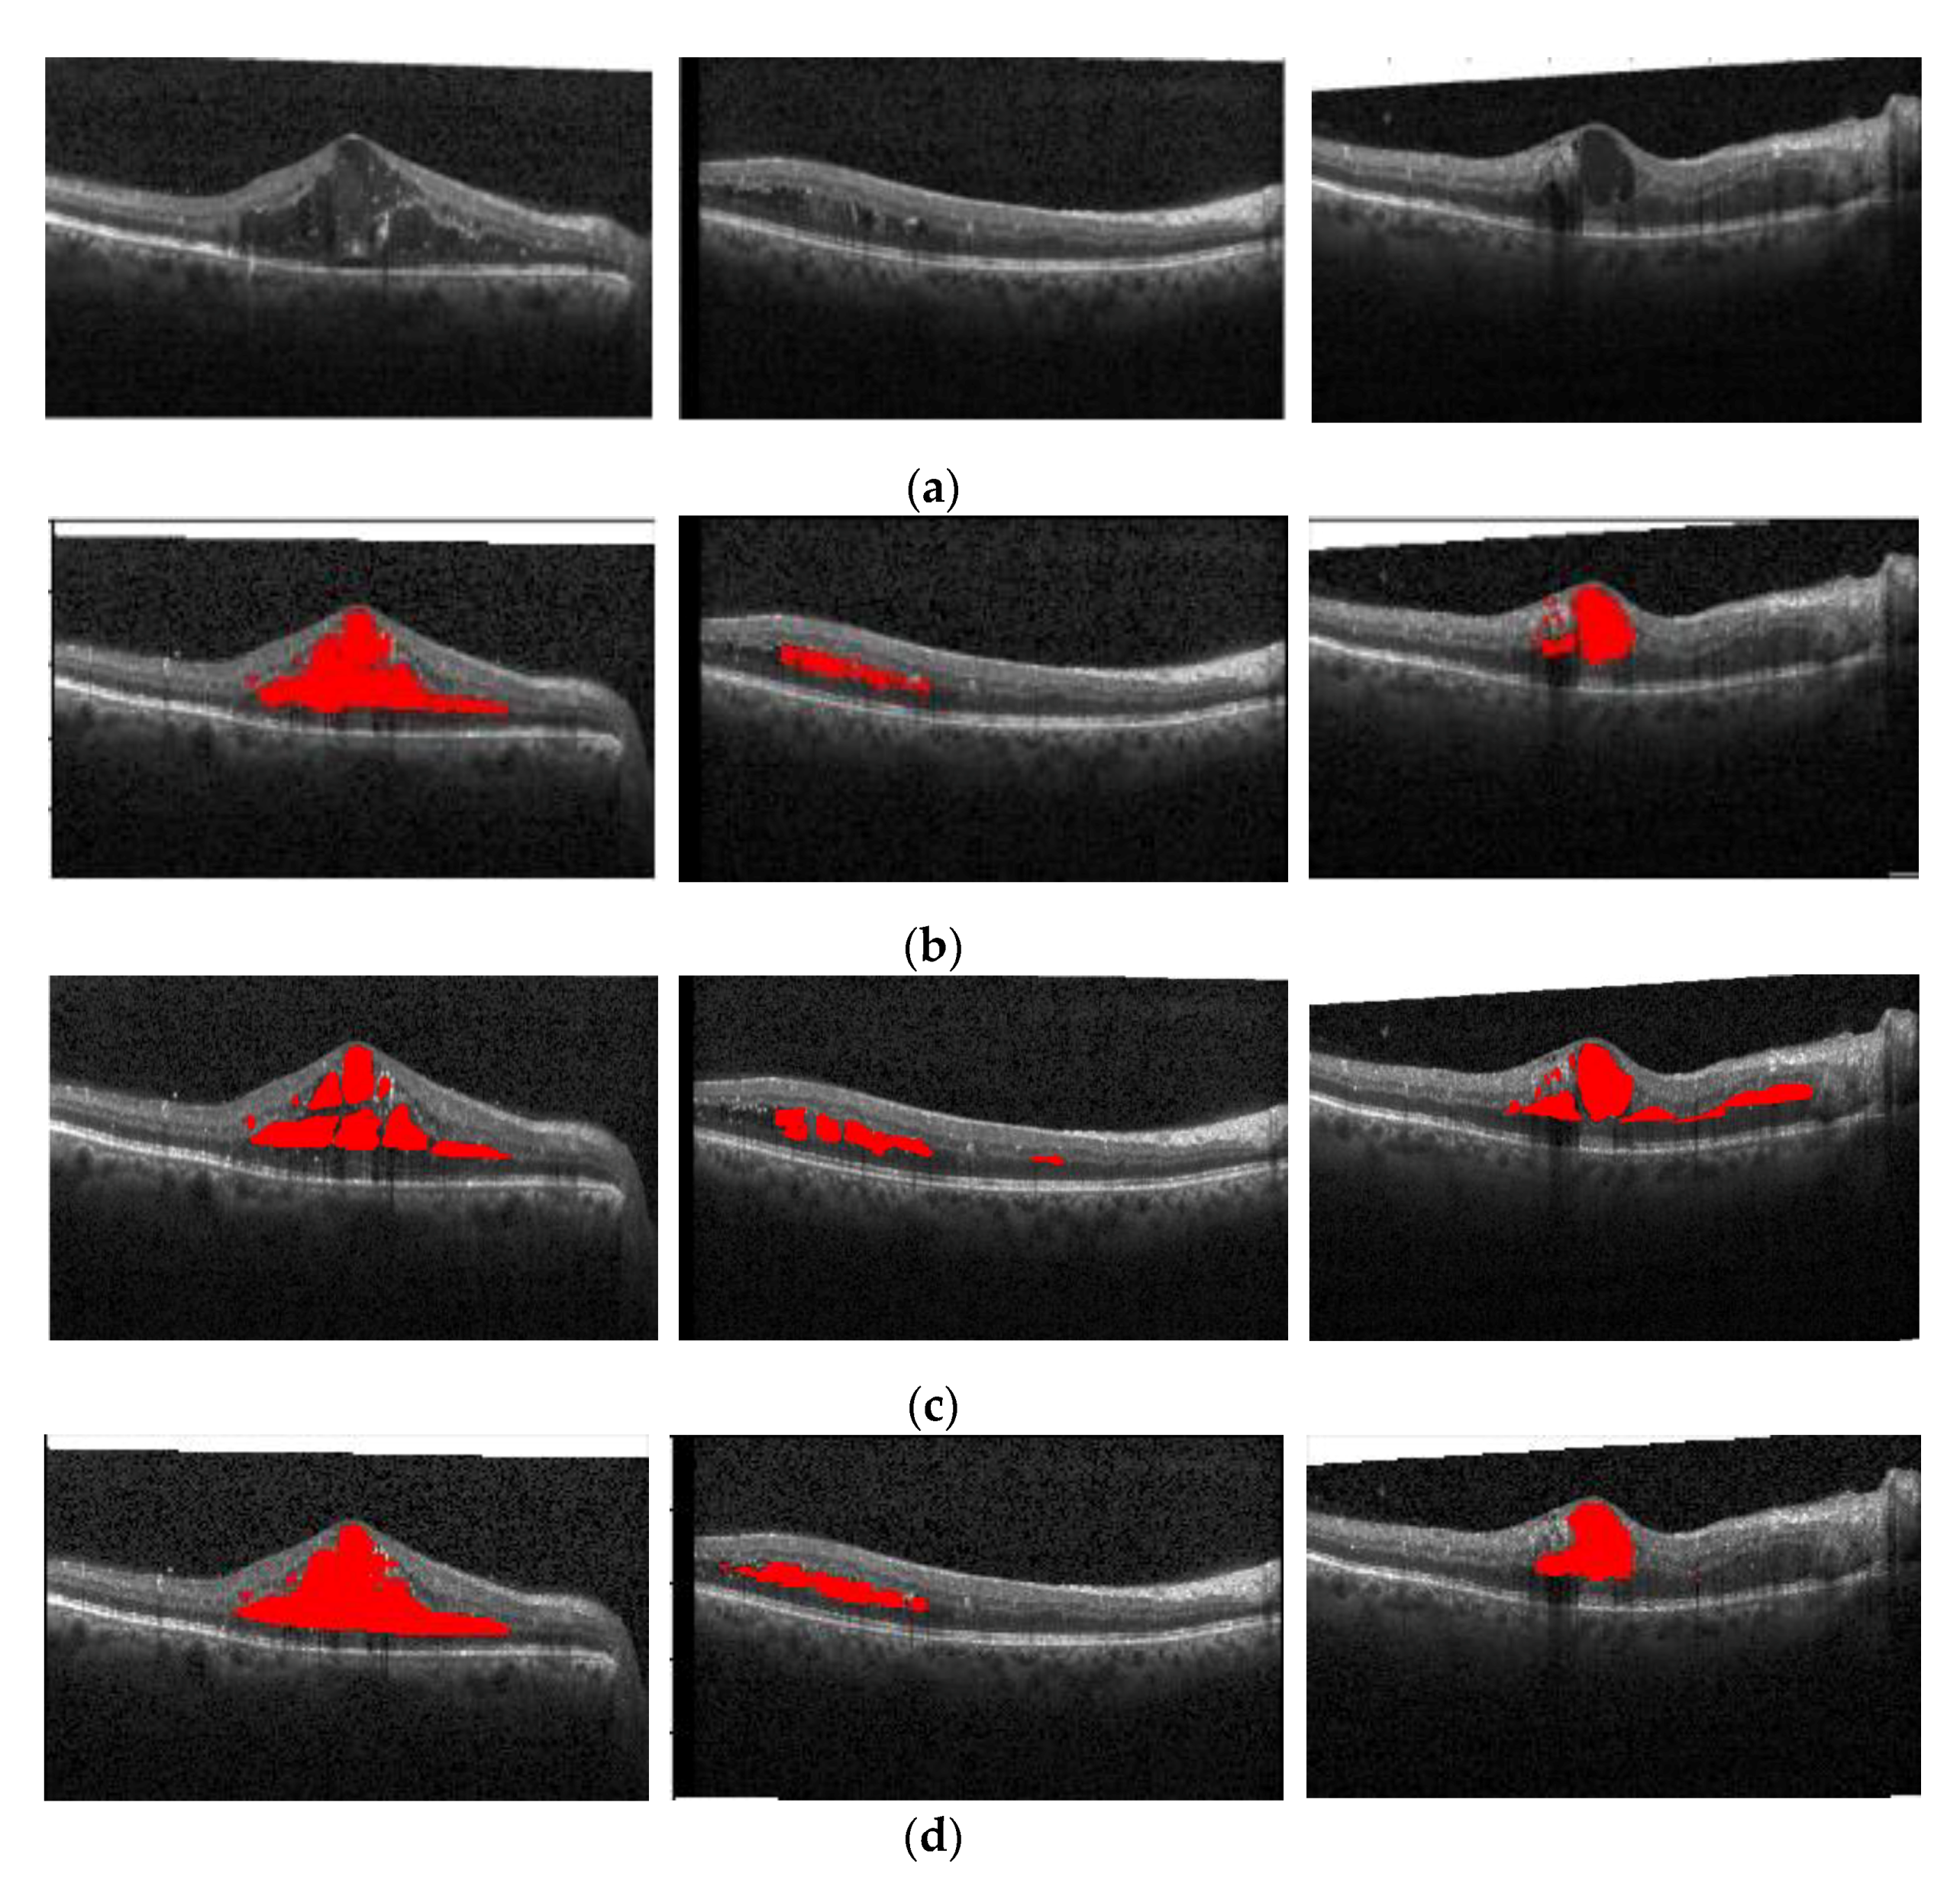
Figure 10 shows the segmentation results of the proposed method on three 2D B-scan OCT images. The first row is the original OCT image; the second row corresponds to the annotations from expert 1; the third row corresponds to the annotations from expert 2; the fourth row is the predicted segmentation by the ReLayNet; and the final row is the predicted segmentation of the proposed method, which is similar to the annotations from two experts.
The edemas’ segmentation results around fovea edema regions of the OCT images can be significantly improved due to the feature extraction improvement of the network in this paper. In this paper, 30 images of large fovea edema and 50 images of multi-regions edema were selected from the test set and were compared with the ReLayNet method on four indicators. The fovea edema’s segmentation results are shown in Table 3 and Figure 11 and Figure 12. In this paper, compared with ReLayNet, Dice, Iou, Recall, and precision were improved by 0.01, 0.01, 0.02, and 0.01 in the proposed method.
Figure 11 illustrates the quantitative comparison diagram of confusion matrix. It can be seen that the recall score of the proposed method was increased by 2% compared to ReLayNet, and the number of pixels correctly segmented in the edema region was 73 more than ReLayNet.
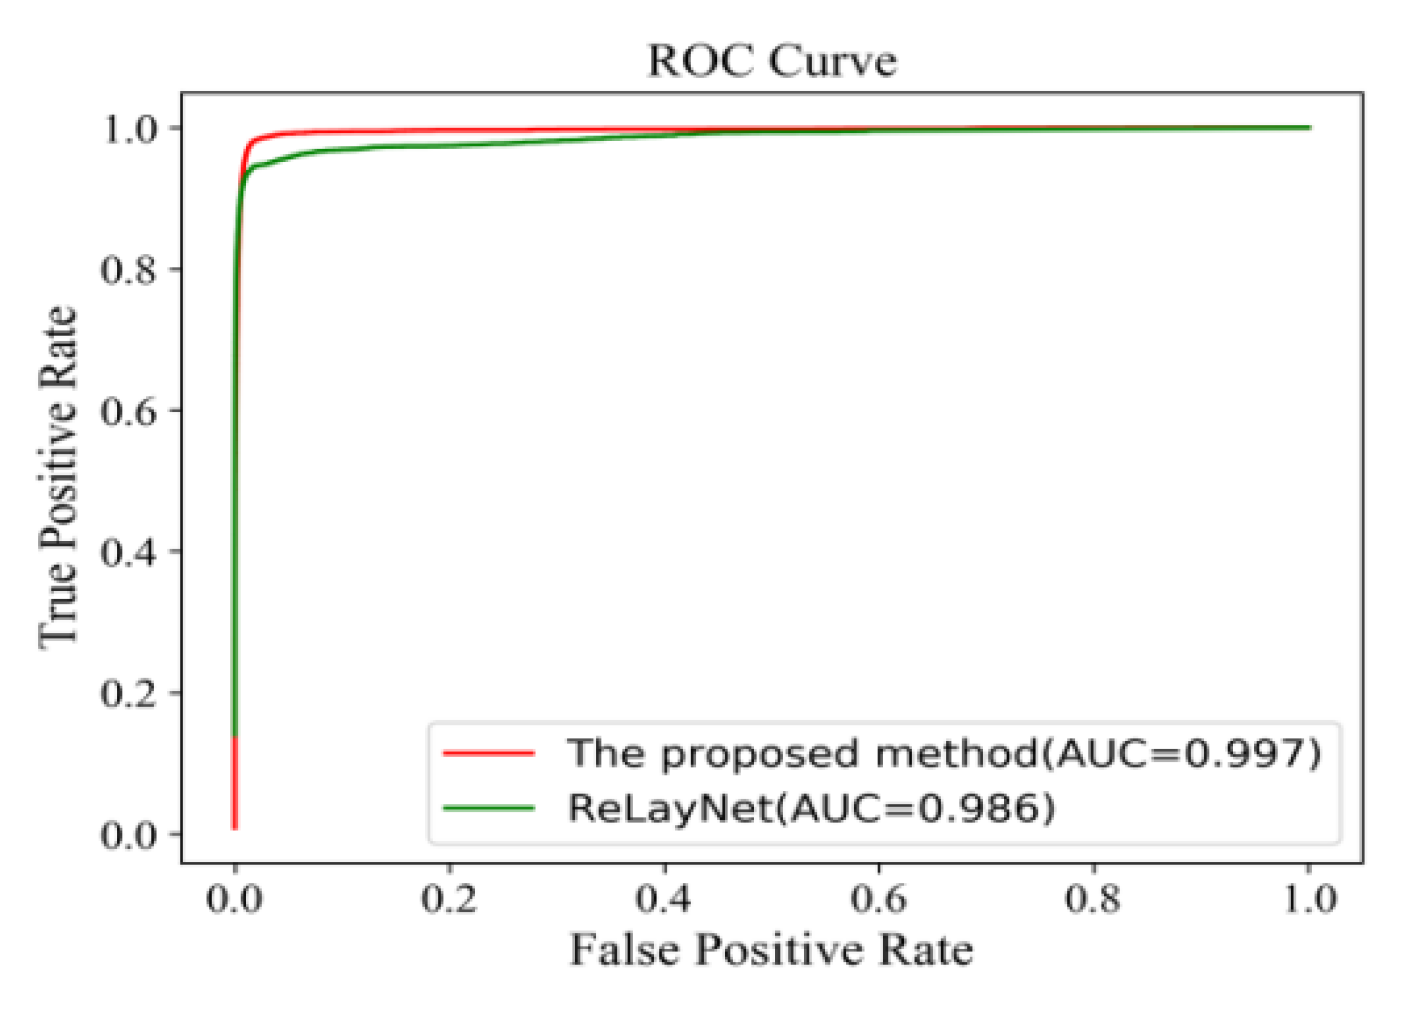
Figure 12 shows the comparison of ROC curves. The AUC value of 0.997 of the proposed method was 0.011 values higher than ReLayNet at 0.986.
Figure 13 shows the segmentation effects of the proposed method and ReLayNet in two B-scan images with the fovea edema. The first row is the original OCT image, the second row corresponds to the annotations from expert 1, the third row corresponds to the annotations from expert 2, the fourth row is the predicted segmentation by the ReLayNet, and the final row is the predicted segmentation by the proposed method. In comparison, the proposed method can not only effectively predict the pixels of true edema as edema pixels, but also reduce the prediction of non-edema pixels as edema pixels, which is closer to the annotations from expert 1. On the boundary of the edema regions, the effect of the proposed method was slightly better than ReLayNet.
Since this paper is inspired by ResNeSt, the loss of features in the transmission process were reduced, which made the proposed method significantly improve the segmentation effect of diverse edemas in multi-regions. In this paper, 50 images were selected as the test dataset, with diverse edemas in multi-regions, and were compared with the ReLayNet method and expert 2 on four indicators. The comparison results are shown in Table 4 and Figure 14 and Figure 15. The proposed method effectively upgraded to 0.79, 0.78, 0.83, and 0.82 in the four indicators and was much better than the ReLayNet method and expert 2 for diverse edemas in multi-regions.
Figure 14 illustrates the quantitative comparison diagram of confusion matrix. It can be seen that the recall of the proposed method was increased by 4% compared to ReLayNet, and the number of pixels correctly segmented in the edema region was 157 more than ReLayNet in the test set.
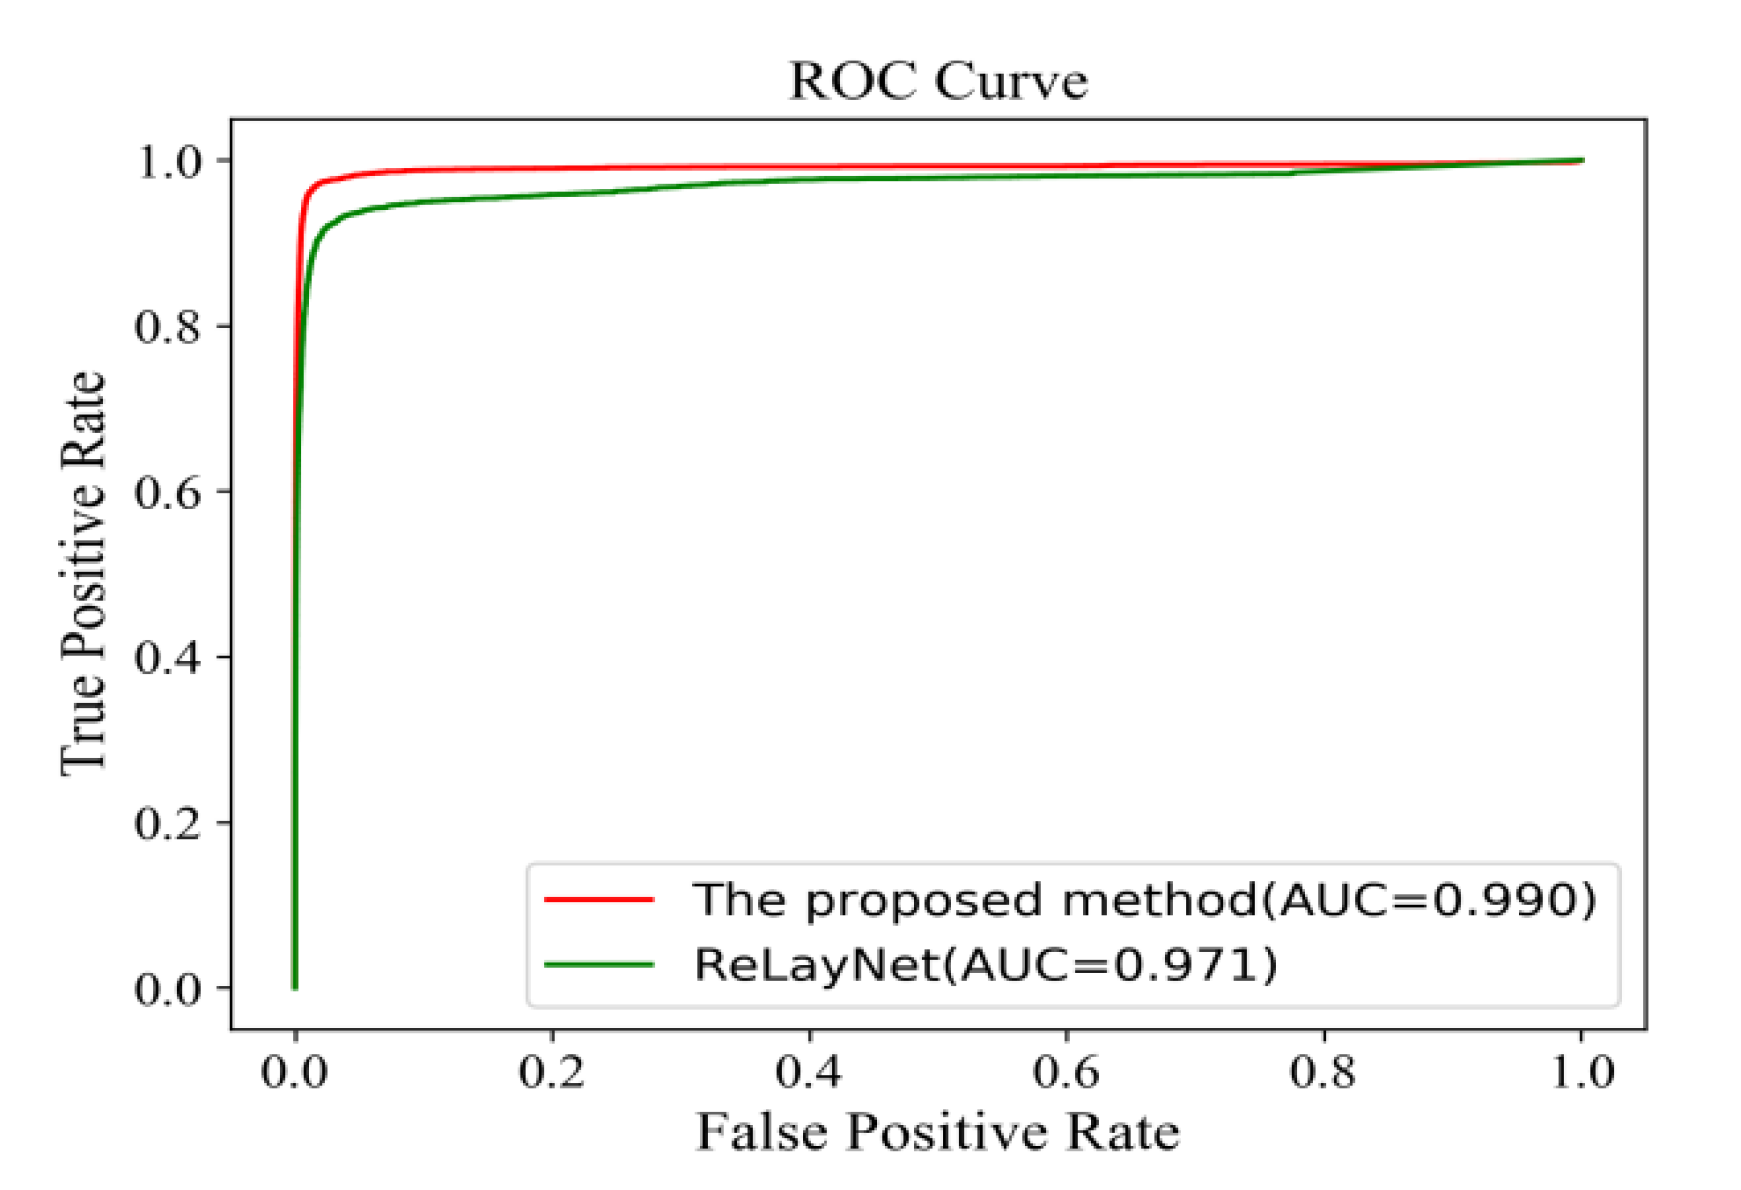
Figure 15 shows the comparison of ROC curves. The AUC value of 0.990 of the proposed method was 0.019 values higher than that of ReLayNet at 0.971.

4. Discussion

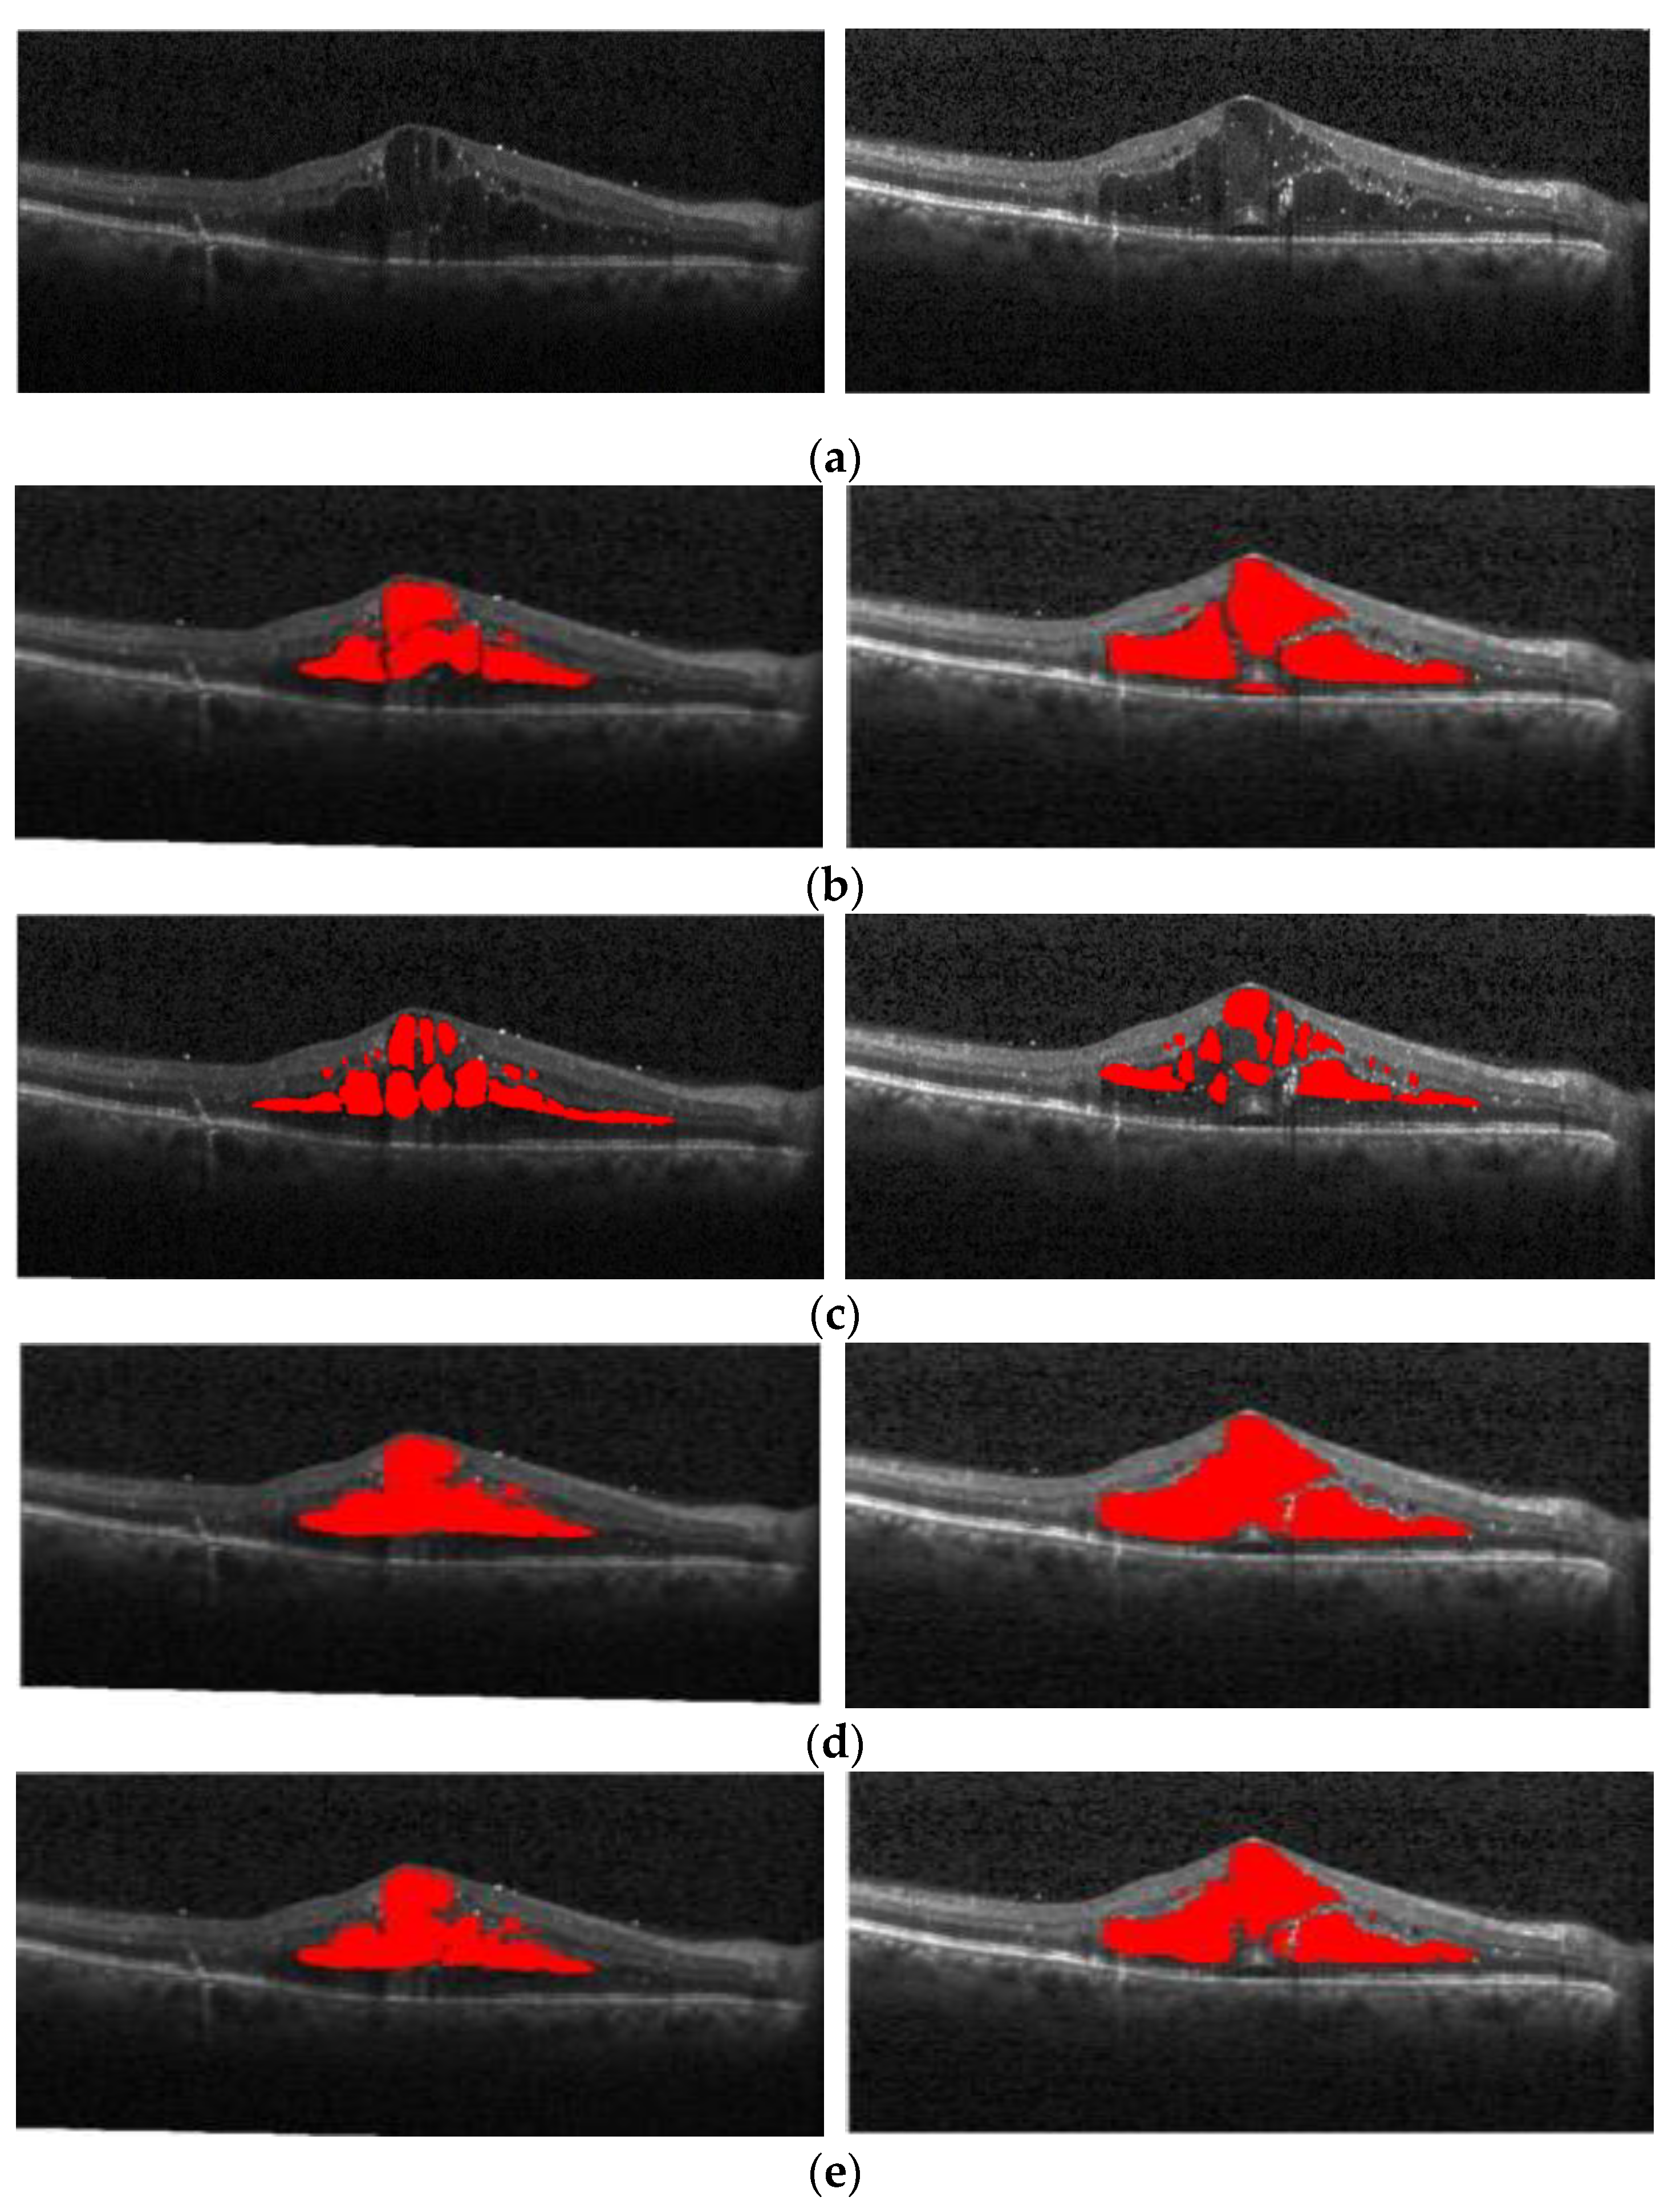
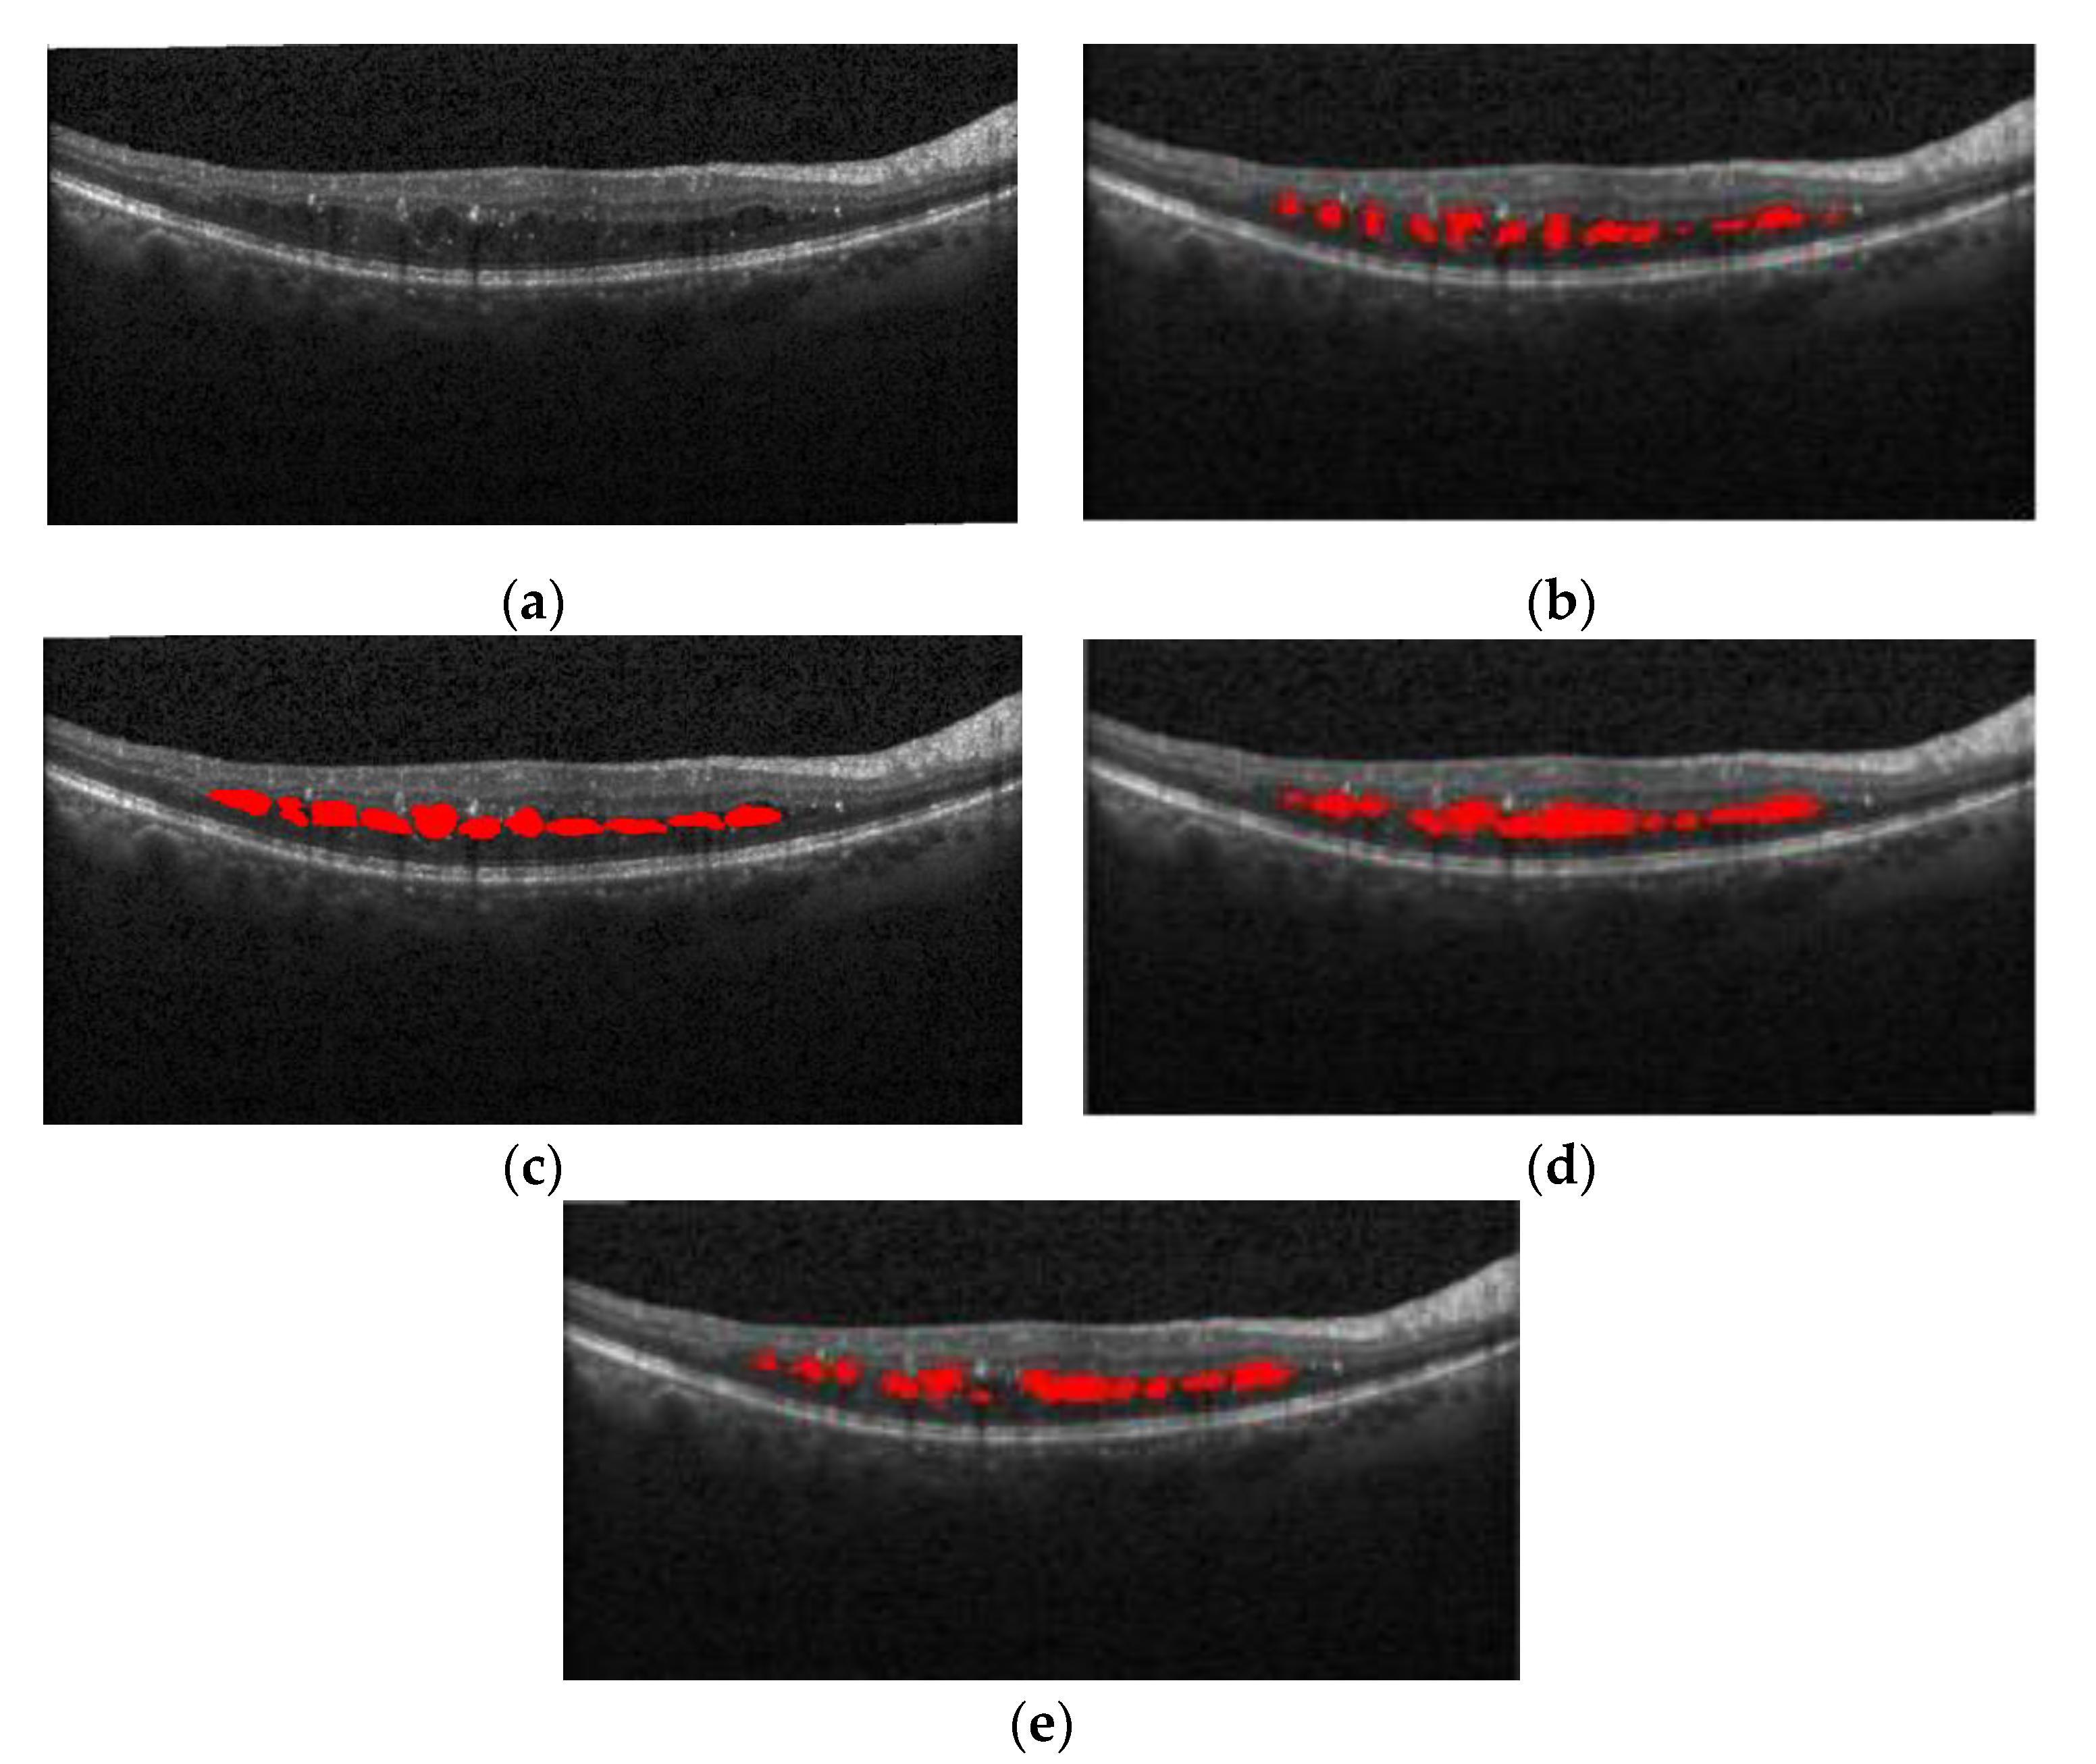
In terms of diverse edemas in multi-regions, Figure 16 shows the segmentation effect of the proposed method and ReLayNet on the one B-scan image. Figure 16a is the original OCT image, Figure 16b corresponds to the 13 annotated edema regions from expert 1, Figure 16c corresponds to the 11 annotated edema regions from expert 2, Figure 16d shows the only seven predicted edema regions by the ReLayNet, and Figure 16e shows the 11 predicted edema regions by the proposed method. Compared with ReLayNet, the proposed method had obvious advantages in the segmentation of multi-regions edema. It could better identify and segment diverse edema regions, and the merged situation of edema regions was reduced.
For diverse edemas in the multi-region, by the above 50 B-scan test images, Table 5 shows the average absolute error of the number for edema regions between expert 1 and the expert 2, expert 1 and ReLayNet, and expert 1 and the proposed method. In comparison, the results show that the proposed method achieved the least average absolute error of 2.87 for the number of edemas, and is 1.15 and 2.30 edemas less than the ReLayNet and the expert 2, respectively.
There were some disagreements in the annotations between expert 1 and expert 2 due to their subjectivity, and thus we conducted an experiment that exchanged the two expert roles, namely, the expert 2 annotations were used as the ground truth to train and evaluate the proposed network model. The comparison of quantitative results is shown in Table 6. Compared with ReLayNet, Dice, Iou, Recall, and precision were improved by 0.02, 0.01, 0.02, and 0.01, respectively, in the proposed method. The experiment demonstrated that the proposed method in this paper has a good generalization ability.
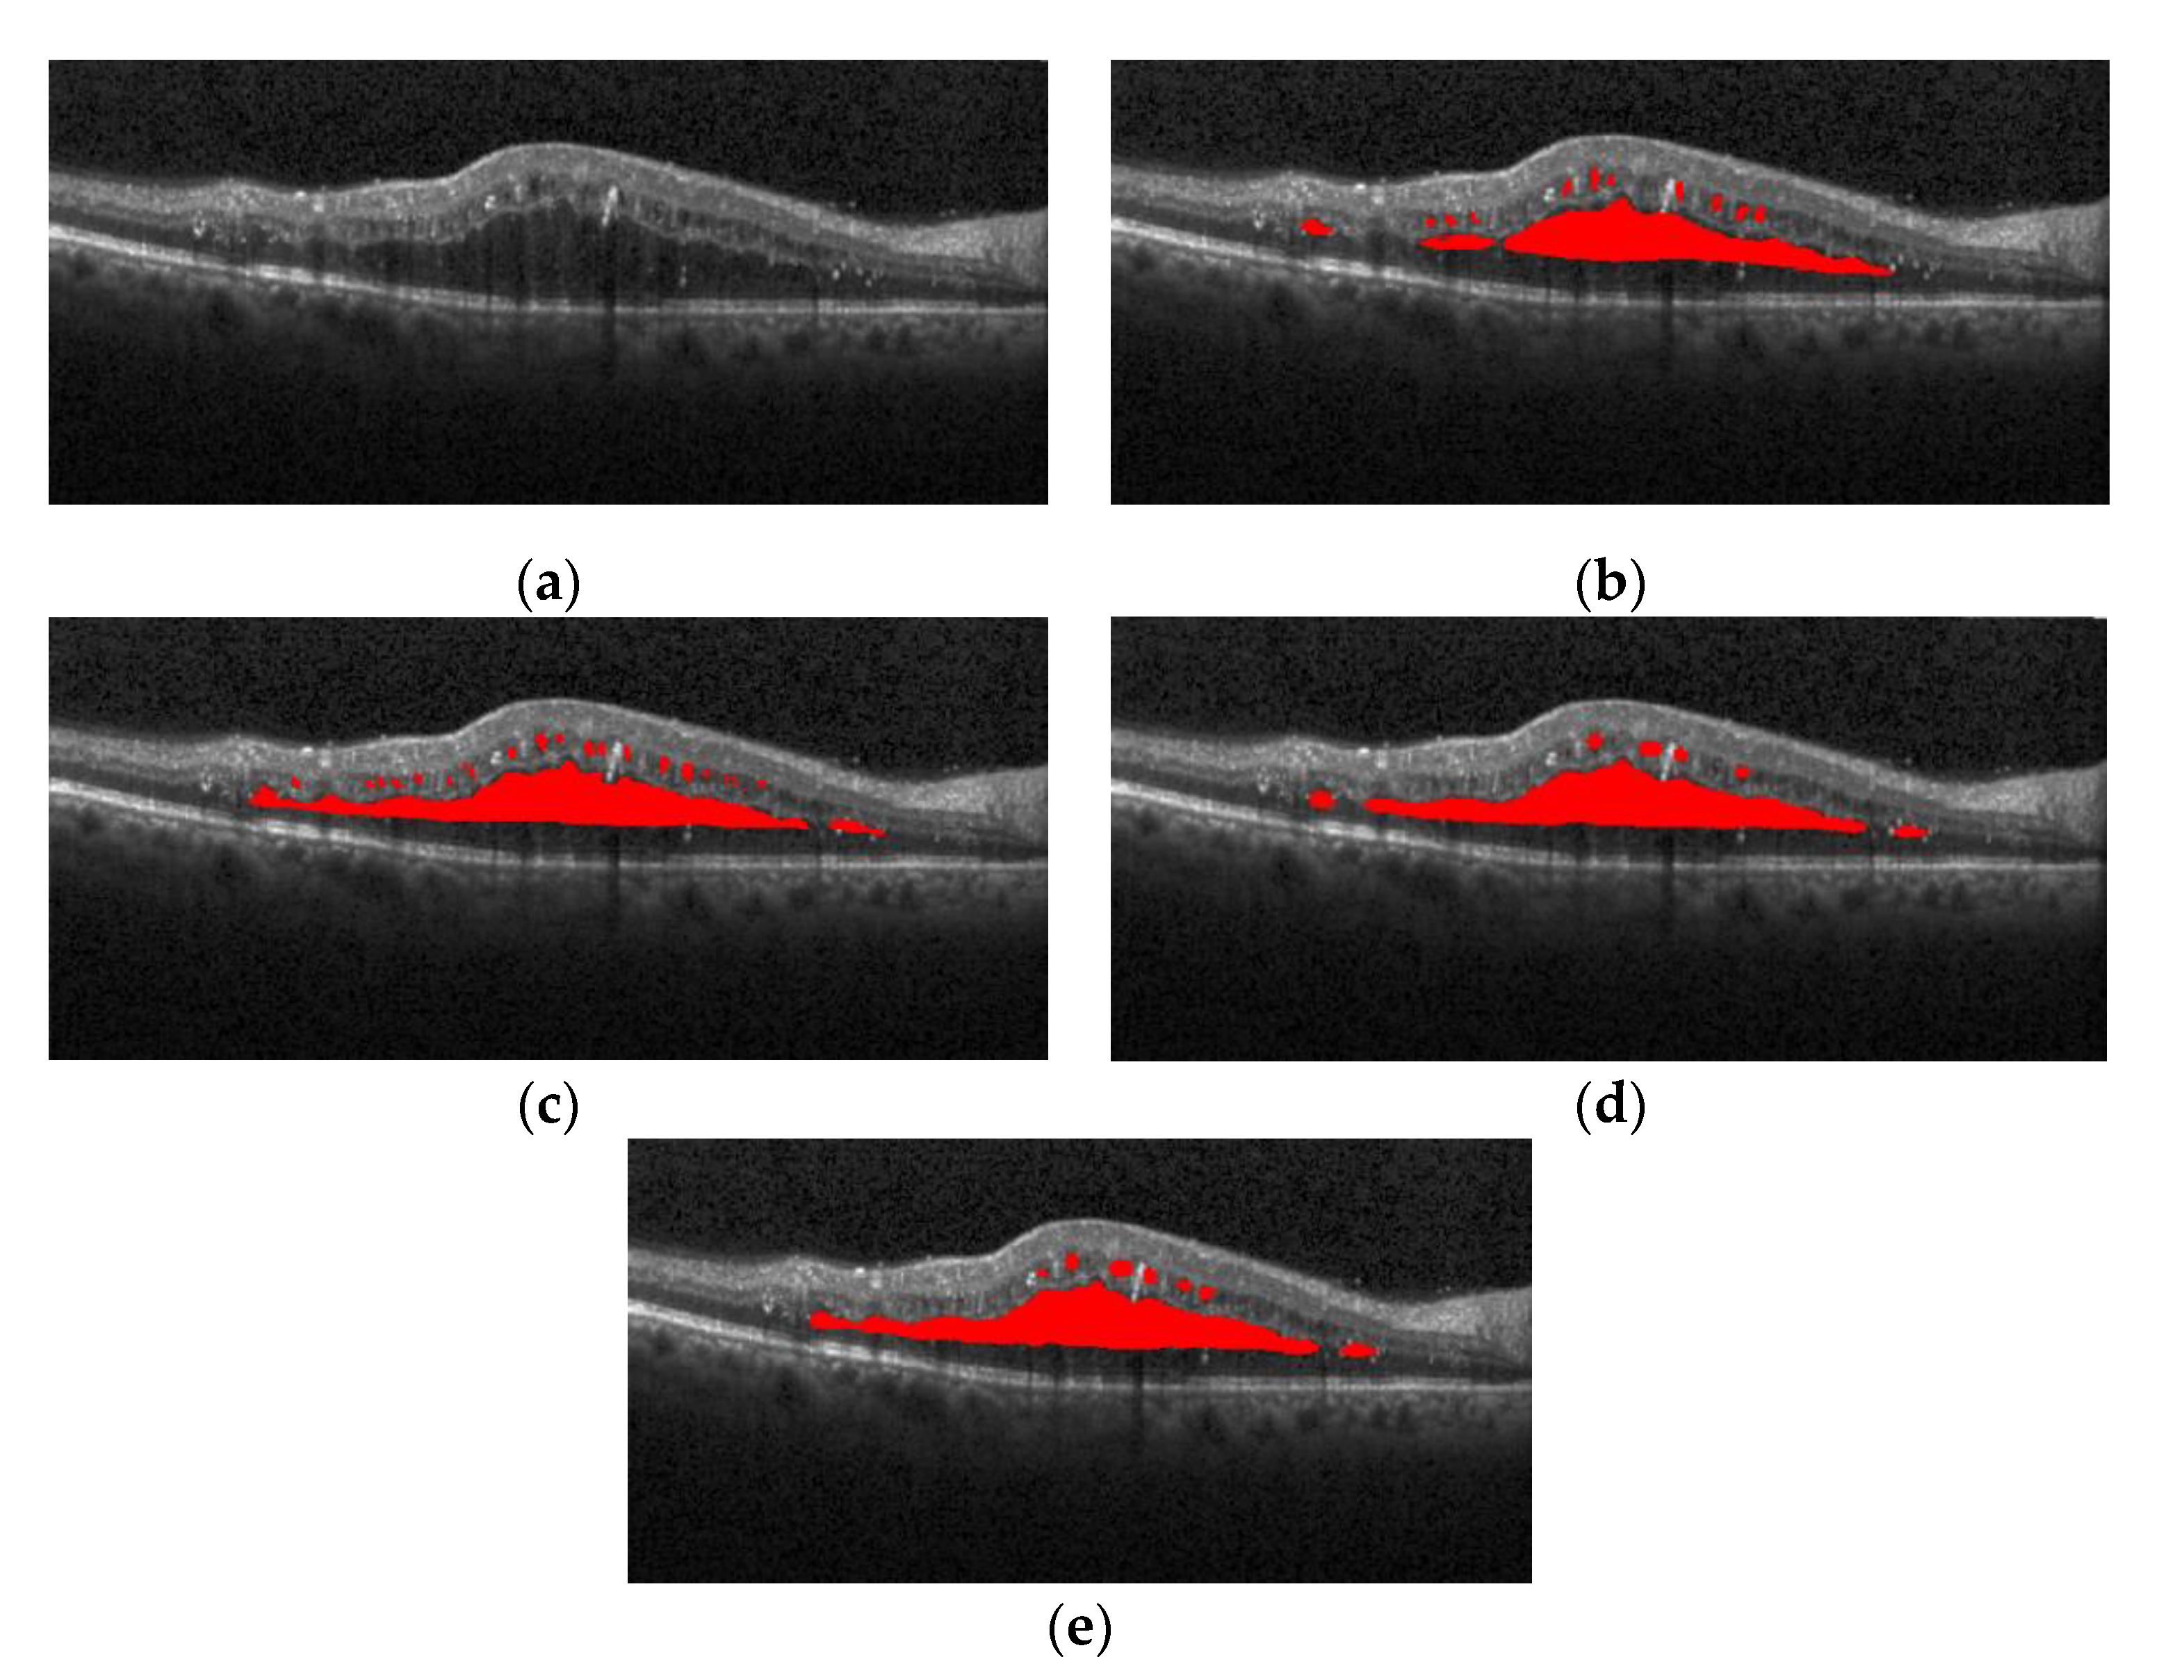
Having the expert 2 annotations as the ground truth, Figure 17 also shows the segmentation effect of the proposed method and ReLayNet on the one B-scan image. Figure 17a is the original OCT image, Figure 17b corresponds to the 14 annotated edema regions from expert 1, Figure 17c corresponds to the 23 annotated edema regions from expert 2, Figure 17d shows the only seven predicted edema regions by the ReLayNet, and Figure 17e shows the eight predicted edema regions by the proposed method. Compared with the ReLayNet, the proposed method can not only effectively predict the pixels of true edema as edema pixels, but also can better identify and segment diverse edema regions, being closer to the annotations from two experts.
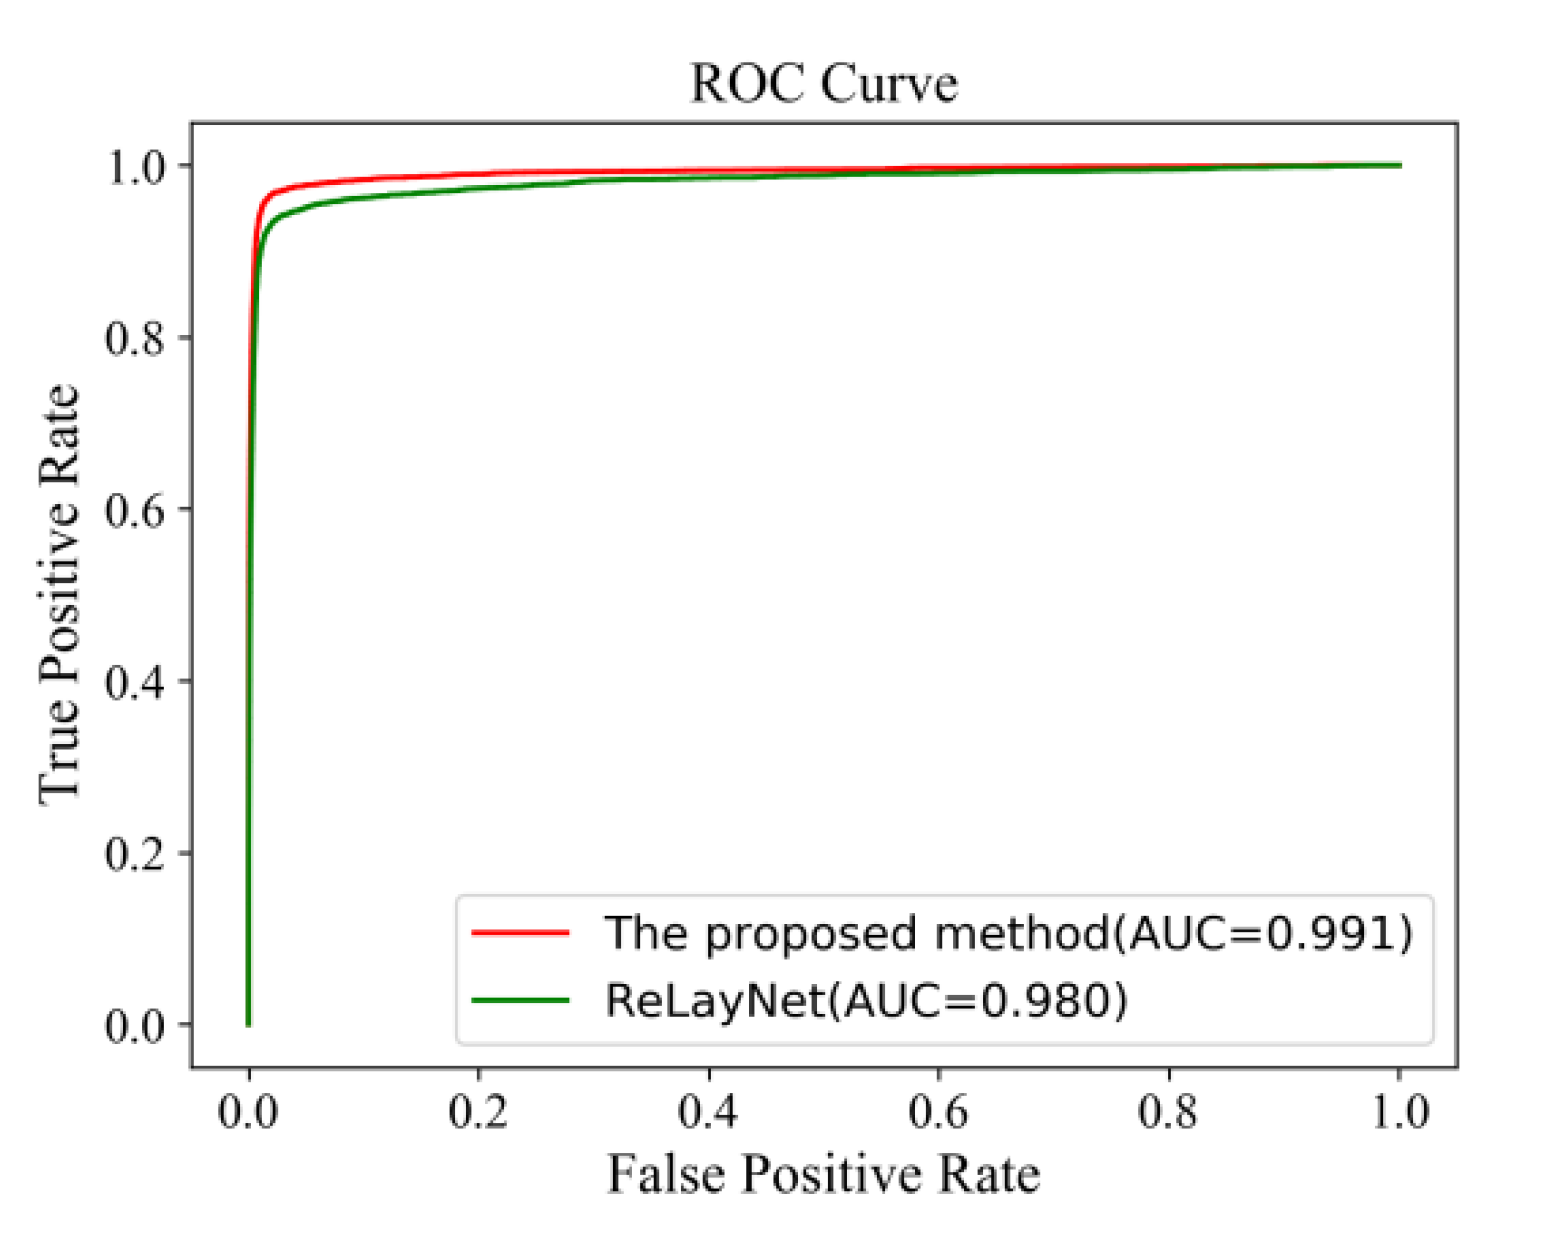
Figure 18 shows the comparison of ROC curves for the expert 2 annotations as a ground truth. The AUC value of 0.991 of the proposed method was 0.011 values higher than ReLayNet at 0.980.
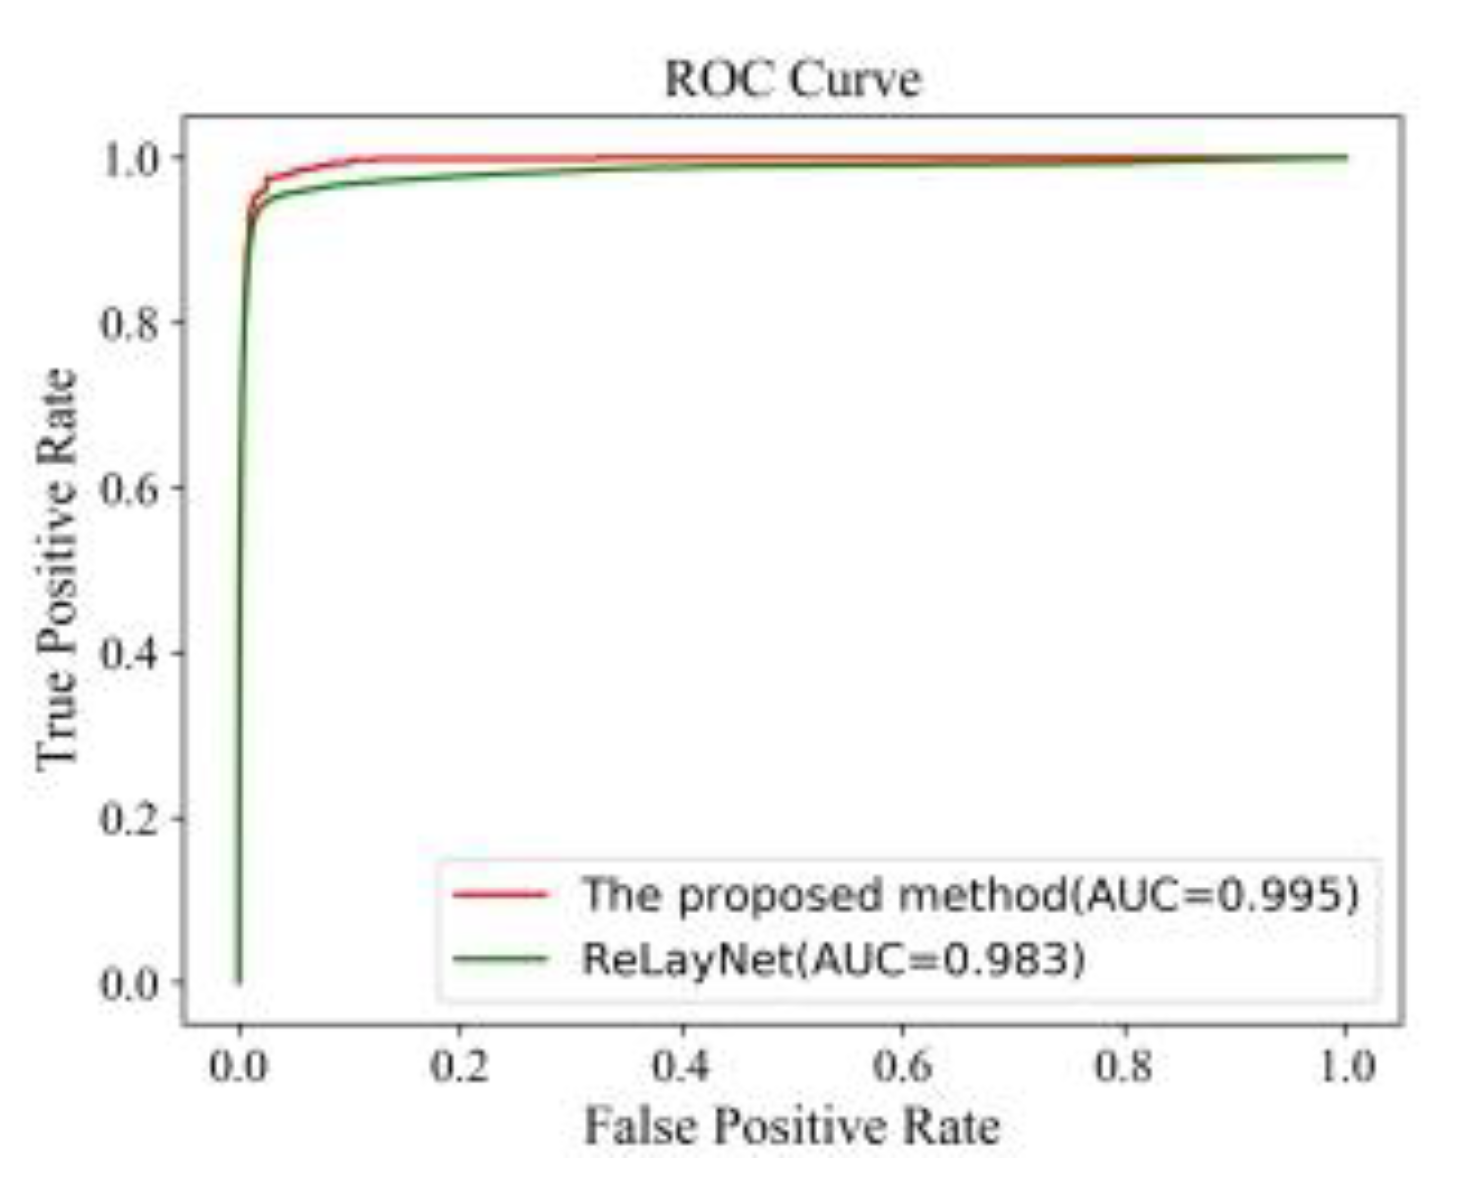
Having expert 2 annotations as the ground truth, Table 7 illustrates the comparison of quantitative results around fovea edema regions. Compared with ReLayNet, Dice, Iou, Recall, and precision were improved by 0.01, 0.01, 0.01, and 0.02 in the proposed method. Figure 19 also shows the comparison of ROC curves. The AUC value of 0.995 of the proposed method was 0.012 values higher than the ReLayNet at 0.983.
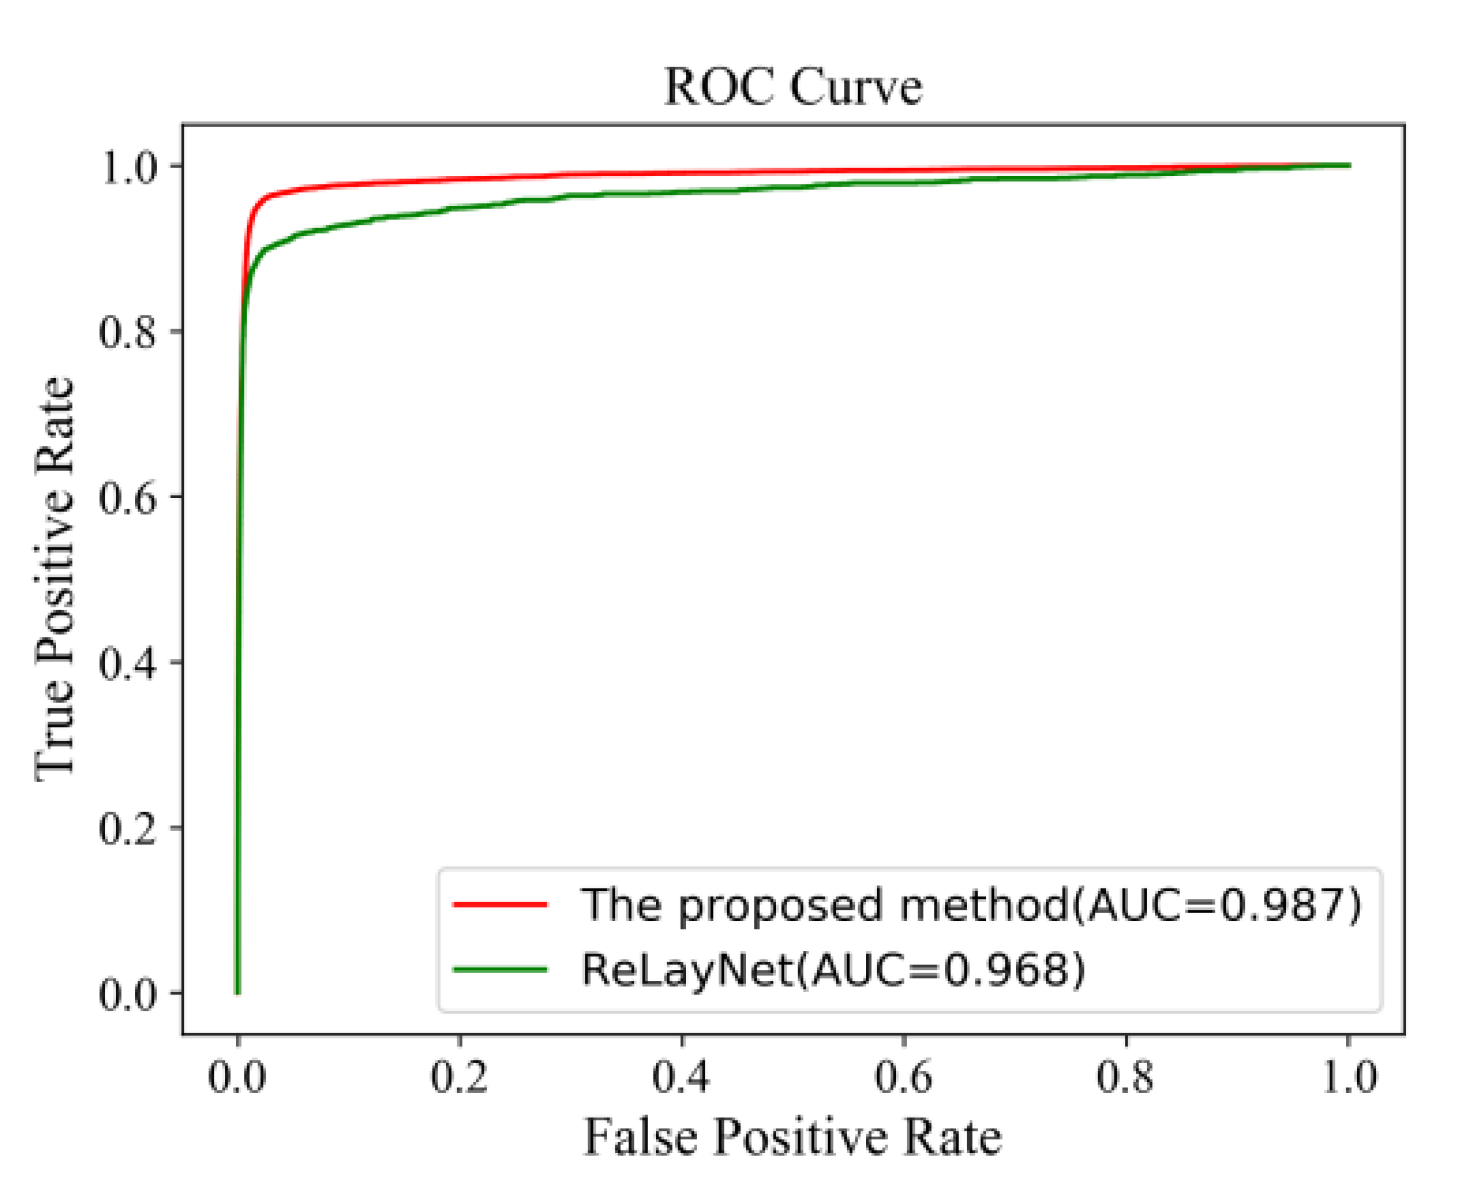
Having expert 2 annotations as the ground truth, Table 8 illustrates the comparison results of the diverse edemas in multi-regions. The proposed method also effectively upgraded to 0.77, 0.75, 0.80, and 0.77 in the four indicators, being much better than the ReLayNet method and expert 1 for diverse edemas in multi-regions. Figure 20 shows the comparison of ROC curves. The AUC value of 0.987 of the proposed method was 0.019 values higher than the ReLayNet at 0.968.

5. Conclusions

This paper proposes a new deep learning method for automatic segmentation and detection of macular edemas in retinal OCT images. In the proposed method, firstly, the data augmentation is used to avoid the over fitting of the model. Then, the U-Net++ network was improved by using ResNet as the backbone network and by drawing on ResNeSt, which can reduce the loss of features in the transmission process of the network training so that it not only improves the overall accuracy but also improves the effect in diverse edemas in multi-regions. Finally, the morphological opening operation was used to process the prediction results. In future work, we will explore the integration of prior knowledge for the macular edema in retinal OCT images, investigate advanced semantic segmentation network architectures and the self-supervision model [31,32], and achieve much better 3D segmentation results. For the problems of small amount of data and the annotation differences caused by the subjectivity of experts, we will increase the collection of data, find a number of relevant professionals to label, and select relatively accurate annotations to train the network model more effectively.

Author Contributions

Conceptualization, Z.G. and X.W.; methodology, Z.G. and X.W.; software, X.W.; validation, Z.G. and X.W.; formal analysis, Y.L.; investigation, Z.G.; resources, Z.G.; data curation, Z.G.; writing—original draft preparation, X.W.; writing—review and editing, Z.G. and Y.L.; visualization, X.W. and Z.G.; supervision, Z.G.; project administration, Z.G. All authors have read and agreed to the published version of the manuscript.

Funding

This work was supported by research projects of basic scientific research business expenses of provincial colleges and universities in Heilongjiang Province (no. Hkdqg201911).

Conflicts of Interest

The authors declare no conflict of interest.

References

  1. Nassif, N.; Cense, B.; Park, B.H.; Yun, S.H.; Boer, J.F.D. In vivo human retinal imaging by ultrahigh-speed spectral domain optical coherence tomography. Opt. Lett. 2004, 29, 480–482. [Google Scholar] [CrossRef] [PubMed] [Green Version]
  2. Chiu, S.J.; Allingham, M.J.; Mettu, P.S.; Cousins, S.W.; Izatt, J.A.; Farsiu, S. Kernel regression based segmentation of optical coherence tomography images with diabetic macular edema. Biomed. Opt. Express 2015, 6, 1172–1194. [Google Scholar] [CrossRef] [PubMed] [Green Version]
  3. Srinivasan, P.P.; Heflin, S.J.; Izatt, J.A.; Arshavsky, V.Y.; Farsiu, S. Automatic segmentation of up to ten layer boundaries in sd-oct images of the mouse retina with and without missing layers due to pathology. Biomed. Opt. Express 2014, 5, 348–365. [Google Scholar] [CrossRef] [PubMed] [Green Version]
  4. Fernandez D, C. Delineating fluid-filled region boundaries in optical coherence tomography images of the retina. IEEE Trans. Med. Imaging 2005, 24, 929–945. [Google Scholar] [CrossRef]
  5. Quellec, G.; Lee, K.; Dolejsi, M.; Garvin, M.K.; Abràmoff, M.D.; Sonka, M. Three-Dimensional Analysis of Retinal Layer Texture: Identification of Fluid-Filled Regions in SD-OCT of the Macula. IEEE Trans. Med. Imaging 2010, 29, 1321–1330. [Google Scholar] [CrossRef]
  6. Zheng, Y.; Sahni, J.; Campa, C.; Stangos, A.N.; Raj, A.; Harding, S.P. Computerized assessment of intraretinal and subretinal fluid regions in spectral-domain optical coherence tomography images of the retina. Am. J. Ophthalmol. 2013, 155, 277–286. [Google Scholar] [CrossRef]
  7. Xu, X.; Lee, K.; Zhang, L.; Sonka, M.; Abramoff, M.D. Stratified sampling voxel classification for segmentation of intraretinal and subretinal fluid in longitudinal clinical oct data. IEEE Trans. Med. Imaging 2015, 34, 1616–1623. [Google Scholar] [CrossRef]
  8. Karri, S.P.K.; Chakraborthi, D.; Chatterjee, J. Learning layer-specific edges for segmenting retinal layers with large deformations. Biomed. Opt. Express 2016, 7, 2888. [Google Scholar] [CrossRef] [Green Version]
  9. Tian, J.; Varga, B.; Tátrai, E.; Fanni, P.; Somfai, G.M.; Smiddy, W.E.; DeBuc, D.C. Performance evaluation of automated segmentation software on optical coherence tomography volume data. J. Biophotonics 2016, 9, 478–489. [Google Scholar] [CrossRef] [Green Version]
  10. Long, J.; Shelhamer, E.; Darrell, T. Fully convolutional networks for semantic segmentation. IEEE Trans. Pattern Anal. Mach. Intell. 2015, 39, 640–651. [Google Scholar]
  11. Bai, F.; Marques, M.J.; Gibson, S.J. Cystoid macular edema segmentation of optical coherence tomography images using fully convolutional neural networks and fully connected crfs. arXiv 2017, arXiv:1709.05324. [Google Scholar]
  12. Ronneberger, O.; Fischer, P.; Brox, T. U-Net: Convolutional Networks for Biomedical Image Segmentation. In Proceedings of the International Conference on Medical Image Computing and Computer-Assisted Intervention, Munich, Germany, 5–9 October 2015; pp. 234–241. [Google Scholar]
  13. Çiçek, Ö.; Abdulkadir, A.; Lienkamp, S.S.; Brox, T.; Ronneberger, O. 3D U-Net: Learning dense volumetric segmentation from sparse annotation. In Proceedings of the International Conference on Medical Image Computing and Computer-Assisted Intervention, Athens, Greece, 17–21 October 2016; pp. 424–432. [Google Scholar]
  14. Christ, P.F.; Ettlinger, F.; Grün, F.; Elshaera, M.E.A.; Lipkova, J.; Schlecht, S.; Ahmaddy, F.; Tatavarty, S.; Bickel, M.; Bilic, P.; et al. Automatic liver and tumor segmentation of ct and mri volumes using cascaded fully convolutional neural networks. arXiv 2017, arXiv:1702.05970. [Google Scholar]
  15. Roy, A.G.; Conjeti, S.; Karri, S.P.K.; Sheet, D.; Katouzian, A.; Wachinger, C.; Navab, N. Relaynet: Retinal layer and fluid segmentation of macular optical coherence tomography using fully convolutional networks. Biomed. Opt. Express 2017, 8, 3627. [Google Scholar] [CrossRef] [PubMed]
  16. Venhuizen, F.G.; Ginneken, B.V.; Liefers, B.; Asten, F.V.; Schreur, V.; Fauser, S.; Hoyng, C.; Theelen, T.; Sanchez, C.I. Deep learning approach for the detection and quantification of intraretinal cystoid fluid in multivendor optical coherence tomography. Biomed. Opt. Express 2018, 9, 1545. [Google Scholar] [CrossRef] [PubMed] [Green Version]
  17. Li, M.-X.; Yu, S.-Q.; Zhang, W.; Zhou, H.; Xu, X.; Qian, T.-W.; Wan, Y.-J. Segmentation of retinal fluid based on deep learning:application of three-dimensional fully convolutional neural networks in optical coherence tomography images. Int. J. Ophthalmol. 2019, 12, 1012–1020. [Google Scholar] [PubMed]
  18. Zhu, L.; Zhu, W.; Feng, S.; Chen, X. Fully automated segmentation of hyperreflective foci in OCT images using a U-shape network. Image Process. 2020, 11313, 1131308. [Google Scholar]
  19. Liu, W.; Sun, Y.; Ji, Q. MDAN-UNet: Multi-Scale and Dual Attention Enhanced Nested U-Net Architecture for Segmentation of Optical Coherence Tomography Images. Algorithms 2020, 13, 60. [Google Scholar] [CrossRef] [Green Version]
  20. Xie, S.; Okuwobi, I.P.; Li, M.; Zhang, Y.; Yuan, S.; Chen, Q. Fast and Automated Hyperreflective Foci Segmentation Based on Image Enhancement and Improved 3D U-Net in SD-OCT Volumes with Diabetic Retinopathy. Transl. Vis. Sci. Technol. 2020, 9, 21. [Google Scholar] [CrossRef] [Green Version]
  21. Mohamed, R.I.; Karma, M.F.; Sherin, M.Y. HyCAD-OCT. A Hybrid Computer-Aided Diagnosis of Retinopathy by Optical Coherence Tomography Integrating Machine Learning and Feature Maps Localization. Appl. Sci. 2020, 10, 4716. [Google Scholar]
  22. Li, X.; Chen, H.; Qi, X.; Dou, Q.; Fu, C.W.; Heng, P.A. H-denseunet: Hybrid densely connected unet for liver and tumor segmentation from ct volumes. IEEE Trans. Med. Imaging 2018, 37, 2663–2674. [Google Scholar] [CrossRef] [Green Version]
  23. Drozdzal, M.; Vorontsov, E.; Chartrand, G.; Kadoury, S.; Pal, C. The importance of skip connections in biomedical image segmentation. Lect. Notes Comp. Sci. 2016, 10008, 179–187. [Google Scholar]
  24. Zhou, Z.; Siddiquee, M.M.R.; Tajbakhsh, N.; Liang, J. UNet++: A Nested U-Net Architecture for Medical Image Segmentation. arXiv 2018, arXiv:1807.10165. [Google Scholar]
  25. Lee, C.-Y.; Xie, S.; Gallagher, P.; Zhang, Z.; Tu, Z. Deeply-supervised nets. In Proceedings of the Eighteenth International Conference on Artifificial Intelligence and Statistics, San Diego, CA, USA, 9–12 May 2015; pp. 562–570. [Google Scholar]
  26. He, K.; Zhang, X.; Ren, S.; Sun, J. Deep residual learning for image recognition. In Proceedings of the IEEE Conference on Computer Vision and Pattern Recognition, Las Vegas, NV, USA, 26 June–1 July 2016. [Google Scholar]
  27. Duta, I.C.; Liu, L.; Zhu, F.; Shao, L. Improved residual networks for image and video recognition. arXiv 2020, arXiv:2004.04989. [Google Scholar]
  28. He, K.; Zhang, X.; Ren, S.; Sun, J. Identity Mappings in Deep Residual Networks. In Proceedings of the European Conference on Computer Vision, Amsterdam, The Netherlands, 11–14 October 2016; Springer: Cham, Germany, 2016. [Google Scholar]
  29. Ruberto, C.D.; Dempster, A.G.; Khan, S.; Jarra, B. Analysis of infected blood cell images using morphological operators. Image Vis. Comput. 2002, 20, 133–146. [Google Scholar] [CrossRef]
  30. Vision and Image Processing (VIP) Laboratory. Available online: www.duke.edu/~sf59/Chiu_BOE_2014_dataset.htm (accessed on 15 August 2014).
  31. Fei, P.; Inkyu, S.; Francois, R.; Seokju, L.; Kweon, I.S. Unsupervised Intra-domain Adaptation for Semantic Segmentation through Self-Supervision. In Proceedings of the Computer Vision and Pattern Recognition, Seattle, WA, USA, 16–18 June 2020. [Google Scholar]
  32. Di Mauro, D.; Furnari, A.; Patanè, G.; Battiato, S.; Farinella, G.M. SceneAdapt: Scene-based domain adaptation for semantic segmentation using adversarial learning. Pattern Recognit. Lett. 2020, 136, 175–182. [Google Scholar] [CrossRef]
Figure 1. Optical coherence tomography (OCT) images and the annotations of the edema regions: (a) normal retina OCT image; (b) OCT image with macular edema; (c) the annotations of the edema regions.
Applsci 10 05701 g001
Figure 2. The flow chart of the proposed method.
Applsci 10 05701 g002
Figure 3. U-Net ++ network structure diagram.
Applsci 10 05701 g003
Figure 4. Structure diagrams with both the first layer L1 and the second layer L2: (a) L1; (b) L2.
Applsci 10 05701 g004
Figure 5. Improved U-Net++ network.
Applsci 10 05701 g005
Figure 6. Comparison of ResBlock: (a) original (inside the red frame); (b) pre-activation (inside the blue frame); (c) the improved ResStage (inside the green frame).
Applsci 10 05701 g006
Figure 7. Comparison of projection shortcut: (a) original projection shortcut (inside the red frame); (b) the improved projection shortcut (inside the green frame).
Applsci 10 05701 g007
Figure 8. Quantitative comparison of confusion matrices: (a) proposed method; (b) ReLayNet.
Applsci 10 05701 g008
Figure 9. Comparison of receiver operating characteristic (ROC) curves.
Applsci 10 05701 g009
Figure 10. The segmentation results: (a) original image; (b) expert 1 annotations; (c) expert 2 annotations; (d) ReLayNet predictions; (e) proposed method predictions.
Applsci 10 05701 g010aApplsci 10 05701 g010b
Figure 11. Quantitative comparison of confusion matrices: (a) the proposed method; (b) ReLayNet.
Applsci 10 05701 g011
Figure 12. Comparison of ROC curves.
Applsci 10 05701 g012
Figure 13. Comparison of segmentation results around fovea edema: (a) original image; (b) expert 1 annotations; (c) expert 2 annotations; (d) ReLayNet predictions; (e) proposed method predictions.
Applsci 10 05701 g013
Figure 14. Comparison of confusion matrices. (a) the proposed method; (b) ReLayNet.
Applsci 10 05701 g014
Figure 15. Comparison of ROC curves.
Applsci 10 05701 g015
Figure 16. Figures of edema segmentation results in multi-regions with the expert 1 annotations as the ground truth: (a) original image; (b) expert 1 annotations; (c) expert 2 annotations; (d) ReLayNet predictions; (e) proposed method predictions.
Applsci 10 05701 g016
Figure 17. Comparison of segmentation results with the expert 2 annotations as the ground truth: (a) original image; (b) expert 1 annotations; (c) expert 2 annotations; (d) ReLayNet predictions; (e) proposed method predictions.
Applsci 10 05701 g017
Figure 18. Comparison of ROC curves with expert 2 annotations as the ground truth.
Applsci 10 05701 g018
Figure 19. Comparison of ROC curves around fovea edema regions for expert 2 annotations as the ground truth.
Applsci 10 05701 g019
Figure 20. Comparison of ROC curves for diverse edemas in multi-regions and the expert 2 annotations as the ground truth.
Applsci 10 05701 g020
Table 1. ResNet34 and 101-layer network architecture table.
Layer NameOutput Size34-Layer101-Layer
Conv1112 × 1127 × 7, 64, stride = 2
Conv256 × 563 × 3max pool, stride = 2
[ 3 × 3 64 3 × 3 64 ] × 3 [ 1 × 1 64 3 × 3 64 1 × 1 256 ] × 3
Conv328 × 28 [ 3 × 3 128 3 × 3 128 ] × 4 [ 1 × 1 128 3 × 3 128 1 × 1 512 ] × 4
Conv414 × 14 [ 3 × 3 256 3 × 3 256 ] × 6 [ 1 × 1 256 3 × 3 256 1 × 1 1024 ] × 23
Conv57 × 7 [ 3 × 3 512 3 × 3 512 ] × 3 [ 1 × 1 512 3 × 3 512 1 × 1 512 ] × 3
Ending1 × 1Average pool, 1000-d fc, softmax
Table 2. Quantitative comparison of the segmentation results.
MethodDiceIouRecallPrecision
Expert 20.580.610.620.57
FCN [11]0.610.640.690.72
ReLayNet [15]0.770.750.820.78
The proposed method0.800.780.840.80
Table 3. Quantitative comparison of segmentation results around fovea edema regions.
MethodDiceIouRecallPrecision
Expert20.560.570.610.58
ReLayNet0.810.790.850.84
The proposed method0.820.800.870.85
Table 4. Quantitative comparison of segmentation results for diverse edemas in multi-regions.
Network NameDiceIouRecallPrecision
Expert 20.610.580.600.61
ReLayNet0.750.730.790.78
The proposed method0.790.780.830.82
Table 5. The average absolute error of the number of edema regions with expert 1 annotations as the ground truth.
Network NameAbsolute Error (number)
Expert25.17
ReLayNet4.02
The proposed method2.87
Table 6. Quantitative comparison of segmentation results with expert 2 annotations as the ground truth.
Network NameDiceIouRecallPrecision
Expert 10.580.610.620.57
ReLayNet0.760.750.800.77
The proposed method0.780.760.820.78
Table 7. Quantitative comparison of segmentation results around fovea edema regions for the expert 2 annotations as the ground truth.
Network NameDiceIouRecallPrecision
Expert 10.560.570.580.61
ReLayNet0.790.760.820.79
The proposed method0.800.770.830.81
Table 8. Quantitative comparison of segmentation results for diverse edemas in multi-regions and the expert 2 annotations as the ground truth.
Network NameDiceIouRecallPrecision
Expert 10.610.580.610.60
ReLayNet0.740.740.770.75
The proposed method0.770.750.800.77