An Instantaneous Correlation Coefficient and Simplified Coherent Averaging Method for Single-Channel Foetal ECG Extraction

Abstract
1. Introduction
2. Methods
2.1. Instantaneous Correlation Coefficient Method for Detecting R Peaks
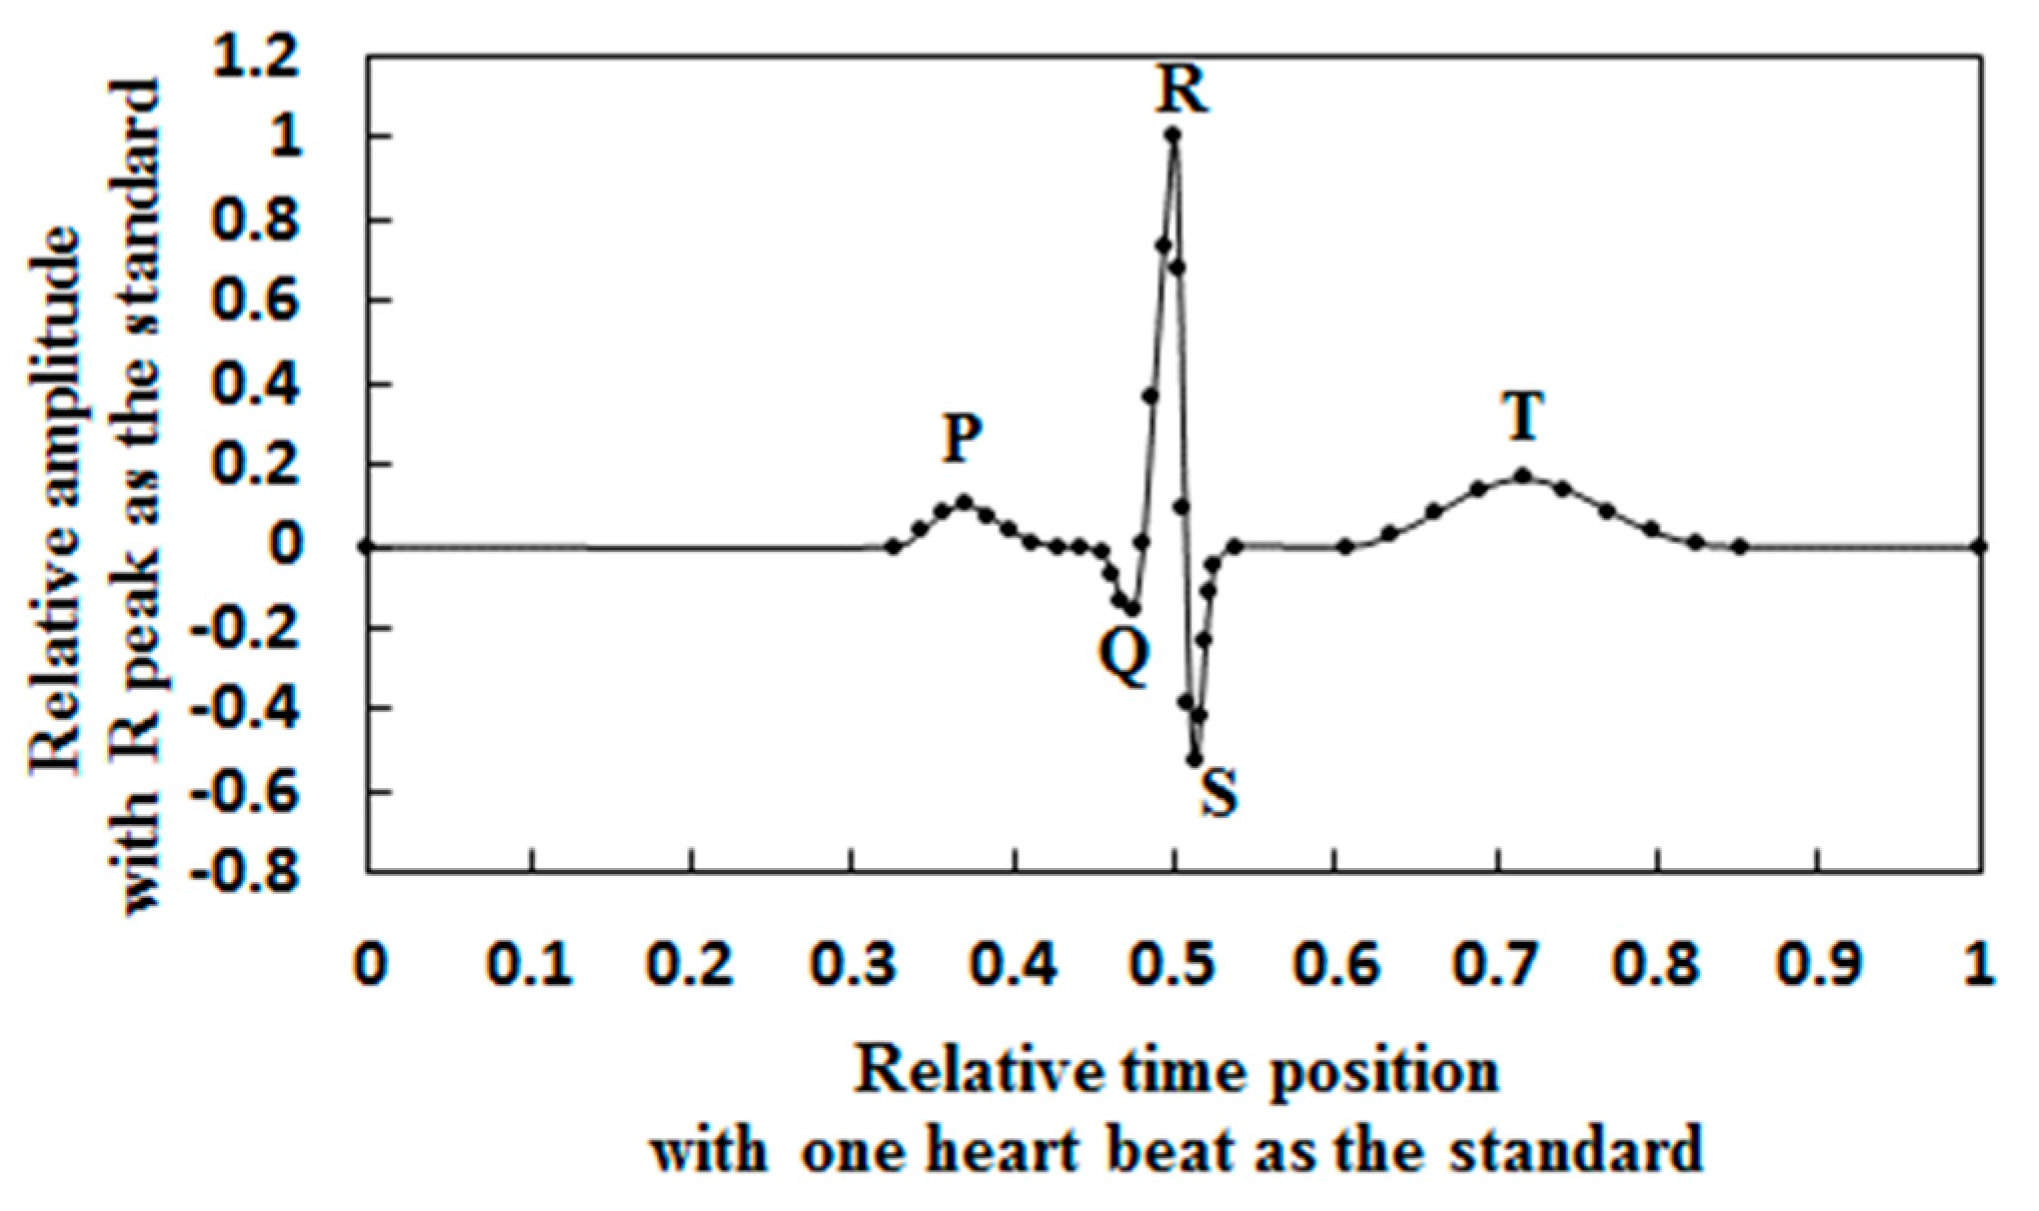
2.1.1. Dimensionless Heart Beat Model
2.1.2. Instantaneous Correlation Coefficient
2.1.3. R Peak Detection Based on the Instantaneous Correlation Coefficient
- (1)
- Determining the R Peak Threshold and R Peak Sequence
- (2)
- Eliminating Wrong R Peaks
2.2. Simplified Coherent Averaging Method
2.2.1. Coherent Averaging Method
2.2.2. Simplified Coherent Averaging Method
- (1)
- Determine the R peak position of the MECG in the AECG signal and the corresponding RR intervals.
- (2)
- Take the R peak position as the midpoint, and take the maximum RR interval as the length. The data beyond the AECG signal are filled with zeroes.
- (3)
- Form the heart beat matrix with the truncated data segment. Calculate the column mean value.
- (4)
- Place the mean value repeatedly according to the R peak positions calculated in Step 1. Abandon the overlapped parts to obtain the coherent averaging MECG signal.
2.3. Extracting a Noisy FECG
- (1)
- Remove power line interference and baseline wandering in the AECG.
- (2)
- Determine the reference heart rate of using , and reconstruct the reference heart beat of the MECG using the dimensionless heart beat model.
- (3)
- Calculate the instantaneous correlation coefficient .
- (4)
- Detect the R peak position of the MECG using .
- (5)
- Extract the MECG using the simplified coherence average method and denote it by .
- (6)
- Obtain a noisy FECG by subtracting from the AECG and denote it by .
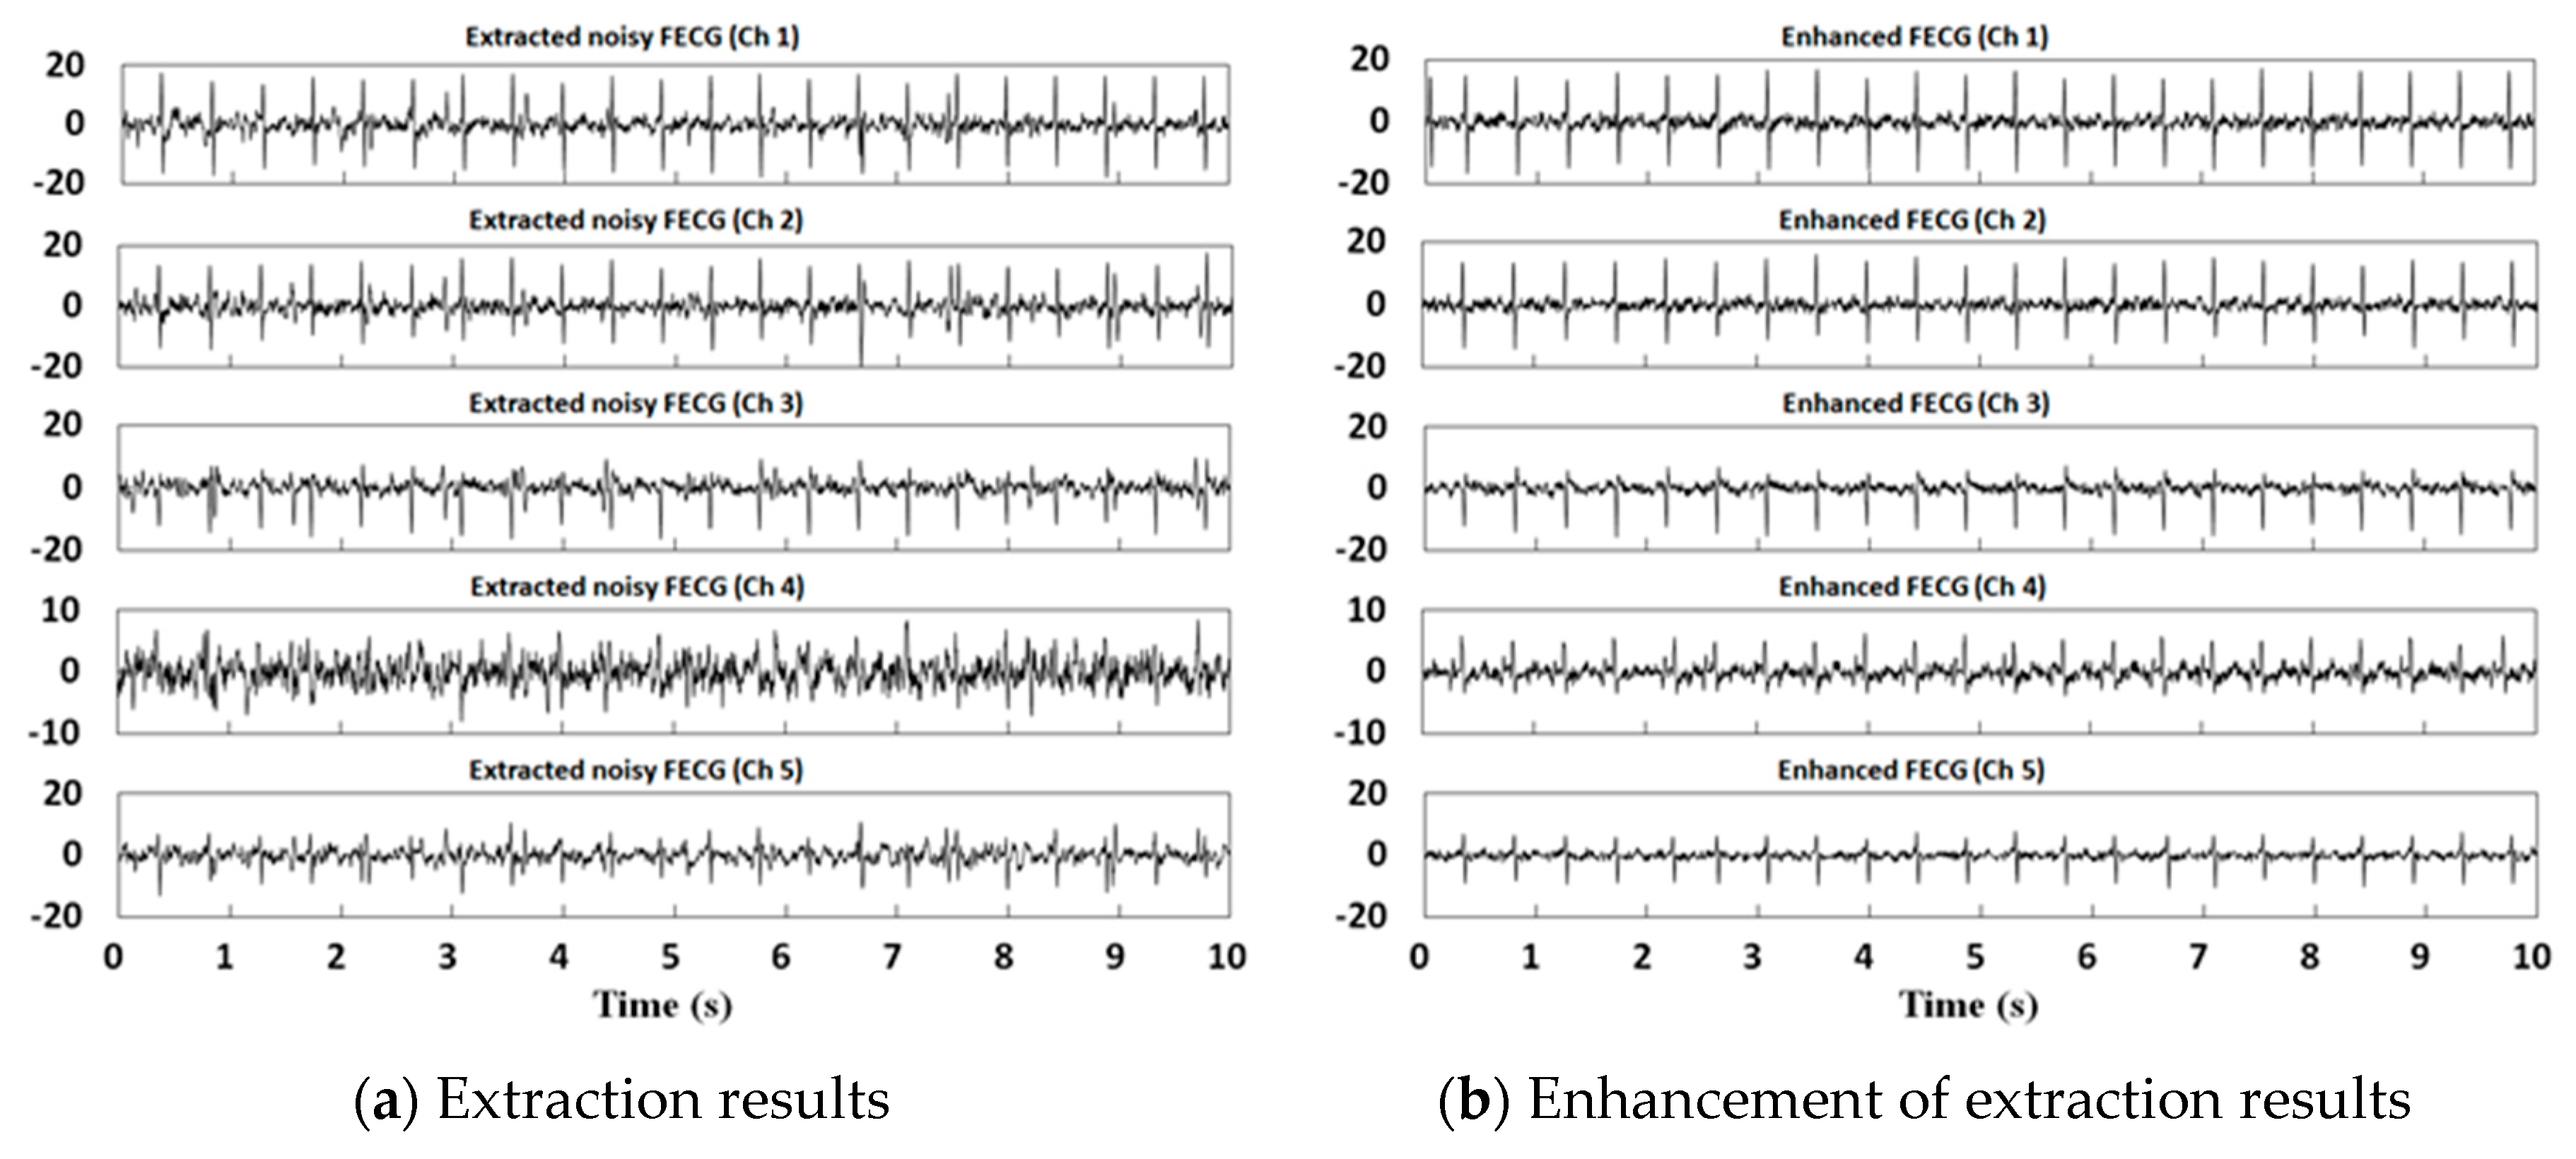
2.4. FECG Enhancement and Recovery of Nonstationarity and Nonlinear Characteristics
- (1)
- Use to estimate the reference heart rate of ; the FECG reference heart beat is established using the dimensionless heart beat model.
- (2)
- Calculate the instantaneous correlation coefficient .
- (3)
- Detect the R peak of the FECG using .
- (4)
- Extract the FECG using the simplified coherent averaging method and denote it by .
- (5)
- Subtract from to obtain the remaining signal .
- (6)
- Calculate the standard deviation of and define the threshold :where C is the ratio, which is 1 in this paper.
- (7)
- Set the absolute value of greater than to 0.
- (8)
- Recover the nonlinearity and nonstationarity of the FECG, and obtain the final extraction of the FECG.
3. Experimental Data and Evaluation of Results
3.1. Source of Experimental Data
3.1.1. Synthetic Data
3.1.2. Real Data
3.2. Evaluation of Experimental Results
4. Experiments and Discussions
4.1. Synthetic Data Experiments
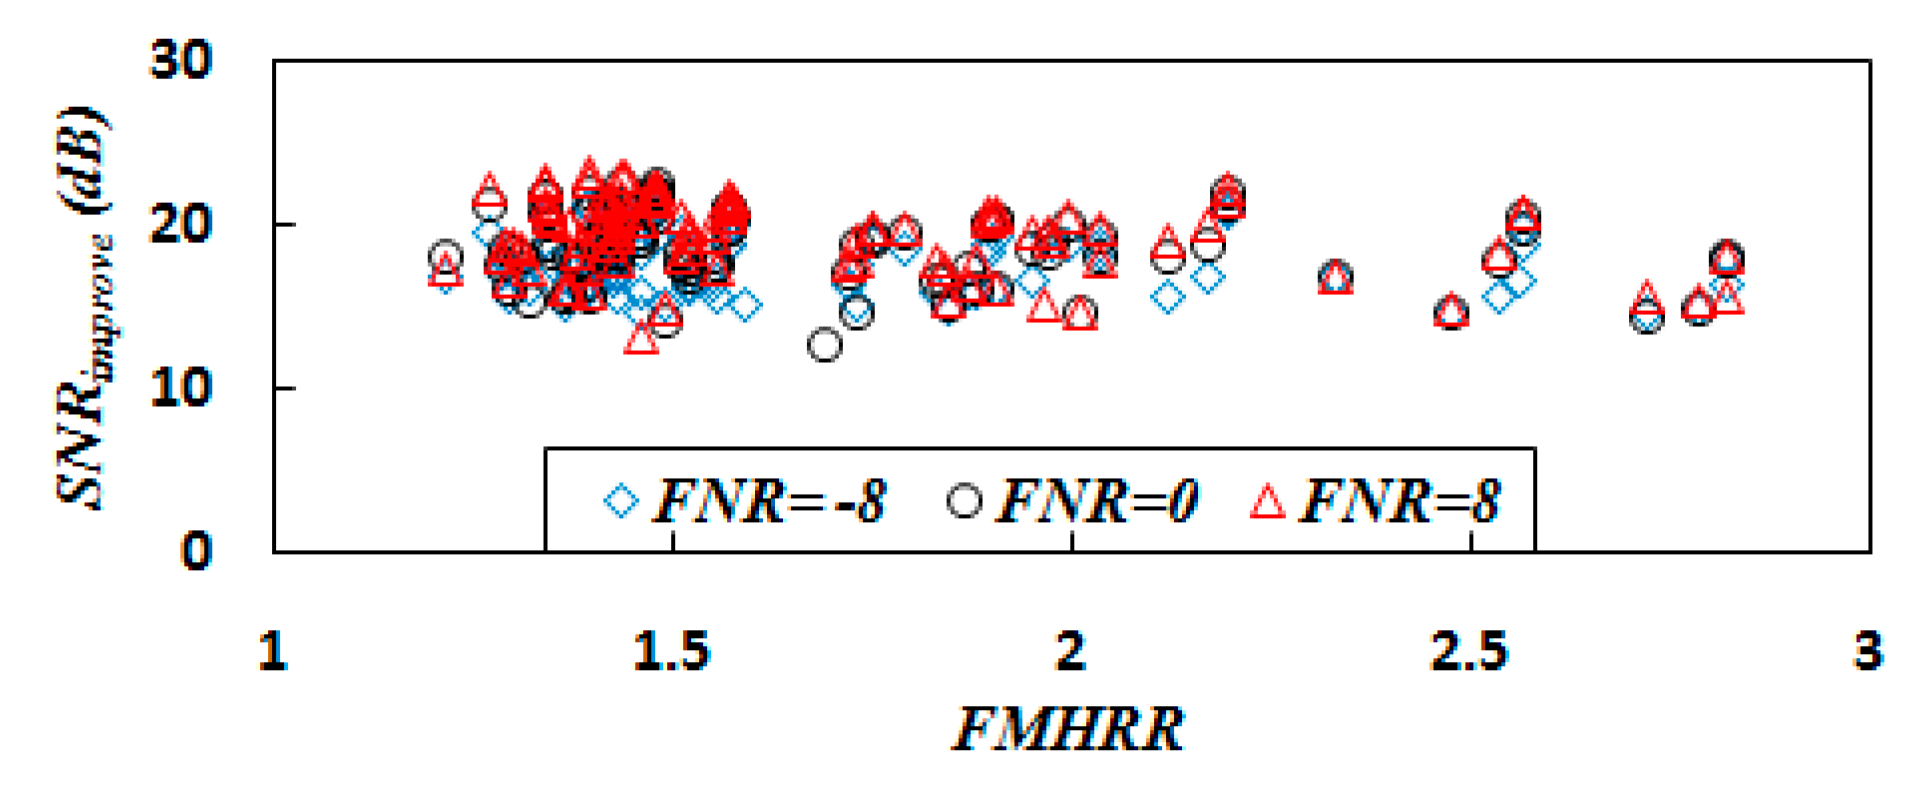
4.1.1. Experiments with the Noise Energy Ratio
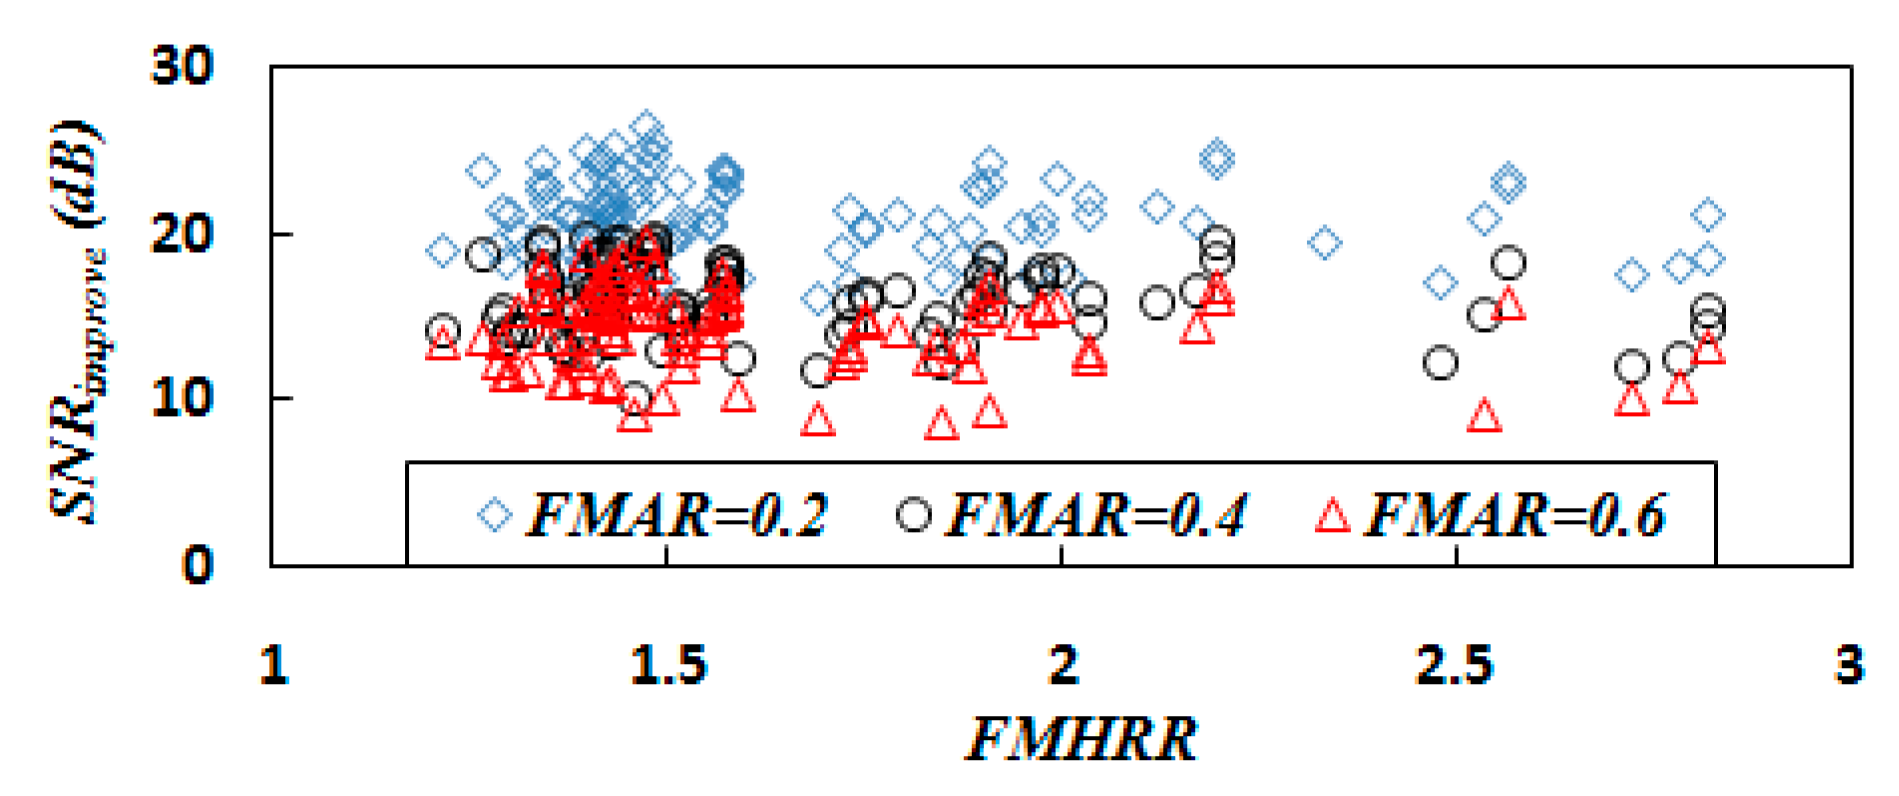
4.1.2. Experiments with the FMAR
4.1.3. Effect of Heart Rate Ratio
4.2. Real Data Experiments
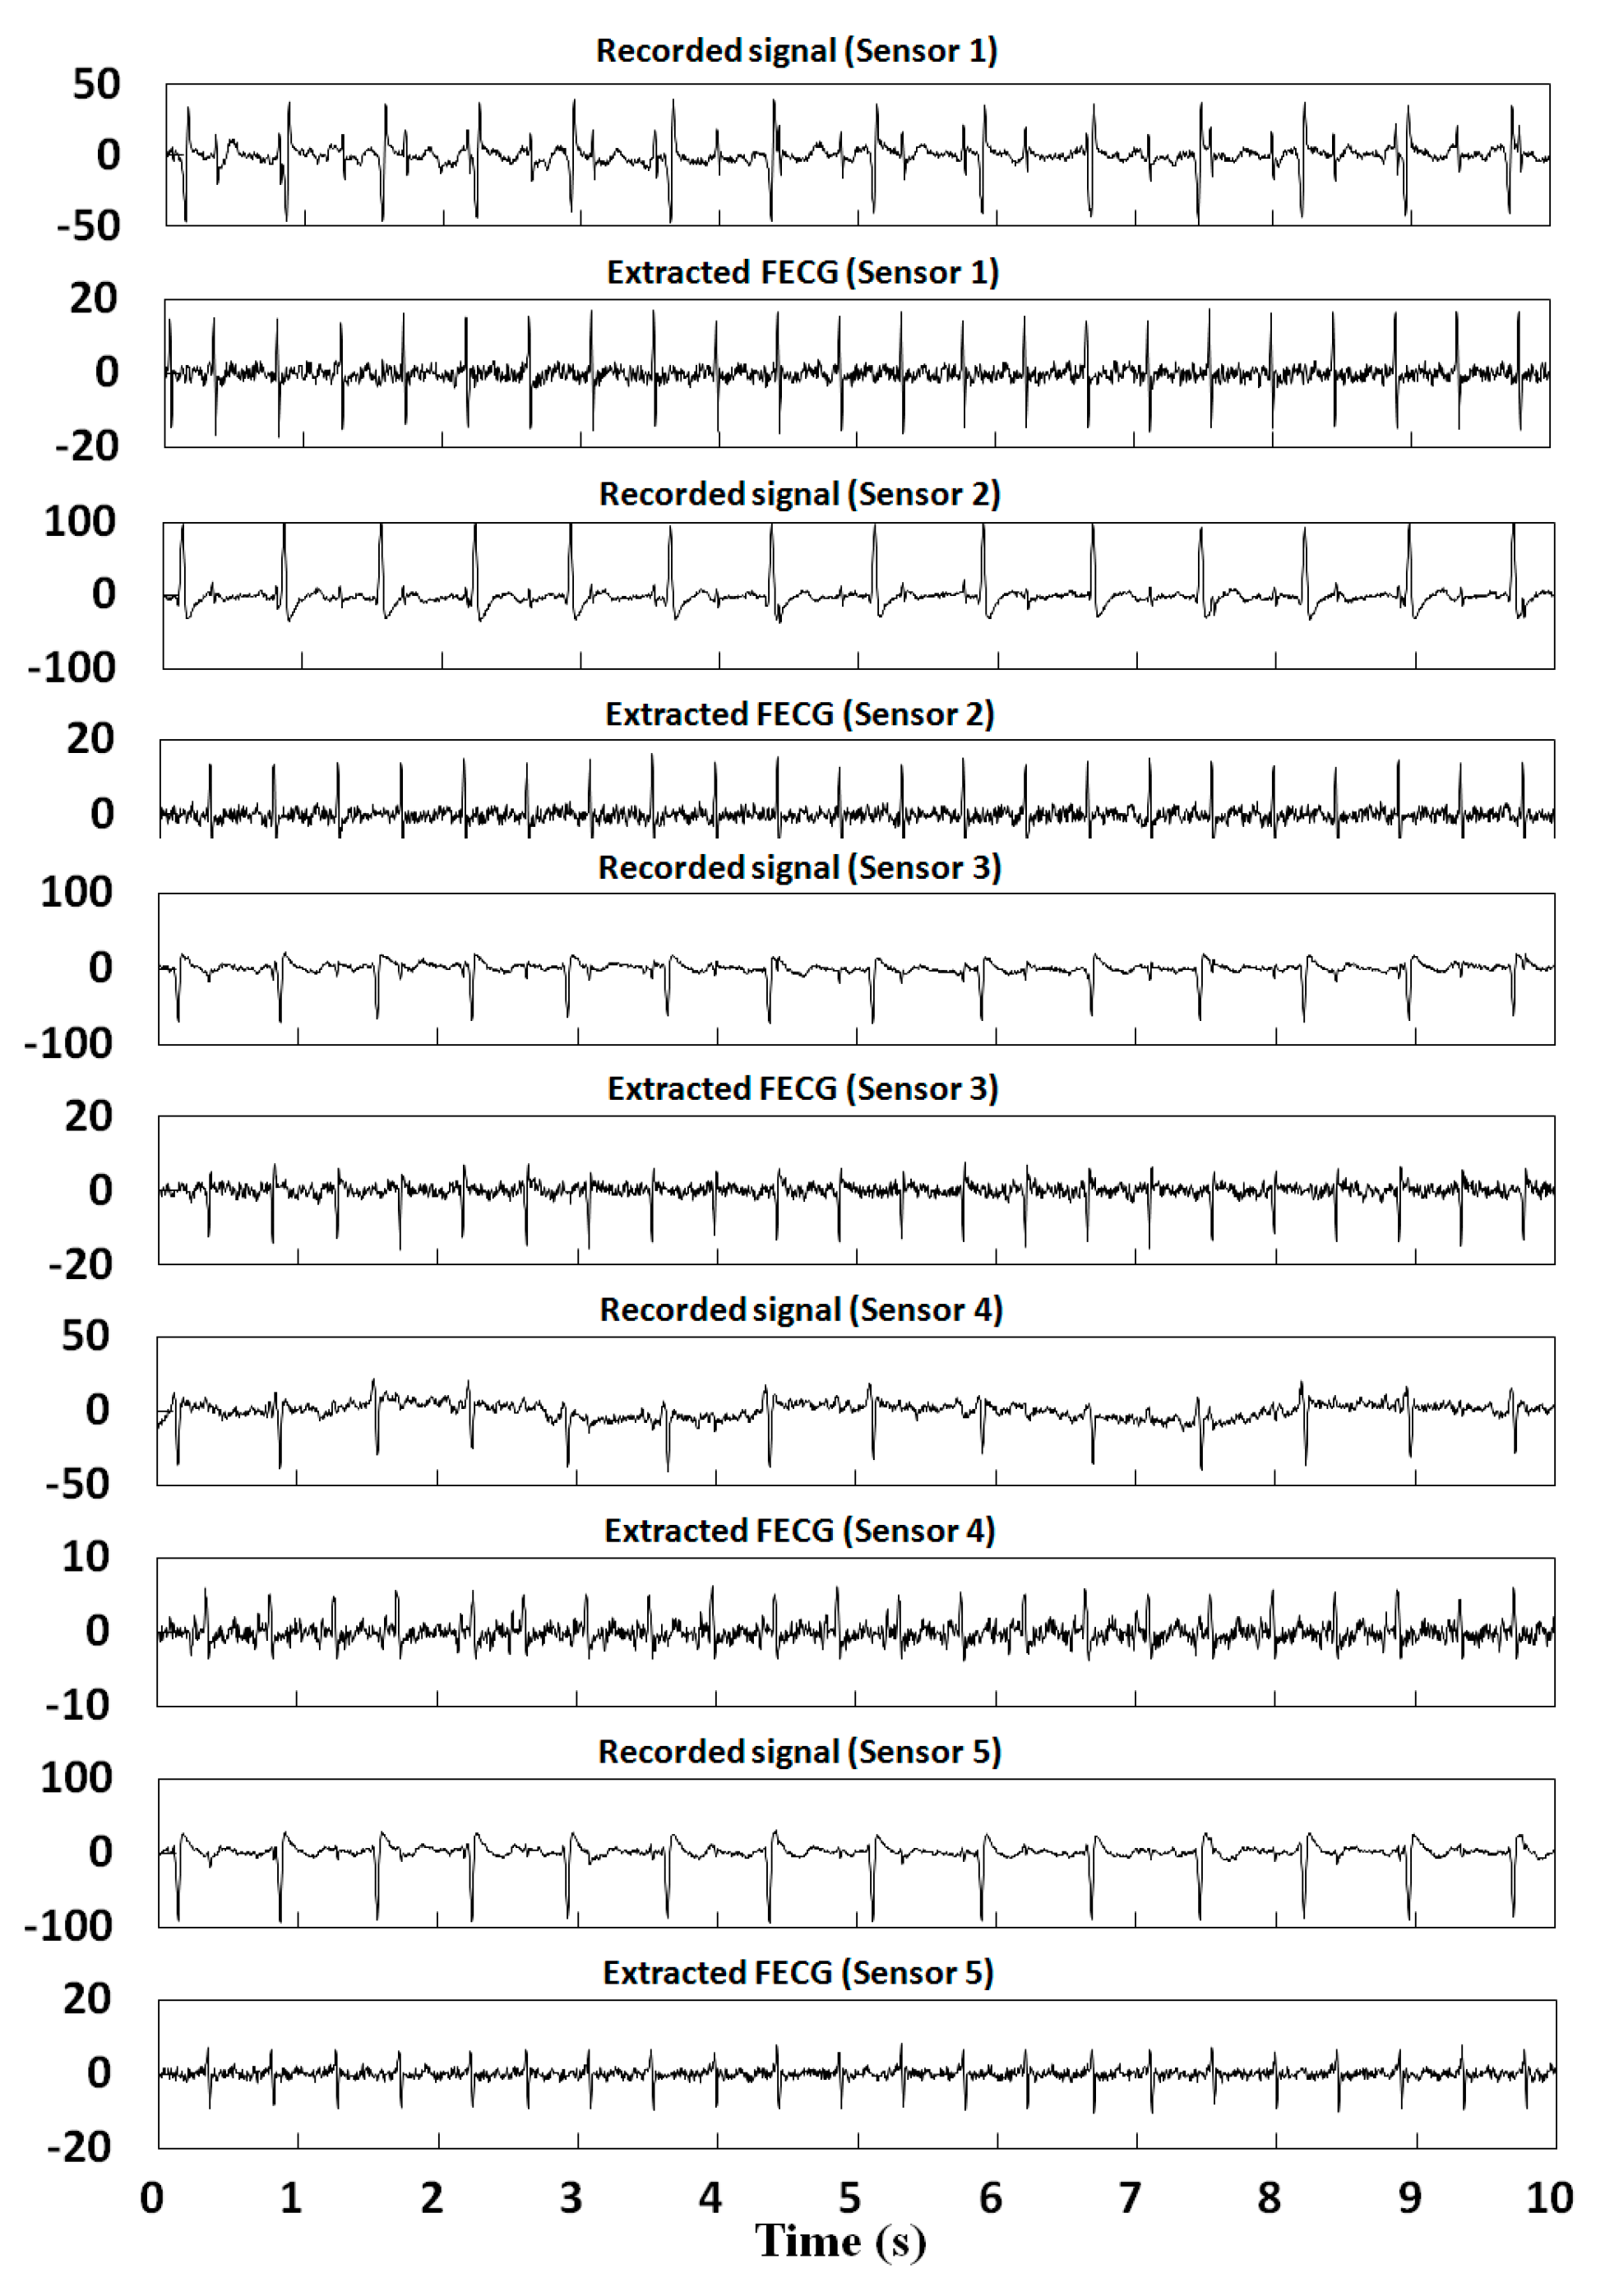
4.2.1. DaISy
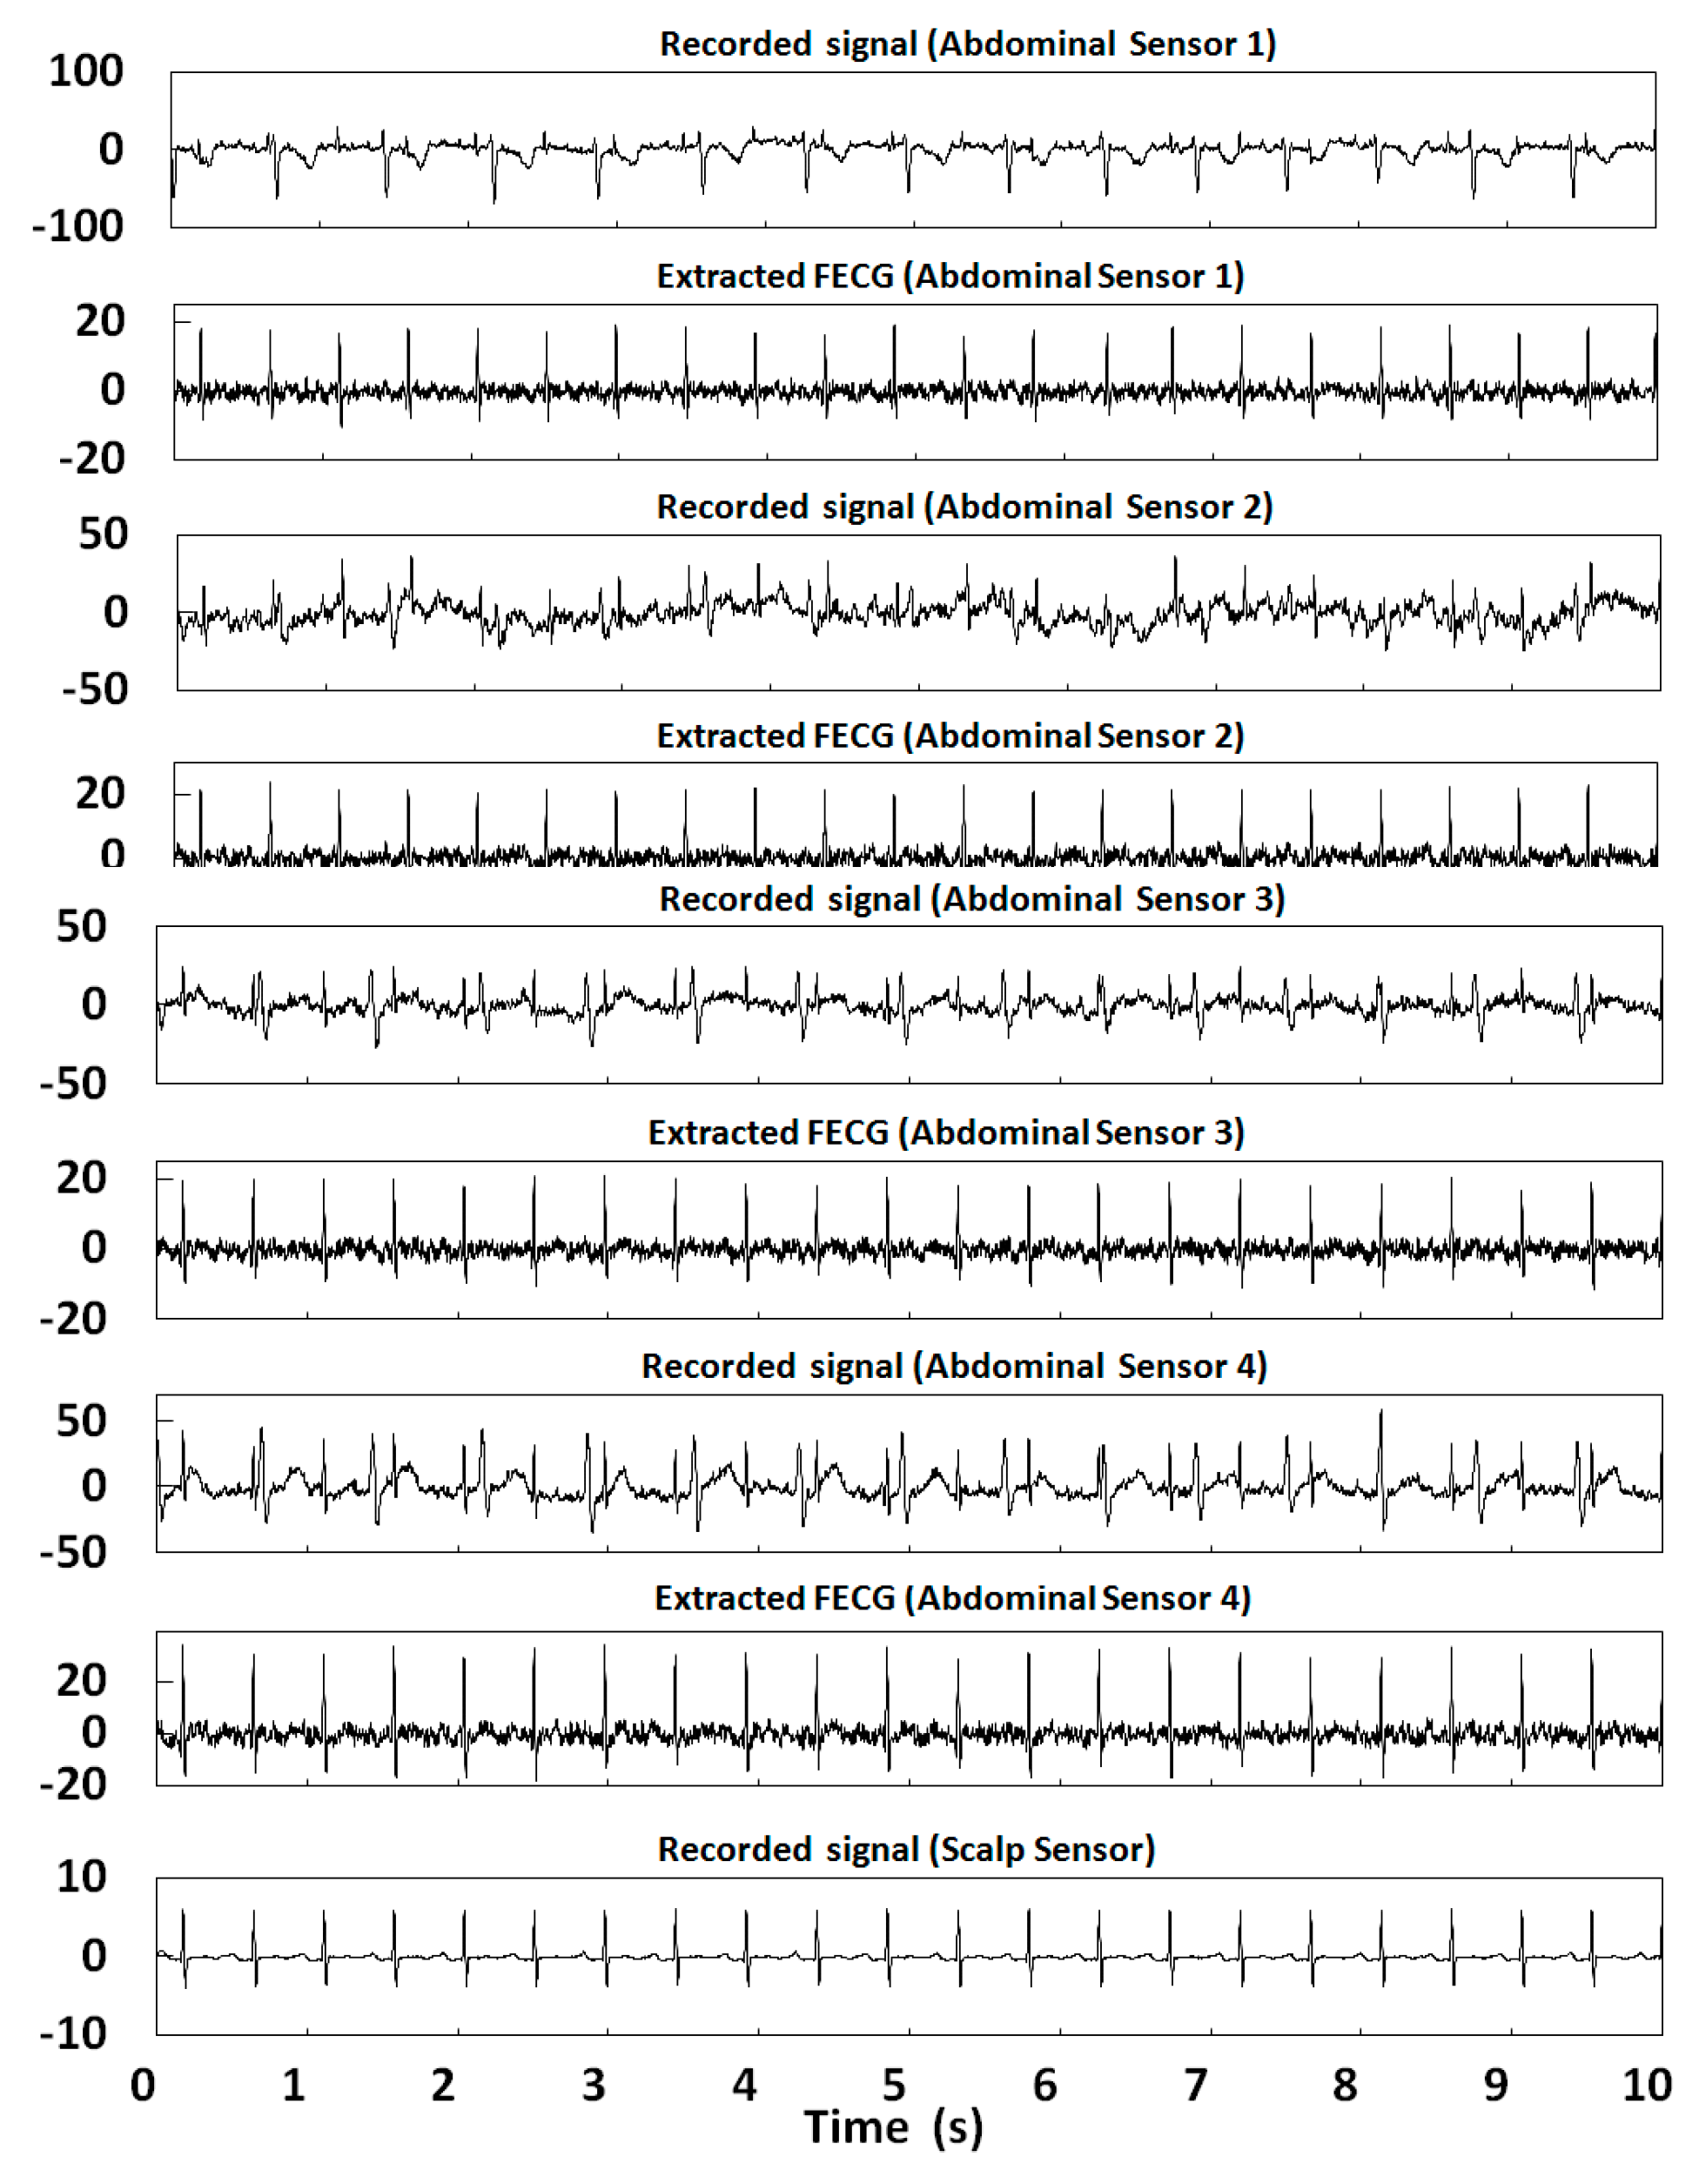
4.2.2. ADFECGDB
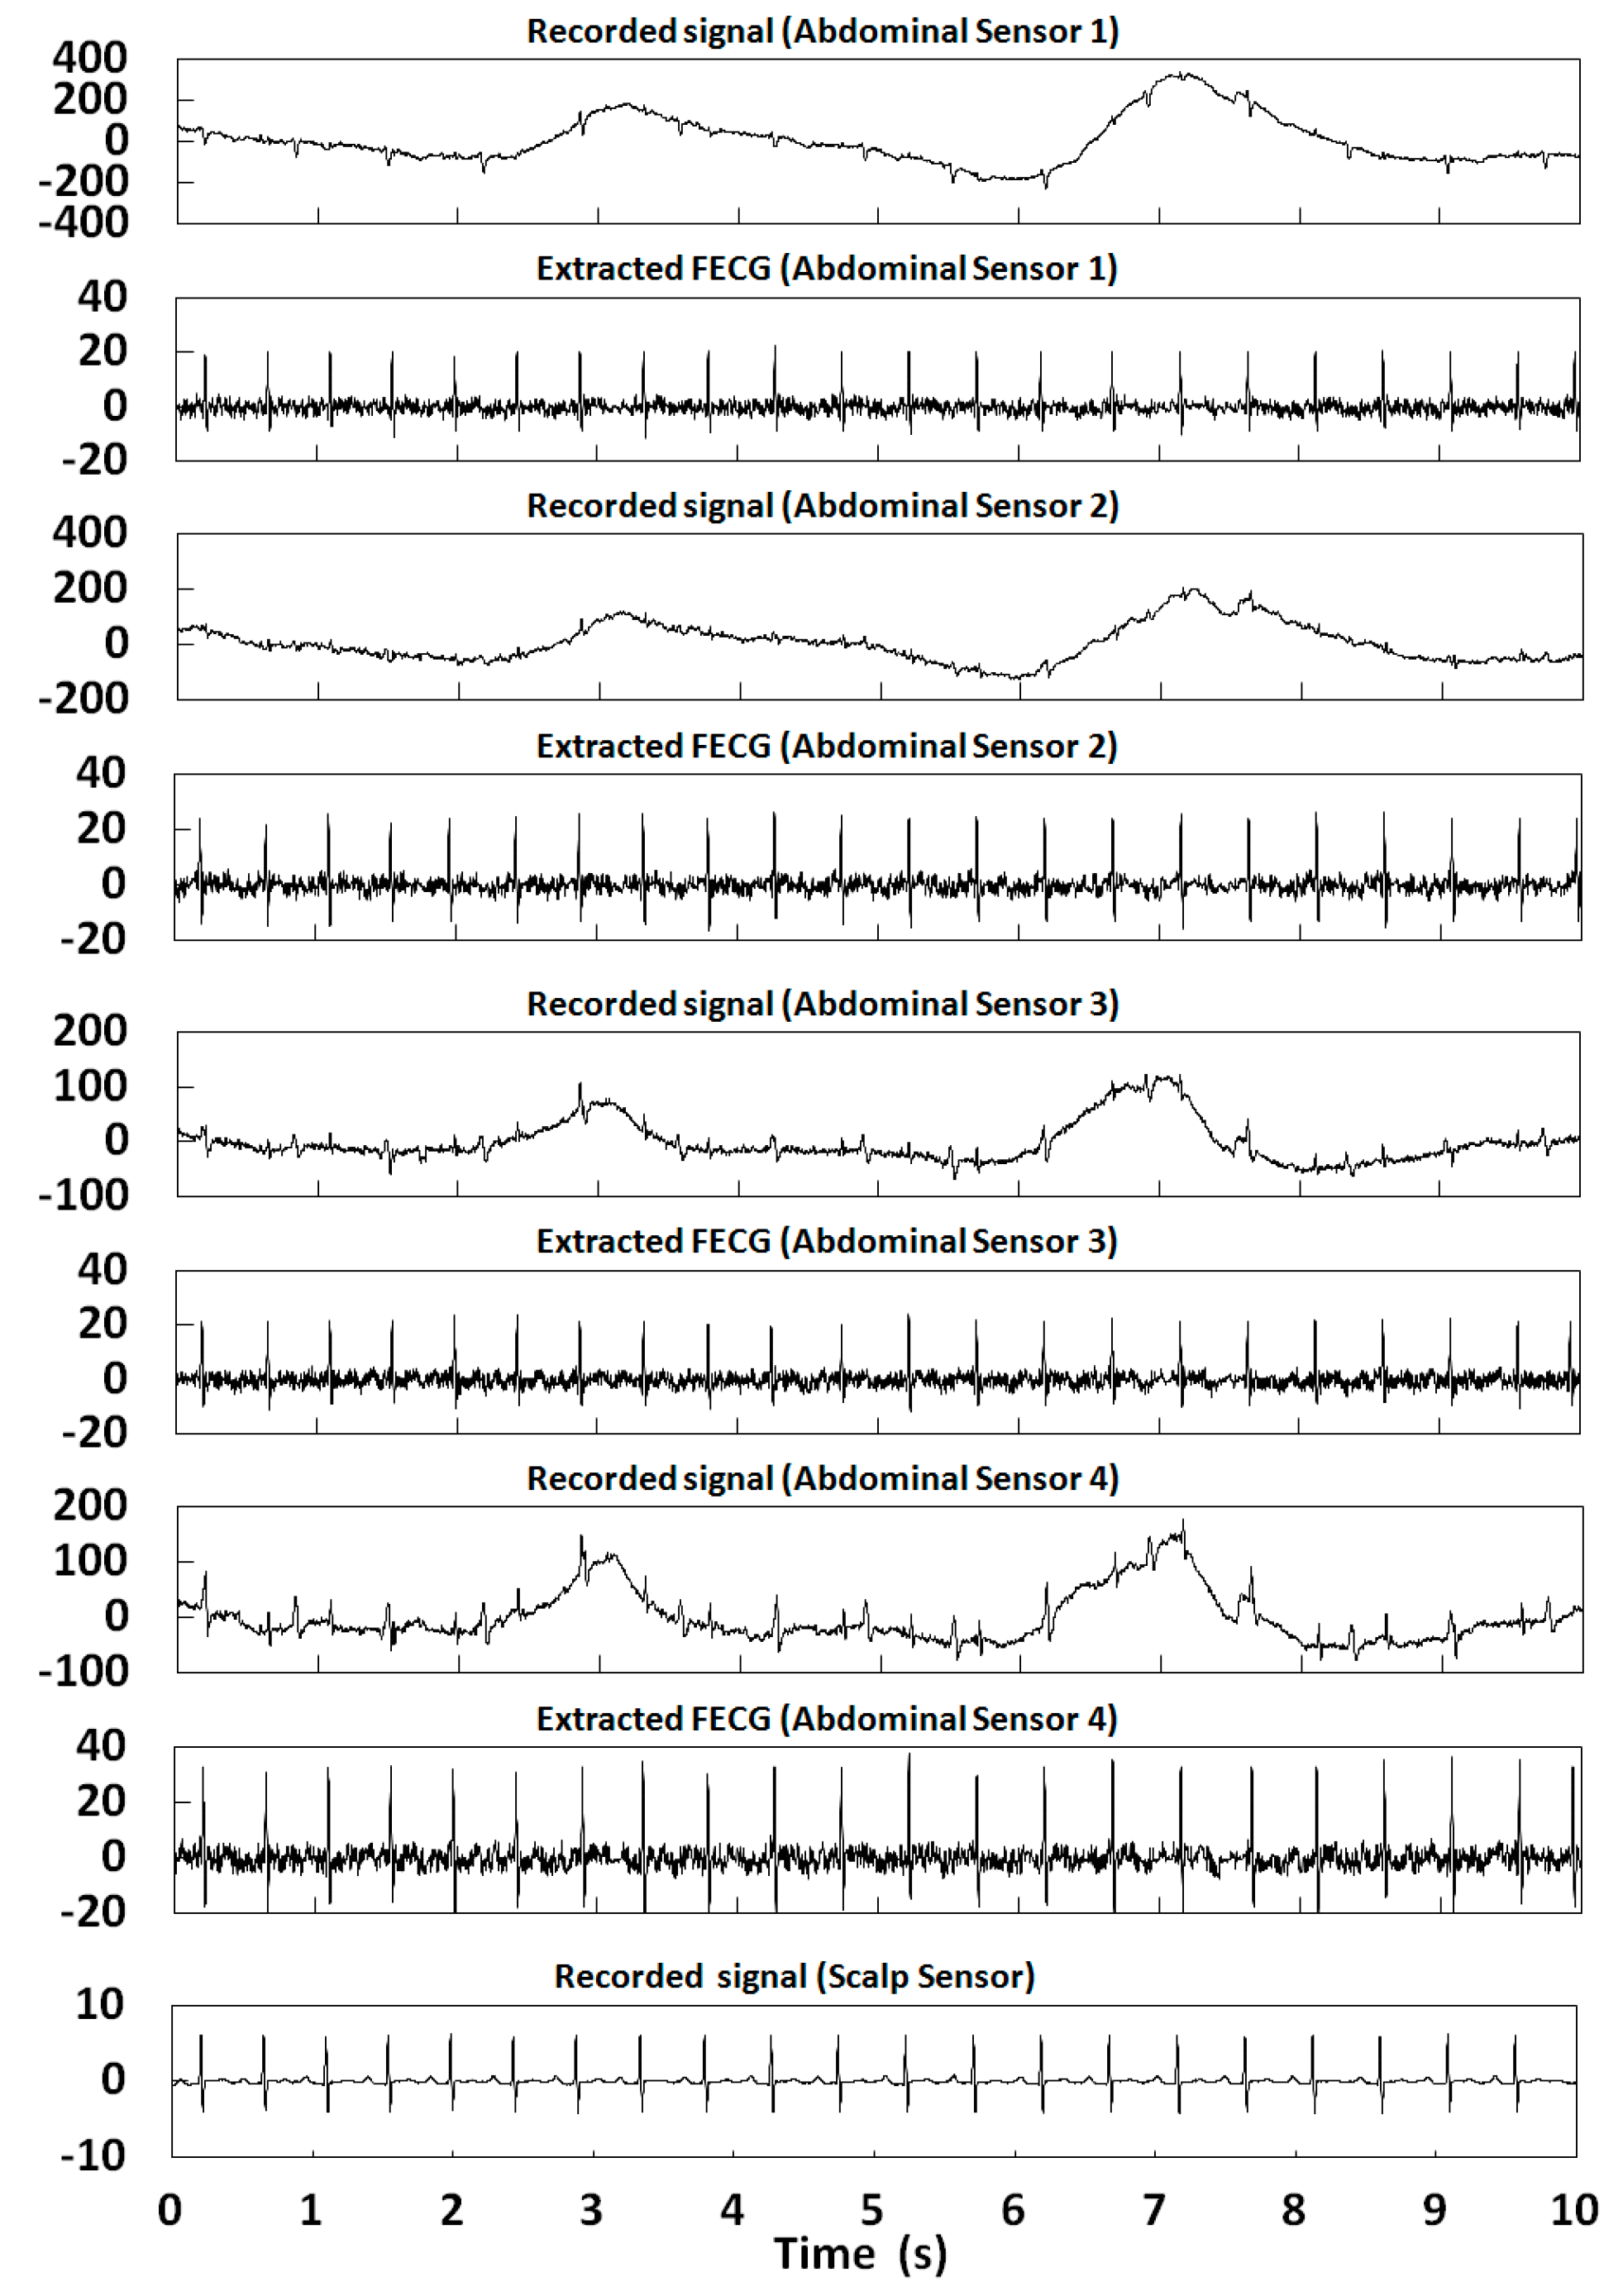
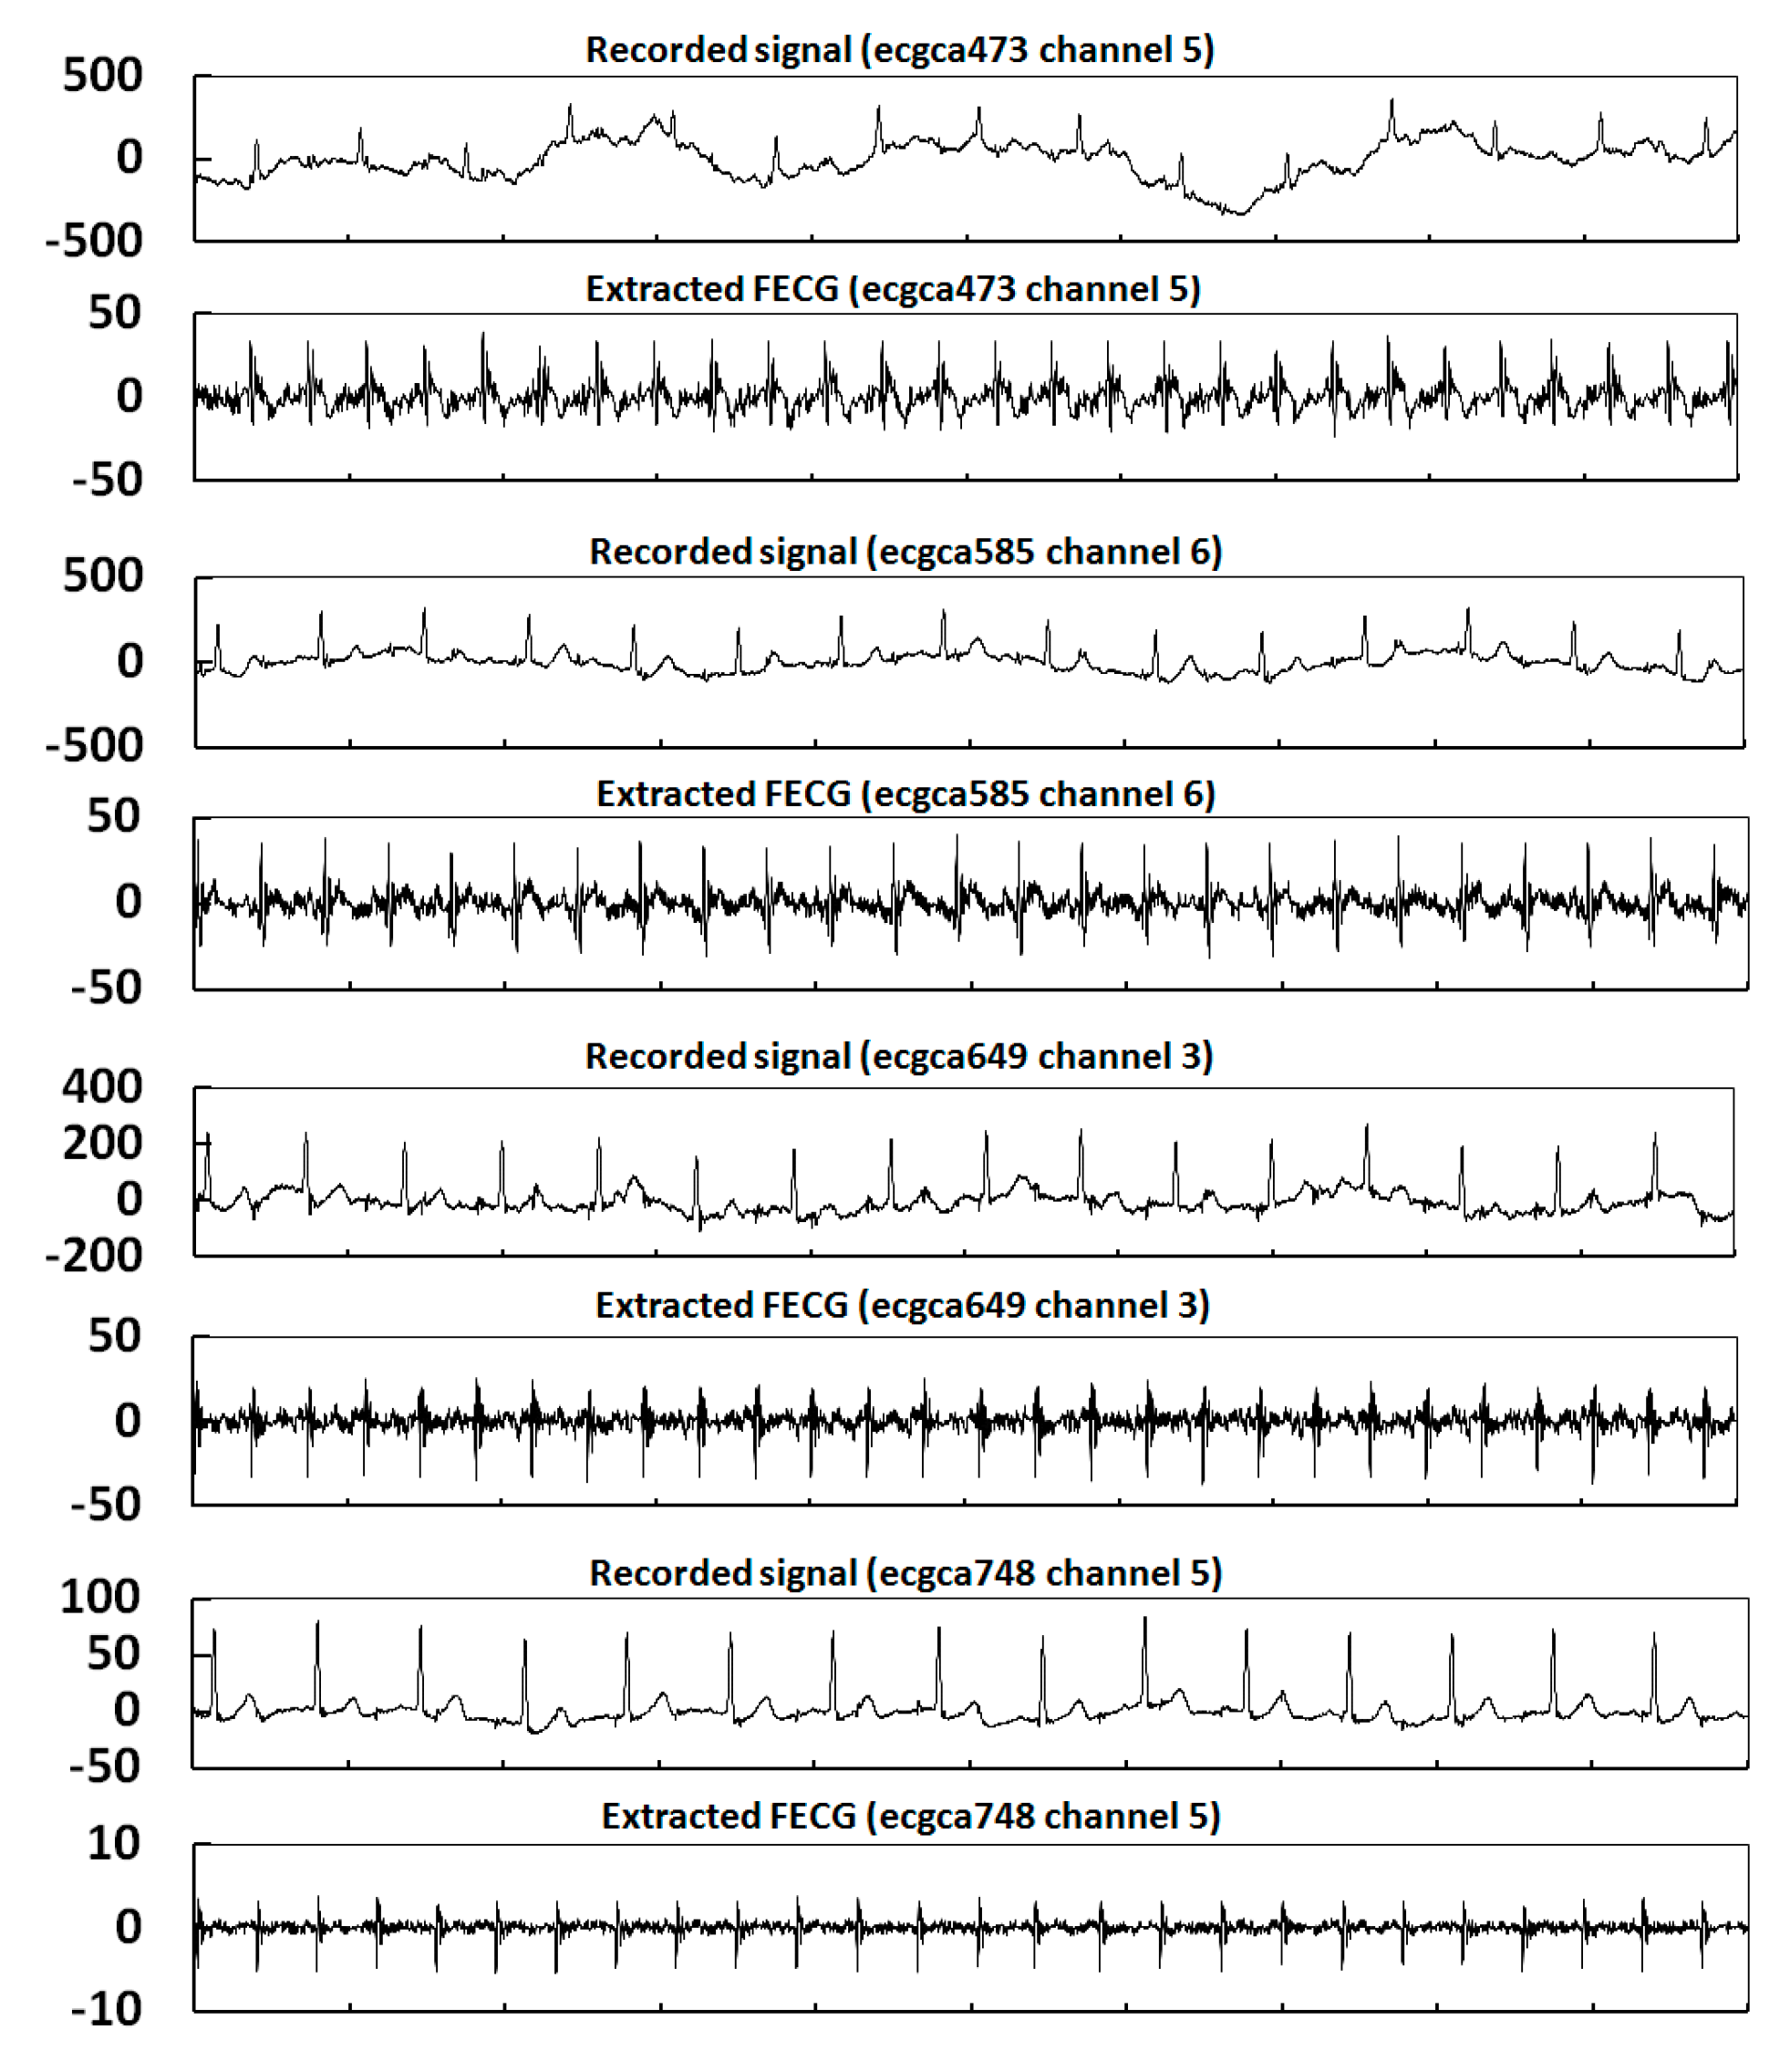
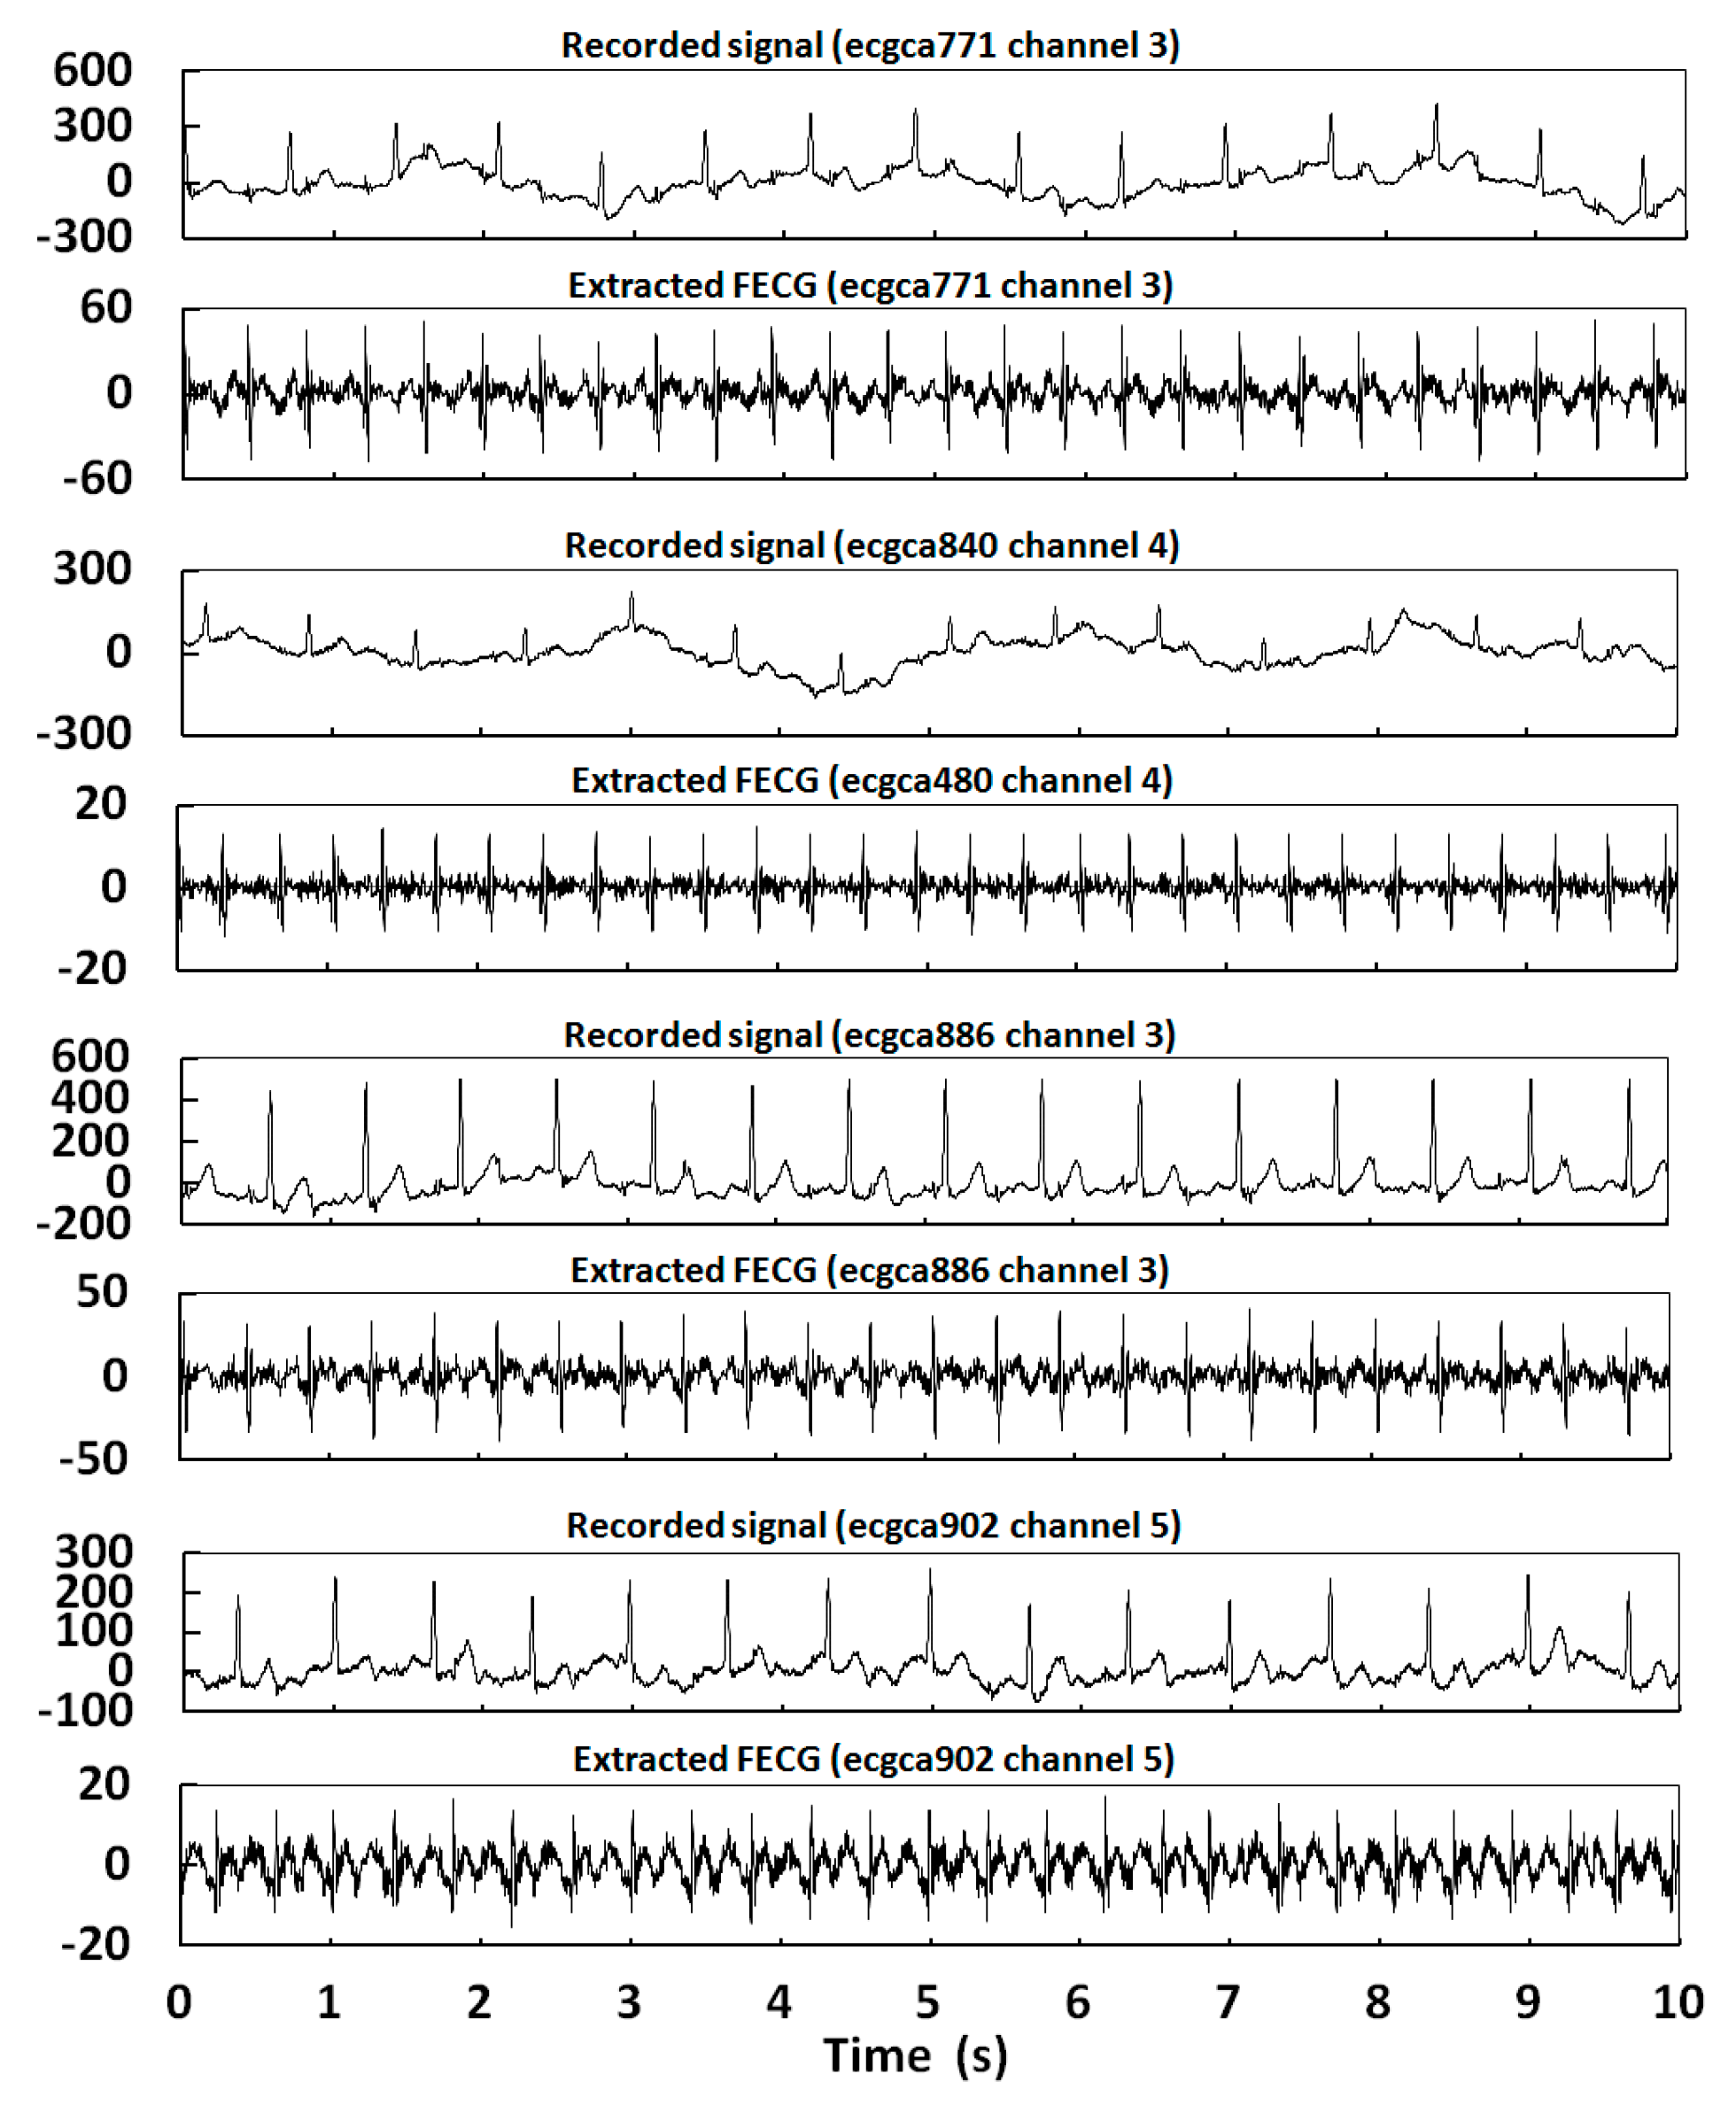
4.2.3. NIFECGDB
5. Conclusions
Author Contributions
Funding
Conflicts of Interest
References
- Jenkins, H.M. Technical progress in fetal electrocardiography—A review. J. Perinat. Med. 1986, 14, 365–370. [Google Scholar] [PubMed]
- Jenkins, H.M. Thirty years of electronic intrapartum fetal heart rate monitoring: Discussion paper. J. R. Soc. Med. 1989, 82, 210–214. [Google Scholar] [CrossRef] [PubMed]
- Sameni, R.; Clifford, G.D. A review of fetal ECG signal processing; issues and promising directions. Open Pacing Electrophysiol. Ther. J. 2010, 3, 4–20. [Google Scholar] [CrossRef] [PubMed]
- Han, G.; Lin, B.; Xu, Z. Electrocardiogram signal denoising based on empirical mode decomposition technique: An overview. J. Instrum. 2017, 12, P03010. [Google Scholar] [CrossRef]
- Awal, M.A.; Sheikh, S.M.; Mohiuddin, A.; Mohd, A.R. An adaptive level dependent wavelet thresholding for ECG denoising. Biocybern. Biomed. Eng. 2014, 34, 238–249. [Google Scholar] [CrossRef]
- Liu, H.; Chen, D.; Sun, G. Detection of Fetal ECG R Wave from Single-Lead Abdominal ECG Using a Combination of RR Time-Series Smoothing and Template-Matching Approach. IEEE Access 2019, 7, 66633–66643. [Google Scholar] [CrossRef]
- Cerutti, S.; Baselli, G.B.; Civardi, S.; Ferrazzi, E.; Marconi, A.M.; Pagani, M.; Pardi, G. Variability analysis of fetal heart rate signals as obtained from abdominal electrocardiographic recordings. J. Perinat. Med. 1986, 14, 445–452. [Google Scholar] [CrossRef]
- Martens, S.M.M.; Rabotti, C.; Mischi, M.; Sluijter, R.J. A Robust Fetal ECG Detection Method for Abdominal Recordings. Physiol. Meas. 2007, 28, 373–388. [Google Scholar] [CrossRef]
- Ungureanu, M.; Bergmans, J.W.M.; Oei, S.G.; Strungaru, R. Fetal ECG extraction during labor using an adaptive maternal beat subtraction technique. Biomed. Tech. 2007, 52, 56–60. [Google Scholar] [CrossRef]
- Behar, J.; Johnson, A.; Clifford, G.D.; Oster, J. A comparison of single channel fetal ECG extraction methods. Ann. Biomed. Eng. 2014, 42, 1340–1353. [Google Scholar]
- Puthusserypady, S. Extraction of fetal electrocardiogram using H-infinity adaptive algorithms. Med. Biol. Eng. Comput. 2007, 45, 927–937. [Google Scholar] [CrossRef] [PubMed]
- Kiruthiga, G.; Sharmil, A.A.; Mahalakshmi, P. Enhancement of fetal ECG signal using adaptive noise cancellation. Int. J. Pharma. Biol. Sci. 2015, 6, 943–950. [Google Scholar]
- Wu, S.; Shen, Y.; Zhou, Z.; Lin, L.; Zeng, Y.; Gao, X. Research of fetal ECG extraction using wavelet analysis and adaptive filtering. Comput. Biol. Med. 2013, 43, 1622–1627. [Google Scholar] [CrossRef] [PubMed]
- Khamene, A.H.; Negahdaripoure, S. A new method for the extraction of fetal ECG from the composite abdominal signal. IEEE Trans. Biomed. Eng. 2000, 47, 507–516. [Google Scholar] [CrossRef]
- Karvounis, E.C.; Tsipouras, M.G.; Fotiadis, D.I.; Naka, K.K. An automated methodology for fetal heartrate extraction from the abdominal electrocardiogram. IEEE Trans. Inf. Technol. Biomed. 2007, 11, 628–638. [Google Scholar] [CrossRef]
- Castillo, E.; Morales, D.P.; Botella, G.; Garcia, A.; Parrilla, L.; Palma, A.J. Efficient wavelet-based ECG processing for single-lead FHR extraction. Digit. Signal Process. 2013, 23, 1897–1909. [Google Scholar] [CrossRef]
- Almeida, R.; Goncalves, H.; Bernardes, J.; Rocha, A.P. Fetal QRS detection and heart rate estimation: A wavelet-based approach. Physiol. Meas. 2014, 35, 1723–1735. [Google Scholar] [CrossRef]
- Lamesgin, G.; Kassaw, Y.; Assefa, D. Extraction of Fetal ECG from Abdominal ECG and Heart Rate Variability Analysis. Adv. Intell. Syst. Comput. 2015, 334, 147–161. [Google Scholar]
- Lee, K.; Lee, B. Sequential Total Variation Denoising for the Extraction of Fetal ECG from Single-Channel Maternal Abdominal ECG. Sensors 2016, 16, 1020. [Google Scholar] [CrossRef]
- Panigraphy, D.; Sahu, P.K. Extraction of fetal ECG by extended state Kalman filtering and adaptive neuro-fuzzy inference system based on single channel. Sadhana 2015, 40, 1091–1104. [Google Scholar] [CrossRef]
- Kanjilal, P.P.; Palit, S.; Saha, G. Fetal ECG extraction from single-channel maternal ECG using singular value decomposition. IEEE Trans. Biomed. Eng. 1997, 44, 51–59. [Google Scholar] [CrossRef]
- Zhang, Y.; Yu, S. Single-lead noninvasive fetal ECG extraction by means of combining clustering and principal components analysis. Med. Biol. Eng. Comput. 2020, 58, 419–432. [Google Scholar] [CrossRef]
- Richter, M.; Schreiber, T.; Kaplan, D.T. Fetal ECG extraction with nonlinear state-space projections. IEEE Trans. Biomed. Eng. 1998, 45, 133–137. [Google Scholar] [CrossRef] [PubMed]
- Kotas, M.; Jezewski, J.; Matonia, A.; Kupka, T. Towards noise immune detection of fetal QRS complexes. Comput. Methods Programs Biomed. 2010, 97, 241–256. [Google Scholar] [CrossRef] [PubMed]
- Nagendra, H.; Mukherjee, S.; Kumar, V. Application of wavelet techniques in ECG signal processing: An overview. Int. J. Eng. Sci. Tech. 2011, 3, 7432. [Google Scholar]
- Van Mieghem, T.; DeKoninck, P.; Steenhaut, P.; Deprest, J. Methods for Prenatal Assessment of Fetal Cardiac Function. Prenat. Diagn. 2009, 29, 1193–1203. [Google Scholar] [CrossRef] [PubMed]
- DuBose, T.J.; Cunyus, J.A.; Johnson, L.F. Embryonic heart rate and age. J. Diagnost. Med. Sonogr. 1990, 6, 151–157. [Google Scholar] [CrossRef]
- Mohammad, N.; Bertrand, R.; Christian, J. Fetal ECG Extraction by Extended State Kalman Filtering Based on Single-Channel Recordings. IEEE Trans. Biomed. Eng. 2013, 60, 1345–1352. [Google Scholar]
- McSharry, P.E.; Clifford, G.D. A Dynamical Model for Generating Synthetic Electrocardiogram Signals. IEEE Trans. Biomed. Eng. 2003, 50, 289–294. [Google Scholar] [CrossRef]
- Sameni, R.; Clifford, G.D.; Jutten, C.; Shamsollahi, M.B. Multichannel ECG and Noise Modeling: Application to Maternal and Fetal ECG Signals. EURASIP J. Adv. Signal Process. 2007, 1, 043407. [Google Scholar] [CrossRef]
- Jezewski, J.; Matonia, A.; Kupka, T.; Roj, D.; Czabanski, R. Determination of the fetal heart rate from abdominal signals: Evaluation of beat-to-beat accuracy in relation to the direct fetal electrocardiogram. Biomed. Eng. 2012, 57, 383–394. [Google Scholar] [CrossRef] [PubMed]
- The MIT-BIH Non-Invasive Fetal Electrocardiogram Database. Available online: http://www.phsionet.org/pn3/nifecgdb (accessed on 6 September 2007).
- Moor, B.D.; Gersem, P.D.; Schutter, B.D.; Favoreel, W. DAISY: A database for identification of systems. Journal A 1997, 38, 4–5. [Google Scholar]
- Moody, G.B.; Mark, R.G. The MIT-BIH Arrhythmia Database on CD-ROM and software for use with it. Proc. Comput. Cardiol. 1990, 185–188. [Google Scholar] [CrossRef]


| ECG Type | Database | Electrode Position | Number and Channel | Average Heart Rate (bpm) | Sampling Rate (Hz) | Data Length (s) | Waveform Similarity (CR) |
|---|---|---|---|---|---|---|---|
| FECG | ADFECGDB | Scalp | r01 | 128 | 1000 | 10 | 0.962 |
| r04 | 124 | 0.949 | |||||
| r07 | 127 | 0.950 | |||||
| r08 | 128 | 0.981 | |||||
| r10 | 117 | 0.919 | |||||
| MECG | DaISy | Chest | Ch6 | 82 | 250 | 10 | 0.995 |
| Ch7 | 82 | 0.997 | |||||
| Ch8 | 82 | 0.996 | |||||
| NIFECGDB | Chest | ca473 | 89 | 1000 | 10 | 0.993 | |
| ca585 | 89 | 0.992 | |||||
| ca649 | 96 | 0.996 | |||||
| ca748 | 91 | 0.991 | |||||
| ca771 | 87 | 0.992 | |||||
| ca840 | 85 | 0.992 | |||||
| ca886 | 92 | 0.995 | |||||
| ca902 | 90 | 0.991 | |||||
| Adult ECG | MIT-BIH | Chest | a100 | 73 | 360 | 10 | 0.998 |
| a101 | 68 | 0.998 | |||||
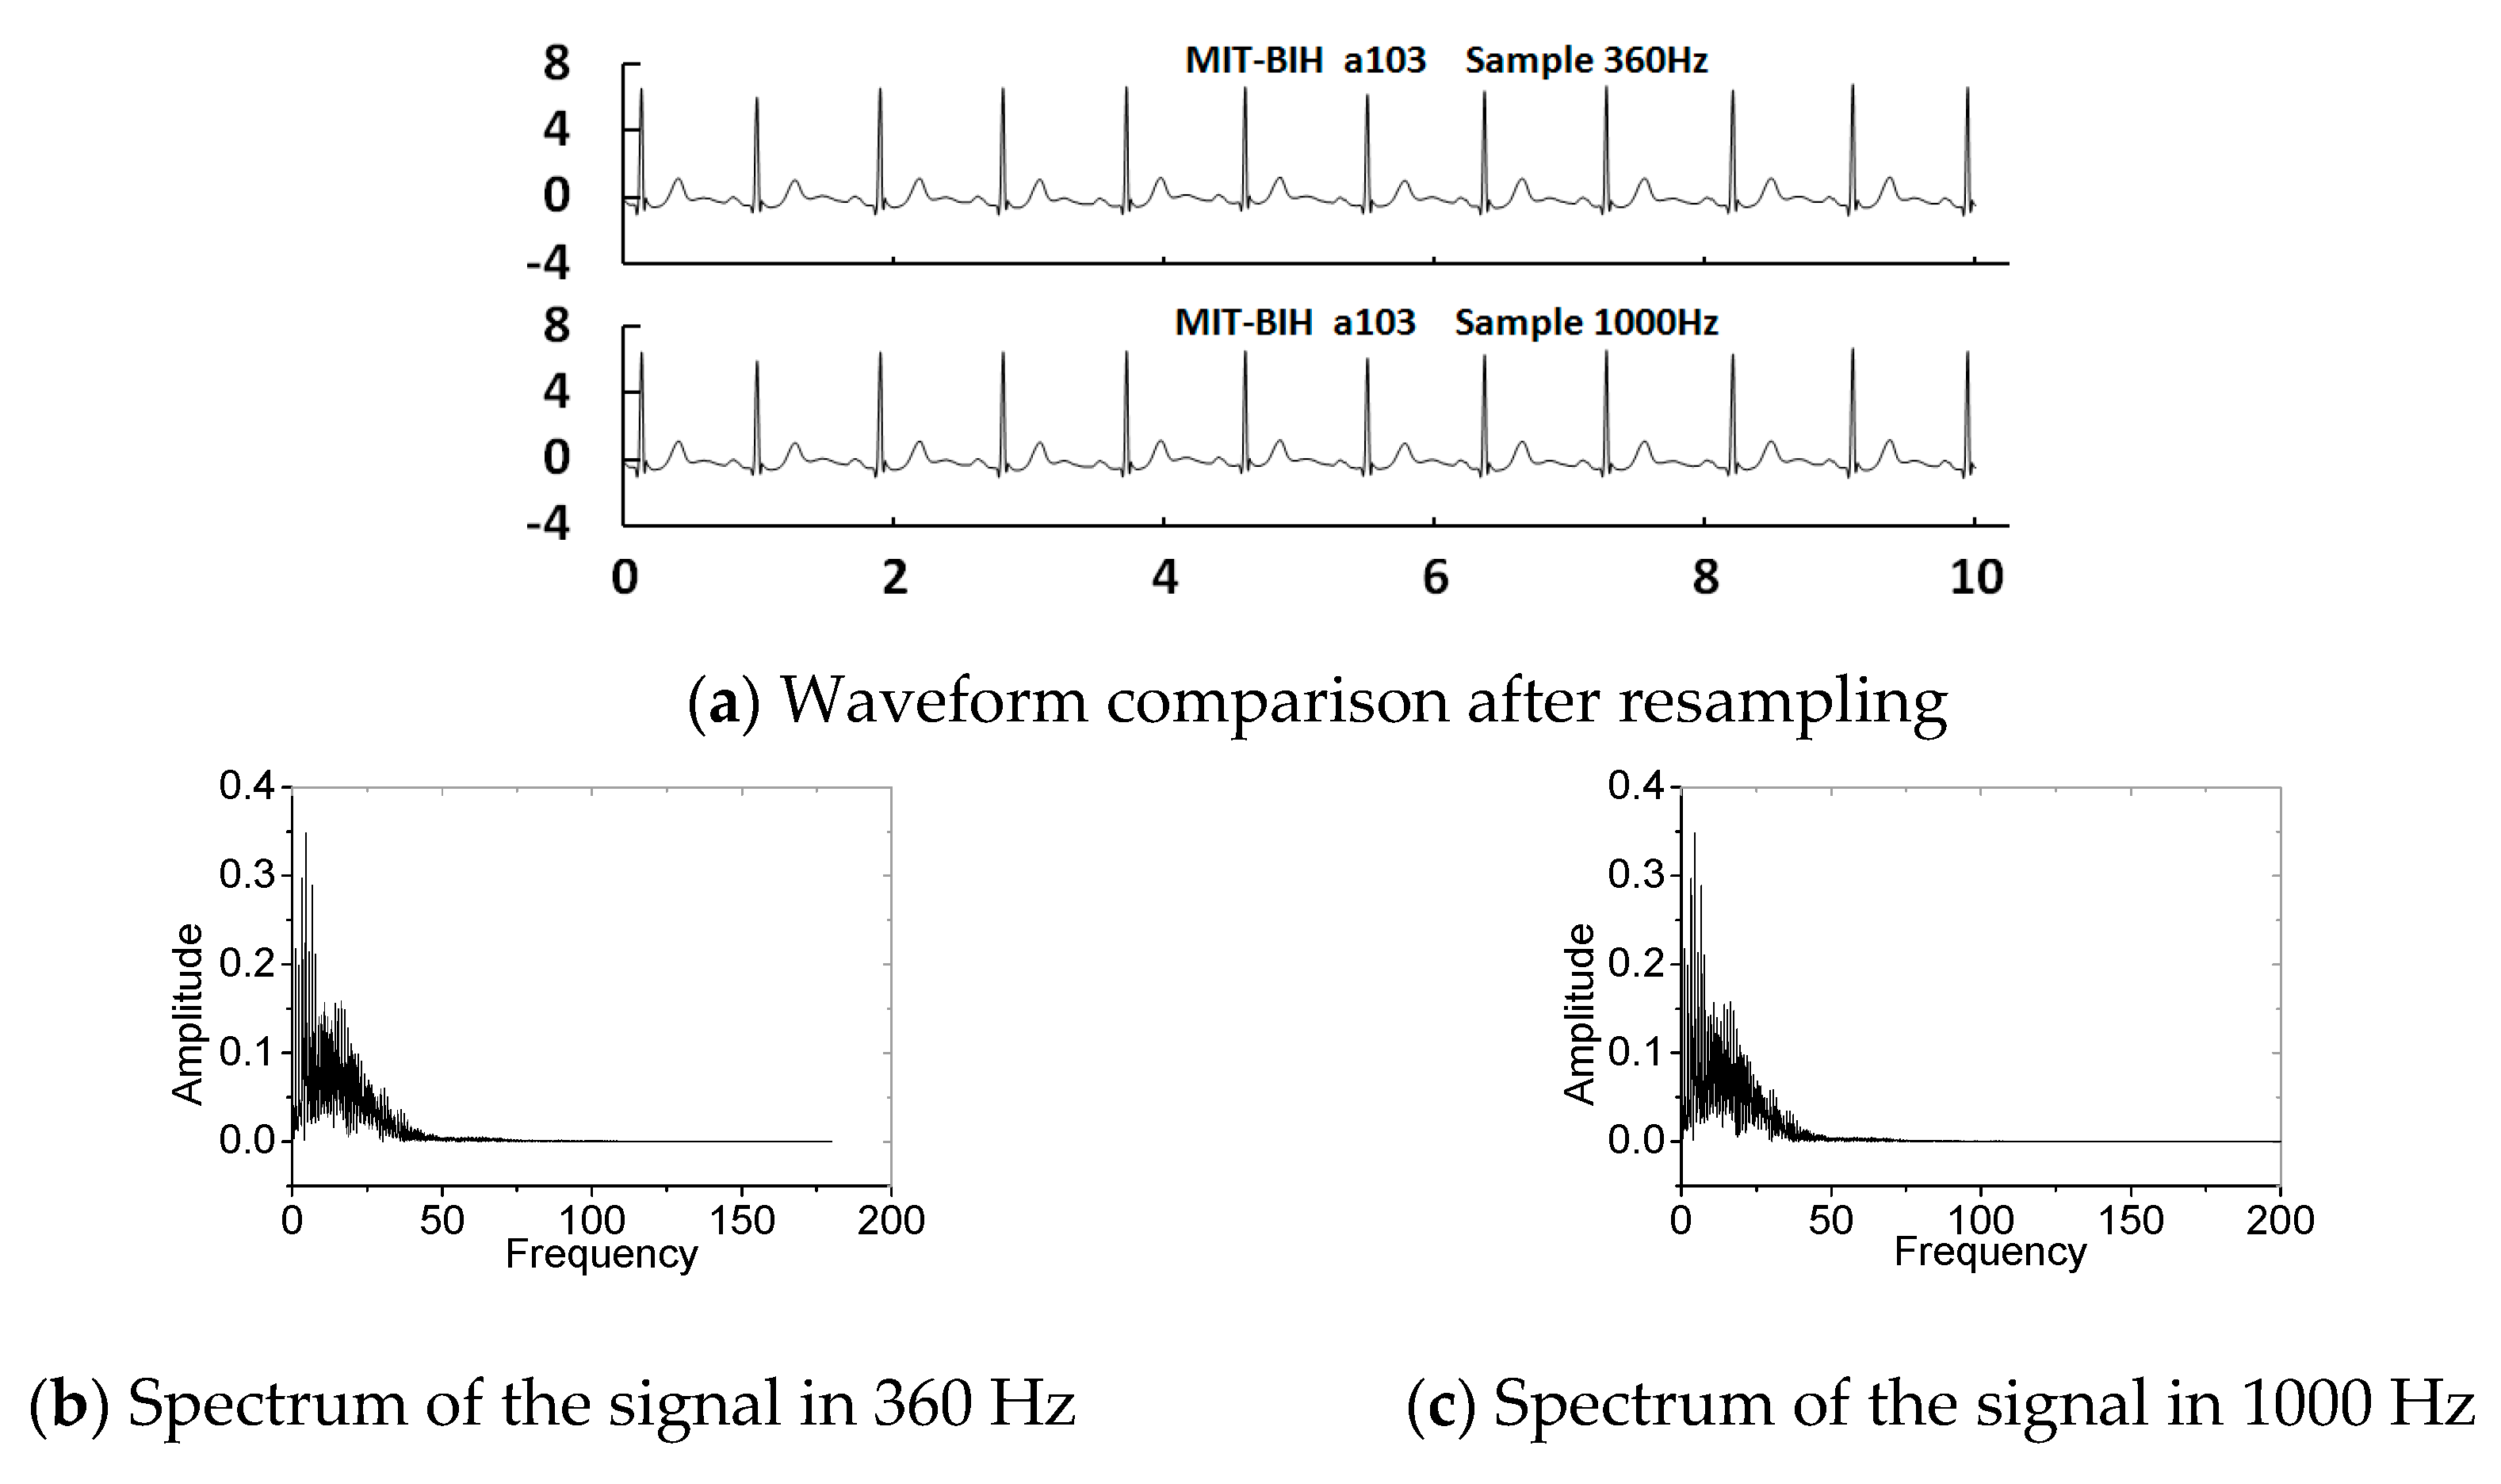
| a103 | 67 | 0.999 | |||||
| a112 | 87 | 0.996 | |||||
| a113 | 58 | 0.999 | |||||
| a115 | 63 | 0.999 | |||||
| a117 | 50 | 0.997 | |||||
| a119 | 65 | 0.998 | |||||
| a122 | 87 | 0.998 | |||||
| a123 | 45 | 0.998 |
| ch1 | ch2 | ch3 | ch4 | |
|---|---|---|---|---|
| r01 | 0.798 | 0.764 | 0.756 | 0.847 |
| r04 | 0.795 | 0.785 | 0.808 | |
| r07 | 0.821 | 0.767 | 0.802 | |
| r08 | 0.737 | 0.659 | 0.701 | 0.703 |
| r10 | 0.781 | 0.742 | 0.571 |
© 2020 by the authors. Licensee MDPI, Basel, Switzerland. This article is an open access article distributed under the terms and conditions of the Creative Commons Attribution (CC BY) license (http://creativecommons.org/licenses/by/4.0/).
Share and Cite
Zhang, M.; Wei, G. An Instantaneous Correlation Coefficient and Simplified Coherent Averaging Method for Single-Channel Foetal ECG Extraction. Appl. Sci. 2020, 10, 5634. https://doi.org/10.3390/app10165634
Zhang M, Wei G. An Instantaneous Correlation Coefficient and Simplified Coherent Averaging Method for Single-Channel Foetal ECG Extraction. Applied Sciences. 2020; 10(16):5634. https://doi.org/10.3390/app10165634
Chicago/Turabian StyleZhang, Miao, and Guo Wei. 2020. "An Instantaneous Correlation Coefficient and Simplified Coherent Averaging Method for Single-Channel Foetal ECG Extraction" Applied Sciences 10, no. 16: 5634. https://doi.org/10.3390/app10165634
APA StyleZhang, M., & Wei, G. (2020). An Instantaneous Correlation Coefficient and Simplified Coherent Averaging Method for Single-Channel Foetal ECG Extraction. Applied Sciences, 10(16), 5634. https://doi.org/10.3390/app10165634