1. Introduction
Industries need to be more competitive in order to survive in the increasingly dynamic and global environment. For this reason, they require different methodological approaches to make their operations more efficient. Some problems that block such operations’ efficiency and disable the ability to respond to the environment, could be administrative, financial, or a production process, among others. In this article, we will focus on improving such a production process.
A process is any activity that occurs within the company [
1] and, in this case, if there are problems in the processes, it is difficult to meet customer expectations in quality, delivery time, among others, which are qualities that are currently necessary. In addition, a process is a collection of activities that has one or more inputs and generates an output that adds value to the customer [
2], which is also a process that could be seen as chains of activities and decisions [
3]. According to Laguna and Marklund [
4], the essence of process design is related to doing things in the “correct” way. Correct in this context refers to the process being efficient and effective. Efficiency refers to the fact that the customer’s requirements must be met at the correct time.
For Davenport [
2], business must be viewed in terms of redesigning the process from the beginning to the end using resources that are available in the company. Using resources that the company has is important for industries in emergent economies that do not have money to invest, and desire major improvements in quality, flexibility, service levels, or productivity [
5]. In our context, a business problem is not adequately employing the resources that the organization has: machinery, equipment, facilities, etc., to achieve a response to the client in terms of time, quality, and service.
Being productive is related to different factors. Some of them are considered within this research work, since they were used precisely for the solution of the case study. Among them, there are adequate flows of the product, arrangements of the plant, and correct allocation of human-machine resources to the different activities that the process requires. Productivity can be defined as the number of outputs or finished products per unit of time [
4,
6]. Productivity can also be calculated by dividing item prices by their costs [
7] and can be compared with past values from the same company for analysis. In this work, we will use the amount of production per unit of time, but we will use it to carry out analysis of different scenarios.
The main objective of this article is describing a case study carried out in an industrial shoe company in the state of Hidalgo, Mexico. In this company, there were productivity problems caused by the poor flow of the product. To deal with it, the reengineering phases were applied and, through these, a proposal was presented, which was analyzed through simulation. The study company did not want to be identified in this article so it will be called “the company” from now on, but the result of this intervention was implemented. This article presents the applied methodology and the results found this work could help other companies that have no idea how to identify and solve problems within their organizations.
The rest of the article is organized in the following sections. First is the literature review, which cites some works related to reengineering and simulation. Second, in
Section 3, the materials and methods were described. The methodology is presented in
Section 4 for Reengineering and
Section 5 describes the simulation. In
Section 6, the most important results are analyzed. Lastly, in
Section 7, the conclusions of the work are given.
2. Literature Review
Before focusing on reengineering and simulation, it is necessary to mention other disciplines. Reengineering is not the only discipline that is concerned with improving the operational performance of organizations. Total Quality Management (TQM) preceded and inspired reengineering. The focus is on continuously improving and sustaining the quality of products while reengineering focus on the improvement of processes. Operations management is a field relevant to production and manufacturing. This area includes probability theory, queuing theory, mathematical modeling, Markov chains, and simulation techniques for improving the efficiency from this perspective. Operations management could be applied to existing processes and reengineering generates a new one. Another technique is lean manufacturing that pursue waste elimination for eliminating activities that did not add value to the customer such as using value stream mapping. Both reengineering and lean manufacturing have the customer orientation as a principle. Another technique is Six Sigma that focuses on minimizing errors and defects when measuring process output. Many Six Sigma techniques are applied in reengineering. All these techniques not only have similarities with reengineering, but can be combined with it [
3,
4].
The task arrangement and the excessive control of them are not the appropriate approach to achieve better production times within a productive organization [
8]. There are now methodologies where the client plays the most important role and the service provided can be the difference between a company and its competition. It is for this reason that a small improvement fails to position companies, as the offer is extremely huge, and customers are increasingly selective when making purchases. Reengineering achieves dramatic enhancements through a complete redesign of core business processes, combined with rapid implementation, which makes it a strategy when significant changes need to be achieved. At this point, the definition of best fit is to “start again” [
1]. According to Manganelli and Klein [
9], reengineering is the answer when it is required to optimize workflows and productivity in an organization, as in the case presented in this study. Therefore, there are three types of improvement in the processes of organizations, which include a small improvement in one of the activities of the process, a redesign of the process, that involves changes in all operations, and reengineering, which is a radical redesign that destroys assumptions, builds again, and achieves dramatic changes in some performance measures [
1,
8].
For Hammer and Champy [
1], reengineering is the fundamental revision and radical redesign of processes to achieve spectacular improvements in contemporary and critical measures of performance such as costs, quality, service, and speed. In this sense, it is always necessary to have measures of performance that provide clarity to know if the desired objective was accurate. Since the 1990s, when reengineering was first used, it has been successfully applied to different case studies. Ford, Mutual Benefit Life [
8], Taco Bell [
1], and others stand out. Hammer and Champy [
1] considered a formal idea of what reengineering should be including the assumptions, what was expected in terms of achievement, and documented case studies. However, a formal methodology of how to achieve this was not detailed because reengineering must adapt to the particular situation of each company. As the years have passed, the concept has matured by applying it to different cases with significant results. Some of them are presented below.
Generally, Reengineering is combined with other methodologies because it is useful to analyze the root of the problems and present proposals for solutions based on its principles, but, to test if these proposals are adequate and implement them, it is necessary to use other tools. Nguyen [
10] combines reengineering and lean manufacturing to improve an electronic assembly line by achieving a 40% decrease in the number of workers and 30% savings in production plant space. Other articles use basic tools but achieve significant changes. For example, with the application of reengineering to an air cargo handling company [
11], flowcharts were used to analyze the number of activities, delays, etc. before and after applying reengineering, which achieves improvements in service. Reengineering and a balanced scorecard are used in the work of Turhan [
12] where reengineering is applied to the supply chain. It is also used with a balanced scorecard in References [
13,
14] to make the diagnosis and present proposals to a bamboo panel construction company, which helps achieve improvements in the design of products, processes, and design of administrative activities.
Regardless of the number of companies involved in reengineering, the rate of failure in reengineering projects is more than 50 [
1]. Some frequently mentioned problems related to reengineering include the inability to accurately predict the outcome of a radical change, and the inability to recognize the dynamic nature of the processes. Additionally, some publications argue that one major problem that contributes to the “failure” of reengineering projects is the lack of tools for evaluating the effects of designed solutions before implementation [
15,
16]. One way to do this is through simulation, since you have access to modify different input variables, while analyzing different parameters such as productivity, use of resources, along with others, and deciding on the best strategy. Simulation performance indicators are necessary to carry out the analysis [
17]. The simulation also provides a graphical way of understanding the process flow, which is easily followed by the end user. It is possible to stop and modify and run again in such a way that each operation can be analyzed in a simple way [
18].
Modeling through simulation is one of the most widely used techniques and can be considered a representation of a real system and in which it is experimented with the purpose of having a better understanding of its behavior and evaluating the impact of alternative strategies [
19]. In today’s dynamic environment, simulation helps us understand complex processes and can be used to make decisions within organizations [
20].
There are many proven cases in the literature where reengineering and simulation have been used. Some of them related to production processes, Chen [
21] applied reengineering to a construction company, where the traditional production is changed to a flow shop and the proposal is tested through simulation in Reference [
22]. Reengineering and simulation are also combined to decrease bottleneck operations in a company that manufactures ceramic products by obtaining a 50% reduction in the time cycle and a reduction in delivery time from 3 to 1.5 days. Irani, Hulpic, and Giaglis [
23] present the analysis in a production company, where reengineering was implemented using a simulation and innovation method to support decision-making. In a similar way, they have used both methodologies to service processes. See the works Sung [
24] and Qiang et al. [
25] in hospitals in which the first for improved surgical care and the second for hospital registration. Xiaoming and Xueqing [
26] developed a framework for reengineering construction processes and corresponding methodologies that integrate lean principles and computer simulation techniques. Previous studies agree that simulation allows testing and analysis of different scenarios to understand their impact and assess feedback before moving forward with implementation plans.
Although other methodologies were analyzed when the intervention was being carried out in the organization, it was decided to use reengineering since it only requires simple activities such as training personnel. Another advantage is that human and economic resources that the company already has can be used, which makes it feasible. Moreover, the principles include destroying assumptions and starting again instead of not using technology without having analyzed if there are any problems in the process In addition to the numerous success stories in implementing it, they made it the ideal strategy to analyze the problem and issue a proposal. The simulation served to analyze this proposal with different scenarios before its implementation, as it is detailed in the next section. As a conclusion, there is no unique methodology for applying reengineering and sometimes it fails because it is not possible to test the effectiveness of the proposals made through reengineering, which is why we also address simulation. At the time the article was written, no references were found that used reengineering applied to an industrial footwear company.
3. Materials and Methods
As mentioned in the previous section, reengineering does not require too many resources since the human resources available to the organization can be used. Only the authors of this article were independent from it and the proposals issued were not small gradual changes. In addition to providing training, it also includes taking time of operations and attending meetings. These meetings were held in a small room provided by the company. The authors also carried out field work, design of the methodology, analysis of results, and more. To do this, they used the Arena™ 14.0 software to perform the simulation and Minitab™ 18.0 to perform the statistical analysis. The issue and the methodology used are detailed below.
3.1. Problem Description
The study described below was implemented in an industrial shoe company in the state of Hidalgo, Mexico. In the moment that we did the intervention in the company, they had a Make to Stock Model for doing business. In the industrialized society of mass production and marketing, this forecast needs standardization and efficient business management such as cost reduction and a fast response to costumers. Moreover, the company was trying to expand its market. For this reason, it was necessary to increment its productivity.
In this company, there were two decorating lines. Specifically, Line 1 presented productivity problems at the time of the study. It was necessary to work extra hours and still did not achieve the established production goal. Through observation, it was perceived that it was because the activities did not follow the natural flow of the process. However, a methodology was followed to analyze the problem. Reengineering served to conceptualize the problem and present the proposal, and the simulation helped validate it.
The proposal of this work is practical. It was carried out for the improvement of the processes and allowed a complete analysis of the current process with its respective deficiencies through reengineering, which were considered to make a change. Once the process improvement was selected, a proposal was made. This approach was tested through the simulation. Until the start of this research, any work focused on reengineering was found in an industrial footwear factory supported by simulation. This fusion of methodologies can be used in companies in another sector, especially small and medium-sized companies, with their respective adaptations.
3.2. Methodology
As already mentioned, the company’s problem was low productivity on line 1 of decorating. Through process reengineering, a proposal was made to improve certain production indicators such as: quantity of products obtained at the end of a work shift, use of resources, and the inventory in the process of each activity. Data was collected and statistical analysis was used to establish patterns of behavior. In this sense, production times were taken in the activities of line 1 of decorating, which served to carry out the simulation and, thus, compare the current design of Line 1 against the proposal. The following sections briefly describe the methodology executed with reengineering and simulation in each of the stages.
4. Reengineering
After reviewing the literature and, since there is not a sole-step series for the reengineering application [
1,
2,
5], a methodology was adapted to serve the specific case of the company, which is shown in
Figure 1. This methodology, with some variations, had already been designed and used by one of the authors in a global intervention at a company that manufactures bamboo panels [
14,
15].
Each of these stages is described below.
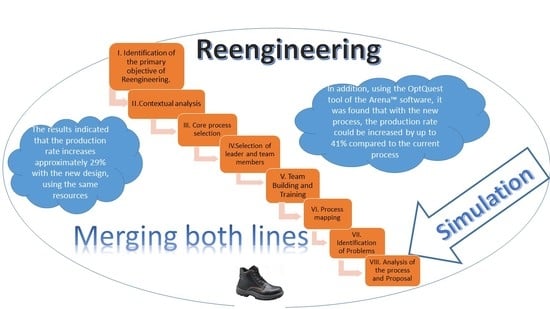
4.1. Identification of the Primary Objective of Reengineering
After observation, analysis and discussion with senior management, and carrying out a focus group, it was determined that the objective of the reengineering would be to increase the productivity of the company’s Line 1 of Decorating since it never reached the production goal. It is necessary to mention that there was also another decorating line with the same machines and operations. Line 2 had achieved the production goals. Therefore, the problem of Line 1 was uncertain.
4.2. Contextual Analysis
This is the starting point to make a critical assessment of all those external things that affect the design or implementation of the project. In the case study, it was divided into 2 phases. First, the analysis of the shoe industry in Mexico and, second, the analysis of the company’s main competitors in the state of Hidalgo.
4.2.1. Shoe Industry in Mexico
The manufacture of Mexican footwear is an important commercial activity in our country, which generates a highly competitive supply chain. According to the Ministry of Economy in Mexico [
27], the following information is available.
Four entities of the Republic concentrate 94% of the value of footwear production: Guanajuato 70%, Jalisco 15%, the State of Mexico 5%, and Mexico City, Federal District 3%.
The footwear industry is the main link in the leather-footwear chain and is made up of nearly 7,400 manufacturing establishments (equivalent to 68.4% of the total production chain).
About 41,500 shoe stores exist throughout the national territory.
In 2014, 25.6 million pairs of shoes were exported with a value of $571.7 million.
In August 2014, a framework was established to promote actions that stimulate the productivity and competitiveness of the industry as well as prevent and combat the underestimation of imported goods.
These figures tell us that the footwear industry is growing, especially in terms of exports, so the company has opportunities in this regard. The reason for it must make its processes efficient in pursuance of competing internationally.
4.2.2. Company Competitors
At the time of the study, there were four companies dedicated to the manufacture of industrial footwear in the state of Hidalgo: KARTEK, TEMO, Tempac, and the “X” company. Competitor research is conducted because a reengineering tool is referencing (Benchmarking) [
1,
2], which means searching for companies that are doing something optimally and finding out how they do it to emulate them. The analysis was performed by considering four factors: antiquity, personnel, strategic planning, and products. We realized that the four companies offer a wide variety of industrial footwear models offering quality. Two of the companies have the continuous improvement in their products and services as their mission. In the third aspect, they define their mission based on technology and the last one considers the client’s requirements. Only TEMO has the vision of being an internationally recognized company. KARTEK raises its vision as being the leading shoe producer nationwide. The study company sets its goals with a higher percentage of customer satisfaction and delivery of its products on time, while KARTEK is based on customer satisfaction and being a profitable company. The Official Mexican Standard NOM-113-STPS (1994) governed all four and only two are certified (ISO 9001-2008). An advantage of the study company is that it is certified, but in order to achieve its objective of delivering products on time, workers must stay out of their work shift with Line 1 of Decorating being the problem area. With contextual analysis, the information accomplished was that competitors use similar technologies and have similar certifications. It was also found that the industry in Mexico is growing and it is necessary to organize the resources to have a better response to the customers.
4.3. Core Process Selection
According to Hammer and Champy [
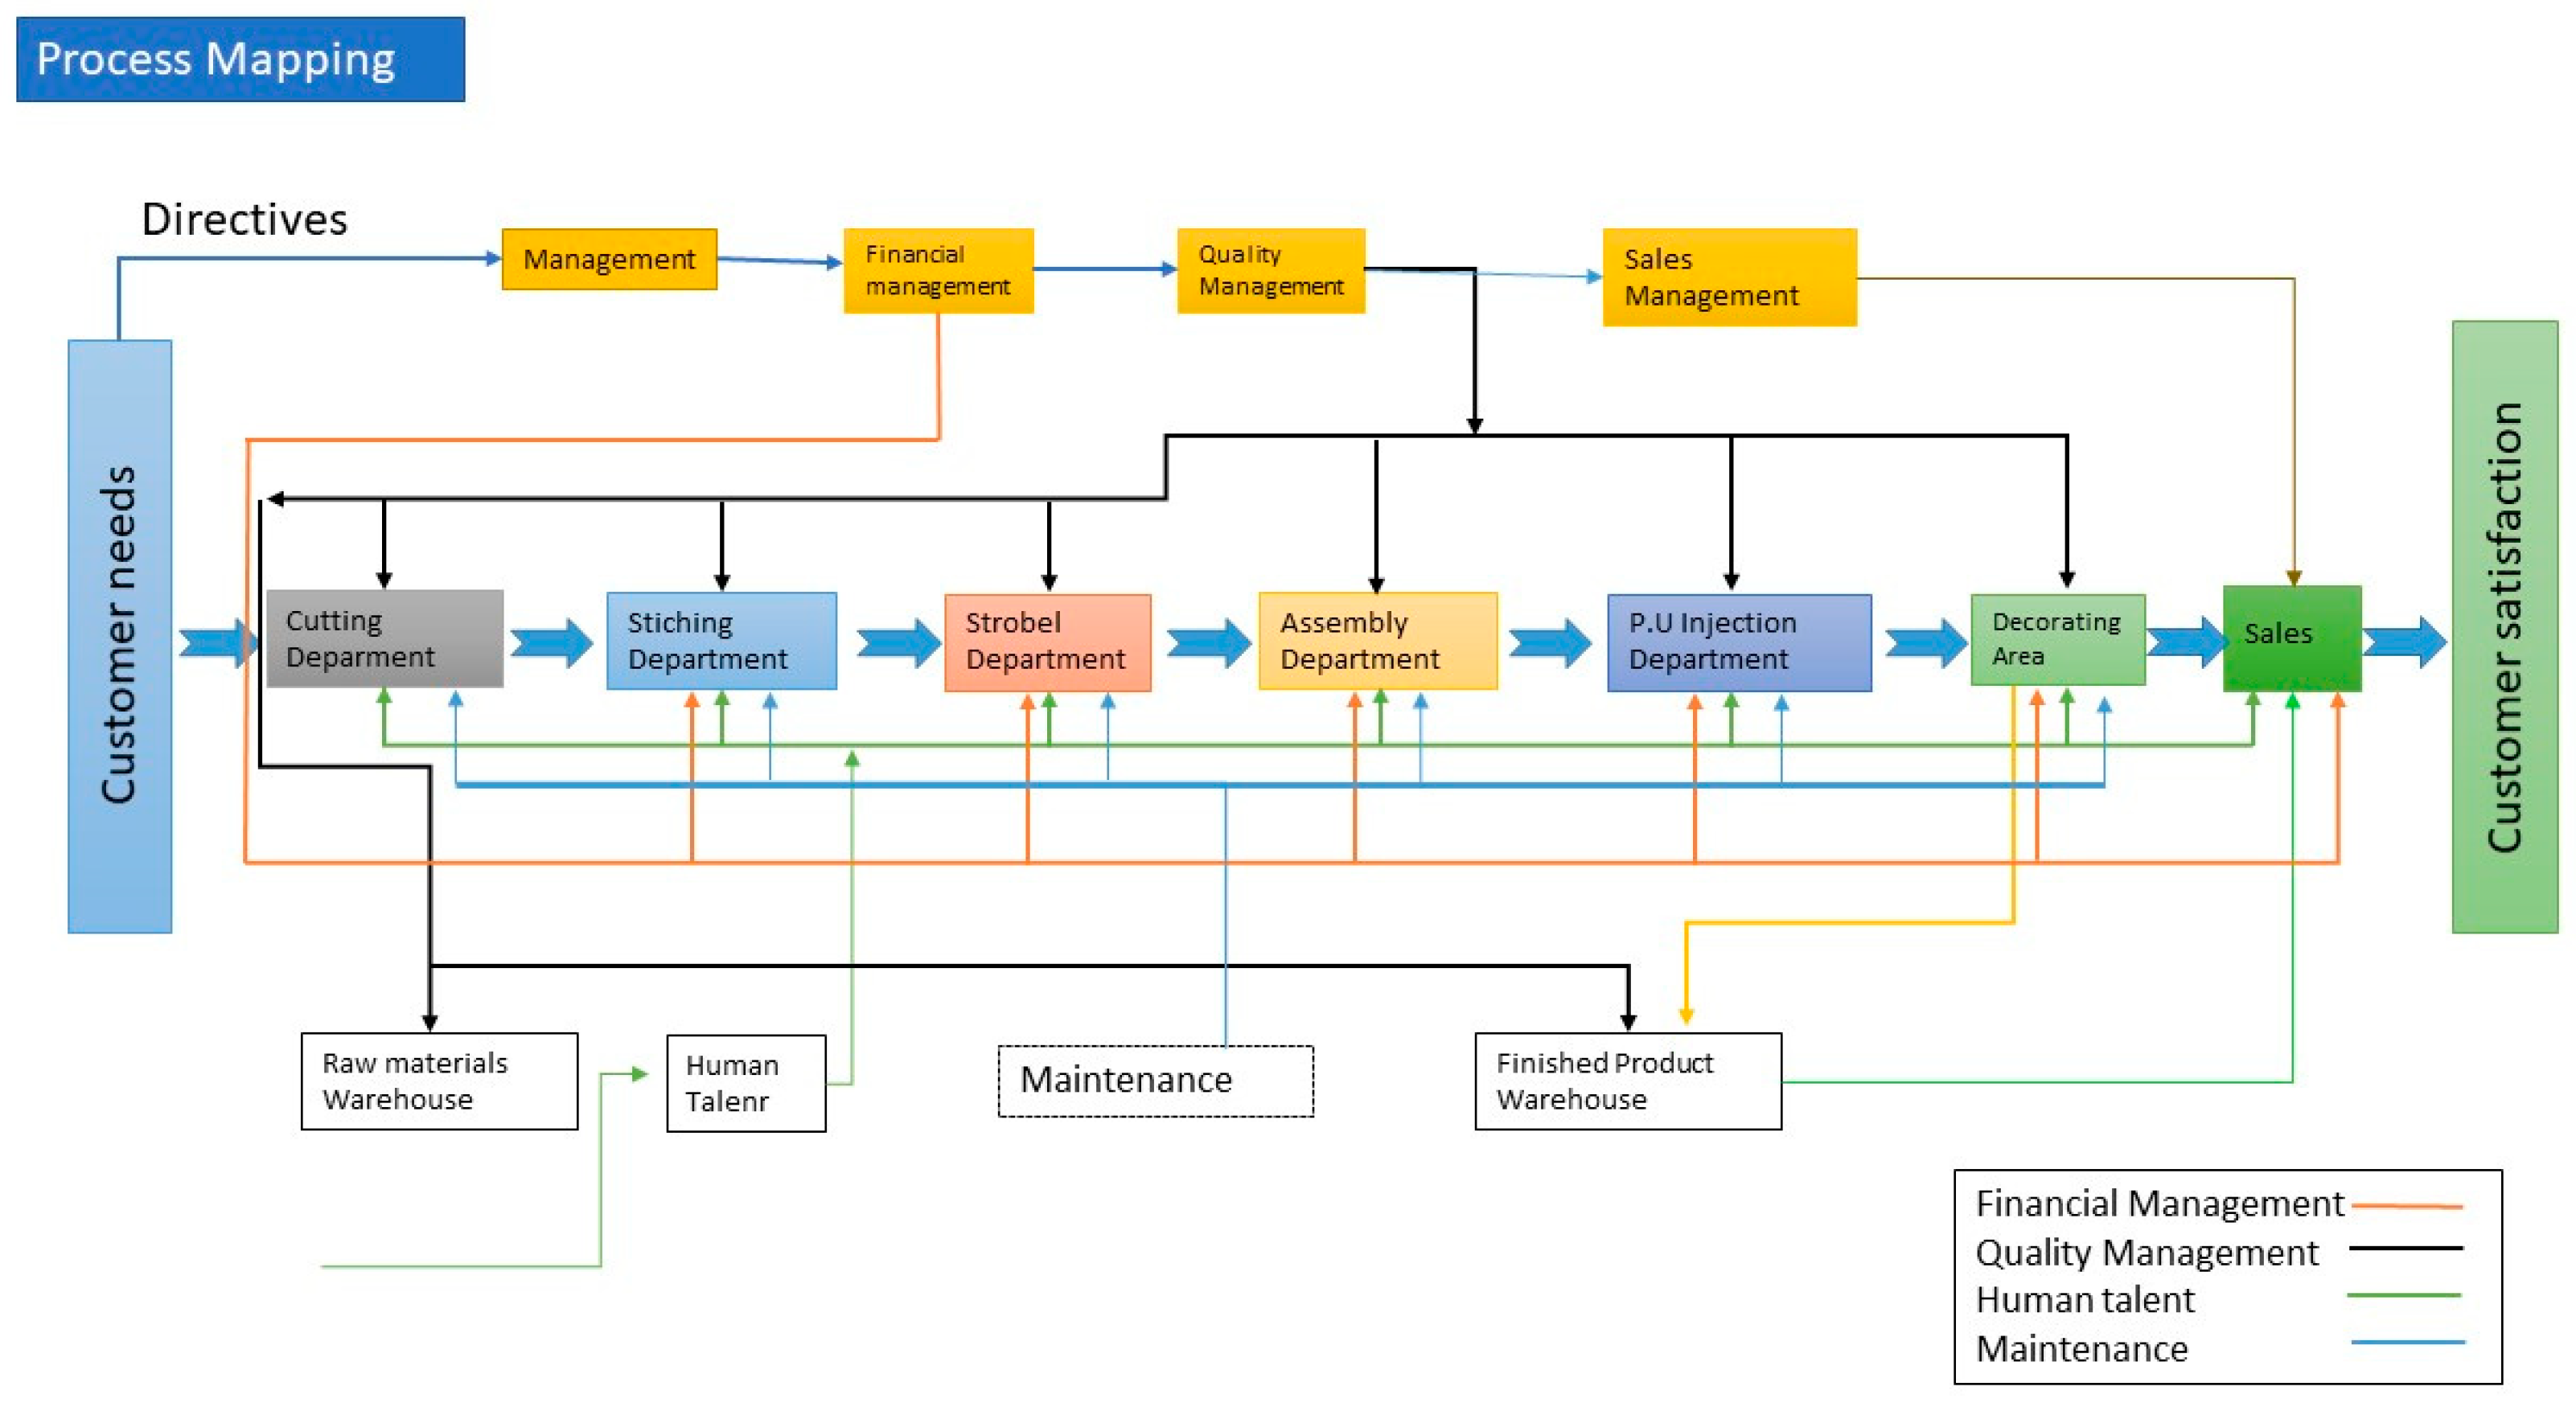
1], when the objective is to improve the process, a detailed analysis is not necessary. Rather, a general analysis is required that detects the critical aspects that demonstrate the causes of the deficiencies of the current process. The company operates with a process or functional organization, since the areas are grouped according to the equipment or machinery by similar functions, such as the Strobel department, the stitching department, the assembly department, the PU injection, the decoration area, and more, as shown in
Figure 2.
Regarding the process, before the product reaches the decorating area, it is processed in the Desma machine where a mixture is injected, for the elaboration of the sole of the industrial shoe. The company has 2 Desma. Each of them produces 1600 pairs of shoes in an 8-h workday. These shoes are stored in the P.U. Injection Machines department, where operators transfer them to the decorating area. This is the activity that generates the longest production time due to the lack of instruments. Since shipments of raw material to the decorating area are in large quantities, it is necessary to make them through batches by generating a large volume of warehouse usage, which causes delays in the process. The main operations are Flaming, Cleaning, Painting, and Applying Gloss Polish. Such a process is detailed below.
4.4. Selection of Leader and Team Members
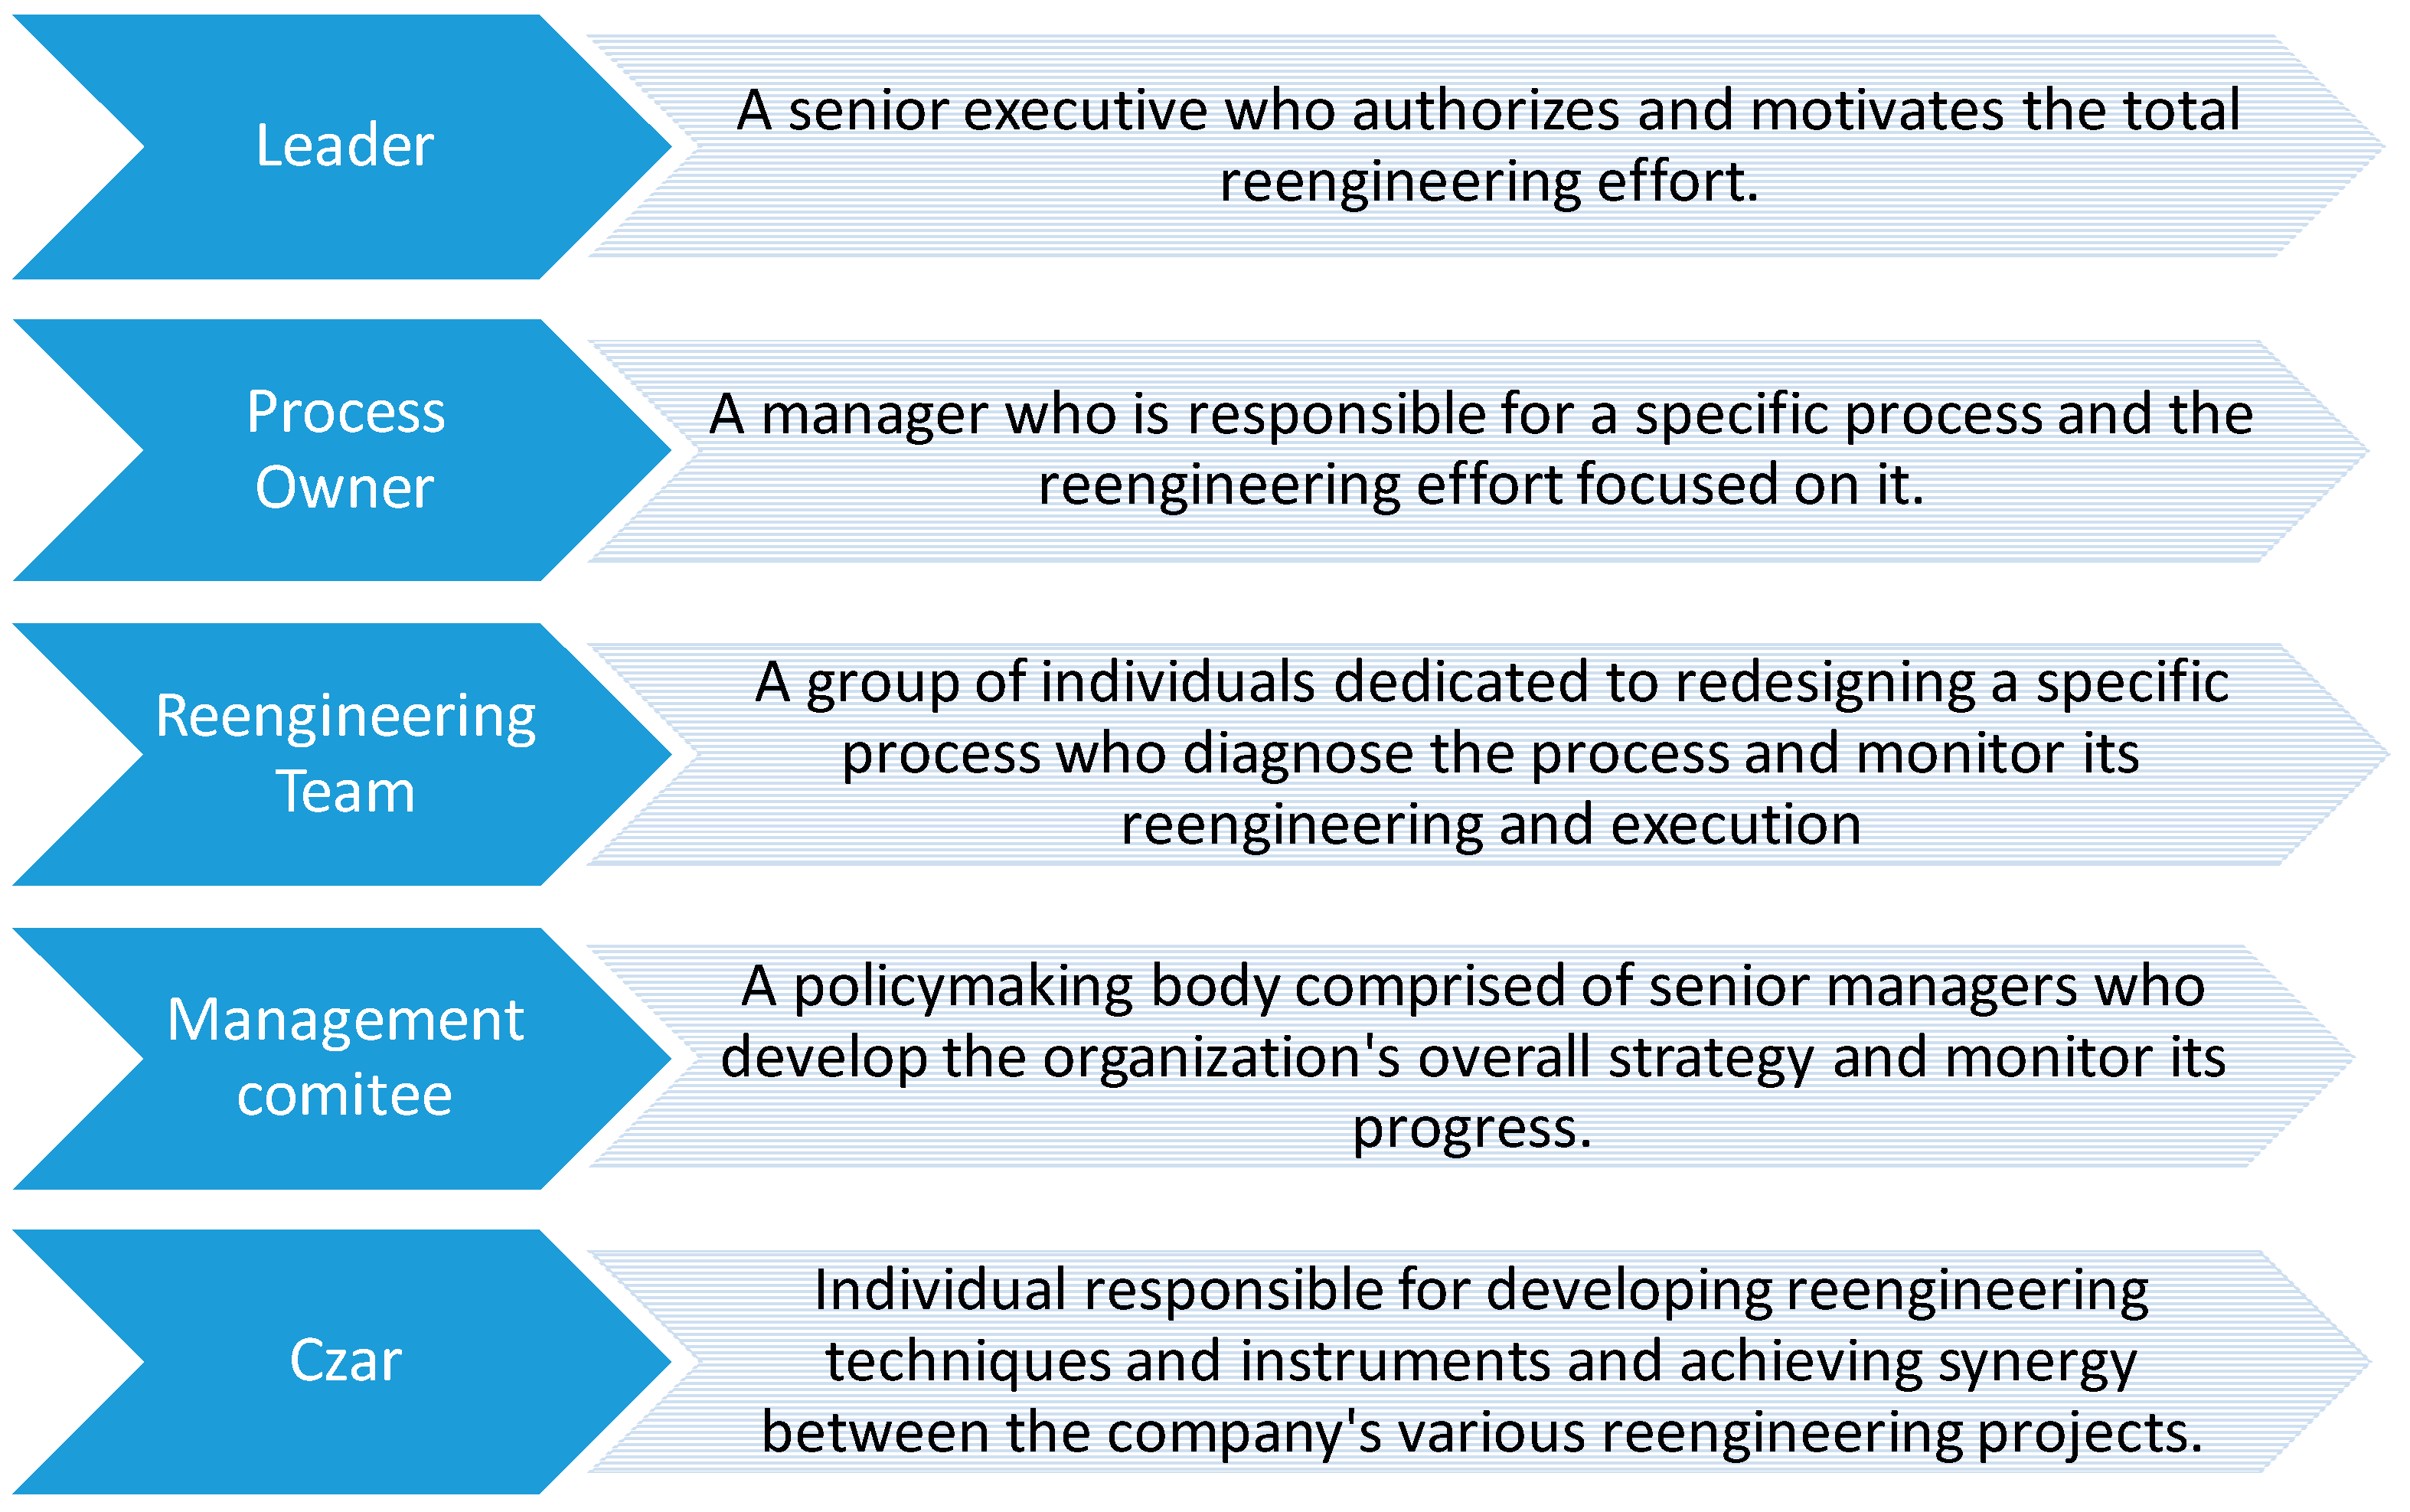
The process for choosing the reengineering leader consisted of conducting different interviews with the general management and those involved in the decorating process, to assess how well they know the process, and investigate the scope they have in decision-making. According to Hammer and Champy [
1], the characteristics of the team members are observed in
Figure 3.
In consensus with the director of the company and after conducting the interviews, the team was defined. The information is presented in
Table 1.
4.5. Team Building and Training
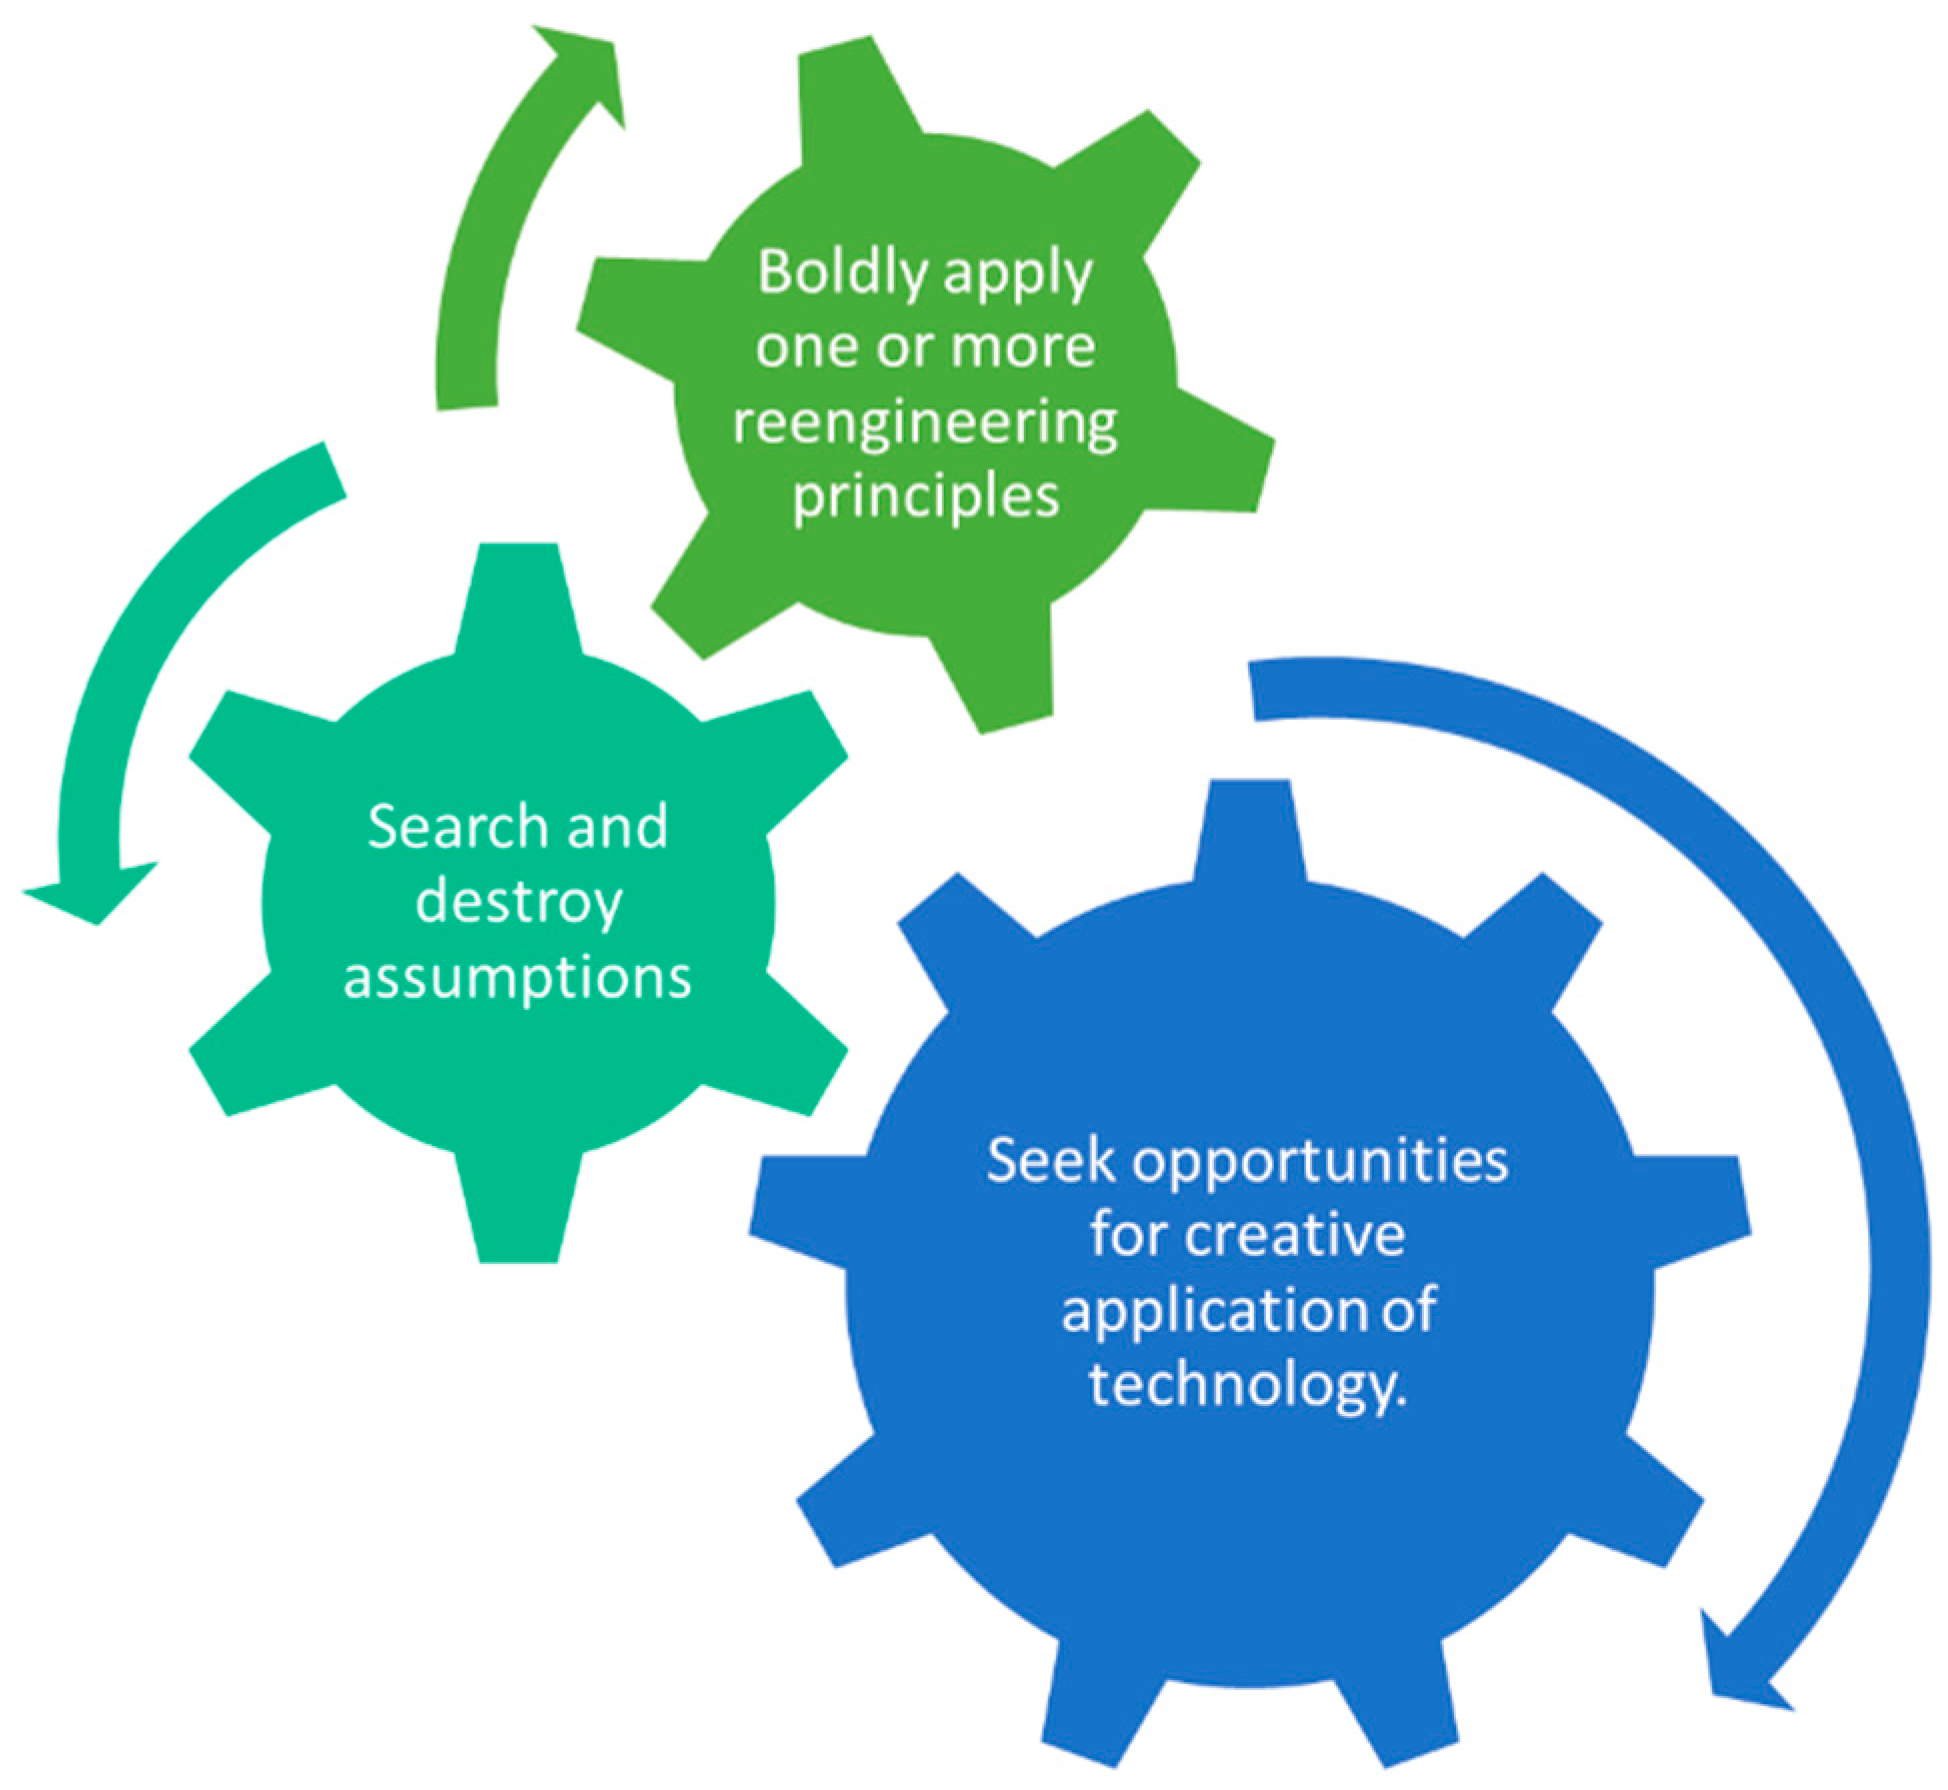
At this stage, it is necessary to discard the old patterns of thinking about how a process should be, and to generate new forms of operation and new possibilities that fundamentally modify the current process. The owner of the process and the reengineering team were trained in “doing reengineering.” It was mentioned that reengineering does not intend to automate the current processes to make them faster. Rather it seeks to create a new agile process that is capable of satisfying the needs of the internal-external client. In addition, other main seminars that are shown in
Figure 4 were developed based on Hammer and Champy’s [
1] techniques to conceive ideas. In these seminars, the importance of “search and destroy assumptions” and “search opportunities for creative application of technology.” Subsequently, techniques such as nominal groups, brainstorming, and focus groups were used to define the strategies that would lead to the improvement proposal.
Moreover, the employees of the decorating area were trained in what was reengineering to better accept the changes that were proposed. Some significant ideas that were obtained after applying the different techniques were the following. It is necessary to highlight that they did it without considering restrictions in space, costs, and human resources.
That the worker can choose Desma machine according to its availability. Currently, the worker uses the machine according to the belonging line (Desma machine 1 for line 1, and the Desma machine 2 for line 2, even though the other is near and empty). Hence, that causes the process not to follow an adequate flow and the transport time is increased.
Relocate the Desma from Line 1 following the flow of the process because it is currently far from the other operations on Line 1.
Merge both lines of decorating.
Implement an automated transport system through a conveyor belt to streamline the transport of the product in process and material.
In order to select the best idea, the process map detailed below was elaborated on.
4.6. Process Mapping
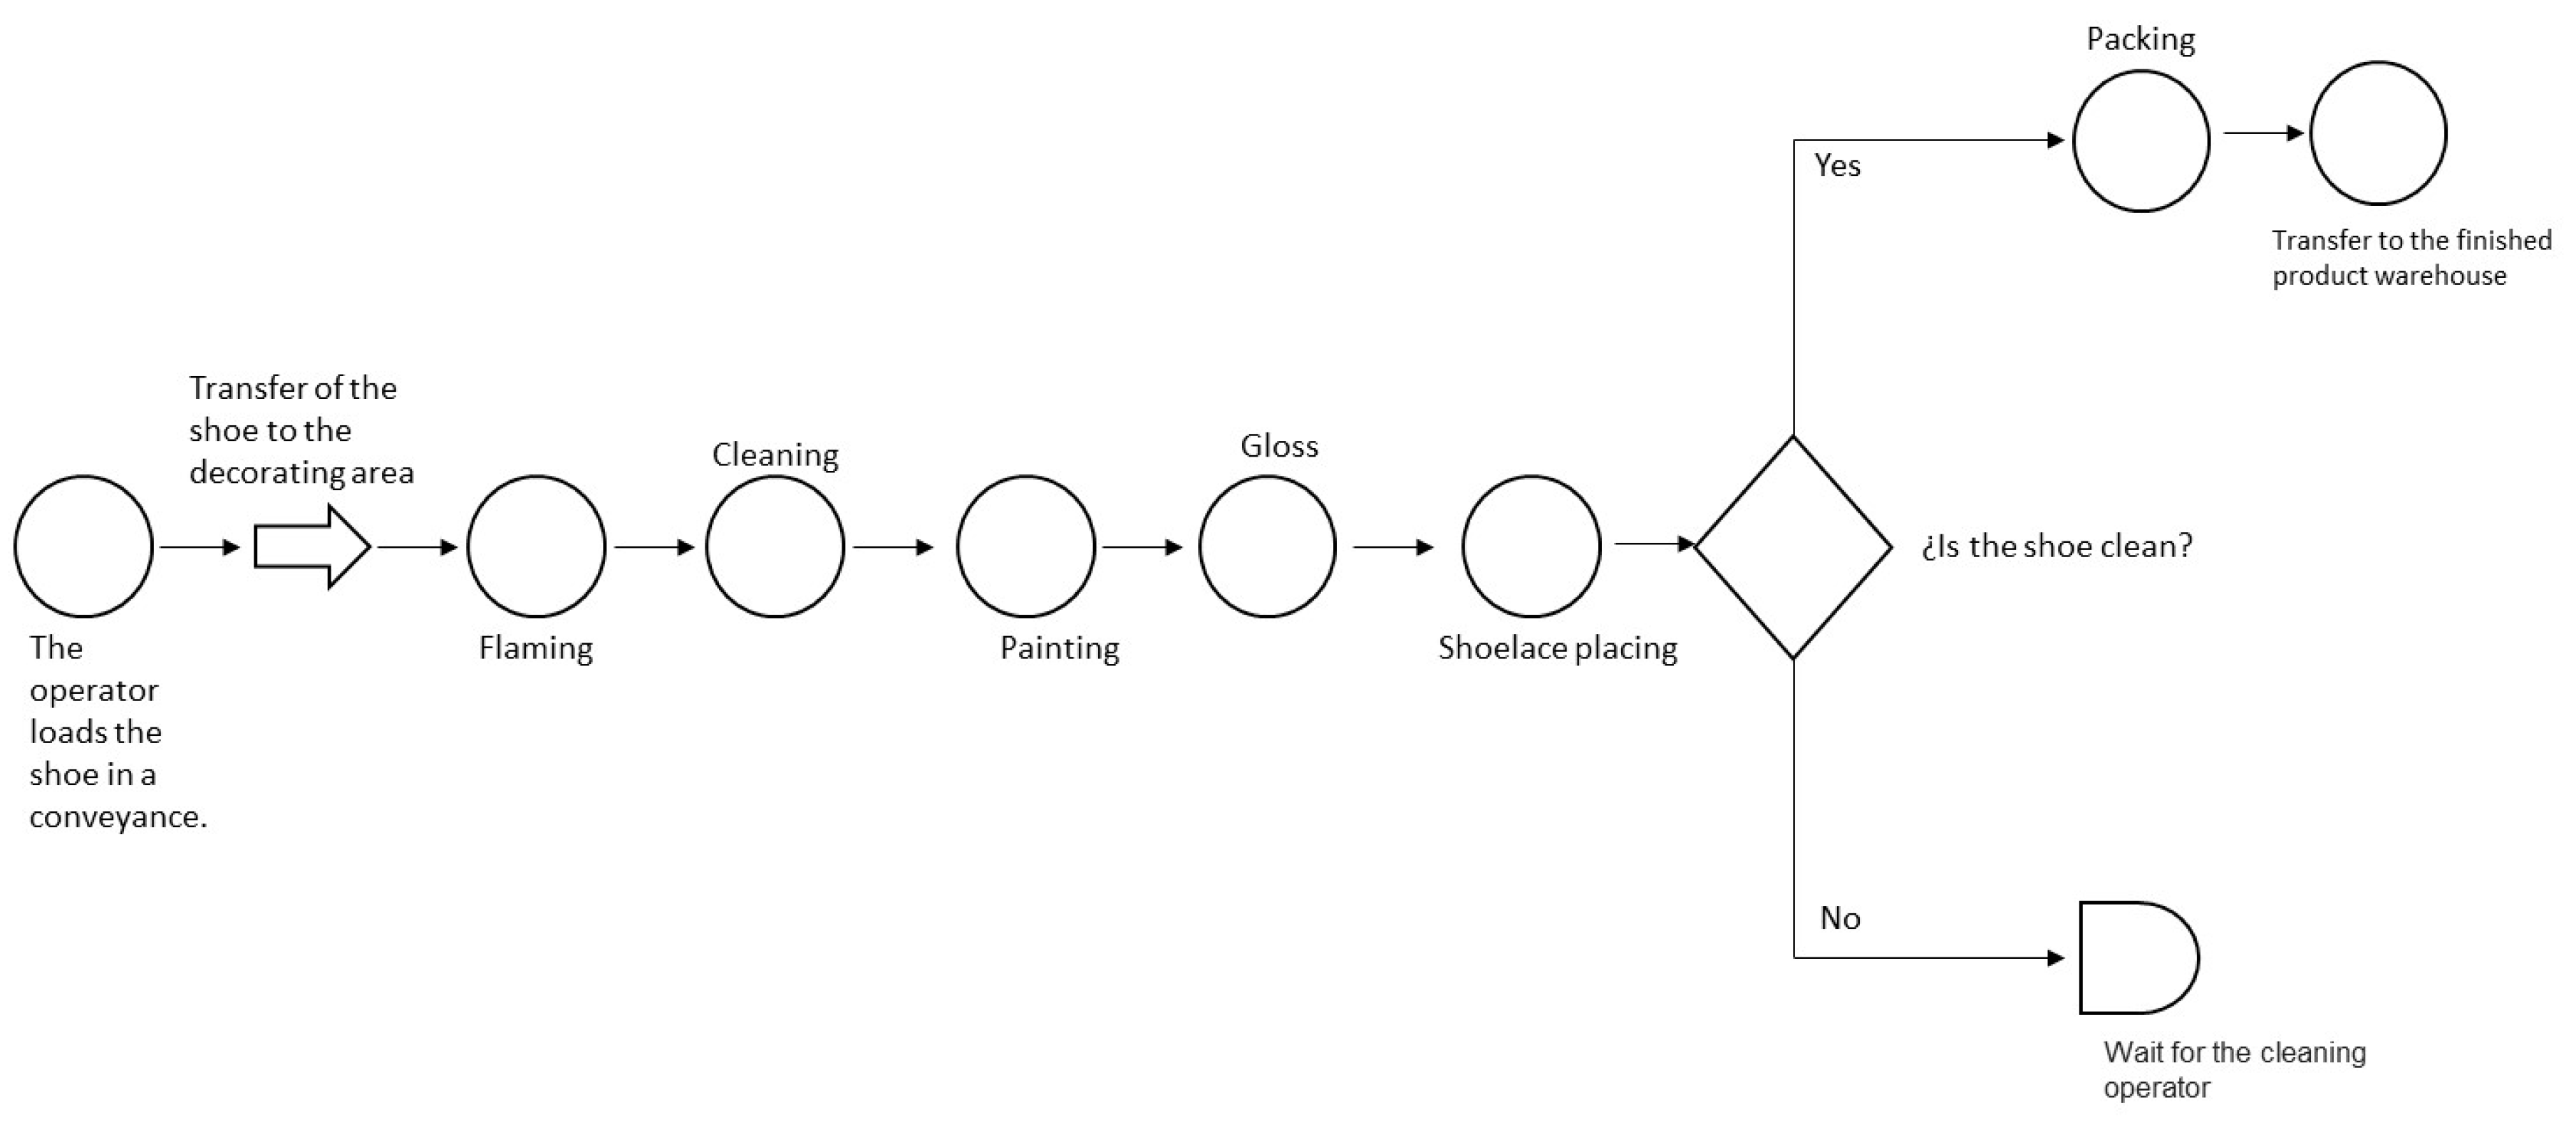
Along with the proposal, the process map of the decoration area was made. The process is briefly described below, and a flow diagram is presented in
Figure 5. The shoe is taken to the first activity of the decorating area, where the operator performs the flaming, which consists of removing the excess seams that the shoes have through the flaming machine. The next step is carrying the shoe to the work table where 3 to 4 operators are in charge of cleaning, which consists of removing burrs through a razor by taking care that the shoe is not scratched and cleaning the exterior dust. The third activity is placing paint on the soles. Then another operator applies the polish gloss. Then an operator places a paper inside the shoe for interior protection, and the shoelace is placed on the shoe and, thus, the shoe is finished. If the shoe is clean, it is packed and labeled according to the characteristics of the shoe. Otherwise, a cleaning operator is asked to clean it again and when it is ready it is packed. Lastly, an operator stows the boxes, until obtaining five pairs of shoes and placing a safety clasp through the strapping machine to transport to the “Finished Product Warehouse” area. In addition, the team takes times of the operations of both decorating lines in order to analyze the process.
4.7. Identification of Problems
Based on the previous stages, the reengineering team defined that the main problem was that the decorating area has two lines, where the same activities are carried out during the shoe manufacturing process. One of the two lines has a U type flow line (Line 2) and, the other line lacks of design (Line 1), including the latter being the one that has many conflicts during the process due to reduced spaces between one activity. The has a bad sequence in the flow of the material and inadequate order of operations and equipment. For this reason, it is one of the areas with the greatest conflicts within the company and in which the proposal detailed in the next section will focus.
4.8. Analysis of the Process and Proposal
In this phase, the proposal was generated, considering the results of the previous phases. Of the ideas that were generated in the training phase of the team, it was selected to merge both lines of scenery due to their economic viability. The others were discarded because they would generate problems among the workers or because of the economic cost to the company, which, at that time, it could not assume.
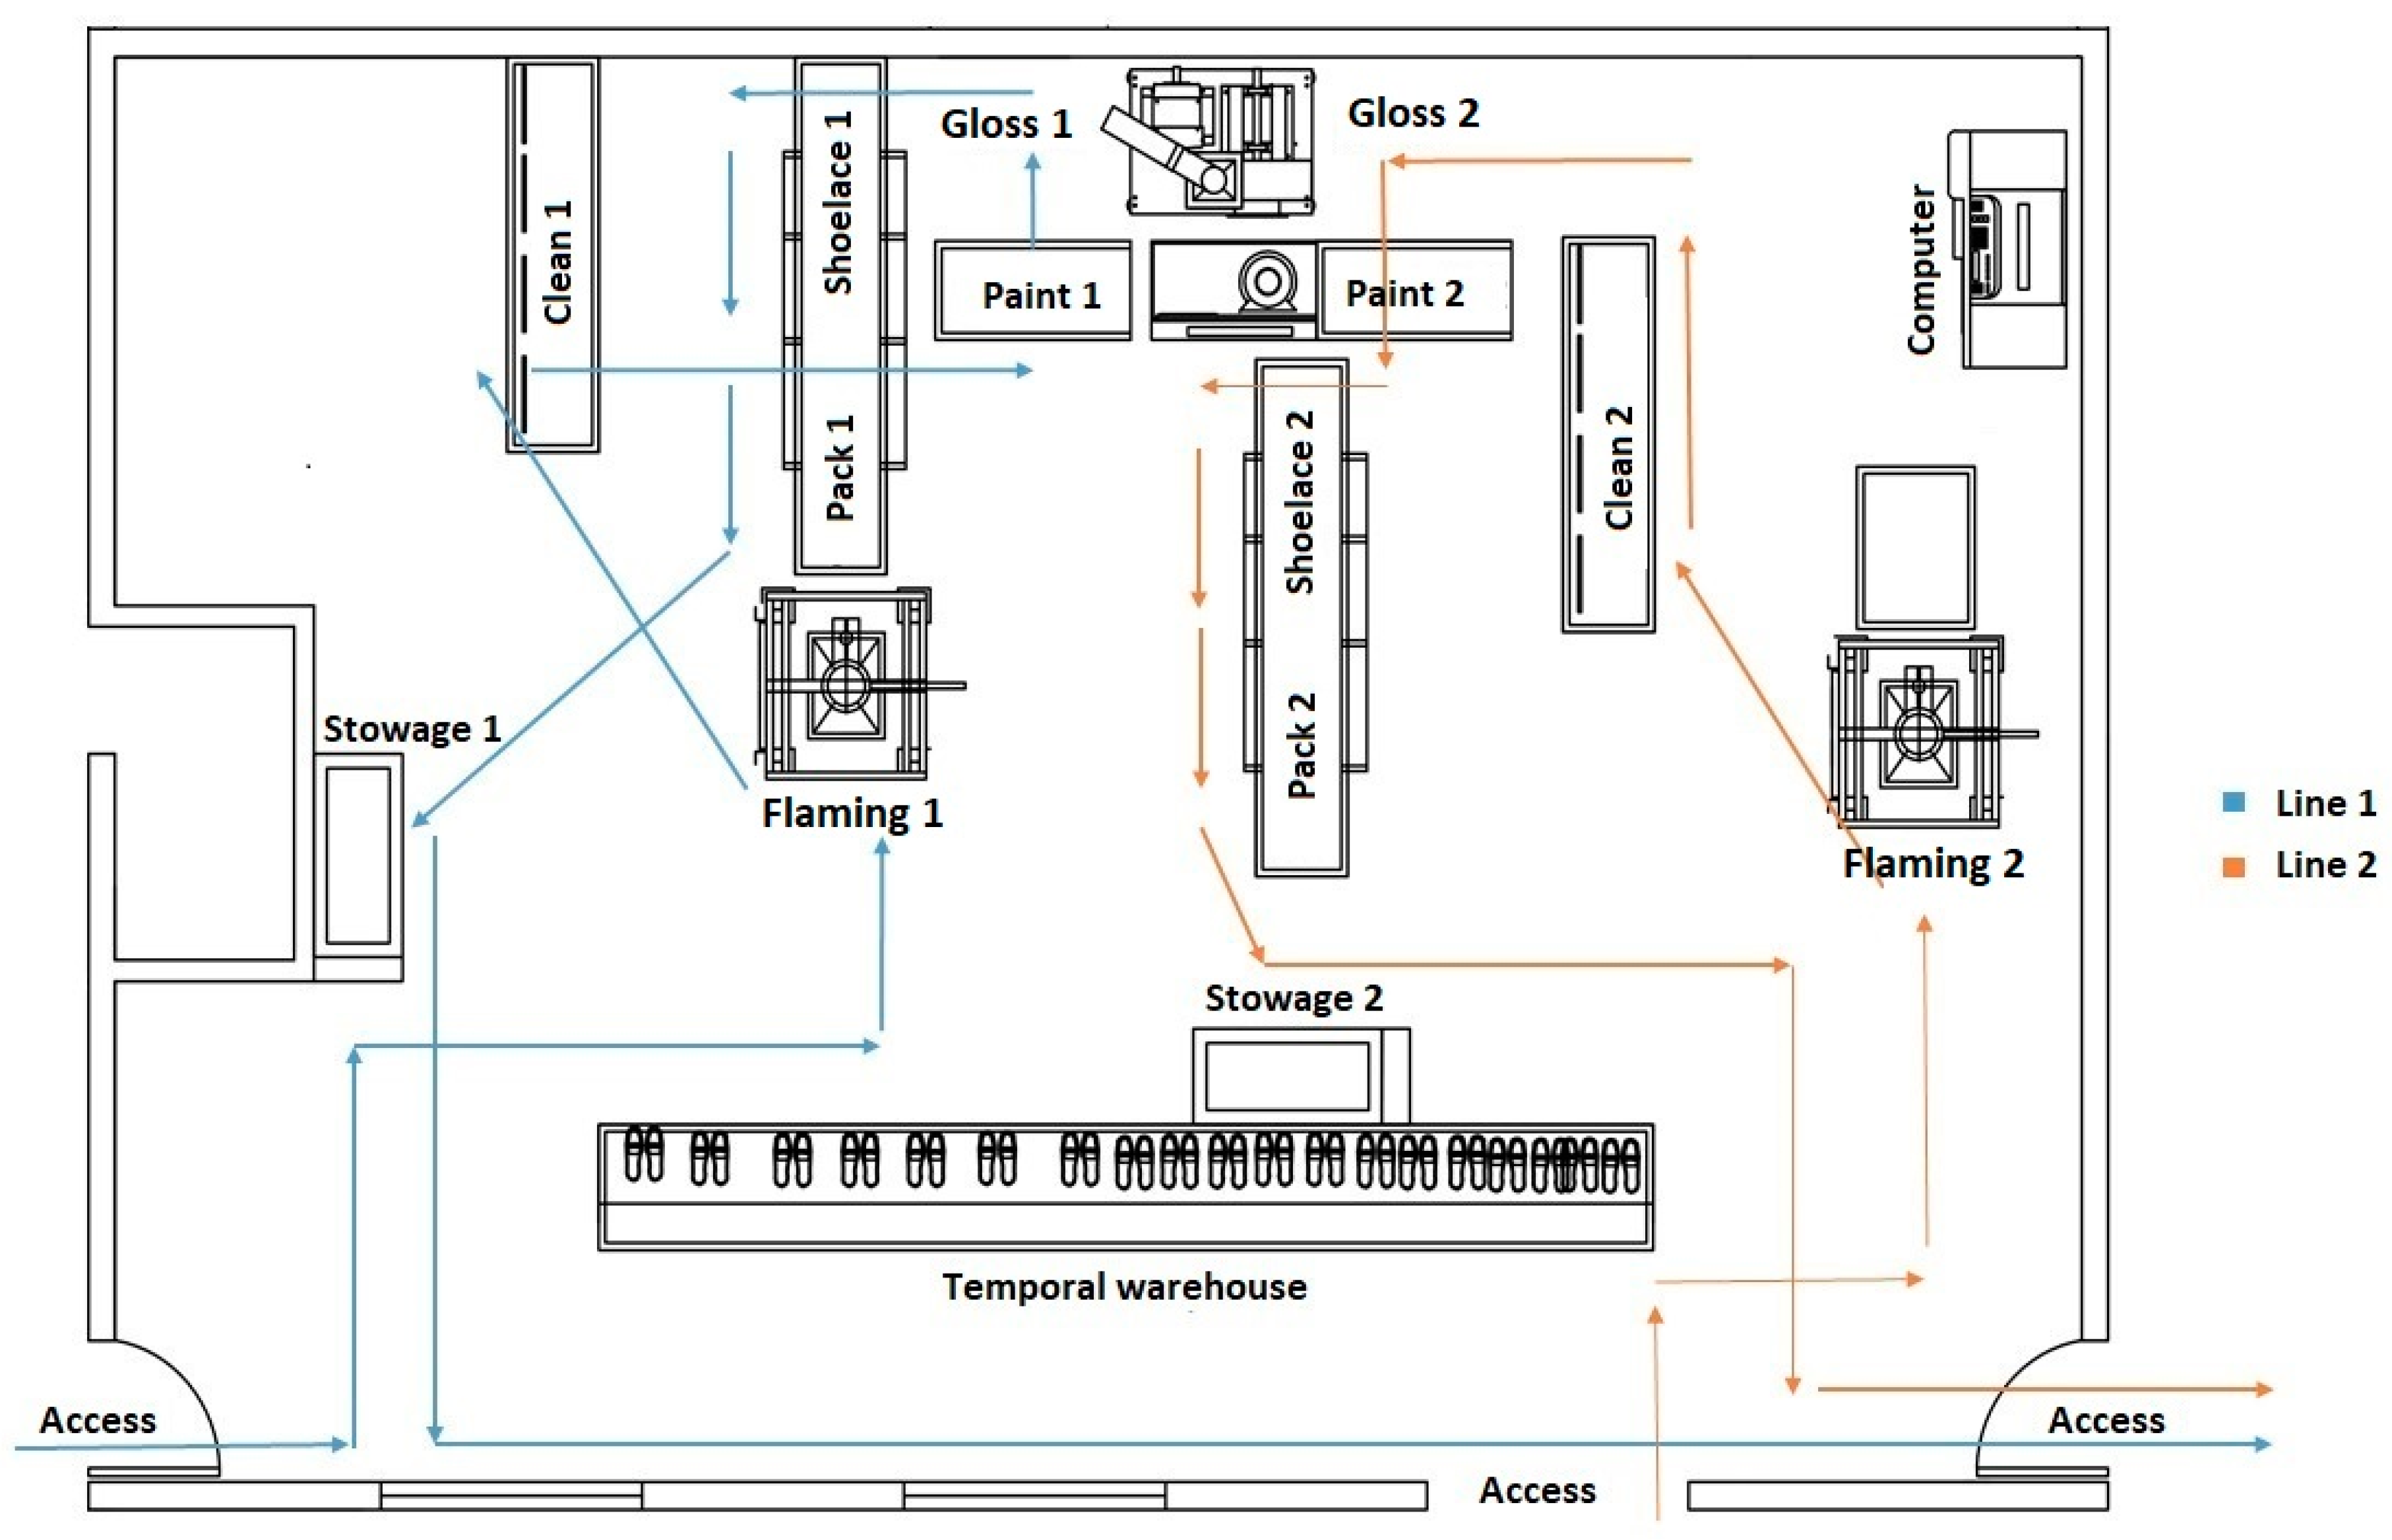
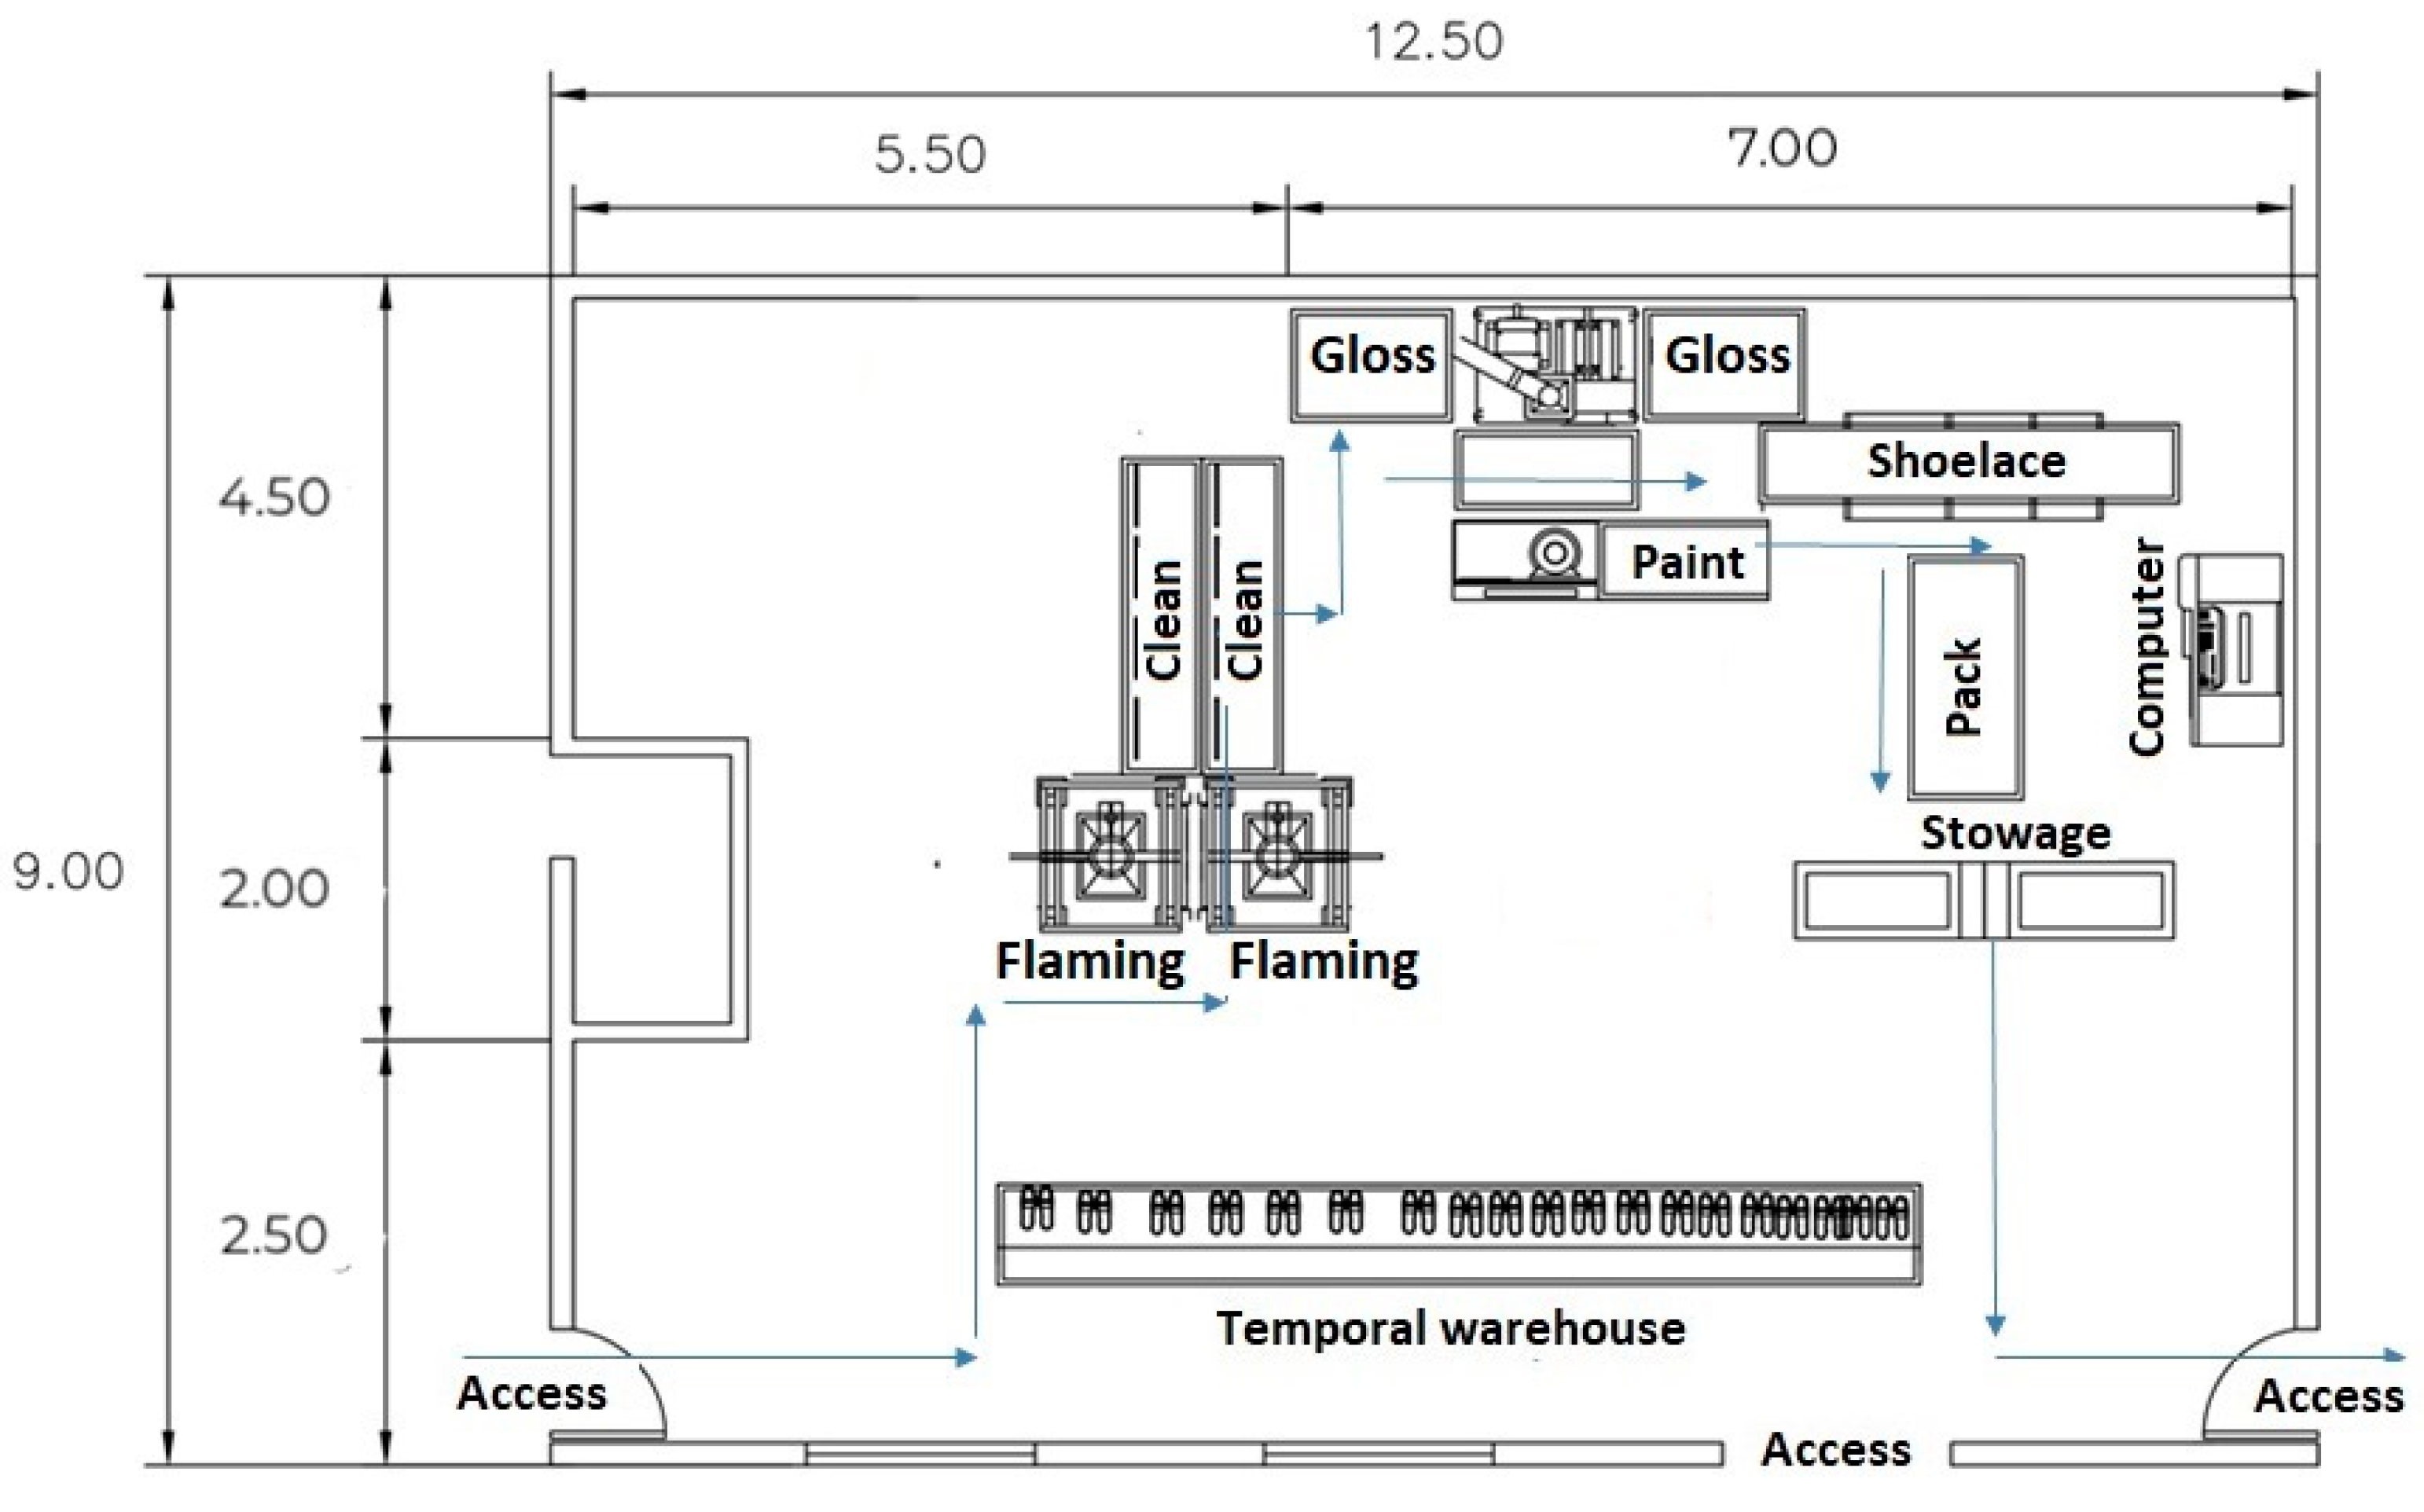
In the proposal, a change is made in the distribution of machinery and equipment. The old plant layout is shown in
Figure 6. The area and its activities: flaming, cleaning, painting, gloss, fitting, packing and stowage is presented. This area is divided in two line 1 and line 2, according to what was observed in the company. In these lines, there is no logical sequence in the workflow and in the route of the materials, which causes delays in production. The Desma 1 and Desma 2 machines are distributed in different areas with one at 25 meters and the other at 15 meters, respectively, which is due to their technical conditions that cannot be moved. In the third activity, painting on the soles of the shoe, line 1, also has flow problems. It is necessary to pass the shoes under a table to get to the next activity where paint is applied to the sole of the shoe. Later, another operator performs the application of polish gloss, where both lines share the machinery, which causes accumulation of shoes.
After analyzing the current process, an improvement to the production process is proposed in which a change is made in the distribution of machinery and equipment. The proposed plant layout is shown in
Figure 7, where the work area and a new U-type material flow path can be seen, which occupies the same dimensions, allowing for greater mobility and eliminating unnecessary work such as passing the shoes under a table to get to the next activity. Additionally, a merger of both lines of work is proposed, becoming a single line of work within the decorating area with a new distribution and with more space between activities. The flow will be as follows. At the beginning, two operators go to the injection department and take 100 pairs of shoes from the warehouse, which are transported in a box to the decorating area. The shoe is taken to the first activity in the area, flaming, in this activity. Unlike the previous process, you can have 100 instead of 50 pairs of shoes, allowing the shoe to be closer to the operation and the three operators to take it and process it faster, which sends it to the next activity: cleaning. In this activity, eleven people clean the shoe and, unlike the previous configuration, the shoe is stored in an orderly manner by preventing the worker from being surrounded by shoes.
As shown in
Figure 6, where we observe the poor design of the work area, a bad flow of material and a total disorder of the area. Once the shoe is cleaned, it is taken to the painting activity in which three operators participate in painting the sole, so that they can be processed in the application of the gloss by two operators. Instantly, two operators place a paper inside the shoe for interior protection, and the shoelace is placed in it, while obtaining the finished shoe. Subsequently, it is packaged and labeled, according to the characteristics of the shoe. Lastly, three operators stow the boxes, until obtaining five pairs of shoes and placing a safety clasp, to transport them to the “Finished Product Warehouse” area.
The proposal was validated with a Simulation in the Software Arena™ and is described in the next section. Once the proposal was validated through simulation, a meeting was held. There, the leader spoke of the need to redesign the decorating area. It is necessary to mention that the designation of the activities, necessary resources, and the time to achieve it were decided by the company and did not allow that the activities and results achieved were published. Therefore, only the proposal validation is detailed in the following section. Although, the proposal was implemented and brought good results, even superior to those generated through simulation.
5. Simulation
In order to compare the current process with the proposal defined in the previous section, a discrete event simulation is used. In this case, it is a dynamic simulation model since it represents a system as it evolves over time and is stochastic since it has random variables. These state variables change only at discrete points in time at which certain parameters are scored. An event is defined as a situation that causes the state of the system to change instantaneously such as the arrival of an entity (for shoes) to an operation on the production line [
4,
28]. The simulation is executed with the methodology suggested by Kelton [
28].
5.1. System Definition
At this stage, the current process of the decoration area is replicated. People, machinery, location, and working conditions are considered in the system, so that the model is as similar as possible to the real system. The objective is to compare, once the proposal has been made, whether it improves with respect to the current process.
5.2. Model Formulation
Current: To the simulation conceptual model, different criteria were analyzed through reengineering. The layout and the process diagram detailed in the previous stage and the human resources operating the process were considered (see
Table 2). These workers operate in 8-h shifts by contemplating a 30-min break for eating. There are two flaming machines, one gloss machine, and two strapping machines.
Proposal: In the simulation model, the possibility of locating all the equipment and machinery with a U-type flow path was studied, and the company’s two decorating lines are merged. The same machinery and human resources are used per operation as in the current system.
5.3. Data Collection
Times were taken, specifically 73 records in each operation during February to April 2019, considering the hours when there was low and high production. Neither the first nor the last hour of the shift were used. The data was checked for detecting and discarding atypical data. These data were entered in the input analyzer, which is a tool of the Arena™ software. This allows determining which specific distribution fits the data, and which uses the chi square
and the Kolmogorov-Smirnov test as goodness-of-fit. The distributions that accept the null hypothesis in were used for obtaining the different distributions of each activity, which will be used to simulate the process.
Figure 8 shows the analysis of the flaming operation, including the times taken, the analysis of fit test, and the expression that was used to model the production process in Arena™.
Proposal: For doing the simulation model, the same distributions of the operations that were calculated with the times collected were considered.
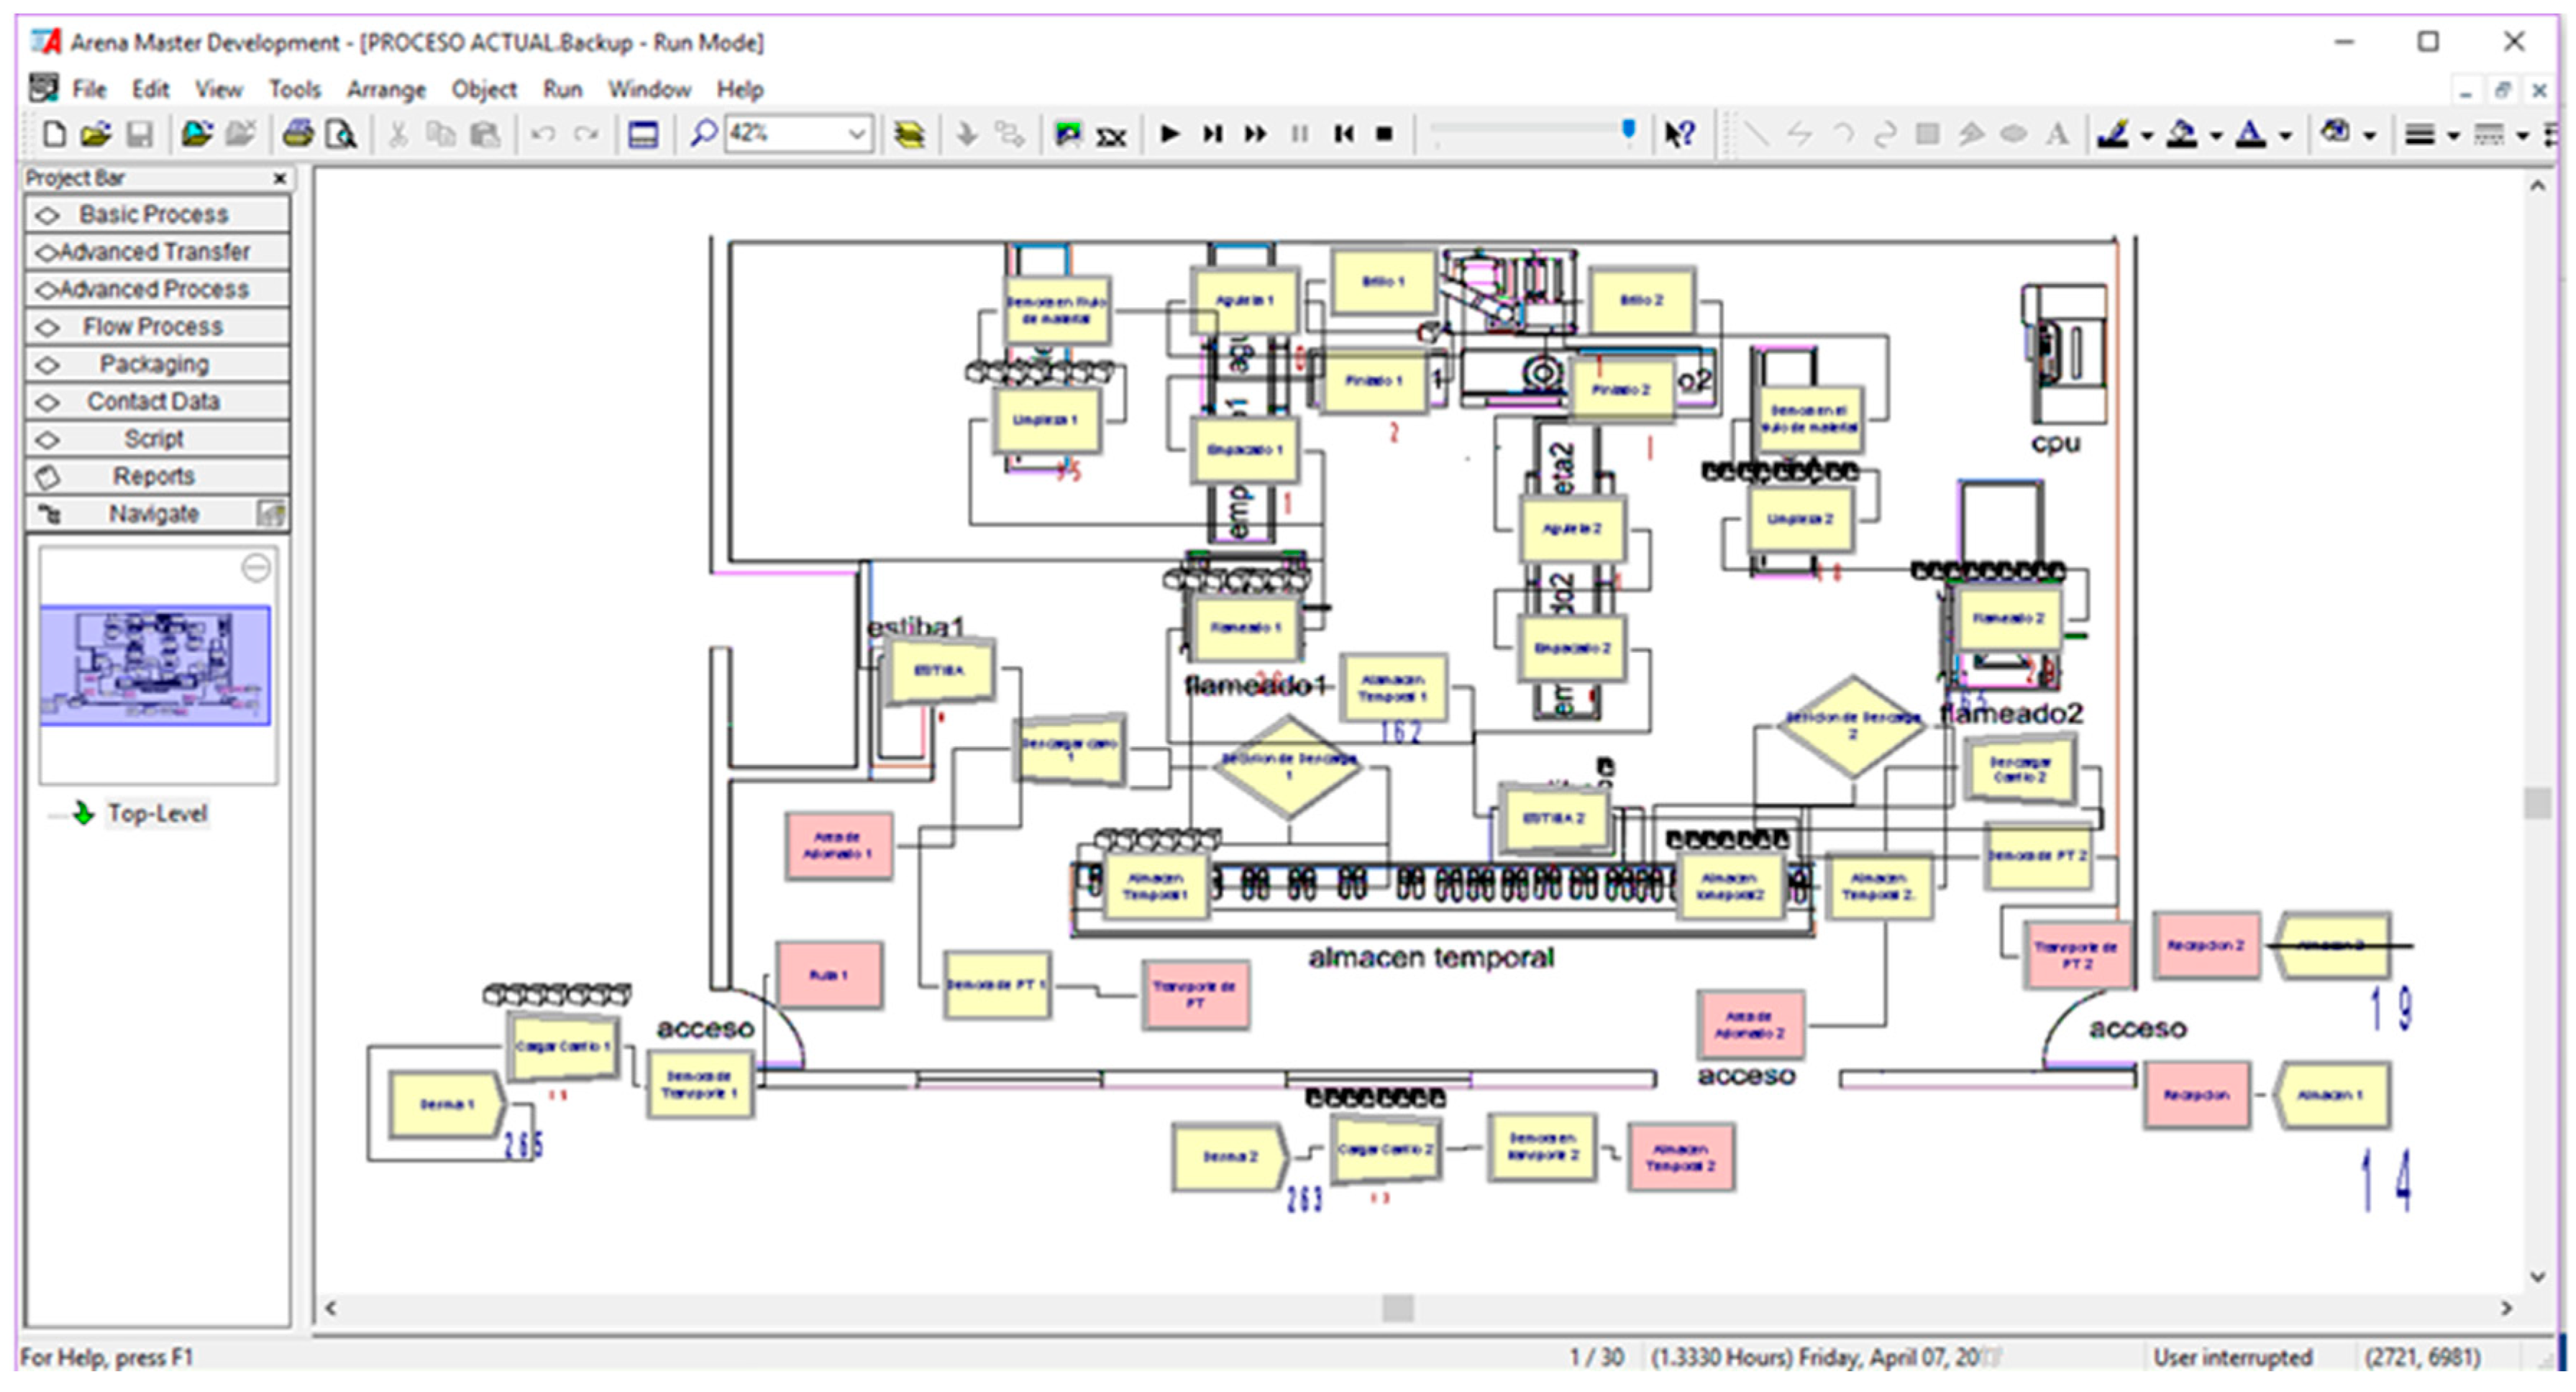
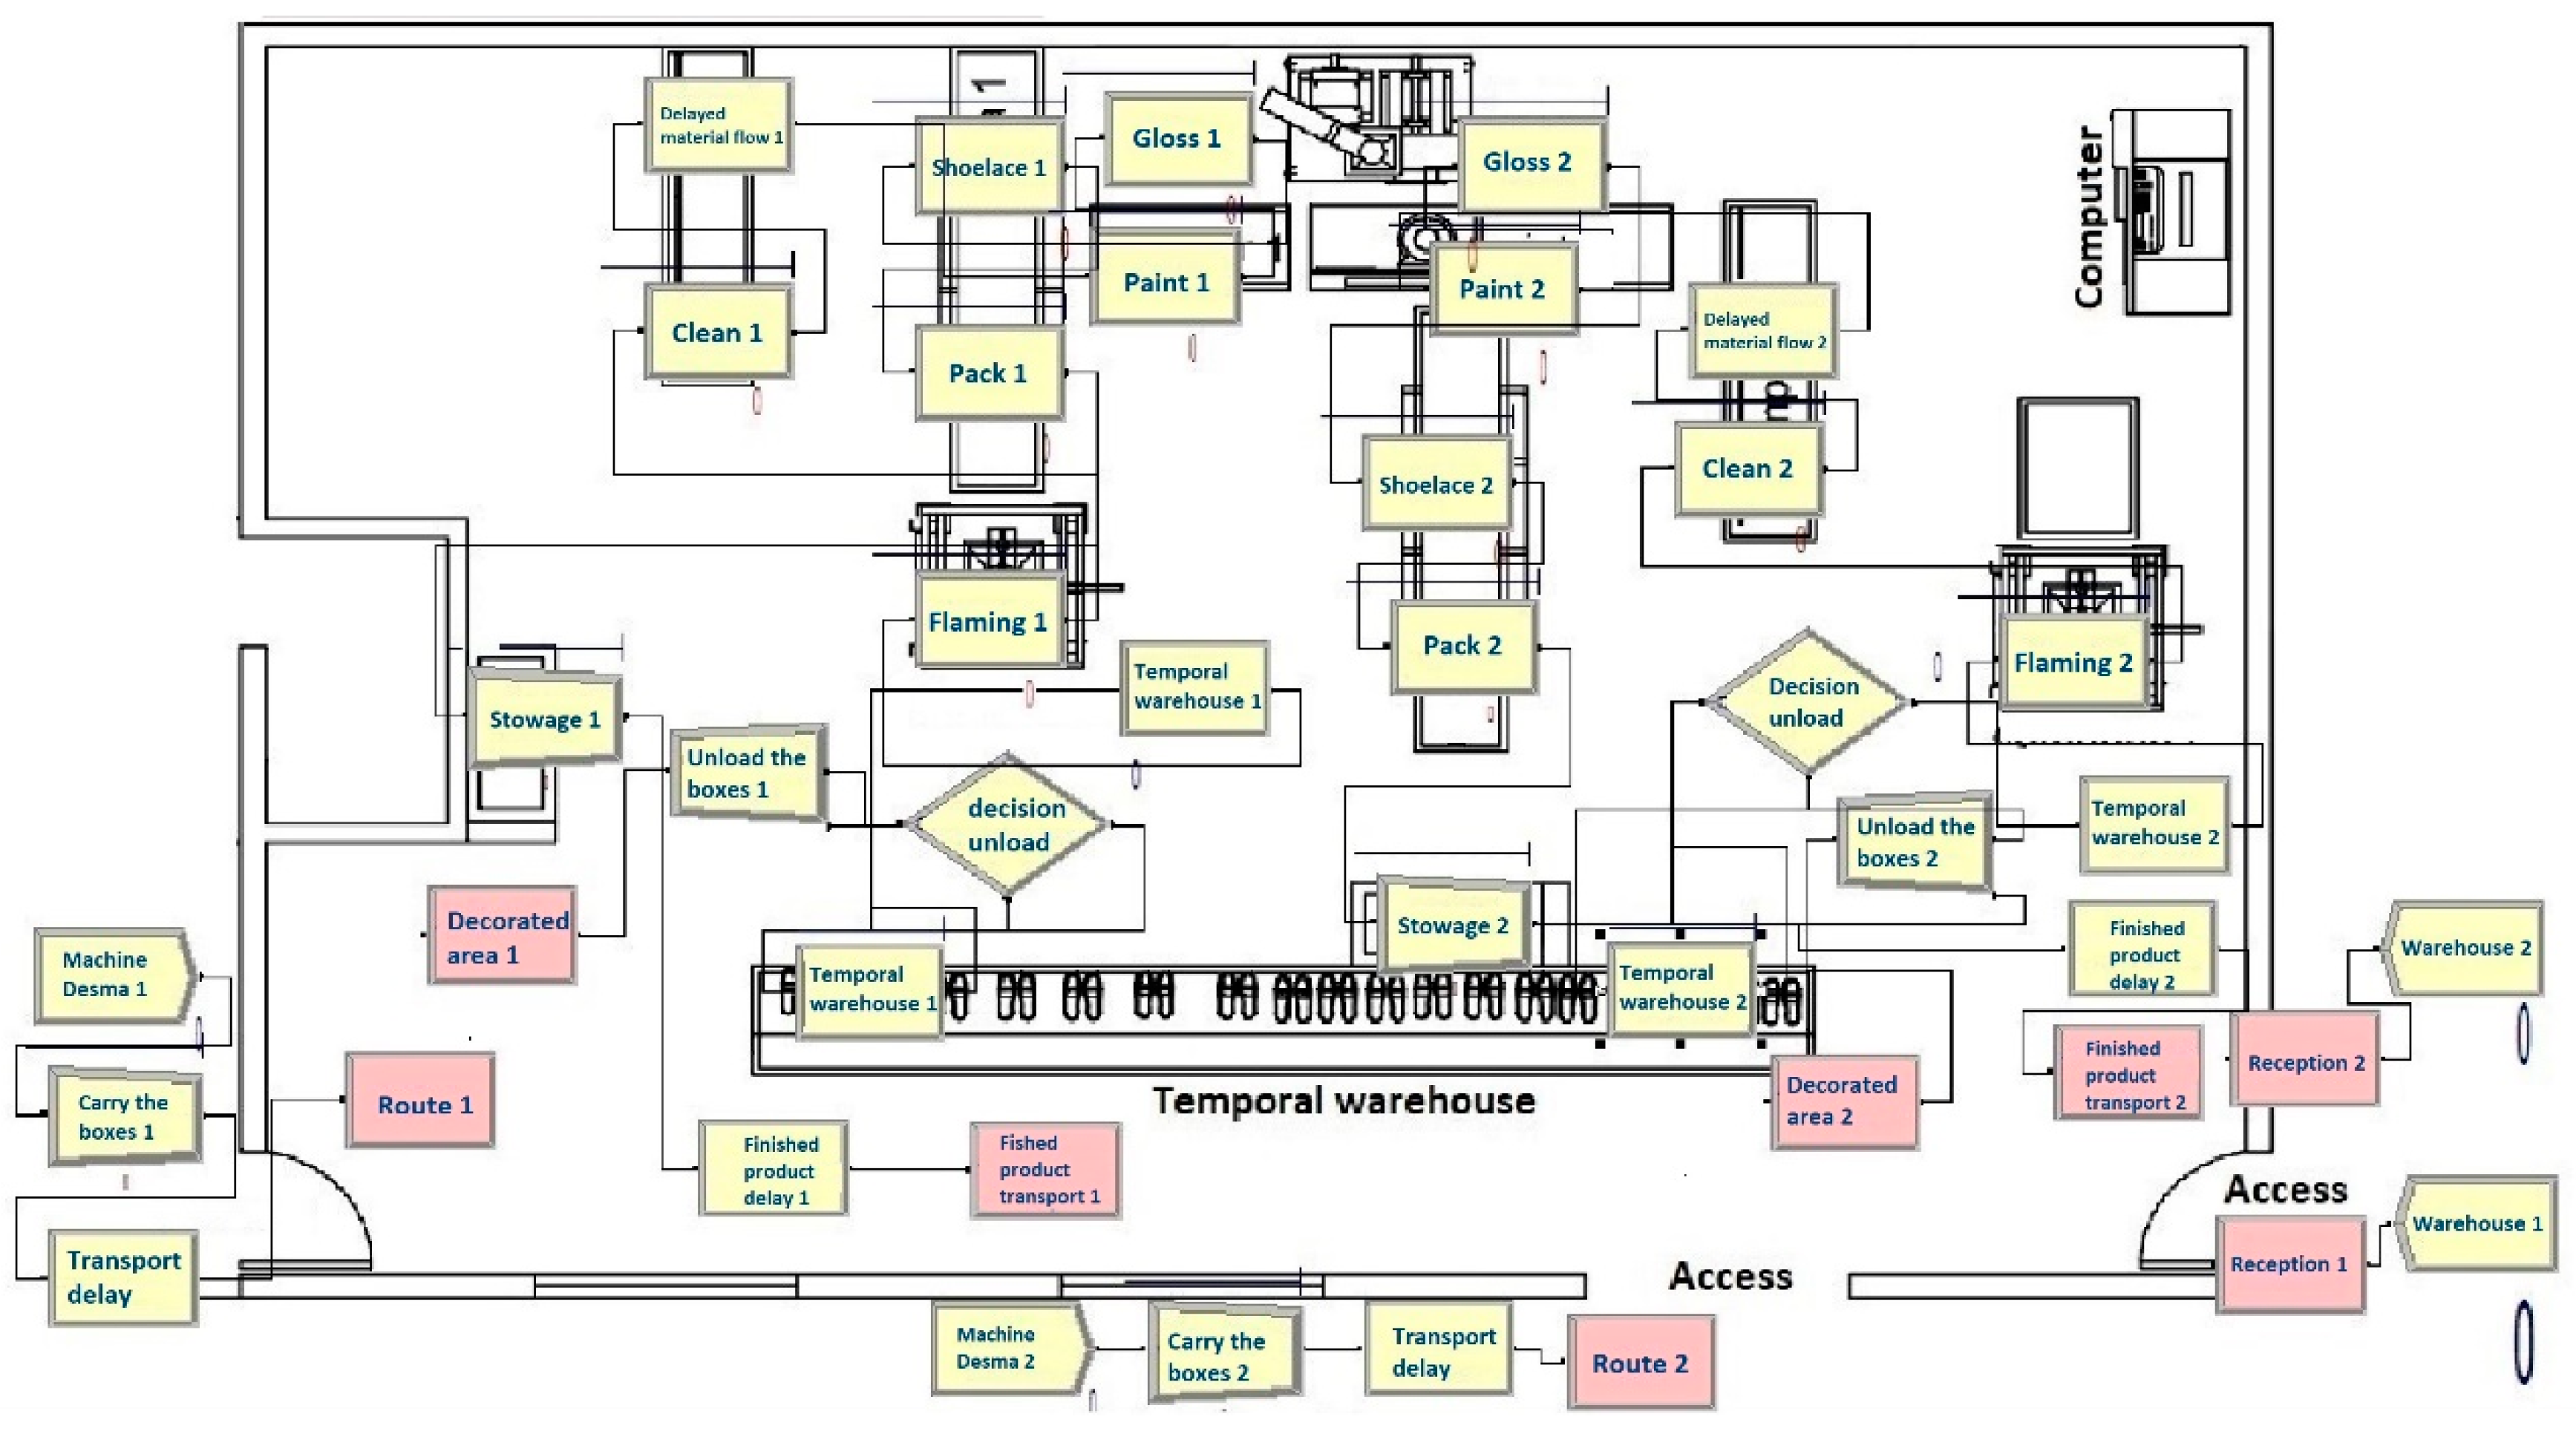
5.4. Model Implementation in the Computer
The model was developed in Arena ™ software. In
Figure 9, the simulation model of the current process is visualized, which consists of 42 modules in total. See also
Figure A1.
2 Create modules that represent the Desma machines,
4 Batch modules that allow the shoes to be put together,
6 Delay modules where they represent the delays,
4 Station modules where the arrival of raw material during the process,
4 Route modules that allow identifying the routes,
2 Hold modules, which allow certain restrictions,
2 Separate modules used to unload the transport to a specific place,
2 Decide modules that allow making decisions during the process,
2 Signal modules that allow signaling the Hold module,
12 Process modules that represent the six main activities of the process,
2 Dispose modules that are used to represent the Finished Product Warehouse.
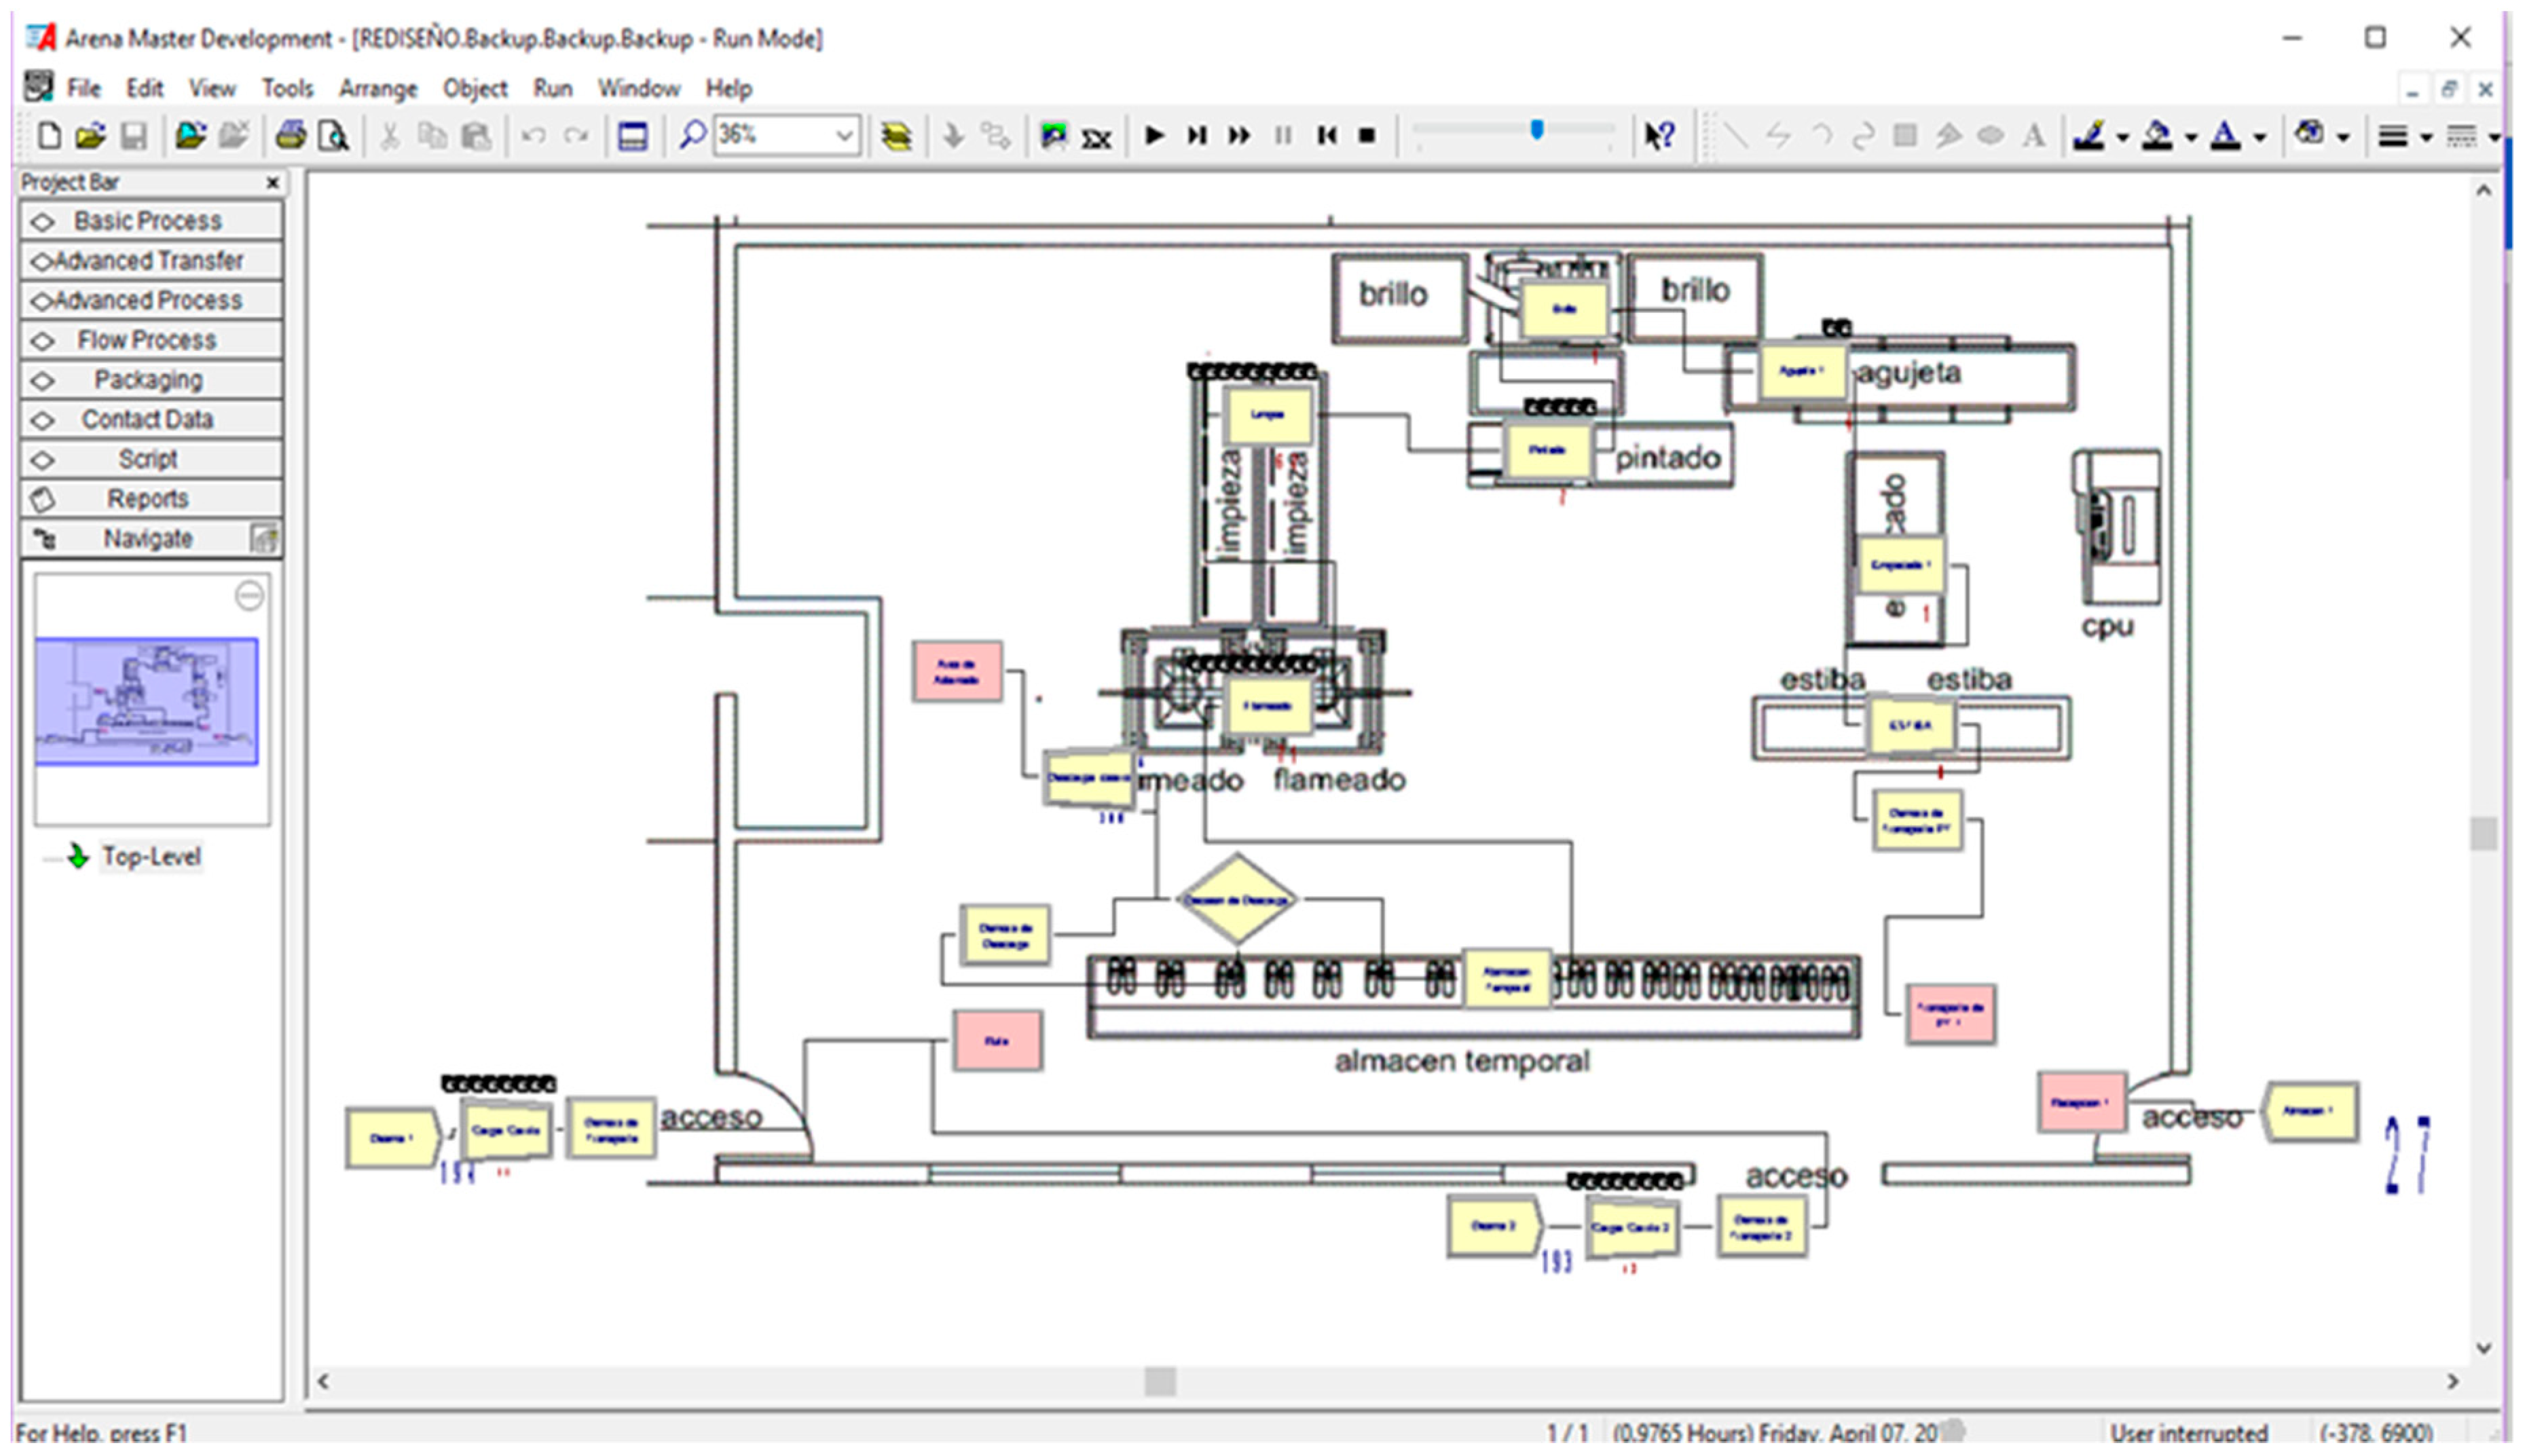
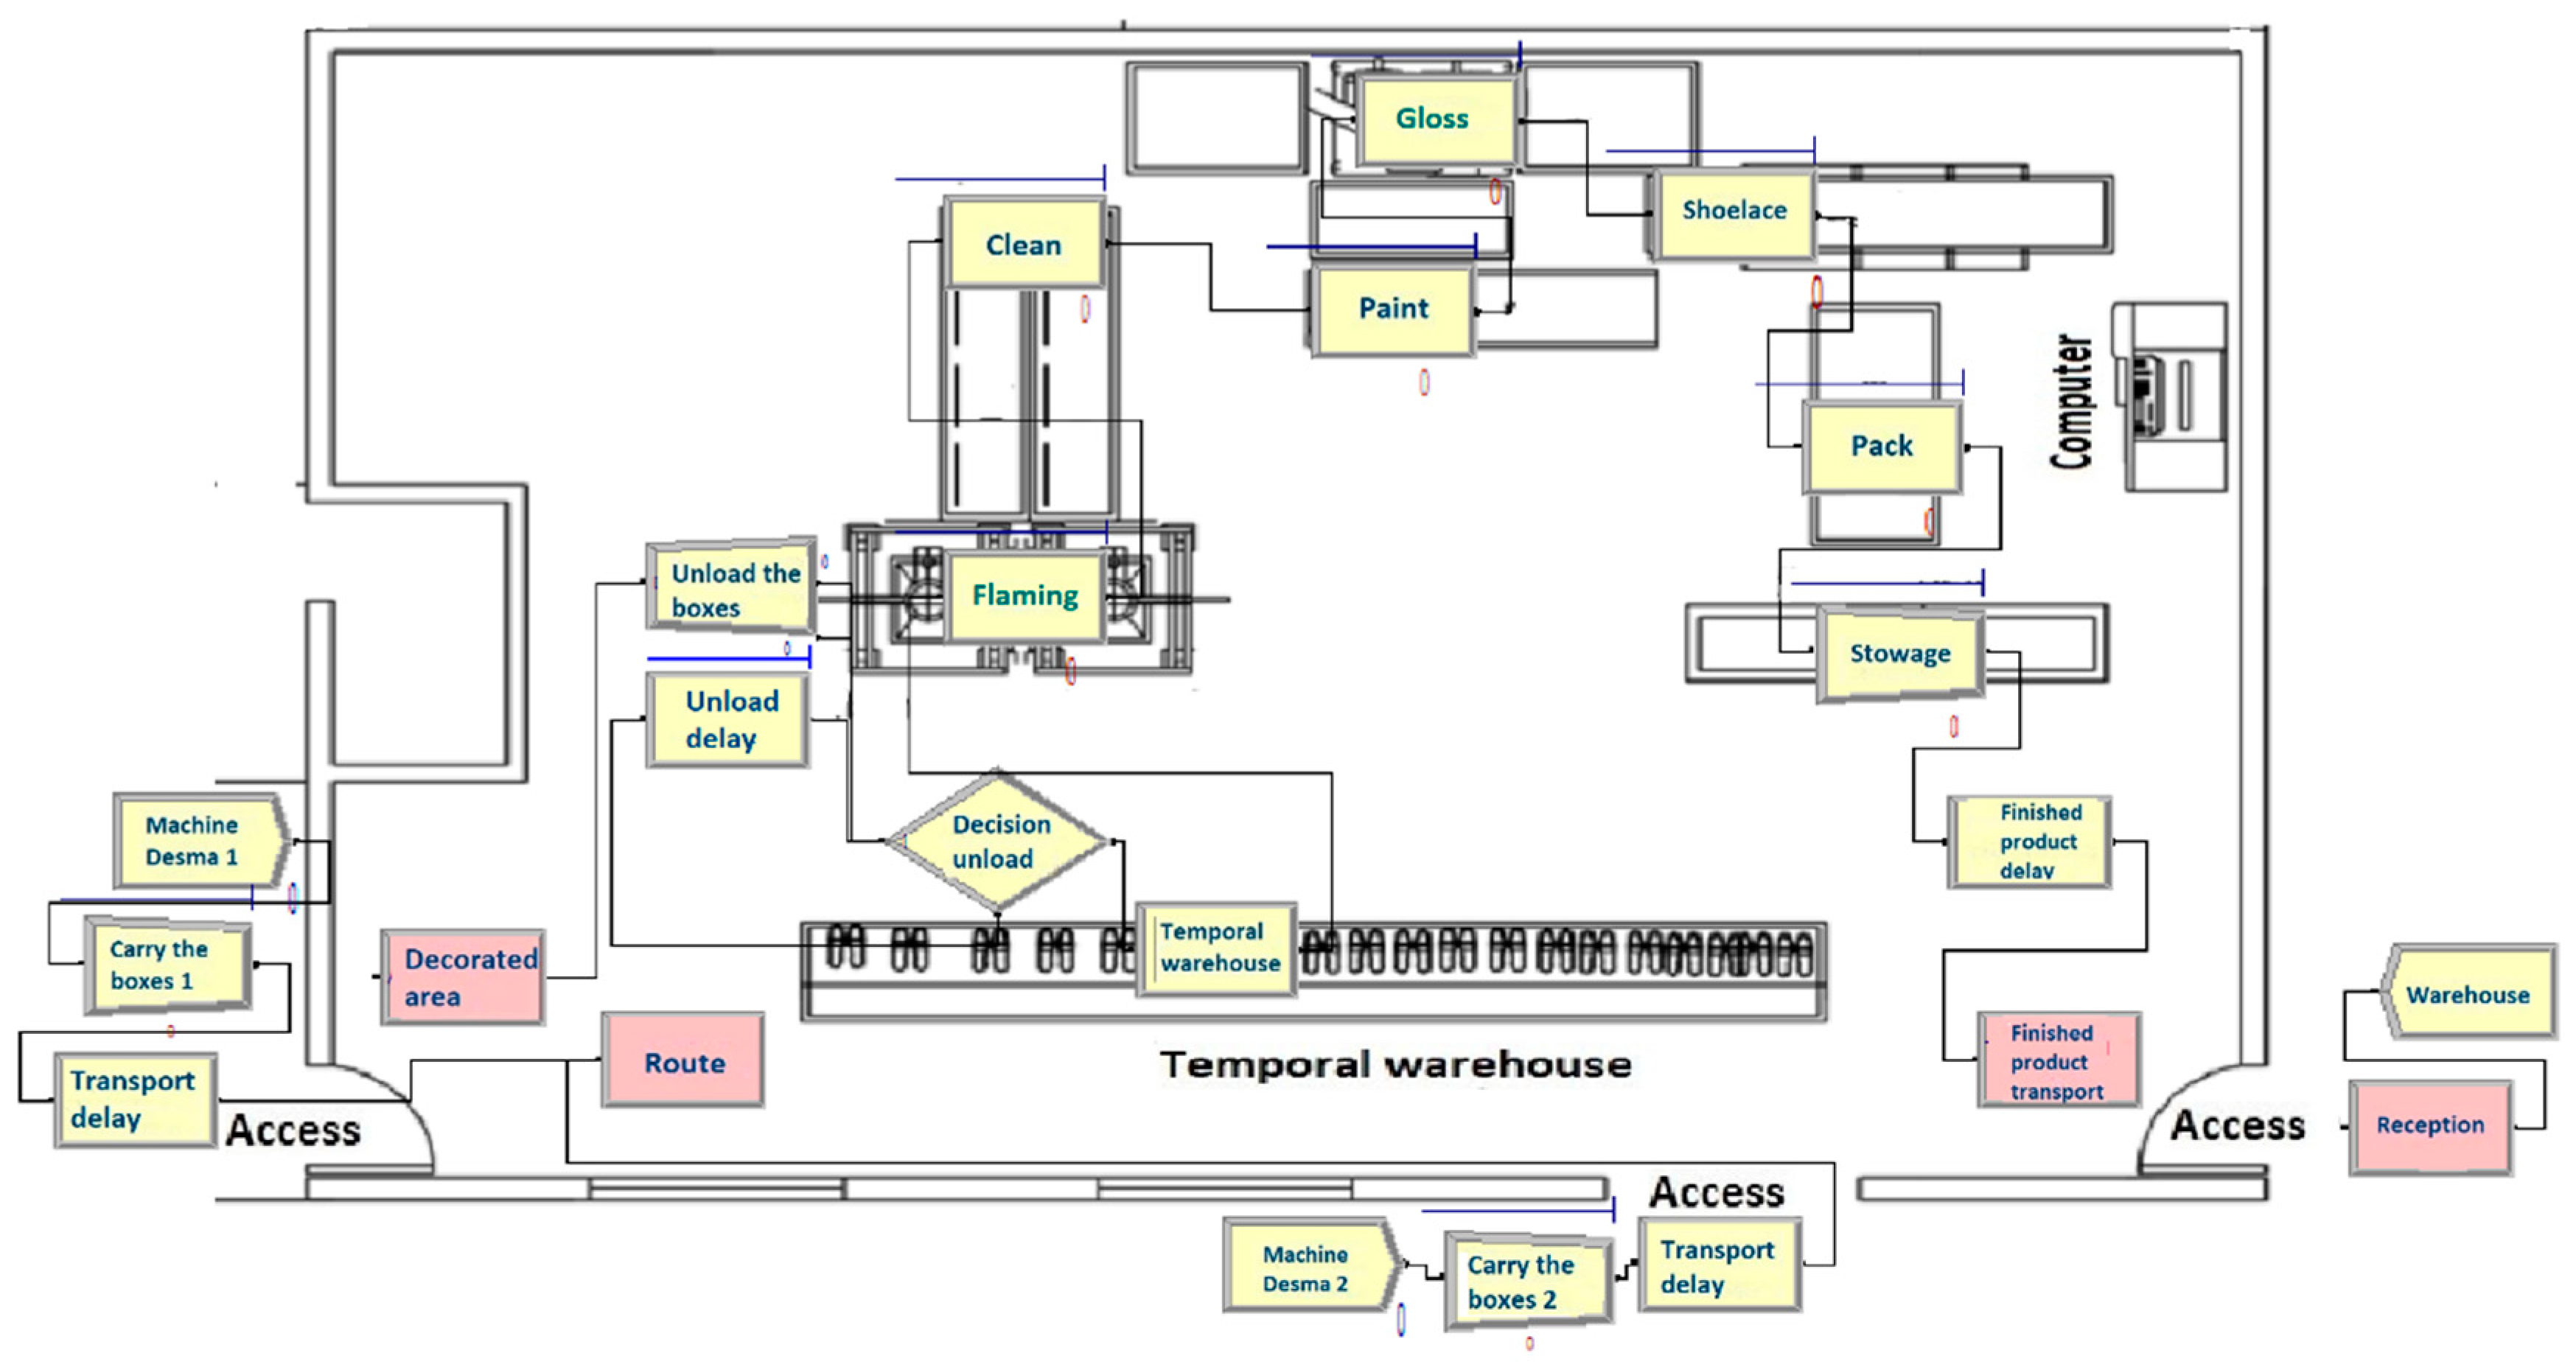
Proposal: The two lines are merged, and the U-shaped arrangement is used (see
Figure 10).
Figure A2 shows the running model.
5.5. Verification
Current: In this part, before running the model, aspects such as time, which should be in seconds for all processes, and distances in minutes were reviewed. In addition, the connectors between the consecutive activities followed the flow chart of
Figure 9, which is the computational model. Likewise, there were no errors when running the model. The same is revised in the proposal, but refers to
Figure 10.
5.6. Validation
To validate the simulation, factory floor-data information was used, where a minimum of 1700 and a maximum of 1750 pairs per day were observed. Therefore, before carrying out the experimentation, several tests were run, and details were corrected that lead us to reproduce what happens in the current process. An example of this is that the warehouse between Desma machine and the Flaming process cannot exceed 50 pairs of shoes and that was corrected in the simulation model. The average production per day in each activity is shown in
Table 3.
Because validation is a comparison of the simulation model report against actual data, and the company does not provide us with data after the implementation, this step is not performed in the proposal.
5.7. Experimentation
The model was run for about 30 replications. Each one starts and ends according to the same rules and uses the same sets of parameters. In the real context, each replication represents a shift. It was decided to use 30 replications because the greater the number of replications, the more reliable the inference is regarding what is happening. There is convincing evidence that a sample size of n = 30 is sufficient to overcome the bias of the population distribution and provides approximately a normal sampling distribution of the random variables [
28], which ensures that the sample can infer what is happening in the population. In this case, the simulation can infer what happens in the real process. In the proposal, 30 replications were made as well.
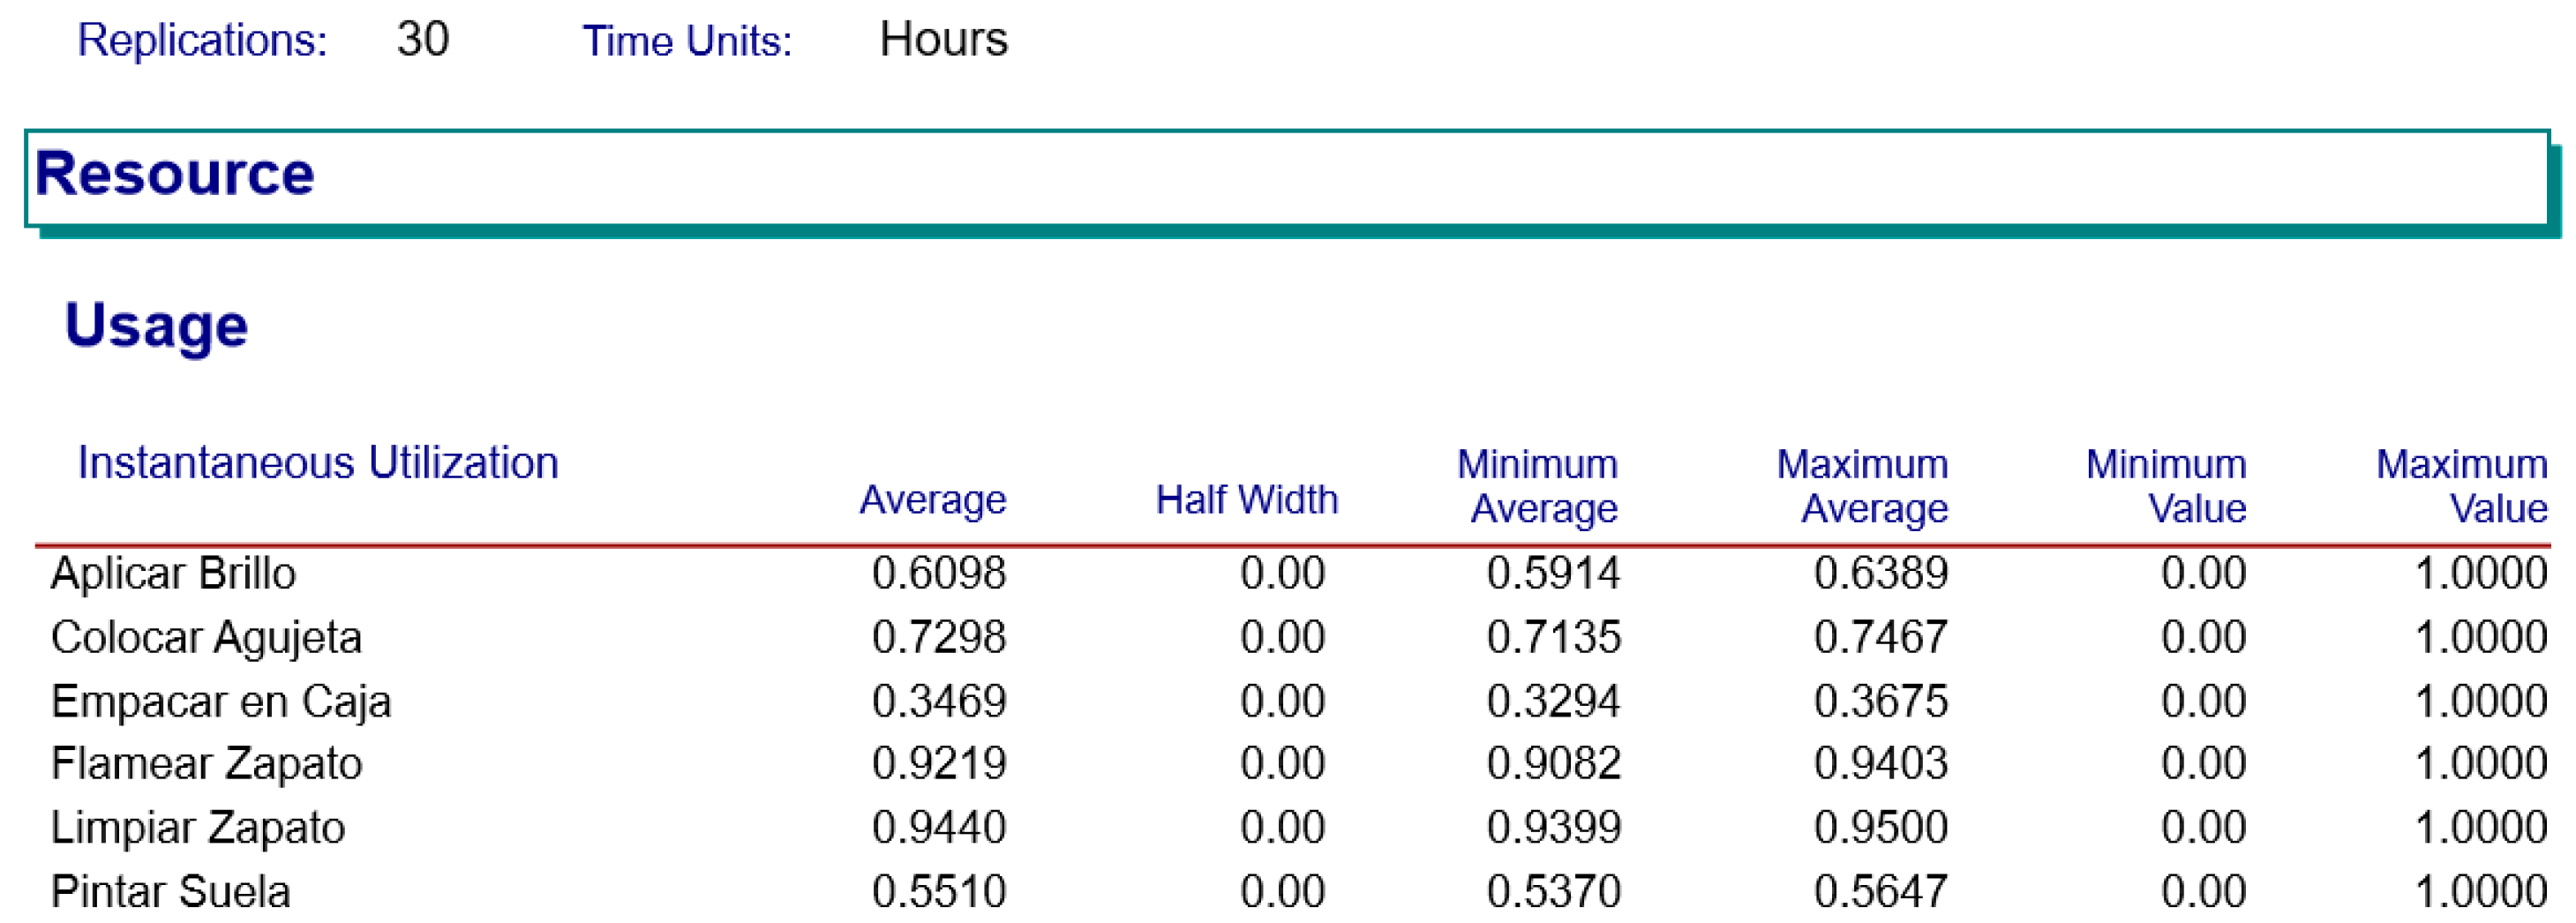
5.8. Analysis of Results
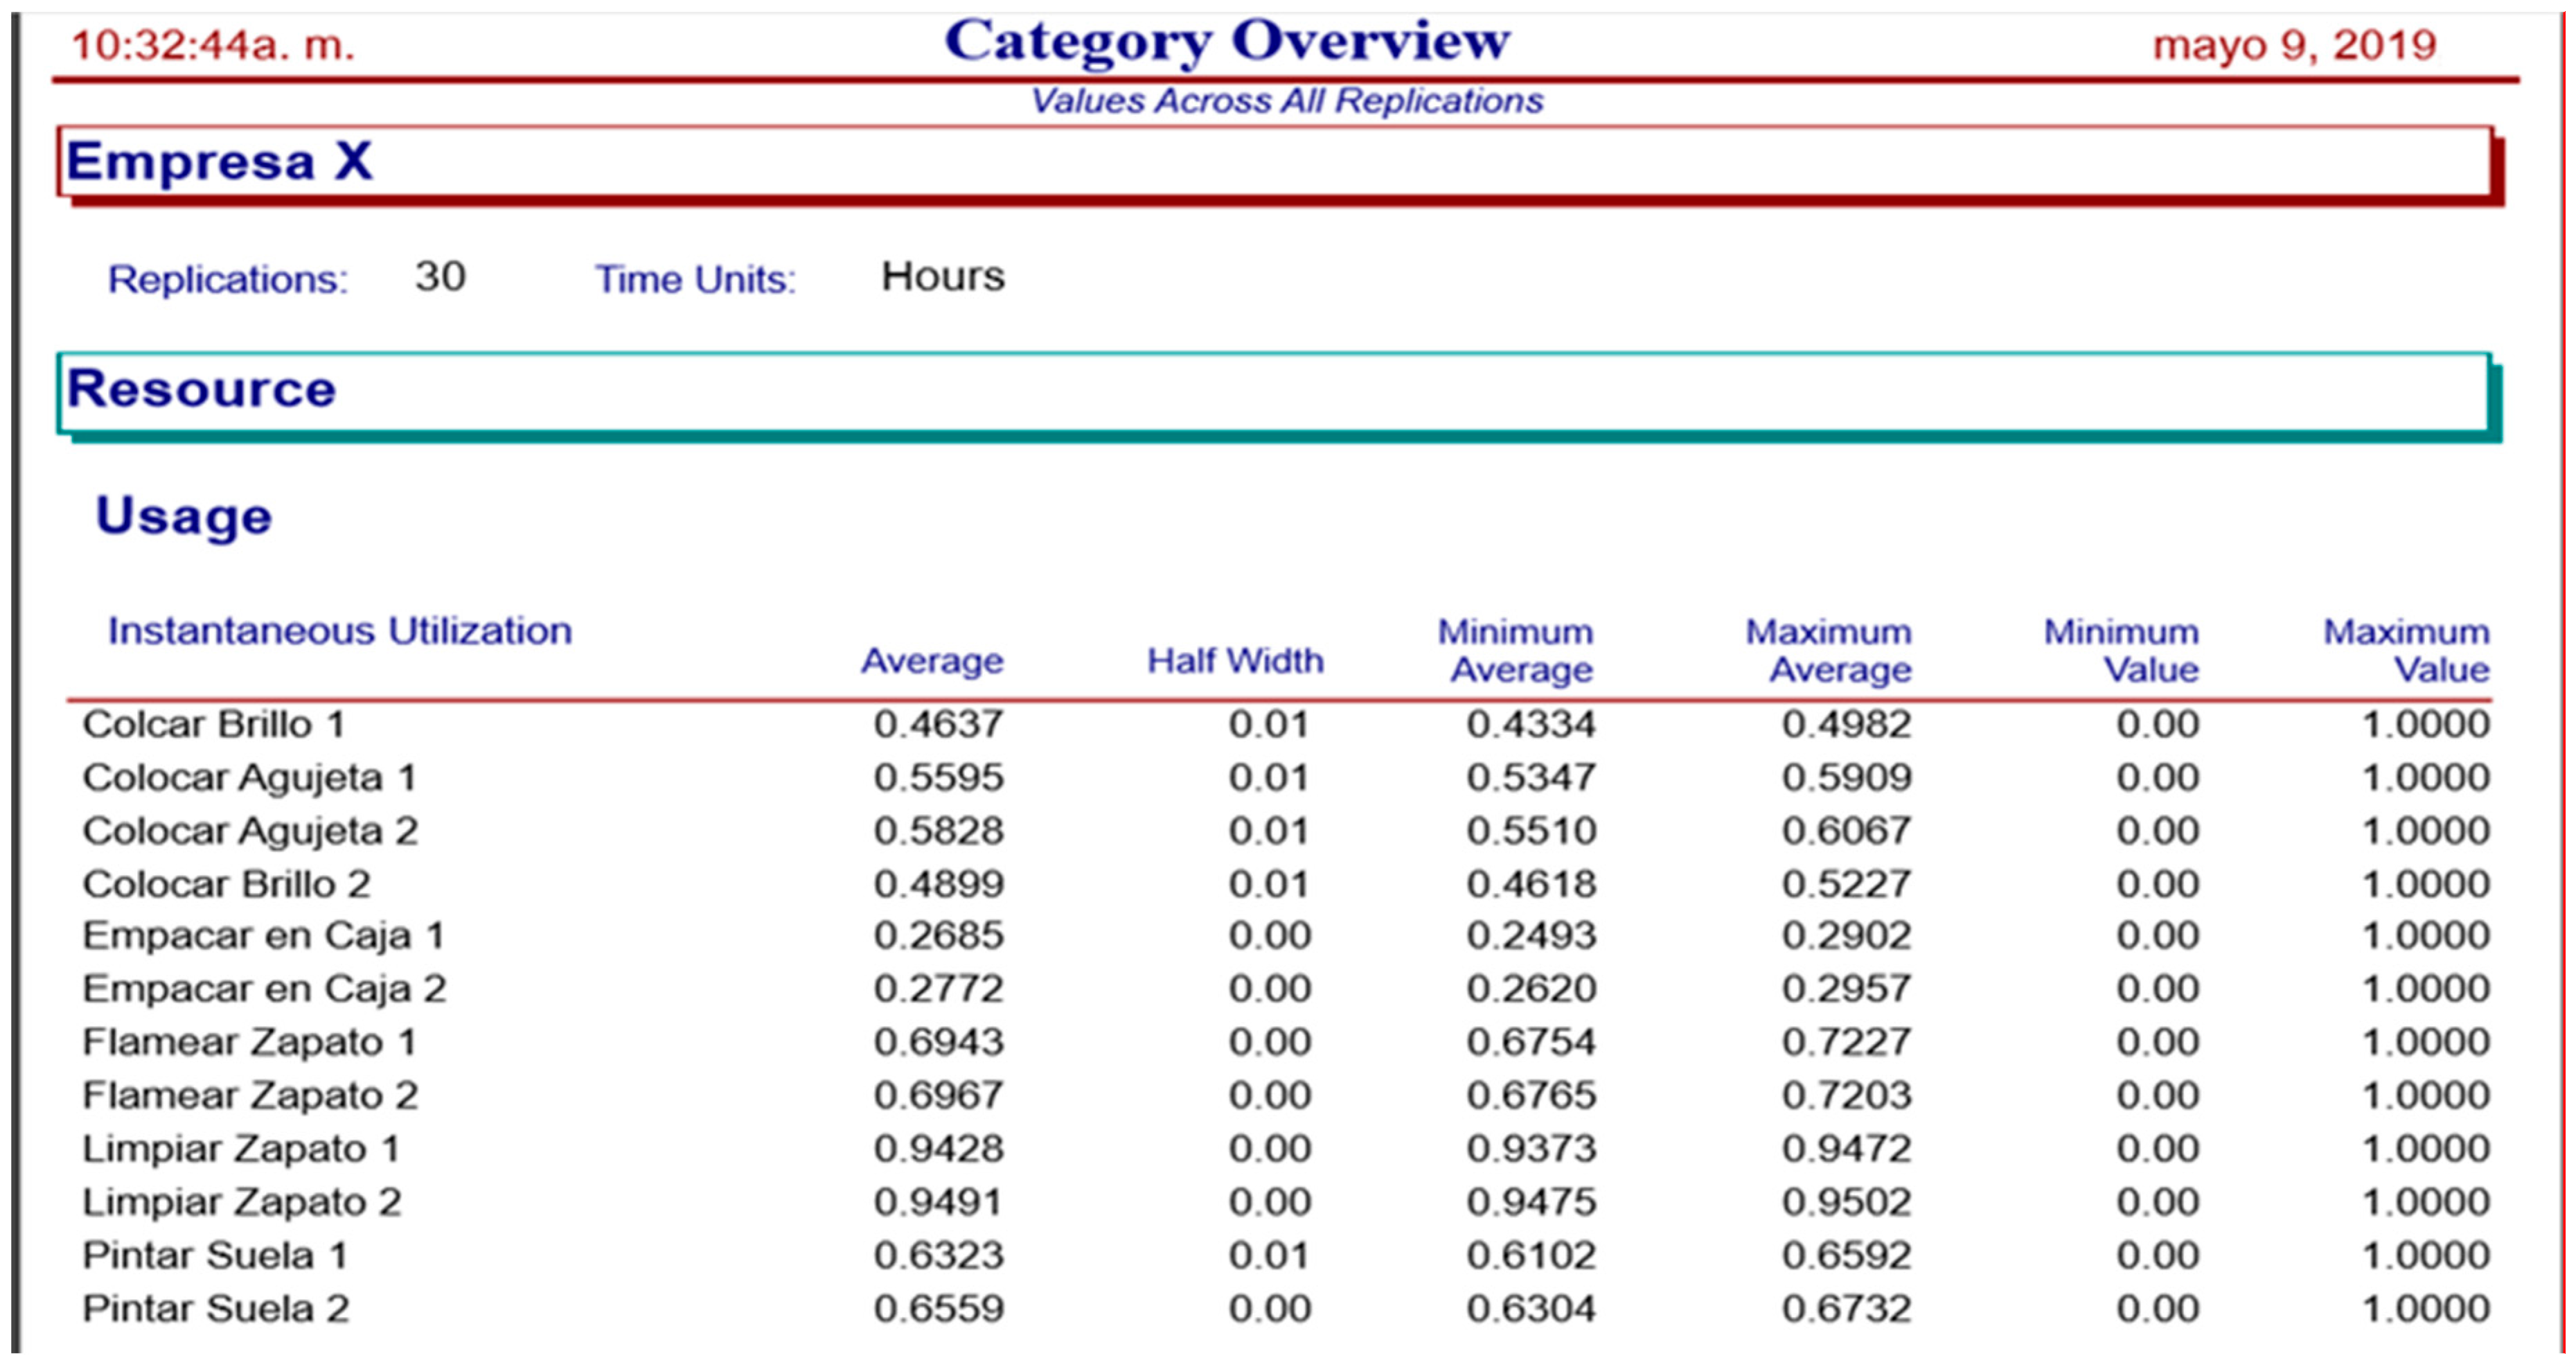
The indicators to compare the current process with the proposal are the percentage of use of each activity and the units produced at the end of each process, which includes, in this specific case, the pairs of shoes that are processed in the decorating area. As we observe in
Table 4, the utilization percentage are registered, line 1 is of a lower percentage compared to line 2, and, when merging both lines into one, we can see that the utilization percentage of each activity increases considerably, which outpaces the current process. See
Figure A3 and
Figure A4 for more information on the simulation in Arena™.
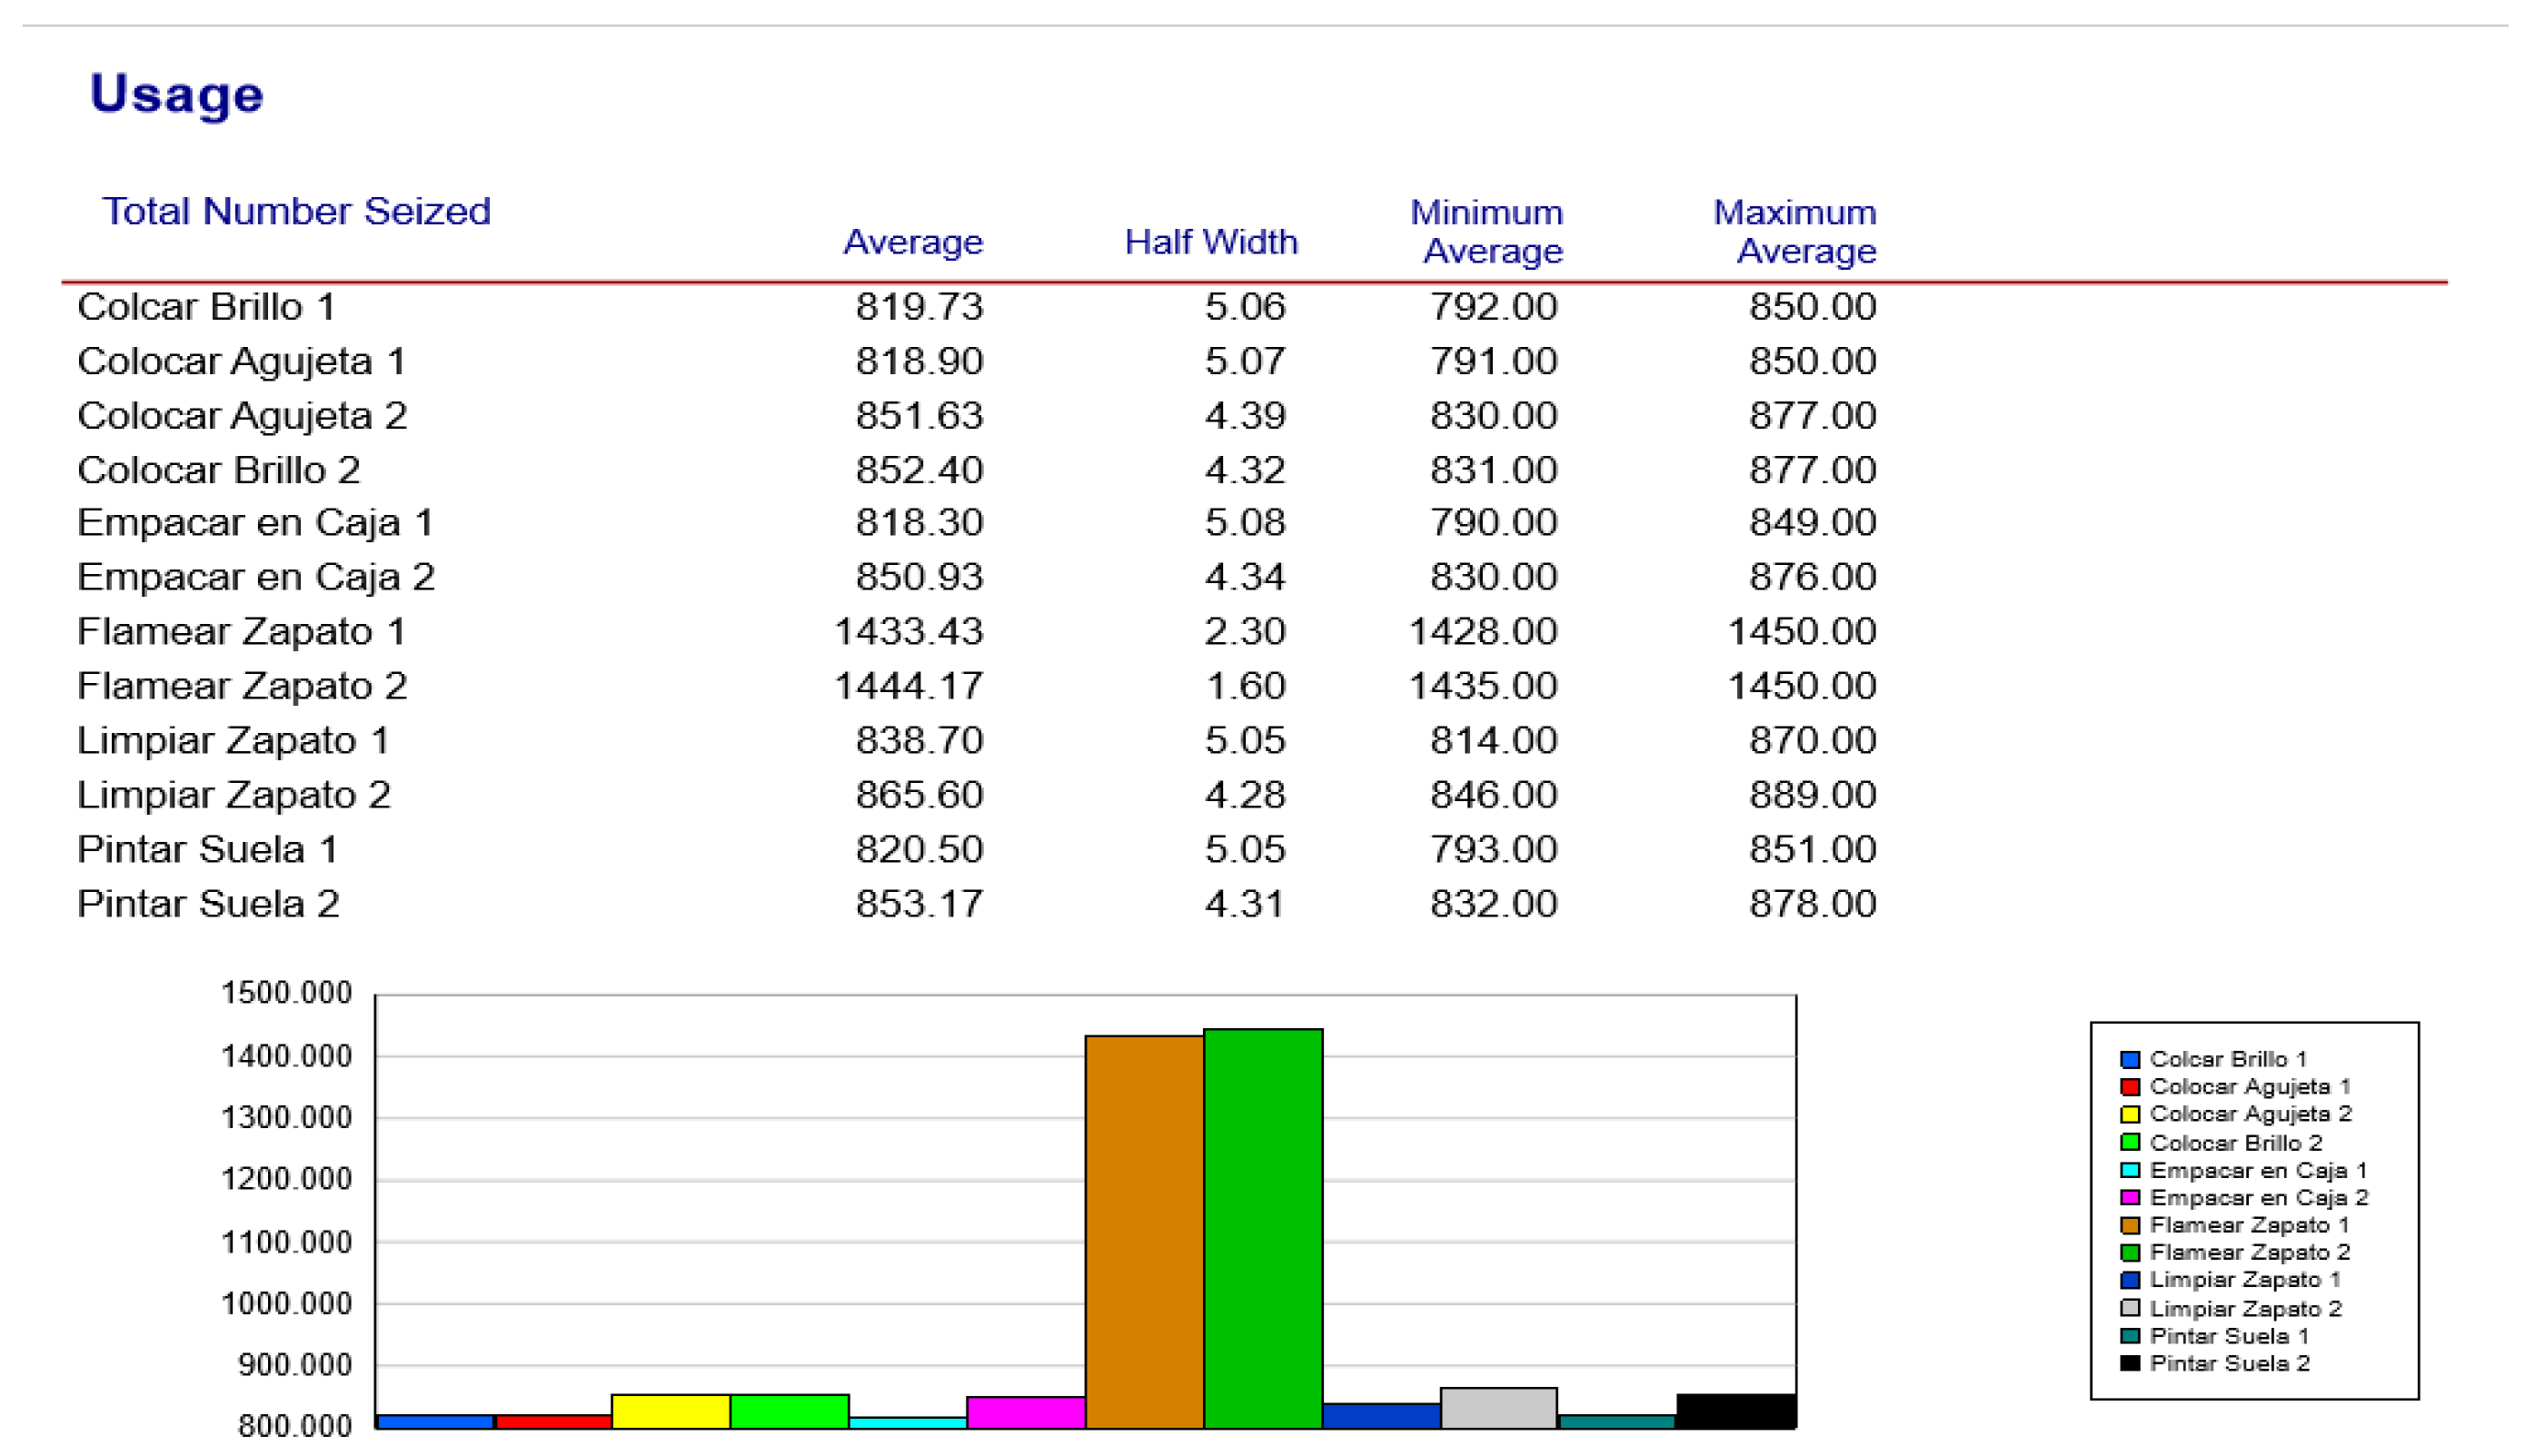
The average production per day is presented in
Table 5, where each activity appears with its respective production. The proposal has the same human resources than the current line 1 and line 2. See
Figure A5 and
Figure A6 for more information on the simulation in Arena ™.
Additionally, the inventory in the process is shown in
Table 6 and it is useful to validate the simulation model. In the flaming and cleaning activities, whose utilization is higher, there are waiting lines, while, in activities where utilization is less, they do not exist.
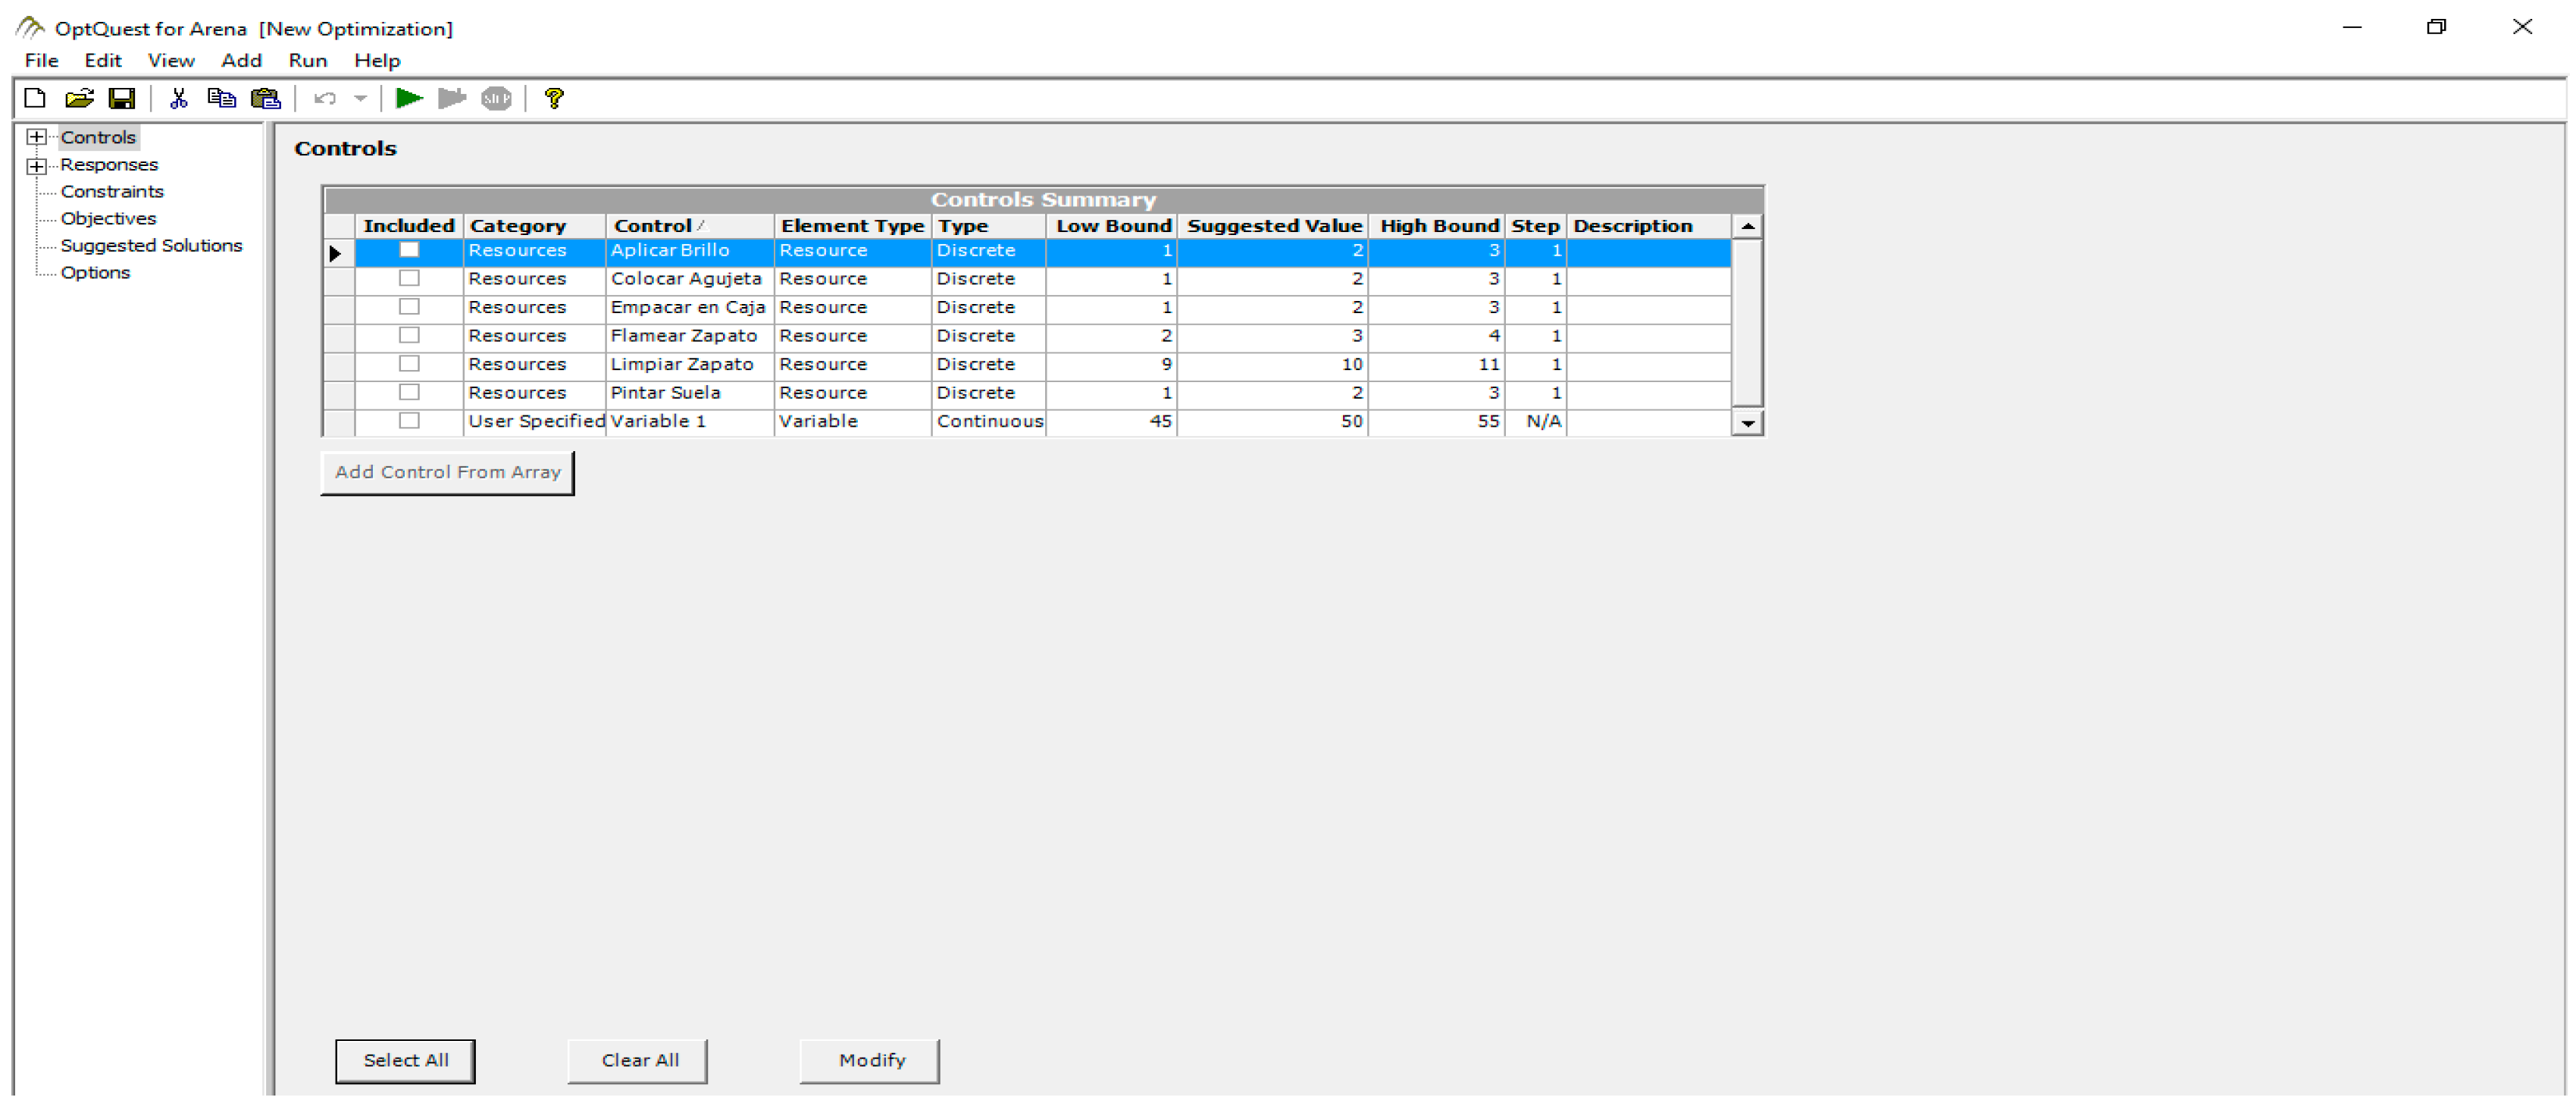
When performing an analysis of human resources per day, it was observed that human resources are underutilized. Due to this, it was decided to use OptQuest to maximize production using human resources as a constraint (see
Table 7). Once the tool has been used to optimize, there is an increase to 41% of the average final production per day, which is equivalent to 2350 pairs of shoes (
Table 8). This preserves the same number of workers. See
Figure A7,
Figure A8, and
Figure A9 for more information on the simulation in Arena™.
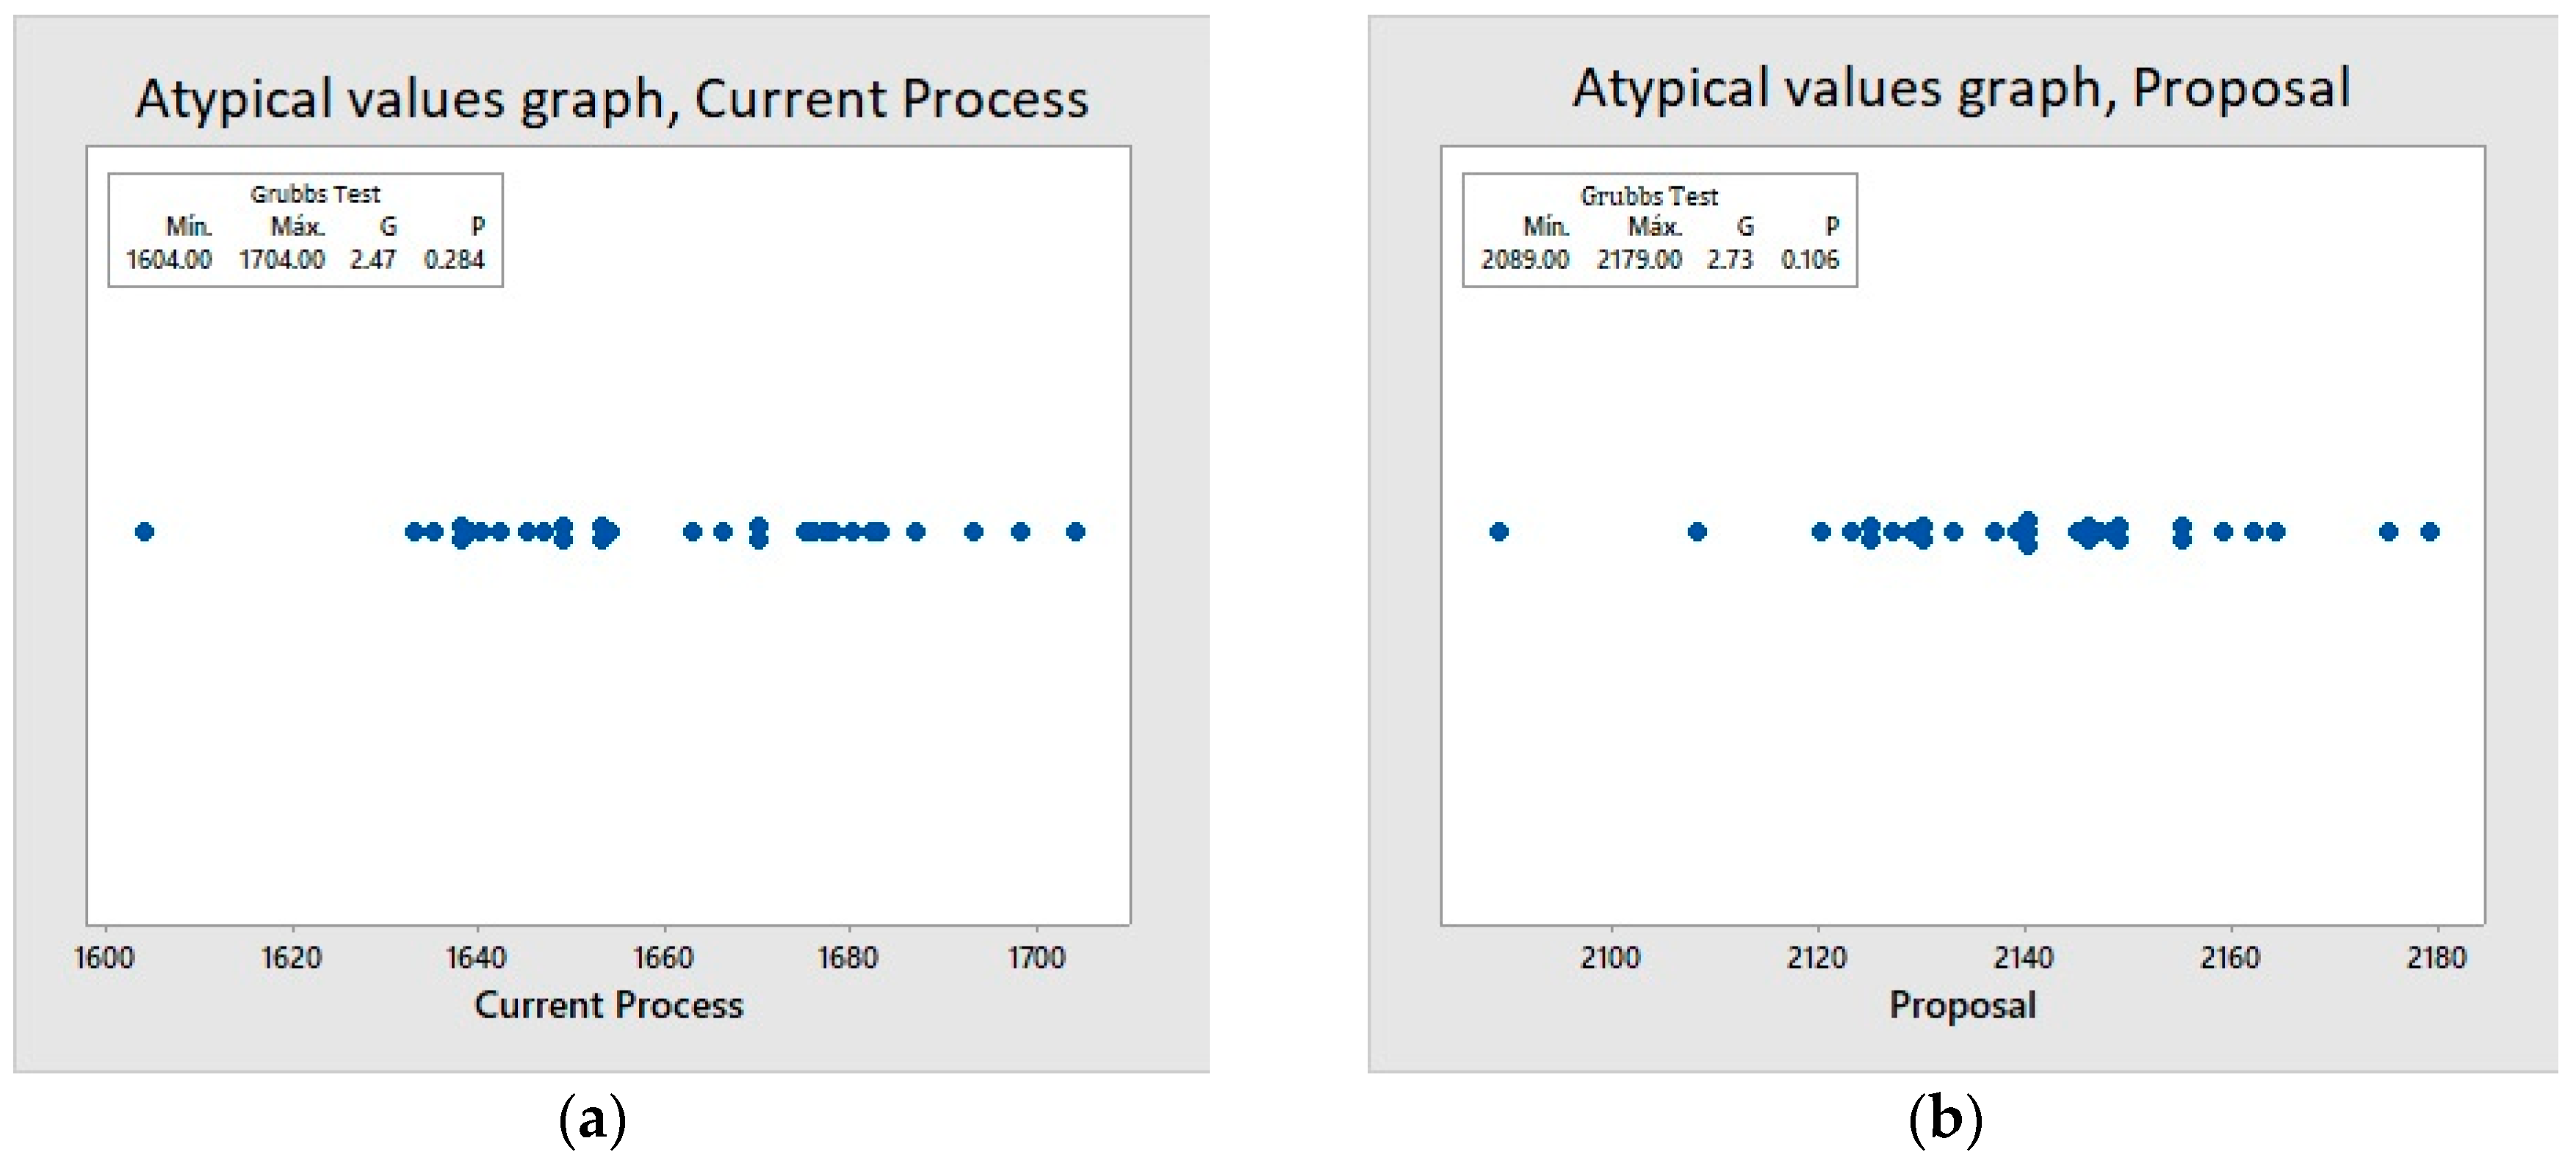
In order to identify data affected by errors, the Grubbs test was applied for the data of the current process in
Table 9 and for the data of the proposal in
Table 10. Thirty simulations with one run were performed and the average production was recorded per work shift for both the current system with two lines (see
Table 9) and the proposal with a single line (
Table 10).
First, a Kolmogorov-Smirnov test was applied to evaluate if the data can be reasonably approximated by a normal distribution before applying the Grubbs test. It was concluded that both the data of the current process and those of the proposal have a normal distribution because the
value is greater than the value of
. Then, the Grubbs test was made (see
Figure 11).
Grubbs’s test is defined for the hypothesis:
It was concluded that both the data of the current process and the proposal do not have outliers because the
value is greater than the value of
. Additionally, to formally compare if the proposed method (
Table 10) is better in terms of average production per work shift than the current one (
Table 9), the following hypothesis test is proposed. The average production/day of the proposed process is higher than the average production/day of the current process, where
= proposed process and
current process.
To perform this test, it is necessary to know if the population variances are the same or different even when they are unknown [
29]. Therefore, the following hypothesis test is performed in Minitab™ and presented in
Table 11.
Because the value of
is greater than the significance level
, there is statistical evidence to accept the null hypothesis, that is, the population variances, although unknown, are equal. This information is used to verify if the means are equal or if the mean of the proposal is greater than that of the current process defined in Equation (2). These calculations are also done with Minitab™ and presented in
Table 12.
Since the value is less than the significance level , there is statistical evidence to reject the null hypothesis, that is, the mean of the average production per day is higher than the mean of the current process. Lastly, to know how superior it is, the confidence interval for the difference of the means is presented, . This interval determines the number of pairs of shoes that the proposed process can increase when compared to the current process with 95% reliability.
5.9. Implementation
In order to perform the implementation, the company was recommended to continue with the reengineering team, which is, in this case, the quality manager who served as the reengineering leader. The owner of the process was the production manager. The Reengineering team was formed by the Engineering, Human Resources, Warehouse of Raw Materials and Finished Product chiefs. They were the outside members. Additionally, the inside members were the coordinator of the decoration area and the quality inspector. The steering committee was made up of the chiefs of Human Resources, Purchasing, Accounting, and Engineering. Lastly, the Reengineering Czar had two main functions: to train and support the process owner and the reengineering team, and to coordinate all the reengineering activities that were launched.
To start with the implementation, all the reengineering collaborators met, and the leader spoke to them about the need to redesign the decorating area. The problem was exposed and the proposal that merges both lines was explained, giving rise to a new process flow and a new plant distribution. The amount of resources calculated in
Table 8, in the optimization column, were used. The activities, who was accountable for them, approximate time and resources were defined among all, which gave rise to the Gantt Chart of the implementation. The company only granted permission to discuss the implementation in a general way, but implemented it in 35 days. Its historical results show a higher productivity increase than that reported in the proposal analysis with the simulation.
6. Discussion
As already mentioned, the indicators to study were the percentage of use of each activity and units produced at the end of each process, which, in this case, are the pairs of shoes that are processed in the decorating area. As we observe in
Table 4, where the results of the utilization percentage are registered, line 1 is of a lower percentage compared to line 2, and, when merging both lines into one, we can see that the utilization percentage of each activity increases considerably, outpacing the current process. It is necessary to point out that the painting activity is underutilized. This is because, in the previous activity of cleaning, high inventories were generated in the process. Both the original and the proposed models were simulated in Arena™, using the same probability distributions and the original personnel to make the comparison.
In
Table 8, it is observed that Line 1 ends the first activity with a production of 975 pairs of shoes during one shift. The following is the cleaning of the shoe with a total of 834, and so on. It is observed that the production is decreasing in each activity, which causes high inventories in the process. At the end of production, 814 pairs of shoes are obtained from Line 1 and 847 pairs of shoes are obtained in Line 2, which is a total of 1,661 pairs of shoes obtained per day from the current process. Regarding the proposal, we can see that, at the end of the first activity, the current process is greater with a total of 2856 pairs of shoes, and, at the end of the process, in packaging, the proposal delivers more production, 2138 against 1661 pairs, which increases 29% of the current production. There are few inventories in the process in the proposal since it is observed that the pairs produced at the end of each activity are approximately constant. However, since this model uses the same probability distributions and human resources, even the painting activity is underused. For solving this, another OptQuest tool was used, which is an optimization module designed to facilitate its integration in applications that require the optimization of highly complex systems. In our case, we decided to maximize resources and number of staff that work in the decorating area. These are 24 people distributed in the different activities, as can be seen in
Table 7. Once the tool has been used to optimize, there is an increase to 41% of the final average production per day, which is equivalent to 2350 pairs of shoes (see
Table 8). Regarding the validation of the data, we have factory floor-data before the implementation but not after. This is a limitation of our work because validation is making a comparison between the results reported in the arena and real data. Therefore, the proposal could not be validated in only the current process.
7. Conclusions
In this research work, two methodologies were used to solve problems within industries. First, reengineering to conceptualize the problem and generate solution proposals. Second, simulation to compare the proposal conceived with the current process. Both methodologies were used to deal with the current problems presented by the company, and to issue a solution proposal. Despite the fact that, in this work, there is no theoretical contribution, there are practical contributions not only to help the improvement of the processes, but also to do a complete analysis of the current process with its respective deficiencies, which were analyzed. Once the process where the improvement would be made was selected, a proposal was made that was tested through the simulation. Until the time of this research, there were no articles focused on reengineering in an industrial footwear plant supported by simulation. Moreover, this fusion of methodologies can be used in companies in another sector with their respective adaptations.
After performing the simulation experiments, the results indicate that the production rate increases by approximately 29% with the new configuration, and up to 41% when the human resources are optimized through OptQuest. The company implemented the configuration of the proposal, or more precisely the optimization, which brings significant improvements such as making better use of the factory space, eliminating unnecessary work, allowing better mobility, better use of resources, and more. Some of the limitations of this work was dealing with people by convincing them to get them out of preconceived ideas. The other was that we have factory floor-data after the implementation. In future work, we would like to implement the methodology but only when using other process analysis techniques.


