Featured Application
Linear appraisal systems (LAS) determine individuals’ degree of fitness to an optimal morphological standard. These methods are efficient tools that help saving the time, personnel and economic resources when zoometric phenotype collection is performed at large population scale. Reducing the complexity of zoometric panels may maximize phenotype collection outcomes at the minimum possible accuracy cost. Once panel optimization has succeeded, LAS/Traditional measuring validation must be performed to ensure traditional zoometric results are replicable when LAS is performed. After validation, reduced models proved to be effective to capture and predict for dairy-related zoometric variability in Murciano-Granadina bucks and does.
Abstract
Implementing linear appraisal systems (LAS) may reduce time, personnel and resource costs when performing large-scale zoometric collection. However, optimizing complex zoometric variable panels and validating the resulting reduced outputs may still be necessary. The lack of cross-validation may result in the loss of accuracy and value of the practices implemented. Special attention should be paid when zoometric panels are connected to economically-relevant traits such as dairy performance. This methodological proposal aims to optimize and validate LAS in opposition to the traditional measuring protocols routinely implemented in Murciano-Granadina goats. The sample comprises 41,323 LAS and traditional measuring records from 22,727 herdbook-registered primipara does, 17,111 multipara does and 1485 bucks. Each record includes information on 17 linear traits for primipara/multipara does and 10 traits for bucks. All zoometric parameters are scored on a nine-point scale. Cronbach’s alpha values suggest a high internal consistency of the optimized variable panels. Model fit, variability explanation power and predictive power (mean square error (MSE), Akaike (AIC)/corrected Akaike (AICc) and Bayesian information criteria (BIC), respectively) suggest the model comprising zoometric LAS scores performs better than traditional zoometry. Optimized reduced models are able to capture variability for dairy-related zoometric traits without noticeable detrimental effects on model validity properties.
1. Introduction
The American Dairy Goat Association (ADGA) published the first linear appraisal system (LAS) for dairy goats. LAS was presented as an attempt to search for more predictive and objective methods to link zoometry and productivity in 1993. The benefits derived from the application of LAS comprise the evaluation of moderately heritable zoometric traits that hold a significant relationship with productive traits. This evaluation is performed for each animal and uniformly across the population, using scales that are able to capture the variability between observed biological extremes in economically important traits.
The combined Caprine Index (ICC) [1] and Morphological Index began to be applied in French dairy breeds in 1999. Since these very first attempts, many breeds (Alpine, Lamancha, Nigerian Dwarf, Nubian, Oberhasli, Saanen, Sable or Toggenburg) have implemented LAS. In the most representative cases, the number of linear appraisals performed increased by up to 3828.40% during the period ranging from 2005 to 2019 [2].
The National Association of Breeders of the Murciano-Granadina goat breed (CAPRIGRAN) routinely performs a numerical description of 17 zoometric linear traits on a one to nine-point scale. This scale is used to represent the biological range for each particular trait that exists in the current population. Then, these linear trait data—plus a final score for each animal —are used to develop individual reports for does and bucks. The importance of the system is denoted by the fact that LAS observations have reached a number of almost 400,000 in the past 5 years [3].
Contextually, although CAPRIGRAN LAS [4] has a strong basis on ADGA and USDA’s LAS, it is relatively new, as its application only dates back to 2010. Murciano-Granadina goat linear appraisals increased by 16.05% from 2018 to 2019. After a decade of progress, the most remarkable international achievement obtained by Murciano-Granadina breeding may be that figures have exceeded the most promising results reported by other breeds by more than 10 times. For instance, the Nigerian Dwarf Goat breed had previously shown the greatest increase in the number of linear appraisals, with 3182 new linear appraisals performed, in 2019 [2].
CAPRIGRAN performs routine LAS using a team of raters who use PDA and “Escardillo” technical–economic management software to collect individual ratings [5]. Raters evaluate each animal across four structural areas (structure and capacity, dairy conformation, mammary system and legs aplomb). The scores provided for each zoometric variable depend on the degree of resemblance of the measure observed on each individual to the optimal standard measure for Murciano-Granadina dairy goats. Then, the scores of the variables comprising each major area are summed and multiplied by a coefficient. This coefficient depends on the preestablished relevance of each major area to define the dairy morphotype and breed standard.
For breeding does, the structure and capacity, dairy conformation, mammary system and legs aplomb areas are multiplied by 25%, 15%, 40% and 20%, respectively. For breeding bucks and goats which have not yet given birth, the areas to be scored are reduced to structure and capacity, dairy conformation and legs aplomb, and their relative scores are multiplied by 50%, 20% and 30%, respectively. Then, the final score may total up to 100 points depending on the relative scores for each of the areas obtained by each animal.
Afterward, points are translated into a verdict as follows: insufficient (IN) when a certain animal totals from 60 to 69 points; mediocre (R), from 70 to 74 points; good (B); from 75 to 79 points; quite good (BB), from 80 to 84; very good (MB), from 85 to 89 points; or excellent (EX), at 90 points or above [6]. Then, the final score relative to each major category of each animal is used by raters to compute each animal’s final score to provide individualized reports per animal to the owner of each herd. Afterward, final records are registered in the computerized record and used to rank sires and dams in official catalogues. Finally, all the information is made public using codes for each animal to fulfil the requirements of Data Protection Policies.
The collection of large sets of zoometric variables is essential when performing the characterization of breeds. However, it can be time-consuming, human resource-demanding and unprofitable when the standard of a breed has already been defined or if large-scale zoometric assessment is needed. CAPRIGRAN LAS differs from ADGA and UDGA’s systems in the fact that raters translate biological variability on a point scale ranging from one to nine.
Given the need to ensure the applicability of LAS at a large scale, the simplification of CAPRIGRAN LAS is one of the top-priority challenges to address when applying on-farm protocols in goats [7]. At this point, statistical optimization and validation are crucial practices to perform to ensure the capacity and reliability of LAS to describe the ranges of zoometric measures found in the population. Contextually, principal component analysis (PCA) has been widely applied as a method to discard potentially redundant or confounding zoometric traits [8,9], which can maximize the predictive power of linear appraisal scales efficiently.
Once large variable sets have been reduced, preserving the greatest fraction of variance possible, the scales must still be tested. Scale testing aims to determine whether the results reported by linear appraisal techniques are comparable to those reported by traditional zoometric assessment. The comparison of both methods enables the calculation of an index of the degree to which an artificially built scale can depict zoometric patterns in a population. For this purpose, regression analysis and canonical correlation analysis between LAS and traditional zoometric scales can help to determine their greater or lesser levels of resemblance.
After LAS validation, its application in the context of breeding for the most desirable zoometric patterns may enable a maximized productive objective to be obtained. Furthermore, large-scale LAS may grant access to large amounts of very valuable, readily available information for breeders. This information may enhance selection potentialities through the improvement of the selection accuracy of breeding stock or when making decisions about purchases, as relatively quick diagnoses of the quality of certain animals and their specific suitability for dairy production can be issued in the context of the breeds’ morphological traits. These methods may also be implemented at a lower time and resource cost, as assessors may progressively become acquainted with the spectrum of possible levels and thresholds, more easily identifying the value of new animals in comparison with the optimal levels described in the breed’s standard.
Thus, the present study aimed at implementing two main objectives: first, the optimization of the systematic visual LAS that is routinely applied in the Murciano-Granadina breed; second, the validation of the replicability of the results derived from the application of CAPRIGAN LAS in comparison to the actual zoometric measurements collected from the individuals in the entire Murciano-Granadina breed herdbook.
2. Materials and Methods
2.1. Statistical Assumption Testing
Historical zoometric records for the Murciano-Granadina goat breed collected until December 2019 were tested for common parametric assumptions. Kolmogórov–Smirnov and Levene tests were used to evaluate normality and homoscedasticity, respectively, using the statistical software Statistical Package for the Social Sciences (SPSS Statistics) for Windows (Version 25.0, 2017, IBM Corp., Armonk, NY, USA).
2.2. Animal Sample and Linear Appraisal Records
The complete pedigree of Murciano-Granadina goats consisted of 279,264 animals (266,793 does and 12,971 bucks) born from June 1966 to November 2019. The linear appraisal database comprised information from 41,418 individuals evaluated year-round. The records were measured in 73 farms in the South of Spain from 09/06/2010 to 18/12/2019. National and International Sanitary Certificates were officially issued for all the farms considered in the study. All farms considered were controlled and officially declared tuberculosis-free (C3), brucellosis-free (M4) (Order of 22 June 2018 and Directive 91/68/EEC) and Scrapie Controlled Risk (SCRAPIE RC) (Regulation (EC) No 999/2001 of the European Parliament and the Council). These farms also followed voluntary control plans for Caprine Contagious Agalactia (CCA) (National CCA Surveillance, Control, and Eradication Programme 2018–2020) and Caprine arthritis encephalitis (CAEV) (Order AYG/287/2019 of 28 of February of 2019). Goats were clinically examined by an official veterinarian, and animals presenting signs of illness or disease conditions were officially declared and removed from the herds; thus, they were not considered in the analyses. All farms followed permanent stabling practices, with ad libitum water, foraging and supplemental concentrate. A further description of the detailed and analytical composition of the diet provided to the animals in the study can be found in Table S1.
The sample was evaluated and filtered. As a result, 95 individuals with missing or incomplete zoometric and linear appraisal records were discarded. The final dataset comprised 41,323 records belonging to 22,727 herdbook registered primipara does, 17,111 multipara does and 1485 bucks which were retained in the statistical analysis. Average age ranges for primipara and multipara does and bucks in the sample were 1.61 ± 0.35 years, 3.96 ± 1.74 years and 2.43 ± 1.49 years (μ ± SD), respectively.
2.3. Murciano-Granadina Linear Appraisal System (LAS)
For primipara and multipara does, each animal’s registry comprises the raters’ score for the four major categories of structure and capacity, dairy structure, mammary system and legs aplomb. For bucks, young males and goats that have not yet given birth, the mammary system was not evaluated, resulting in three major categories being considered. In the case of primipara and multipara does, each record comprised information on 17 linear traits rated on a nine-point scale. As bucks were not scored for traits in the mammary system major category, only 10 traits were scored for them following the same nine-point scale. Body depth from the structure and capacity as major categories and the major categories of dairy structure and legs and feet followed the same criteria for males and females.
Each final score represents how closely the animal resembles the overall optimal dairy standard. The Murciano-Granadina LAS establishes that each major category contributes to the final score, with 25% for structure and capacity, 15% for dairy structure, 20% for legs and feet and 40% for the mammary system for primipara and multipara does (any doe which has ever begun to produce milk). In the case of bucks and young males, these percentages change to 50% for structure and capacity, 20% for dairy structure and 30% for legs and feet.
Rater’s final scores are translated into one of the six category qualifications considered by CAPRIGRAN as follows: insufficient (IN) for animals which display less than 69% of the optimal standard for Murciano-Granadina dairy goats, which translates into a final score of 69 points or less; mediocre (R) at 70% to 74% of optimal standard, which translates into a final score between 70 and 74 points; good (B) from 75% to 79% of the optimal standard, which translates into a final score from 75 to 79 points; quite good (BB) from 80% to 84% of the optimal standard, which translates into a final score from 80 to 84 points; very good (MB) from 85% to 89% of the optimal standard, which translates into a final score from 85 to 89 points; or excellent (E) when at least 90% of the optimal standard is displayed, which translates into a final score higher than 90 points. A detailed description of the scales used and the translation process from zoometric traits can be found in Sánchez Rodríguez, et al. [4], Table 1 and Figures S1–S27.

Table 1.
Detailed description of the scales used and the translation process from zoometric traits to linear appraisal scoring system (LAS) scores in Murciano-Granadina goat and bucks.
Age elements (such as the age of the doe or lactation stage) have been reported to condition dairy linear or type appraisal-related traits [10]. As a result, age elements—often recorded for does at appraisal—permit the adjustment of models for the outputs of linear or type appraisal records [11]. The Pearson product–moment correlation coefficient between the lactation phase and age in years was 0.705 (P < 0.01); thus, a certain redundancy could be presumed for the outputs of linear or type appraisal when both age elements were considered simultaneously. For this reason, the lactation phase was considered, and results for primipara and multipara goats were broken down in the present study.
2.4. Dimensionality Reduction: Linear Appraisal System Optimization
The optimization of the LAS used in Murciano-Granadina goats was performed using principal component analysis (PCA). PCA can be used to perform an efficient selection of the minimum number of zoometric traits which are able to capture the highest fraction possible of variability for a given set of traits. Birth data for all animals were provided by CAPRIGRAN. Zoometric data collection was performed using a zoometric stick, a zoometric compass and a tape measure. All measurements were recorded once by the same person to avoid inter-recorder effects. Descriptive statistics were calculated for each of the 17 zoometric variables studied, and Spearman’s correlation coefficients were computed for all possible combinations of the variables. A significant Spearman’s correlation between two variables in a pair may result when the two variables involved in the comparison are monotonically related, even if they share a nonlinear relationship [12]. The correlation matrix for the variables must contain at least two correlations of |0.30| or greater [13] in terms of the absolute value, which is the minimum magnitude for variables to be suitable for structure detection and thus for PCA to be valid.
Data for the PCA were generated from the variance–covariance matrix. The Kaiser–Meyer–Olkin (KMO) test of sampling adequacy and Bartlett’s test of sphericity were computed to establish the validity of the data set for structure detection (the KMO test determines whether the common factor model is appropriate as it measures the extent to which the original variables belong together). The KMO should be greater than 0.5 for a satisfactory factor analysis to proceed. Bartlett’s test of sphericity tests the hypothesis that a correlation matrix is an identity matrix, which would indicate that variables are unrelated and therefore unsuitable for structure detection. Small p-values (less than 0.05) of the significance level indicate that factor analysis may be useful for the analysis of data [14].
Communalities were assessed to determine which variables should be maintained or discarded from PCA. Initial communalities are indicative of the total amount of variance that certain original variables share with all other variables included in the analysis. Extraction communalities are estimates of the variability of each variable that can be accounted for by the factors in the factor solution. Small values (close to zero) are indicative of variables that do not fit well within the factor solution and thus should possibly be dropped from the analysis. Communalities after extraction should be above 0.3 [15].
The rotation of principal components was performed to transform components into a simple structure. The raw varimax criterion of the orthogonal rotation method was used for the rotation of the factor matrix. The varimax rotation aims to maximize the sum of variances of a quadratic weight. Furthermore, when varimax rotation is applied via Kaiser normalization, it corrects for the bias resulting from the fact that some factors may have high correlations with a small number of variables and zero correlations with the others.
The cumulative proportion of variance criterion was finally used to determine the number of components to extract. Cronbach’s alpha statistic was used to confirm the reliability and validity of the reduced variable set. The concept of procedure validity can be understood as the degree to which a certain scale measures the factor which it claims to measure. Cronbach’s alpha measure of validity assumes a high correlation among the elements measuring the same construct. The closer the value of alpha is to 1, the greater the internal consistency of the analyzed elements. George and Mallery [16] provided a rule of thumb for the interpretation of Cronbach alpha which establishes thresholds as follows: 0.9 is excellent, 0.8 is good, 0.7 is acceptable, 0.6 is questionable, 0.5 is poor, and less than 0.5 is unacceptable. All statistical tests referred above were performed using the statistical software SPSS Statistics for Windows, Version 25.0 [17].
PCA was used to discard variables which had a confounding nature and as a result did not significantly contribute to the fraction of explained variability but significantly increased the likelihood of type I errors, introducing bias as a result. Component loadings below |0.5| were ruled out given their confounding nature. Highly loaded variables (with component loadings equal to or over |0.5|) in the same dimension may reveal strong common underlying correlations among those variables.
2.5. Linear Regression Modelling for Zoometric Traits
After redundant variables had been identified and eliminated, Categorical Regression (CATREG) analysis was performed using the SPSS Statistics package for Windows, version 25.0, to identify the linear relationship among the zoometric traits measured. The general simple linear regression model designed followed the simple equation Zy’ = βxZ, and was as follows:
Zy’finalscore = βstaturexZstature + βchestwidthxZchestwidth+ βbodydepthxZbodydepth + βrumpwidthxZrumpwidth + βrumpanglexZrumpangle + βangulosityxZangulosity + βbonequalityxZbonequality + βanteriorinsertionxZanteriorinsertion + βrearinsertionheightxZrearinsertionheight + βmediansuspensorligamentxZmediansuspensorligament + βudderwidthxZudderwidth + βudderdepthxZudderdepth + βnippleplacementxZnippleplacement + βnipplediameterxZnipplediameter] + βrearlegsrearviewxZrearlegsrearview + βrearlegssideviewxZrearlegssideview + βmobilityxZmobility
where Zy’finalscore is the final zoometric score record for each animal; β is the standardized coefficient or population slope coefficient for each zoometric predictor (independent variables, IV) as marked by the subindex for the whole population; and Z is the specific value for that predictor for each individual, with each predictor being scored using Murciano-Granadina linear appraisal systems. Variables between brackets comprise the mammary system major category and were only scored in does as described in previous sections; thus, these variables were only included in the model for mature females.
2.6. Linear Regression Modelling Validation
The main application of linear regression is the identification of linear relationships between variables in multivariate analysis. For instance, even if correlational analysis is frequently used to validate and compare scales which measure the same construct, regression analysis is still preferred to quantify the validity of the correlational analysis of large variable sets [18,19]. Regression analysis have been proven to surpass the performance of correlational analysis between scale scores and its validity to quantify a certain construct. One of the advantages of regression analysis is that it provides a way to quantify a scale–construct association in meaningful units, which facilitates the issuance of a verdict on the validity of the relationship being tested.
Additionally, regression analysis can quantify the underlying variability accounted for by a set of estimators/predictors for a certain trait in a population, while it simultaneously prevents confounding effects from distorting the validity of a judgment. This in turn increases the repeatability of the results obtained [20].
Thus, we performed CATREG analyses using the aforementioned general regression model as a reference. The first CATREG analysis aimed to compute the ability to describe the variability in the population regarding the final scores for zoometric traits, which were considered as a dependent variable (DV), and considered the actual scores for the complete set of 17 measurements directly taken from the Murciano-Granadina primipara and multipara does and bucks, which were taken as the independent variable (IV) in the model. Then, we performed a second regression analysis to evaluate the variability in the population for the final scores of zoometric traits, but instead using the 17 LAS variables (on a nine-point scale) routinely evaluated in Murciano-Granadina goats. Then, the comparison of the determination power or prediction efficiency of both regression models was used to validate the performance of CAPRIGRAN LAS. Regression analyses were separately performed for primipara and multipara does and bucks, as traits comprising the mammary system were excluded from the appraisals of males.
Comparative regression models for validity testing contrast with the predictive regression models described in the previous section for primipara and multipara does and bucks as these comprise combinations of the 17 traits scored through LAS without including those identified as redundant.
For model validity comparison, the variables of body depth, angulosity, bone quality, rear legs rear view and side view and mobility were excluded from does and bucks’ comparative regression models. This decision was made based on the fact that, even during regular zoometric assessment, these zoometric parameters may rely on descriptive hedonic measurements rather than providing actual direct measurements for a certain zoometric trait; thus, no comparison could be performed as they were always scored using a specific LAS. The designed models can be seen in Table S2.
As the variables in our study comprised levels categorized following different criteria, we used standardized coefficients to interpret and compare their effects on our DV, as these are not unit-dependent. The stepwise linear regression model applied to the transformed variables resulted in the standardized and unstandardized coefficients being equal. Thus, unstandardized coefficients could be interpreted. As a rule, we assumed that the standardized results reported used full standardization (both DV and IVs were converted to standard scores) and that the Z formula was used for standardization. The general standardized regression equation followed the following model: Z’y = β1ZX1 + β2ZX2 +…, where Z’y is the predicted value of Y in Z scores, β1 represents the standardized partial regression coefficient for X1, β2 represents the standardized partial regression coefficient for X2 and ZX1 and ZX2 are the Z score values for the variables X1 and X2, respectively. The interception point will always equal 0.00 when standardization is based upon Z scores and both DV and IVs are standardized. Once the regression equation is standardized, the partial effect of a given X upon Y—or of Zx upon Zy—becomes somewhat easier to interpret because the interpretation is in standard deviation units for all estimators/predictors. Following the common notation models, the regression model for each predictor variable was Yn = βnZn + ɛ, where Yn is the n variable predictor, βn is the regression coefficient for the n variable obtained in the n main component, Zn is the score obtained in the field for n variable and ɛ represents the estimation error.
Likewise, to estimate the mean square error of prediction (MSEP) of each categorical regression model, we used the bootstrap 0.632 estimates as some authors have suggested it to be preferable given that it provides the least unbiased estimation of the error of prediction in conditions of a large sample size in comparison to other commonly used cross-validation methods [21].
2.7. Ethical Approval
The study followed the premises described in the Declaration of Helsinki. The Spanish Ministry of Economy and Competitivity through the Royal Decree-Law 53/2013 and its credited entity the Ethics Committee of Animal Experimentation from the University of Córdoba permitted the application of the protocols present in this study as cited in the fifth section of its second article, as the animals assessed were used for credited zootechnical use. This national decree follows the European Union Directive 2010/63/UE from 22/09/2010. Furthermore, the present study works with records rather than live animals directly, and these records were obtained after minimal handling; thus, no special permission was necessary.
3. Results
3.1. Statistical Assumption Testing, Zoometric and Linear Appraisal Records
Common parametric assumptions were violated; thus, a nonparametric approach was suggested. A summary of the descriptive statistics for zoometric traits derived from linear appraisal and zoometric assessment in primipara and multipara does and bucks is reported in Tables S3–S5, respectively.
3.2. Dimensionality Reduction: Linear Appraisal System Optimization
Spearman’s correlation coefficients between almost all pairs of linear appraisal-derived zoometric traits in Murciano-Granadina primipara and multipara does and bucks were over |0.3|, as shown in Tables S6–S8, which supported the use of principal components analysis. The Kaiser–Meyer–Olkin measures of sampling adequacy for the principal component analysis of linear appraisal variables were 0.791, 0.712 and 0.767 in Murciano-Granadina bucks, primipara and multipara does, respectively, and Bartlett’s test of sphericity reported a highly statistically significant value of 0.001 for the three animal categories; thus, the correlation matrix was applicable and PCA results were valid. All communalities were over 0.379, 0.444 and 0.457 for bucks, primipara and multipara does, respectively; thus, no variable was omitted from the PCA. Table 2 and Table 3 report linear appraisal system varimax with Kaiser normalization rotated component loadings, eigenvalues and percentages of variance explained for Murciano-Granadina primipara and multipara does and bucks, respectively. Figure 1 represents eigenvalues across dimensions for primipara and multipara does and bucks, respectively.
Table 2.
LAS varimax with Kaiser normalization rotated component loadings, eigenvalues and percentages of variance explained for Murciano-Granadina primipara and multipara does.
Table 3.
LAS varimax with Kaiser normalization rotated component loadings, eigenvalues and percentage of variance explained for Murciano-Granadina bucks.
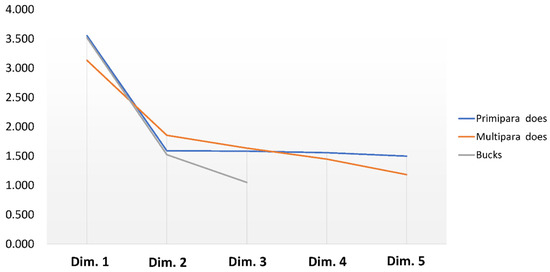
Figure 1.
Representation of principal component analysis (PCA) eigenvalues for dimensions 1 to 5 (Dim. 1–5) for LAS scores in Murciano-Granadina primipara and multipara does and dimensions 1 to 3 in bucks.
3.3. Linear Regression Modelling for Zoometric Traits
Apart from the reasons reported above, categorical linear regression (CATREG) models for primipara and multipara does did not include the variable of rump angle as it had been shown to redundant in the PCA comprising LAS data (with component loadings < |0.5| across dimensions). For this reason, it was also excluded from the zoometric scale regression comparative model. Similarly, for adult and young males, the linear regression model did not include the variables included in the mammary system major category (anterior insertion, rear insertion height, median suspensor ligament, udder width, udder depth, nipple placement/insertion and nipple diameter) as these were not measured in males. Table 4, Table 5 and Table 6 report the results of β-standardized coefficients for each variable for the two linear regression models comprising LAS traits and Murciano-Granadina zoometric traditional assessment for primipara and multipara does and bucks, respectively. Each Z score was replaced by an observation (either LAS or traditional zoometric measurements) for each particular variable in each of the respective equations in Table S2.
Table 4.
β-standardized coefficients to replace the Z score in each of the respective equations in Supplementary Table S5 and a 0.632 bootstrap mean squared error of prediction (MSEP) for the comparison of model validity between the two linear regression models using linear appraisal traits as opposed to Murciano-Granadina zoometric traditional assessment in does.
Table 5.
β-standardized coefficients to replace the Z score in each of the respective equations in Supplementary Table S5 and a 0.632 bootstrap mean squared error of prediction (MSEP) for the comparison of model validity between the two linear regression models using linear appraisal traits as opposed to Murciano-Granadina zoometric traditional assessment in does.
Table 6.
β-standardized coefficients to replace the Z score in each of the respective equations in Supplementary Table S5 and a 0.632 bootstrap mean squared error of prediction (MSEP) for the comparison of model validity between the two linear regression models using linear appraisal traits as opposed to Murciano-Granadina zoometric traditional assessment in bucks.
3.4. Categorical Linear Regression (CATREG) Modelling Validation
Table 4, Table 5 and Table 6 report a summary of the parameters computed to compare the CATREG models comprising Murciano-Granadina LAS scores to those comprising zoometric traditional assessment variables. Concretely, Table 4 and Table 5 report a 0.632 bootstrap mean squared error of prediction (MSEP) to test for model cross validation in bucks and does, respectively. Table 6 shows a summary of the determination coefficients (R2 and Adj. R2) to compare the explanatory variability. R2 values were 0.779, 0.660 and 0.734 for primipara does, multipara does and bucks, respectively, when computed through the model using Murciano-Granadina zoometric traditional assessment.
Values of R2 slightly (0.859) to moderately/highly increased (0.883 and 0.813) for bucks, primipara and multipara does, respectively, for models which used LAS scores (Table 7). All models reported a highly statistically significant ability to predict the outcome of the variables measured when compared to the raw models exclusively consisting of the interception but excluding any predictor, as suggested by the values of MSPE and P < 0.001 for the ANOVA for regression analysis.
Table 7.
β-standardized coefficients to replace the Z score in each of the respective equations in Supplementary Table S5 and a 0.632 bootstrap mean squared error of prediction (MSEP) for the comparison of model validity between the two linear regression models using linear appraisal traits as opposed to Murciano-Granadina zoometric traditional assessment in does and bucks.
Following the premises of information theory, several methods have been presented for the comparison of models with regard to their ability to explain or capture the variability observed in the data set being studied (Akaike information criterion (AIC) and corrected Akaike information criterion (AICc)) and the predictive potential (Bayesian information criterion (BIC)) of the model designed for the data being modeled. Additionally, the mean square residual or error (MSE) measures how close a regression line is to a set of points; that is, how well a certain model fits the data being observed. The minimum mean-square residual or error (MMSE) was calculated as shown in Asherson, et al. [22]:
where N is the number of animals and MSE is the mean square residual or error.
MMSE = (1/N) × (MSE)
The Akaike information criterion (AIC), Corrected Akaike information criterion (AICc) and Bayesian information criterion (BIC), were calculated as suggested in [23] as follows:
where RSS is the residual sum of squares, N is the number of data points and K is the number of IVs of the model.
AIC = Nln(RSS/N) + 2K
With data sets without a large number of data points (N) or for models containing several parameters, the corrected AICc may be more accurate; however, similar results of AIC and AICc are likely to be reported if a high number of observations are studied.
where K is the number of parameters and N is the number of observations.
AICc = AIC + 2K(K + 1)/Ν(Ν + 1)
The Bayesian information criterion (BIC; [24]) is a model order selection criterion which penalizes more complicated models for the inclusion of additional parameters.
BIC = N × N ln(RSS/N) + K × ln(N)
A small numerical value of MSE, MMSE, AIC, AICc and BIC indicates a better fit when comparing models. Table 8 shows a summary of the measures for model fit using the mean square residual or error and minimum square residual or error (MSE and MMSE), explanatory variability power using the Akaike information criterion (AIC) and corrected Akaike information criterion (AICc) and predictive power using the Bayesian information criterion for the two linear regression models comprising linear appraisal traits as opposed to Murciano-Granadina zoometric traditional assessment in does and bucks.
Table 8.
Summary of the measures for model fit using the mean square residual or error and minimum square residual or error (MSE and MMSE), explanatory variability power using the Akaike information criterion (AIC) and corrected Akaike information criterion (AICc) and predictive power using the Bayesian information criterion for the two linear regression models comprising linear appraisal traits as opposed to Murciano-Granadina zoometric traditional assessment in does and bucks.
4. Discussion
The present study aimed to compare, validate and optimize the linear appraisal methodological approaches proposed by Martinez et al. (2010) for does and bucks in the Murciano-Granadina goat breed to determine the quality of the LAS, which is routinely applied in opposition to traditional zoometric analysis, for dairy-related morphological traits. The combination of principal components and regression analyses has been reported to yield good estimates for the coefficients of explanatory variables aiming to measure the same DV. Reddy and Claridge [25] suggested that regression analysis and principal component analysis (PCA) can be used to determine reduced numbers of explanatory variables to explain the variability described by a certain DV.
With regard to the optimization of CAPRIGRAN LAS, principal components analysis reported quite conservative results, as only the rump angle was omitted from the variables considered for primipara and multipara does and bucks. Additionally, the optimization of the models reported a substantial internal consistency [26]; i.e., the optimized linear appraisal scales used showed good reliability (with values over 0.9). Thus, there was a significant validated ability to explain internal variability, as suggested by the Cronbach’s alpha values.
The Cronbach’s alpha values were slightly higher for primipara and multipara does than for bucks, with the set of variables evaluated for does reporting a Cronbach’s alpha value of 0.956 and 0.949 as opposed to the value of 0.936 reported for bucks, which suggested a slightly greater internal consistency in the case of females, which could be attributed to the dairy-related nature of the zoometric traits used in this study. However, the variability that each of the models was able to explain was moderately higher in males than in females, with values of 60.932% for bucks as opposed to values of 57.558 and 54.445% for primipara and multipara does. This could be ascribed to the slightly greater variability found in bucks, which was suggested by the descriptive statistics shown in Tables S3–S5, respectively.
The computation of Cronbach’s alpha was used as it is based on the comparison of the reliability of a test relative to other tests with the same number of items and measuring the same construct of interest [27]; thus, its application in the validation of linear appraisal system scales allowed us to report solid and objective results regarding the reliability of the translation from zoometric measurements to LAS scores.
PCA identifies the variables that explain the highest fraction of variability in a dataset, and then it uses this information to create a dataset with a reduced number of variables with minimal loss of descriptive power. Bearing this in mind, the greater percentage of variability explained in the case of bucks may be ascribed to the greater variability found in the population of males, as suggested by the descriptive statistics in Tables S3–S5.
One of the advantages that datasets with a reduced number of variables present compared to more complex datasets is that these should have less noise in the data, thus requiring less processing power, which in turn results in optimized variable sets that can be considered to explain or estimate a joint outcome; for example, in the present paper, the dairy-related morphological value of a certain animal. Still, the features of the most highly variable predictors may not necessarily be the best predictors of the variability in the whole dataset. Concretely, the most relevant predictors will bethose with a higher influence on the dimensions identified by PCA and thus with a larger absolute component loading (shown in Table 2 and Table 3 for primipara and multipara does and bucks, respectively).
According to Wang and Wu [28], in PCA, the differences in the variability of the features considered may differ as a result of the differences in their related eigenvalues. However, this difference is not equivalent to that of the importance of the different components to the PCA pattern classification described. Indeed, these authors suggest that the contribution of each component is determined by the specific construct itself (the dairy-related morphological value of each animal).
In this context, some elements may address common features of all the dimensions that are included in the analyses, while others may be less significant in the process of classification across dimensions. In contrast, other elements or features may correspond to the characteristics of individual dimensions and thus may present a greater significance in PCAs. Because of the differences in variability across the different elements, it could be stated that the largest variabilities shown in Tables S3–S5 may be caused mainly by the differences between different dimensions. Such differences are larger in bucks than in does; thus, a rather significant contribution could be expected in the process of the classification of variables into principal components (dimensions), which may translate into a higher ability to capture the variability in the dataset.
Our results suggest the existence of five reorganized major categories (principal components/ dimensions). In the case of primipara does (Table 2), the first category includes the variables of stature (height to withers), chest width, rump width, angulosity, bone quality and rear insertion height, as suggested by values of component loadings over |0.5|. In this case, the results suggest the restructuration of the existing major categories of structure and capacity, dairy structure and mammary system. Although chest width, rump width and angulosity kept their relative importance within the first dimension of PCA for both primipara and multipara does, udder width and body depth became relevant for multipara does to the detriment of stature, bone quality and rear insertion height.
Considering the variables classified in the first dimension for both primipara and multipara does, the newly statistically suggested major category could be called “structural dairy-related capacity”. The relationship between morphological characteristics and dairy production-related traits reported by our results has been widely described in the literature. The relationship between indirectly dairy-related morphological variables and dairy-related morphological ones may be based on the fact that Murciano-Granadina goats could be ascribed to a dairy morphological trunk, as suggested by Jordana, et al. [29]. From a genetic–morphological perspective, the inclusion of the Murciano-Granadina breed within a dairy purpose-linked morphological pattern suggests that the morphological characteristics which may be empirically related to milk production may be relevant to define the purpose of certain breeds, but may also address the fact that other zoometric features somehow adapt, through selection practices, to the maximization of the achievement of this purpose.
The second dimension in primipara does clusters together variables in the fourth dimension for multipara does. These dimensions comprised the variables of body depth, rear legs side view and mobility, which suggests a relationship between rump conformation and rear legs with mobility quality. Additionally, the variable of rump angle was clustered in the fourth dimension of multipara does as well. In view of our results, we propose the category of the “mobility and propulsion system” for the identified principal component/dimension. Although no reference has been reported for the connection of these measurements for goats or large ruminants, a close connection between limb mobility and the back was reported by Dyce, et al. [30], due to the continuity of some soft tissue structures; for instance, the common aponeurosis of the longissimus dorsi muscle given its implication with the development of back motion, and the middle gluteal muscle given its instrumental role in the mechanisms of propulsion. Additionally, Jeffcott [31] suggested that the protraction of the forelimbs extends the back, as does the retraction of the hindlimbs; thus, forelimb retraction and hindlimb protraction may have opposite effects, which accounts for the statistical exclusion of forelimb-related variables from this dimension. Although the relationship of movements with goat milk yield and quality has not been directly approached in the literature, Di Grigoli, et al. [32] suggested goats that goats possess a great capacity of movement which is improved by a lower milk yield but compensated by a better milk quality and a reduction in manpower. Both aspects may represent interesting research lines given the economic importance derived from increasing milk quality at a lower production cost.
The fourth and fifth dimensions for primipara does and third and fifth dimensions for multipara does comprised anterior insertion, rear insertion height, median suspensor ligament, udder width, udder depth, nipple placement/insertion and nipple diameter. Thus, for primipara does, median suspensor ligament, udder depth, nipple placement/insertion and nipple diameter were clustered together in the fourth dimension, while anterior insertion was taken separately in the fifth dimension. This suggests the denomination of the fourth dimension as “udder stability quality and nipple configuration” and the fifth dimension as “anterior insertion of the udder” in primipara does. The fourth and fifth dimensions in primipara does and third and fifth dimensions in multipara does suggested the evolution of the importance of the suspensory system of the udder as the lactation of certain does progress over time.
Contextually, for multipara does, variables within the third and fifth dimensions are clustered in such a way that the third dimension could be defined as the major category of “udder stability quality” (anterior insertion, median suspensor ligament and udder depth). This could be supported by the relationship that has been identified by our results and those of other authors [33], who suggested that the variables comprising this dimension should be treated equally with respect to their importance and the increase in the coefficients by which they should be multiplied to improve dairy-related morphological selection indexes aimed at the maximization of dairy production in Ayrshire cattle.
Then, the fifth and last dimension in multipara does comprised the variables of nipple placement and nipple diameter; thus, we decided to name this major category “nipple configuration”. Studies in regards to the relationship between nipple characteristics and milk yield or quality-related traits are scarce. Among the nipple characteristics, the spacing between the nipples has been suggested to affect the peak lactation of goat milk production [34], and nipple length may present a positive effect on goat milk production, as suggested by El-Gendy, et al. [35]. This was supported by the results of other authors who reported that values of nipple morphological parameters such as length, and the circumference of nipples may have a positive correlation to goat milk production [36], which may support our results, according to which nipple diameter may be a relevant factor to explain population variability with regard to milk production-related traits.
Despite nipple attributes being directly related to milk quality in goats, as previously suggested, studies have focused rather on the relationship between the technological features of the udder in terms of its adaptability to milking machines, and the relationship of nipple position with dairy production-related traits is infrequent. In this context, the relationship between udder conformation traits and milk composition—and as a consequence, its effects on milk quality—was supported by the findings of the study by Wagay, et al. [37]. These authors suggested that animals presenting thinner teats and less fore-udder depth will produce milk with higher fat and solids-not-fat (SNF) percentages, while animals with teats held high from the ground and deeper and wider udders will produce healthy milk with a lower somatic cell count, which may imply a potential relationship between nipple attributes—especially, nipple diameter and milk quality—in cattle. In this context, for goats, the study by Eyduran, et al. [38] reported a significant relationship between teat angle (which could indirectly measure nipple position) and lactation duration or milk yield, which may support our results.
The third dimension of primipara does and the second dimension of multipara does comprise the variable of rear legs rear view. However, for primipara does, rear legs rear view is clustered together with the variable of udder width. Given this finding, the dimension could be designated as “udder size and mobility permission”. The importance of the mobility of milk quality has already been suggested in the paragraph above; however, additionally, the relationship between udder size and rear limbs has been addressed in the literature by authors such as Bölling and Pollott [39], who suggested that more bulgy udders of mature animals may form an obstacle for hindlimbs and force animals to describe a circle to circumvent the udder [40,41], which may result in a splay-legged walk, uneven footwear and could lead to lameness [42], with consequent detrimental effects on mobility and a potential effect on the reduction of milk quality. By contrast, for multipara does (second dimension), udder width loses its relevance in favor of stature (height to the withers), bone quality and rear insertion height. Rear insertion height is the distance between the vulva and the noble secretor tissue. This suggests that, as lactation phases progress, the udder starts to hang lower from its insertion, which may be counteracted by the stature and bone quality of the animal. This was suggested given the significant component loadings for these variables in the second dimension for multipara does, who reported the opposite sign; thus, a relationship to the first dimension in primipara does was shown, by which stature (height to the withers) and bone quality were clustered together. This may suggest that “structural dairy-related capacity” in multipara does is not affected by the conformation of the rump and angulosity of the animal, as occurs in primipara does. Additionally, stature may play a stronger role in structural dairy-related capacity when does are in the first phase of lactation, while rear insertion height and bone quality may be decisive as lactation phases progress. Thyroid hormone responsive (THRSP) gene has been reported to encode for small acidic nuclear protein, which is associated with growth, and to promote the synthesis of medium-chain fatty acids in goat mammary epithelial cells [43,44], which may account for the clustering patterns found in our study.
In the case of bucks, only rump angle was discarded given its lack of representation in the explanation of milk yield and milk quality-related traits. In the case of males, this lack of representation may be ascribed to the lack of milk production capacity, which reduces the implication and relevance of this variable. Three principal components/dimensions were identified; thus, only three major categories were determined, which are listed as follows.
The first dimension comprised the variables of stature (height to withers), chest width, body depth, rump width, and angulosity, which may match the observations previously been described for does. However, in this case, we opted to term this dimension “body structure”. After comparing the results for males and females, we observed moderate repercussions of body depth in males and a lack of repercussions in females. This could agree with the results found by Waheed, et al. [45], who reported body depth at heart to be moderately genetically but slightly phenotypically correlated to milk productive traits such as lactation milk yield or lactation length (0.42 ± 0.09 and 0.28 ± 0.09 genetic correlations with milk yield and lactation length, respectively, and 0.29 ± 0.07 and 0.22 ± 0.07 phenotypic correlations with milk yield and lactation length, respectively). The same authors reported that these correlations increased when body depth was measured at the belly (with genetic correlations of 0.82 ± 0.09 and 0.28 ± 0.11 with milk yield and lactation length, respectively, and phenotypic correlations of 0.43 ± 0.07 with milk yield and 0.29 ± 0.08 lactation length, respectively). As we can observe from the values reported by these authors, the standard errors of prediction were high in comparison to the magnitude of the correlations detected, which may account for the variability with regard to these traits. This moderate effect is supported by the component loading of 0.611 for males and can be inferred as it is slightly below the limits of |0.5| for does in the third dimension, which we have previously designated as the “mobility and propulsion system”. The moderate (0.02; i.e., below the threshold for component loadings) relationship between body depth (the distance between the top of the spine and the bottom of the barrel at the last rib, as described by Akpa, et al. [46]) with the rest of variables within the “mobility and propulsion system” for does may be ascribed to the involvement of back muscles in the development of hindlimb mobility and propulsion, which has already been mentioned in the present paper and suggested by Dyce, et al. [30]. Contrastingly, this increase in the relevance of body depth in males, and its inclusion within the “body structure” dimension, rather than its relationship with the movement quality and propulsion system could be derived from the residual destination of kids for meat production, which may have indirectly resulted in the selection of this trait in male kids.
The second dimension comprised the variables of bone quality and rear legs rear view, while the third dimension comprised the variables of rear legs side view and mobility. These results match our findings for does except for bone quality, which in the case of does was clustered in “structural dairy-related capacity”, while in males it appeared to be related to “bone structure and aplomb”. Such a difference between the ascription of bone quality to markedly different dimensions when males and females are compared may derive from the changes which occur in bone quality across lactational stages in does [47]. However, for males, according to Guo, et al. [48], a potential explanation of the relationship between these two variables may stem from the single nucleotide polymorphism (SNP) effects that have been reported for the lactoferrin gene on milk production traits. For instance, the same authors reported a significant effect on bone growth and the content of milk protein. Furthermore, bovine or human lactoferrin has been suggested to influence skeletal tissue as an anabolic factor and a potent osteoblast survival factor [49], as it may stimulate the proliferation of bone formation promotion cells, osteoblasts and cartilage cells at physiological concentrations in vitro. The third dimension in bucks comprised the same variables as in does, except for rump angle, which could not be attributed to any dimension. For these reasons, we decided to name this dimension or major category as “mobility” for the reasons that have been already reported for does.
Categorical regression analysis and 0.632 bootstrap estimates confirmed that the models comprising LAS scores for all the variables studied across major areas for does and males were more capable of capturing and explaining the variability found in the population as suggested by the R2 values in the range of 80% and adjusted values of R2 in the range of 0.7 in opposition to those reported by the model comprising direct zoometric measurements expressed in cm and degrees (Table 7). All models were statistically significant and presented a negligible squared error of prediction, which suggested the high reliability of the linear regression models proposed.
When model fit (scored by MSE), variability explanation power (scored by AIC and AICc) and predictive power (scored by BIC) of linear regression models for Murciano-Granadina LAS scores and zoometric traditional assessment were compared in does and bucks, LAS scores always reported a better fit, a better ability to capture the variability in the data sets and better predictive potential as suggested by the lower values for each respective parameter (Table 8). Bucks reported lower estimates for the aforementioned parameters; however, the differences in the number of variables comprised by the two models and the nature of the variables considered may make it necessary to carefully analyze these estimates when the objective is to make a direct comparison of models between genders. This drawback can be overcome as, when the coefficients used to build regression models are standardized, the intercept obtains a value of 0.00 from the compensation of standard deviation after the standardization process. Thus, MSE, AIC, AICc, and BIC can be directly used to compare each model with one exclusively comprising the interception on each case, without the need to include the same variables, for these variables to be scored using the same methods or even for these variables to be scored using the same measurement units, as in our study, in which an ordinal LAS scale is compared to a numeric zoometric scale with variables expressed in centimeters and degrees.
5. Conclusions
Principal component analyses determined that the linear scoring system was solid and internally consistent for the measurement and capture of the variability of zoometric parameters related to dairy performance. However, the resulting models were quite conservative, as only one variable from the whole zoometric panel was discarded for bucks and does. The outputs of linear regression demonstrate that an optimal fit, variability explanatory power and predictive potential can be achieved by modeling a reduced number of variables from the entire linear appraisal scoring system and traditional zoometric evaluation for Murciano-Granadina does and bucks. Conclusively, our results suggest that the combination of PCA and categorical regression (CATREG) may be successful for the optimization and validation of the reduction of zoometric evaluation procedures and linear appraisal scoring systems such that they are not only able to describe the status of a certain population but can also be used to predict the future evolution of parameters based on their linear correlations.
Supplementary Materials
The following are available online at https://www.mdpi.com/2076-3417/10/16/5502/s1, Figure S1: Graphical depictions of the scale for stature in Murciano-Granadina does for dairy purpose-related zoometric assessment; Figure S2: Graphical depictions of the scale for chest width in Murciano-Granadina does for dairy purpose-related zoometric assessment; Figure S3: Graphical depictions of the scale for body depth in Murciano-Granadina does for dairy purpose-related zoometric assessment; Figure S4: Graphical depictions of the scale for rump width in Murciano-Granadina does for dairy purpose-related zoometric assessment; Figure S5: Graphical depictions of the scale for rump angle in Murciano-Granadina does for dairy purpose-related zoometric assessment; Figure S6: Graphical depictions of the scale for angulosity in Murciano-Granadina does for dairy purpose-related zoometric assessment; Figure S7: Graphical depictions of the scale for bone quality in Murciano-Granadina does for dairy purpose-related zoometric assessment; Figure S8: Graphical depictions of the scale for anterior insertion in Murciano-Granadina does for dairy purpose-related zoometric assessment; Figure S9: Graphical depictions of the scale for rear insertion height in Murciano-Granadina does for dairy purpose-related zoometric assessment; Figure S10: Graphical depictions of the scale for median suspensor ligament in Murciano-Granadina does for dairy purpose-related zoometric assessment; Figure S11: Graphical depictions of the scale for udder width in Murciano-Granadina does for dairy purpose-related zoometric assessment; Figure S12: Graphical depictions of the scale for udder width in Murciano-Granadina does for dairy purpose-related zoometric assessment; Figure S13: Graphical depictions of the scale for nipple placement in Murciano-Granadina does for dairy purpose-related zoometric assessment; Figure S14: Graphical depictions of the scale for nipple diameter in Murciano-Granadina does for dairy purpose-related zoometric assessment; Figure S15: Graphical depictions of the scale for rear legs, rear view in Murciano-Granadina does for dairy purpose-related zoometric assessment; Figure S16: Graphical depictions of the scale for rear legs, side view in Murciano-Granadina does for dairy purpose-related zoometric assessment; Figure S17: Graphical depictions of the scale for mobility in Murciano-Granadina does for dairy purpose-related zoometric assessment; Figure S18: Graphical depictions of the scale for stature in Murciano-Granadina bucks for dairy purpose-related zoometric assessment; Figure S19: Graphical depictions of the scale for chest width in Murciano-Granadina bucks for dairy purpose-related zoometric assessment; Figure S20: Graphical depictions of the scale for body depth in Murciano-Granadina bucks for dairy purpose-related zoometric assessment; Figure S21: Graphical depictions of the scale for rump width in Murciano-Granadina bucks for dairy purpose-related zoometric assessment; Figure S22: Graphical depictions of the scale for rump angle in Murciano-Granadina bucks for dairy purpose-related zoometric assessment. Figure S23: Graphical depictions of the scale for angulosity in Murciano-Granadina bucks for dairy purpose-related zoometric assessment; Figure S24: Graphical depictions of the scale for bone quality in Murciano-Granadina bucks for dairy purpose-related zoometric assessment; Figure S25: Graphical depictions of the scale for rear legs, rear view in Murciano-Granadina bucks for dairy purpose-related zoometric assessment; Figure S26: Graphical depictions of the scale for rear legs, side view in Murciano-Granadina bucks for dairy purpose-related zoometric assessment; Figure S27: Graphical depictions of the scale for mobility in Murciano-Granadina bucks for dairy purpose-related zoometric assessment; Table S1. Detailed and analytical composition of the diet provided to the animals; Table S2. Summary of descriptive statistics for zoometric traits in Murciano-Granadina primipara does derived from linear appraisal and zoometric assessment; Table S3. Summary of descriptive statistics for zoometric traits in Murciano-Granadina multipara does derived from linear appraisal and zoometric assessment; Table S4. Summary of descriptive statistics for zoometric traits in Murciano-Granadina bucks derived from linear appraisal and zoometric assessment; Table S5. Spearman’s correlation coefficients for linear appraisal-derived zoometric traits in Murciano-Granadina primipara does; Table S6. Spearman’s correlation coefficients for linear appraisal-derived zoometric traits in Murciano-Granadina multipara does; Table S7. Spearman’s correlation coefficients for linear appraisal-derived zoometric traits in Murciano-Granadina bucks; Table S8. Simplification process of categorical linear regression (CATREG) models for does and bucks from the general description to a reduced dimensionality after principal components analysis (PCA) and development of linear comparative models to determine the validity of linear appraisal traits as opposed to Murciano-Granadina zoometric traditional assessment.
Author Contributions
Conceptualization, F.J.N.G. and J.V.D.B.; Data curation, J.M.L.J., F.J.N.G., C.I.P. and C.I.P.; Formal analysis, J.M.L.J., F.J.N.G. and C.I.P.; Funding acquisition, J.V.D.B.; Investigation, J.F.Á. and F.J.N.G.; Methodology, F.J.N.G., C.I.P. and J.V.D.B.; Project administration, J.V.D.B.; Resources, J.F.Á. and J.V.D.B.; Software, J.M.L.J. and F.J.N.G.; Supervision, F.J.N.G. and J.V.D.B.; Validation, J.V.D.B.; Writing—original draft, J.F.Á., F.J.N.G. and J.V.D.B.; Writing—review & editing, J.M.L.J., F.J.N.G. and J.V.D.B. All authors have read and agreed to the published version of the manuscript.
Funding
This research did not receive any specific grant from funding agencies in the public, commercial or not-for-profit sectors.
Acknowledgments
This work would not have been possible without the support and assistance of the National Association of Breeders of the Murciano-Granadina Goat Breed, Fuente Vaqueros (Spain) and the PAIDI AGR 218 research group.
Conflicts of Interest
The authors declare no conflict of interest.
References
- Martinez, B.; Vicente, C.; Picchioni, M.; Sanchez, M.; Gómez, E.; Peris, C. Integration of the linear morphological appraisal system in the dairy goat improvement genetic program of Murciano-Granadina breed. In Proceedings of the XXXV Congreso de la Sociedad Española de Ovinotecnia y Caprinotecnia (SEOC), Valladolid, España, 22–24 September 2010; pp. 470–474. [Google Scholar]
- Association, A.D.G. Recent Goat Type Appraisal Data (Number of Appraisals by Year). Available online: http://adga.org/36856-2/ (accessed on 26 January 2020).
- Delgado, J.V.; Landi, V.; Barba, C.J.; Fernández, J.; Gómez, M.M.; Camacho, M.E.; Martínez, M.A.; Navas, F.J.; León, J.M. Murciano-Granadina goat: A Spanish local breed ready for the challenges of the twenty-first century. In Sustainable Goat Production in Adverse Environments: Volume II; Springer: Cham, Switzerland, 2017; pp. 205–219. [Google Scholar]
- Sánchez Rodríguez, M.; Cárdenas Baena, J.M.; Blanco del Campo, G. Rasgos descriptivos lineales. In Valoración Morfológica del Ganado Caprino Lechero; Cabrandalucía, F., Ed.; Servet Diseño y Comunicación: Zaragoza, Spain, 2012. [Google Scholar]
- Asociación Nacional de Criadores de Caprino de Raza Murciano-Granadina. Calificación Morfológica Lineal. Available online: http://www.caprigran.com/ (accessed on 26 January 2020).
- Vieira, A.; Brandão, S.; Monteiro, A.; Ajuda, I.; Stilwell, G. Development and validation of a visual body condition scoring system for dairy goats with picture-based training. J. Dairy Sci. 2015, 98, 6597–6608. [Google Scholar] [CrossRef]
- Anzuino, K.; Bell, N.; Bazeley, K.; Nicol, C. Assessment of welfare on 24 commercial UK dairy goat farms based on direct observations. Vet. Rec. 2010, 167, 774–780. [Google Scholar] [CrossRef] [PubMed]
- Pares-Casanova, P.M.; Sinfreu, I.; Villalba, D. Application of varimax rotated principal component analysis in quantifying some zoometrical traits of a relict cow. Korean J. Vet. Res. 2013, 53, 7–10. [Google Scholar] [CrossRef]
- Vincent, S.; Araku, J.; Ayongu, F.; Chia, S.; Momoh, O.; Yakubu, A. Redundancy Elimination from Morpho-Stuctures of Nigerian Uda Rams Using Principal Component Analysis. J. Anim. Prod. Adv. 2014, 14, 520–526. [Google Scholar] [CrossRef]
- Manfredi, E.; Piacere, A.; Lahaye, P.; Ducrocq, V. Genetic parameters of type appraisal in Saanen and Alpine goats. Livest. Prod. Sci. 2001, 70, 183–189. [Google Scholar] [CrossRef]
- Wiggans, G.R.; Hubbard, S.M. Genetic Evaluation of Yield and Type Traits of Dairy Goats in the United States. J. Dairy Sci. 2001, 84, E69–E73. [Google Scholar] [CrossRef]
- Bishara, A.J.; Hittner, J.B. Testing the significance of a correlation with nonnormal data: Comparison of Pearson, Spearman, transformation, and resampling approaches. Psychol. Methods 2012, 17, 399. [Google Scholar] [CrossRef]
- Walde, J. Principal Components Analysis (PCA). In Advanced Statistics; Universität Innsbruck: Innsbruck, Austria, 2020. [Google Scholar]
- IBM Knowledge Center. KMO and Bartlett’s Test; IBM Corp: Armonk, NY, USA, 2019. [Google Scholar]
- Field, A. Discovering Statistics Using IBM SPSS Statistics, 3rd ed.; Sage: Thousand Oaks, CA, USA, 2013. [Google Scholar]
- George, D.; Mallery, M. Using SPSS for Windows Step by Step: A Simple Guide and Reference; Allyn & Bacon, Inc.: Boston, MA, USA, 2003. [Google Scholar]
- IBM Corp. IBM SPSS Statistics for Windows, 25.0; IBM Corp: Armonk, NY, USA, 2017. [Google Scholar]
- Hébert, J.R.; Miller, D.R. The inappropriateness of conventional use of the correlation coefficient in assessing validity and reliability of dietary assessment methods. Eur. J. Epidemiol. 1991, 7, 339–343. [Google Scholar] [CrossRef]
- Bland, J.; Altman, D. A note on the use of the intraclass correlation coefficient in the evaluation of agreement between two methods of measurement. Comput. Biol. Med. 1990, 20, 337–340. [Google Scholar] [CrossRef]
- Boateng, G.O.; Neilands, T.B.; Frongillo, E.A.; Melgar-Quiñonez, H.R.; Young, S.L. Best Practices for Developing and Validating Scales for Health, Social, and Behavioral Research: A Primer. Front. Public Health 2018, 6, 149. [Google Scholar] [CrossRef]
- Mevik, B.H.; Cederkvist, H.R. Mean squared error of prediction (MSEP) estimates for principal component regression (PCR) and partial least squares regression (PLSR). J. Chemom. 2004, 18, 422–429. [Google Scholar] [CrossRef]
- Asherson, R.; Walker, S.; Jara, L.J. Endocrine Manifestations of Systemic Autoimmune Diseases; Elsevier: Amsterdam, The Netehrlands, 2008. [Google Scholar]
- Karangeli, M.; Abas, Z.; Koutroumanidis, T.; Malesios, C.; Giannakopoulos, C. Comparison of Models for Describing the Lactation Curves of Chios Sheep Using Daily Records Obtained from an Automatic Milking System. In Proceedings of the 5th International Conference on Information & Communication Technologies in Agriculture, Food and Environment (HAICTA), Skiathos, Greece, 8–11 September 2019; pp. 571–589. [Google Scholar]
- Leonard, T.; Hsu, J.S.J. Bayesian Methods: An Analysis for Statisticians and Interdisciplinary Researchers (Cambridge Series in Statistical and Probabilistic Mathematics); Cambridge University Press: Cambridge, UK, 2001; Volume 5. [Google Scholar]
- Reddy, T.A.; Claridge, D. Using synthetic data to evaluate multiple regression and principal component analyses for statistical modeling of daily building energy consumption. Energy Build. 1994, 21, 35–44. [Google Scholar] [CrossRef]
- Tavakol, M.; Dennick, R. Making sense of Cronbach’s alpha. Int. J. Med. Educ. 2011, 2, 53. [Google Scholar] [CrossRef] [PubMed]
- Hatcher, L. A Step-by-Step Approach to Using the SAS(R) System for Factor Analysis and Structural Equation Modeling; SAS Institute: Cary, NC, USA, 1994. [Google Scholar]
- Wang, H.-Y.; Wu, X.-J. Weighted PCA space and its application in face recognition. In Proceedings of the 2005 International Conference on Machine Learning and Cybernetics, Guangzhou, China, 18–21 August 2005; pp. 4522–4527. [Google Scholar]
- Jordana, J.; Ribo, O.; Pelegrin, M. Analysis of genetic relationships from morphological characters in Spanish goat breeds. Small Rumin. Res. 1993, 12, 301–314. [Google Scholar] [CrossRef]
- Dyce, K.; Sack, W.; Wensing, C. The hindlimb of the horse. In Dyce, Sack, and Wensing’s Textbook of Veterinary Anatomy; Saunders: Philadelphia, PA, USA, 1996. [Google Scholar]
- Jeffcott, L. Back problems in the horse—A look at past, present and future progress. Equine Vet. J. 1979, 11, 129–136. [Google Scholar] [CrossRef]
- Di Grigoli, A.; Bonanno, A.; Alabiso, M.; Brecchia, G.; Russo, G.; Leto, G. Effects of housing system on welfare and milk yield and quality of Girgentana goats. Ital. J. Anim. Sci. 2003, 2, 542–544. [Google Scholar]
- Trukhachev, V.; Oliinyk, S.; Zlidnev, N. Directions to improvement selection-technological features of cattle Ayrshire breed. In Proceedings of the 16th International Scientific Conference “Engineering for Rural Development”, Jelgava, Latvia, 24–26 May 2017. [Google Scholar]
- Merkhan, K.; Alkass, J. Influence of udder and teat size on milk yield in Black and Meriz goats. Res. Opin. Anim. Vet. Sci 2011, 1, 601–605. [Google Scholar]
- El-Gendy, M.; Youssef, H.F.; Saifelnasr, E.; El-Sanafawy, H.A.; Saba, F.E. Relationship between udder characteristics and each of reproductive performance and milk production and milk composition in Zaraibi and Damascus dairy goats. Egypt. J. Sheep Goat Sci. 2014, 9, 95–104. [Google Scholar]
- Upadhyay, D.; Patel, B.; Kerketta, S.; Kaswan, S.; Sahu, S.; Bhushan, B.; Dutt, T. Study on udder morphology and its relationship with production parameters in local goats of Rohilkhand region of India. Indian J. Anim. Res. 2014, 48, 615–619. [Google Scholar] [CrossRef]
- Wagay, M.A.; Tomar, A.; Lone, S.; Singh, A.K.; Carolina, P. Association of milk quality parameters with teat and udder traits in Tharparkar cows. Indian J. Anim. Res. 2018, 52, 1368–1372. [Google Scholar] [CrossRef]
- Eyduran, E.; Yılmaz, İ.; Kaygısız, A.; Aktaş, Z. An investigation on relationship between lactation milk yield, somatic cell count and udder traits in first lactation turkish saanen goat usıng different statistical techniques. J. Anim. Plant Sci. 2013, 23, 956–963. [Google Scholar]
- Bölling, D.; Pollott, G. Locomotion, lameness, hoof and leg traits in cattle I.: Phenotypic influences and relationships. Livest. Prod. Sci. 1998, 54, 193–203. [Google Scholar]
- Greenough, P.R. Bovine Laminitis and Lameness: A Hands on Approach; Elsevier Health Sciences: Amsterdam, The Netherlands, 2007. [Google Scholar]
- Greenough, P.R.; MacCallum, F.J.; Weaver, A.D. Lameness in Cattle, 2nd ed.; Weaver, A.D., Ed.; Wright’s Scientechnica: Bristol, UK, 1981; pp. 1–97. [Google Scholar]
- Blowey, R.W. A Veterinary Book for Dairy Farmers; Farming Press—Old Pond Publishing Ltd.: Chichester, UK, 1999. [Google Scholar]
- Yao, D.; Luo, J.; He, Q.; Wu, M.; Shi, H.; Wang, H.; Wang, M.; Xu, H.; Loor, J.J. Thyroid hormone responsive (THRSP) promotes the synthesis of medium-chain fatty acids in goat mammary epithelial cells. J. Dairy Sci. 2016, 99, 3124–3133. [Google Scholar] [CrossRef] [PubMed]
- An, X.; Zhao, H.; Bai, L.; Hou, J.; Peng, J.; Wang, J.; Song, Y.; Cao, B. Polymorphism identification in the goat THRSP gene and association analysis with growth traits. Arch. Anim. Breed. 2012, 55, 78–83. [Google Scholar] [CrossRef][Green Version]
- Waheed, A.; Khan, M.; Eyduran, E.; Khan, M.; Faraz, A.; Mirza, R. Genetic evaluation of linear type traits and their association with milk production traits in beetal goats in Pakistan. JAPS J. Anim. Plant Sci. 2019, 29, 425–430. [Google Scholar]
- Akpa, G.; Ambali, A.; Suleiman, I. Body conformation, testicular and semen characteristics as influenced by age, hair type and body condition of Red Sokoto goat. N. Y. Sci. J. 2013, 6, 44–58. [Google Scholar]
- Liesegang, A.; Risteli, J.; Wanner, M. Bone metabolism of milk goats and sheep during second pregnancy and lactation in comparison to first lactation. J. Anim. Physiol. Anim. Nutr. 2007, 91, 217–225. [Google Scholar] [CrossRef]
- Guo, B.; Jiao, Y.; He, C.; Wei, L.; Chang, Z.; Yue, X.; Lan, X.; Chen, H.; Lei, C. A novel polymorphism of the lactoferrin gene and its association with milk composition and body traits in dairy goats. Genet. Mol. Res. 2010, 9, 2199–2206. [Google Scholar] [CrossRef]
- Cornish, J. Lactoferrin promotes bone growth. Biometals 2004, 17, 331–335. [Google Scholar] [CrossRef]
© 2020 by the authors. Licensee MDPI, Basel, Switzerland. This article is an open access article distributed under the terms and conditions of the Creative Commons Attribution (CC BY) license (http://creativecommons.org/licenses/by/4.0/).