NIR Hyperspectral Imaging Technology Combined with Multivariate Methods to Identify Shrimp Freshness
Abstract
1. Introduction
2. Materials and Methods
2.1. Sample and Sample Preparation
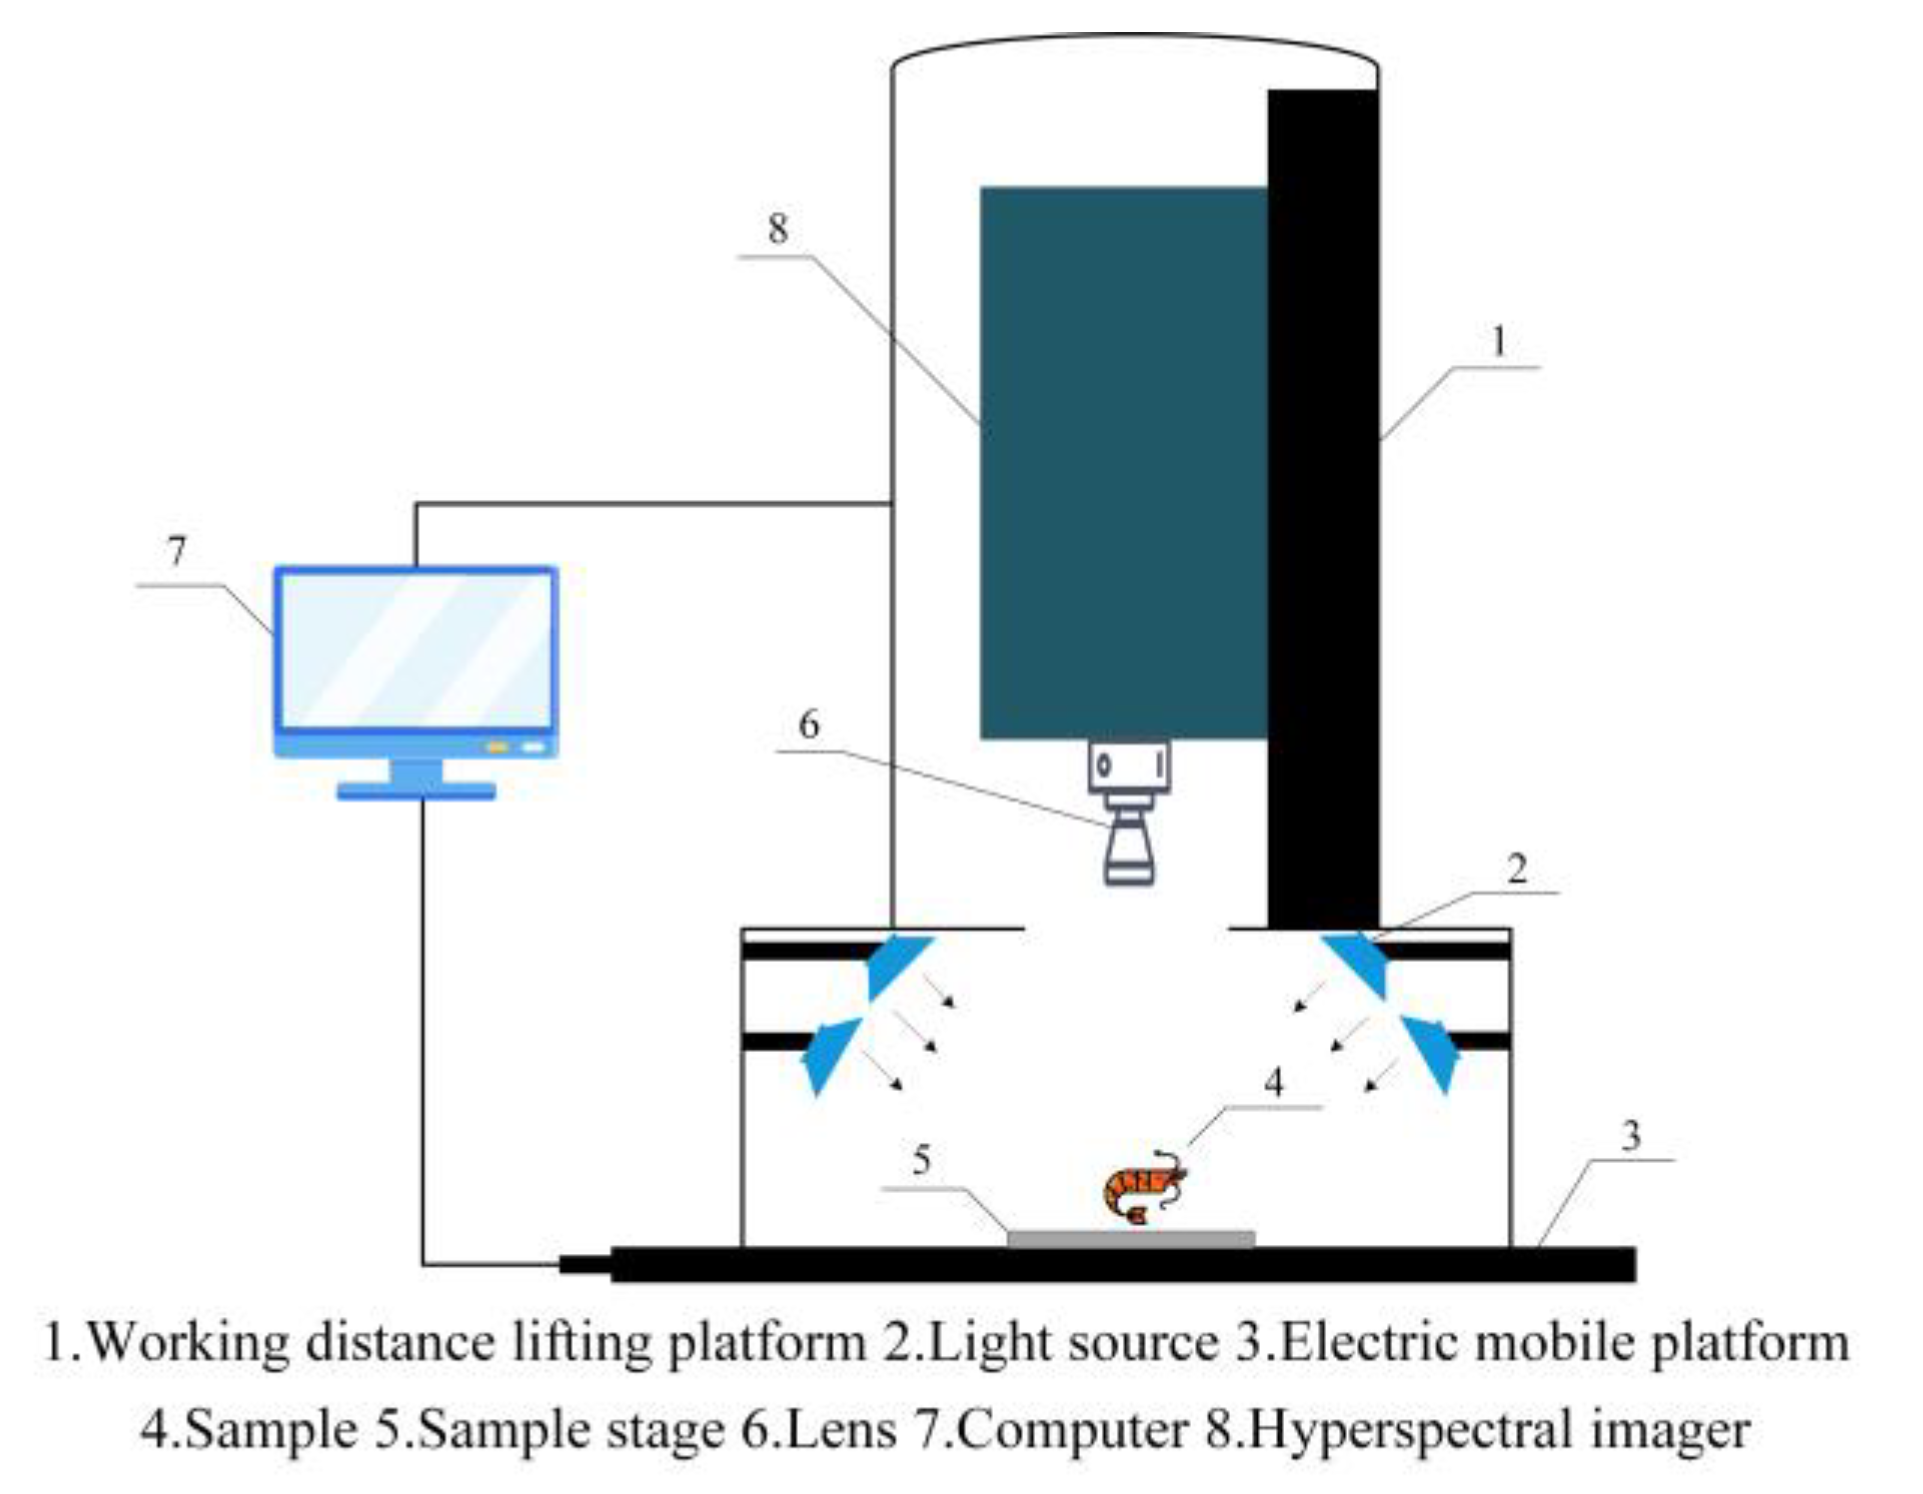
2.2. Hyperspectral Imaging System
2.3. Hyperspectral Image Acquisition and Correction
2.4. Data Analysis
2.4.1. Spectral Data Extraction and Preprocessing
2.4.2. Sample Set Division
2.4.3. Selection Methods of Characteristic Wavelengths
2.4.4. Discriminant Model and Performance Evaluation
3. Results and Discussion
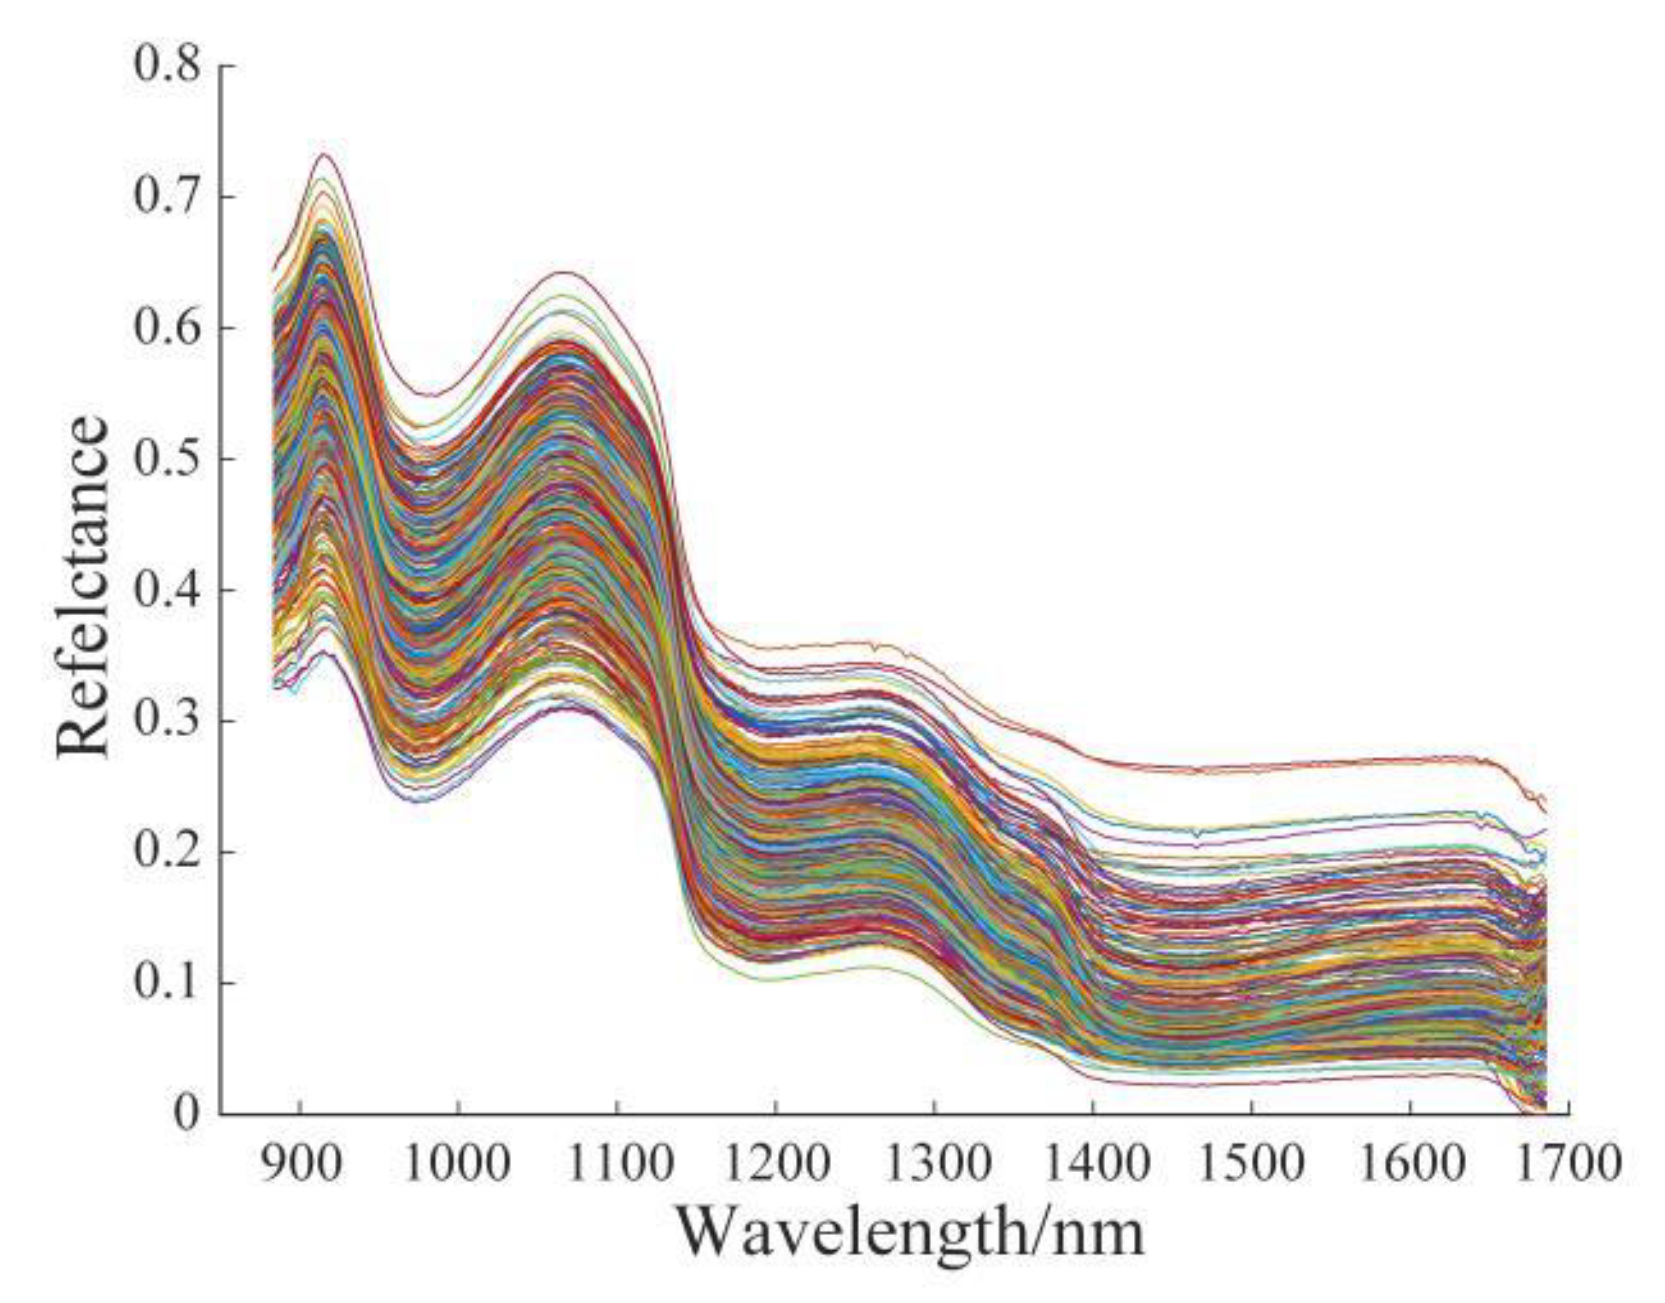
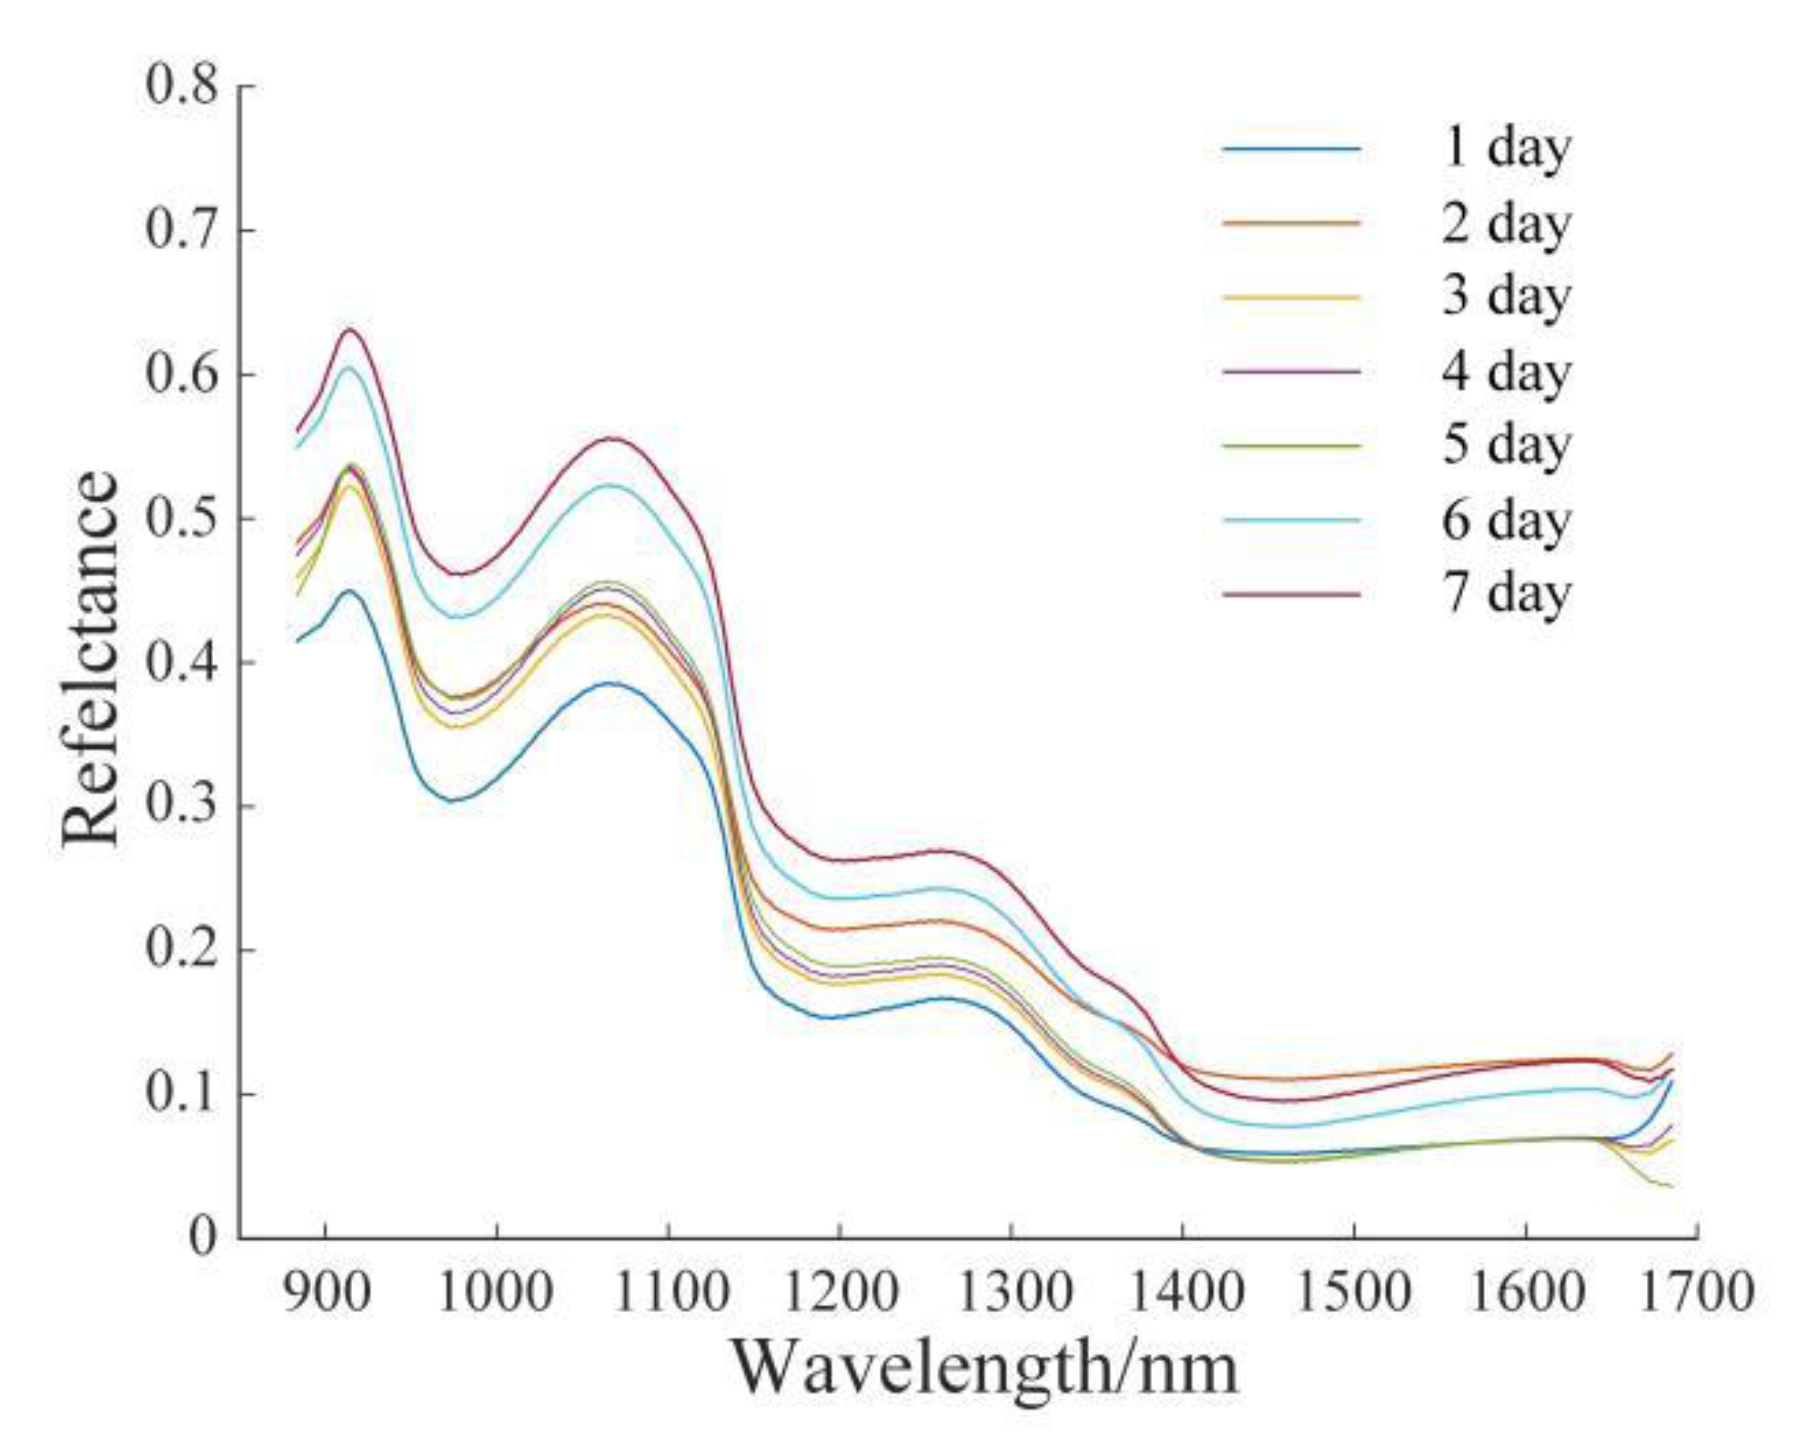
3.1. Original Spectral Analysis
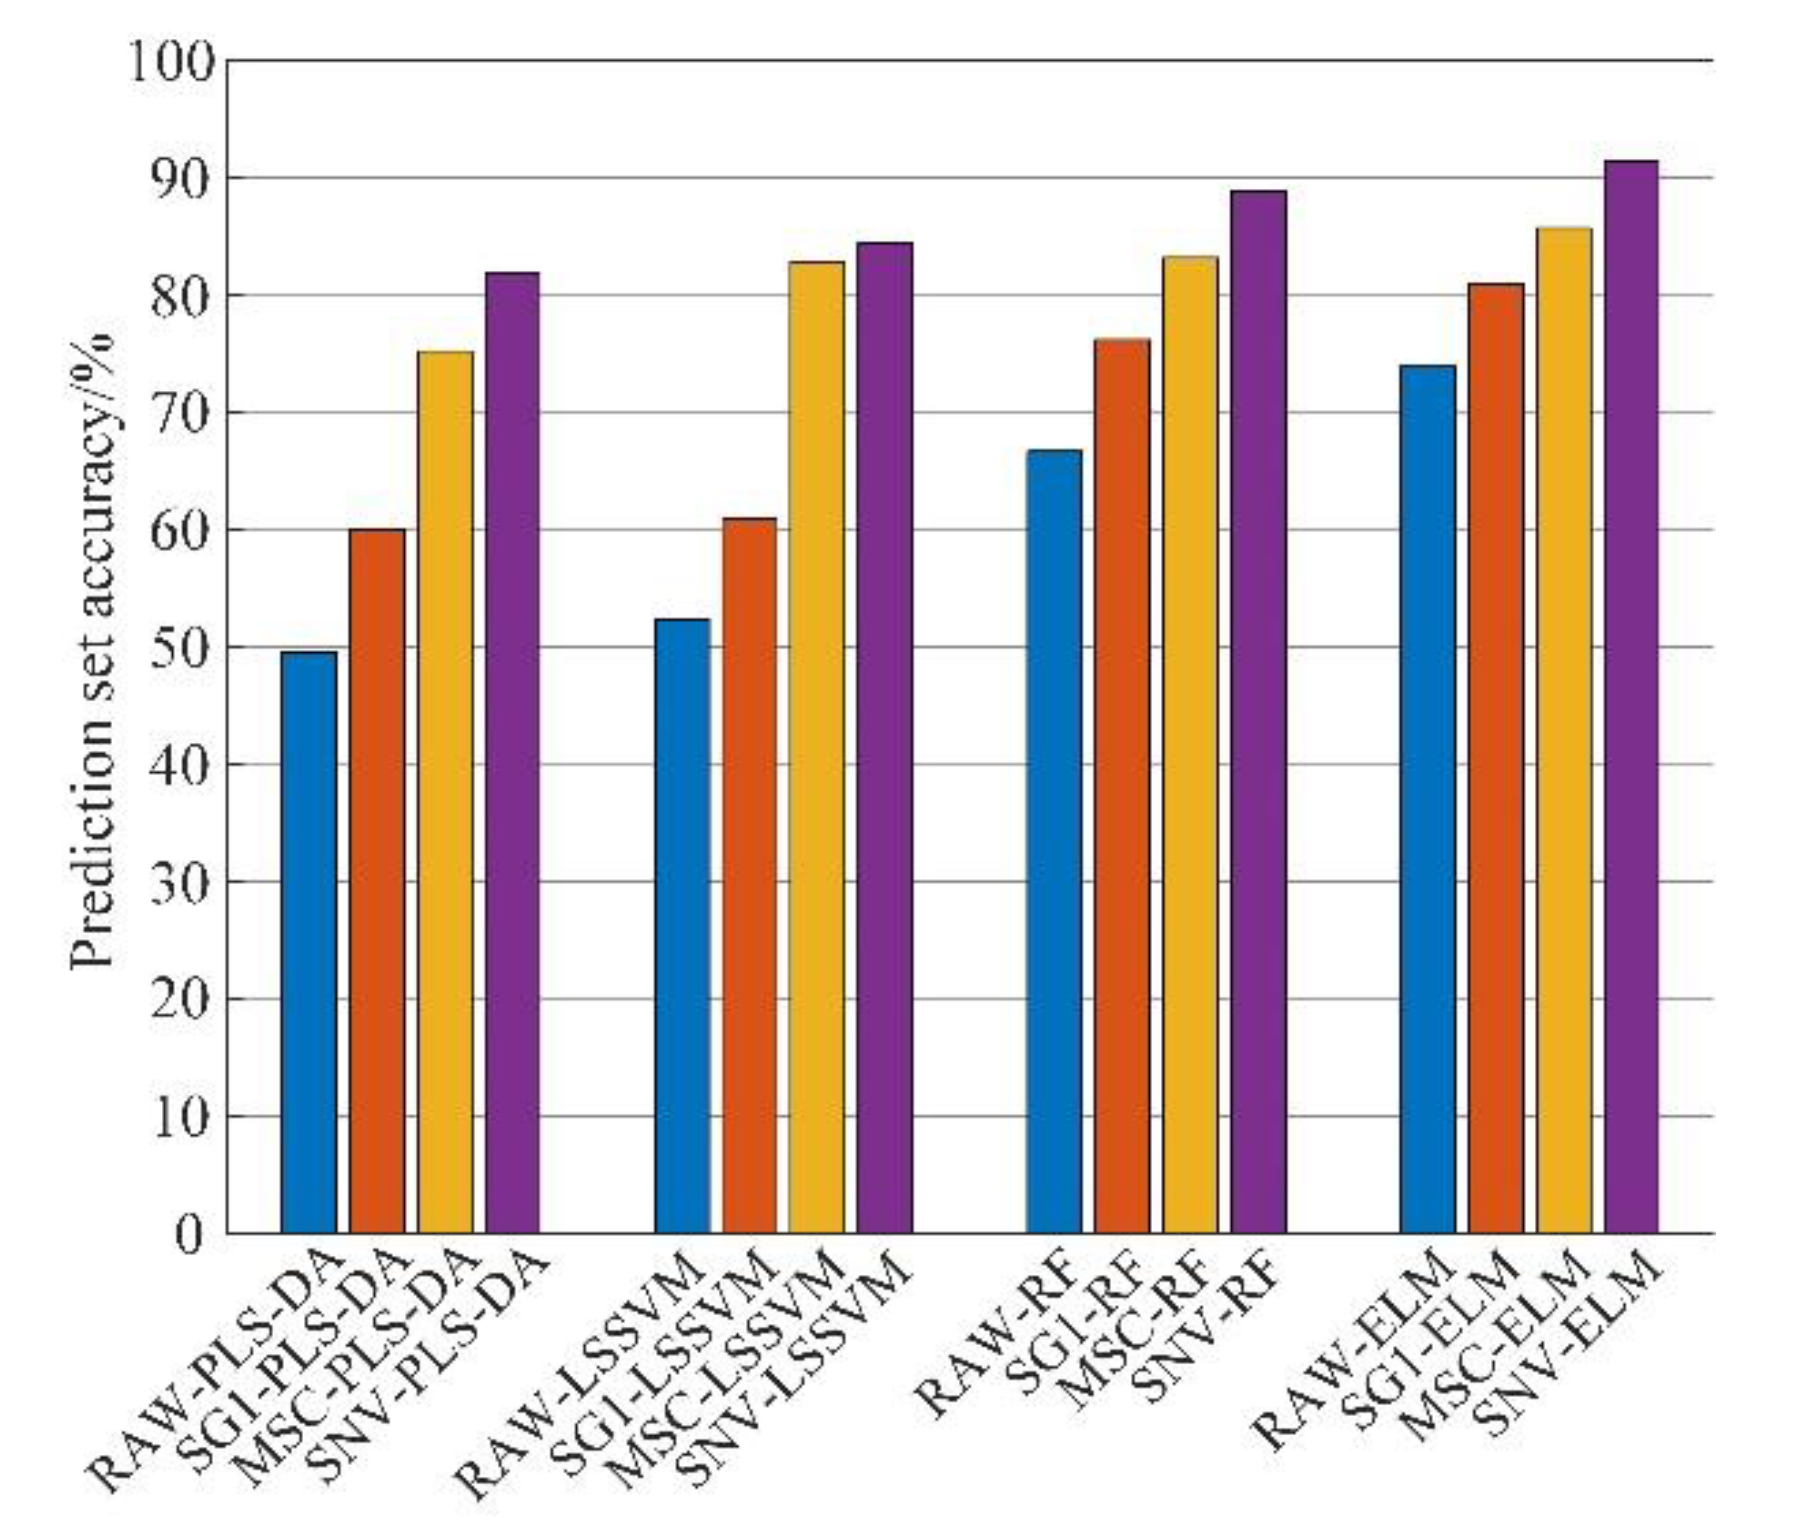
3.2. Modeling Analysis Based on Full Wavelength
3.3. Selection Results of Characteristic Wavelengths
3.4. Modeling Analysis Based on Characteristic Wavelengths
3.5. Visualization of White Shrimp on Different Refrigeration Days
4. Conclusions
- (1)
- The raw spectral data were pre-processed by SG1, MSC, and SNV, after which the corresponding data were entered into PLS-DA, LSSVM, RF, and ELM discriminant models for full wavelength modeling analysis. The results demonstrated that the SNV-processed spectral data had the best performance among the four discriminant models (the accuracy of the prediction set was better than the other two pre-processing methods and the raw spectral data). Therefore, the SNV-processed spectral data were chosen for subsequent characteristic wavelength extraction so as to dimensionally downscale the raw spectra and further improve the model performance.
- (2)
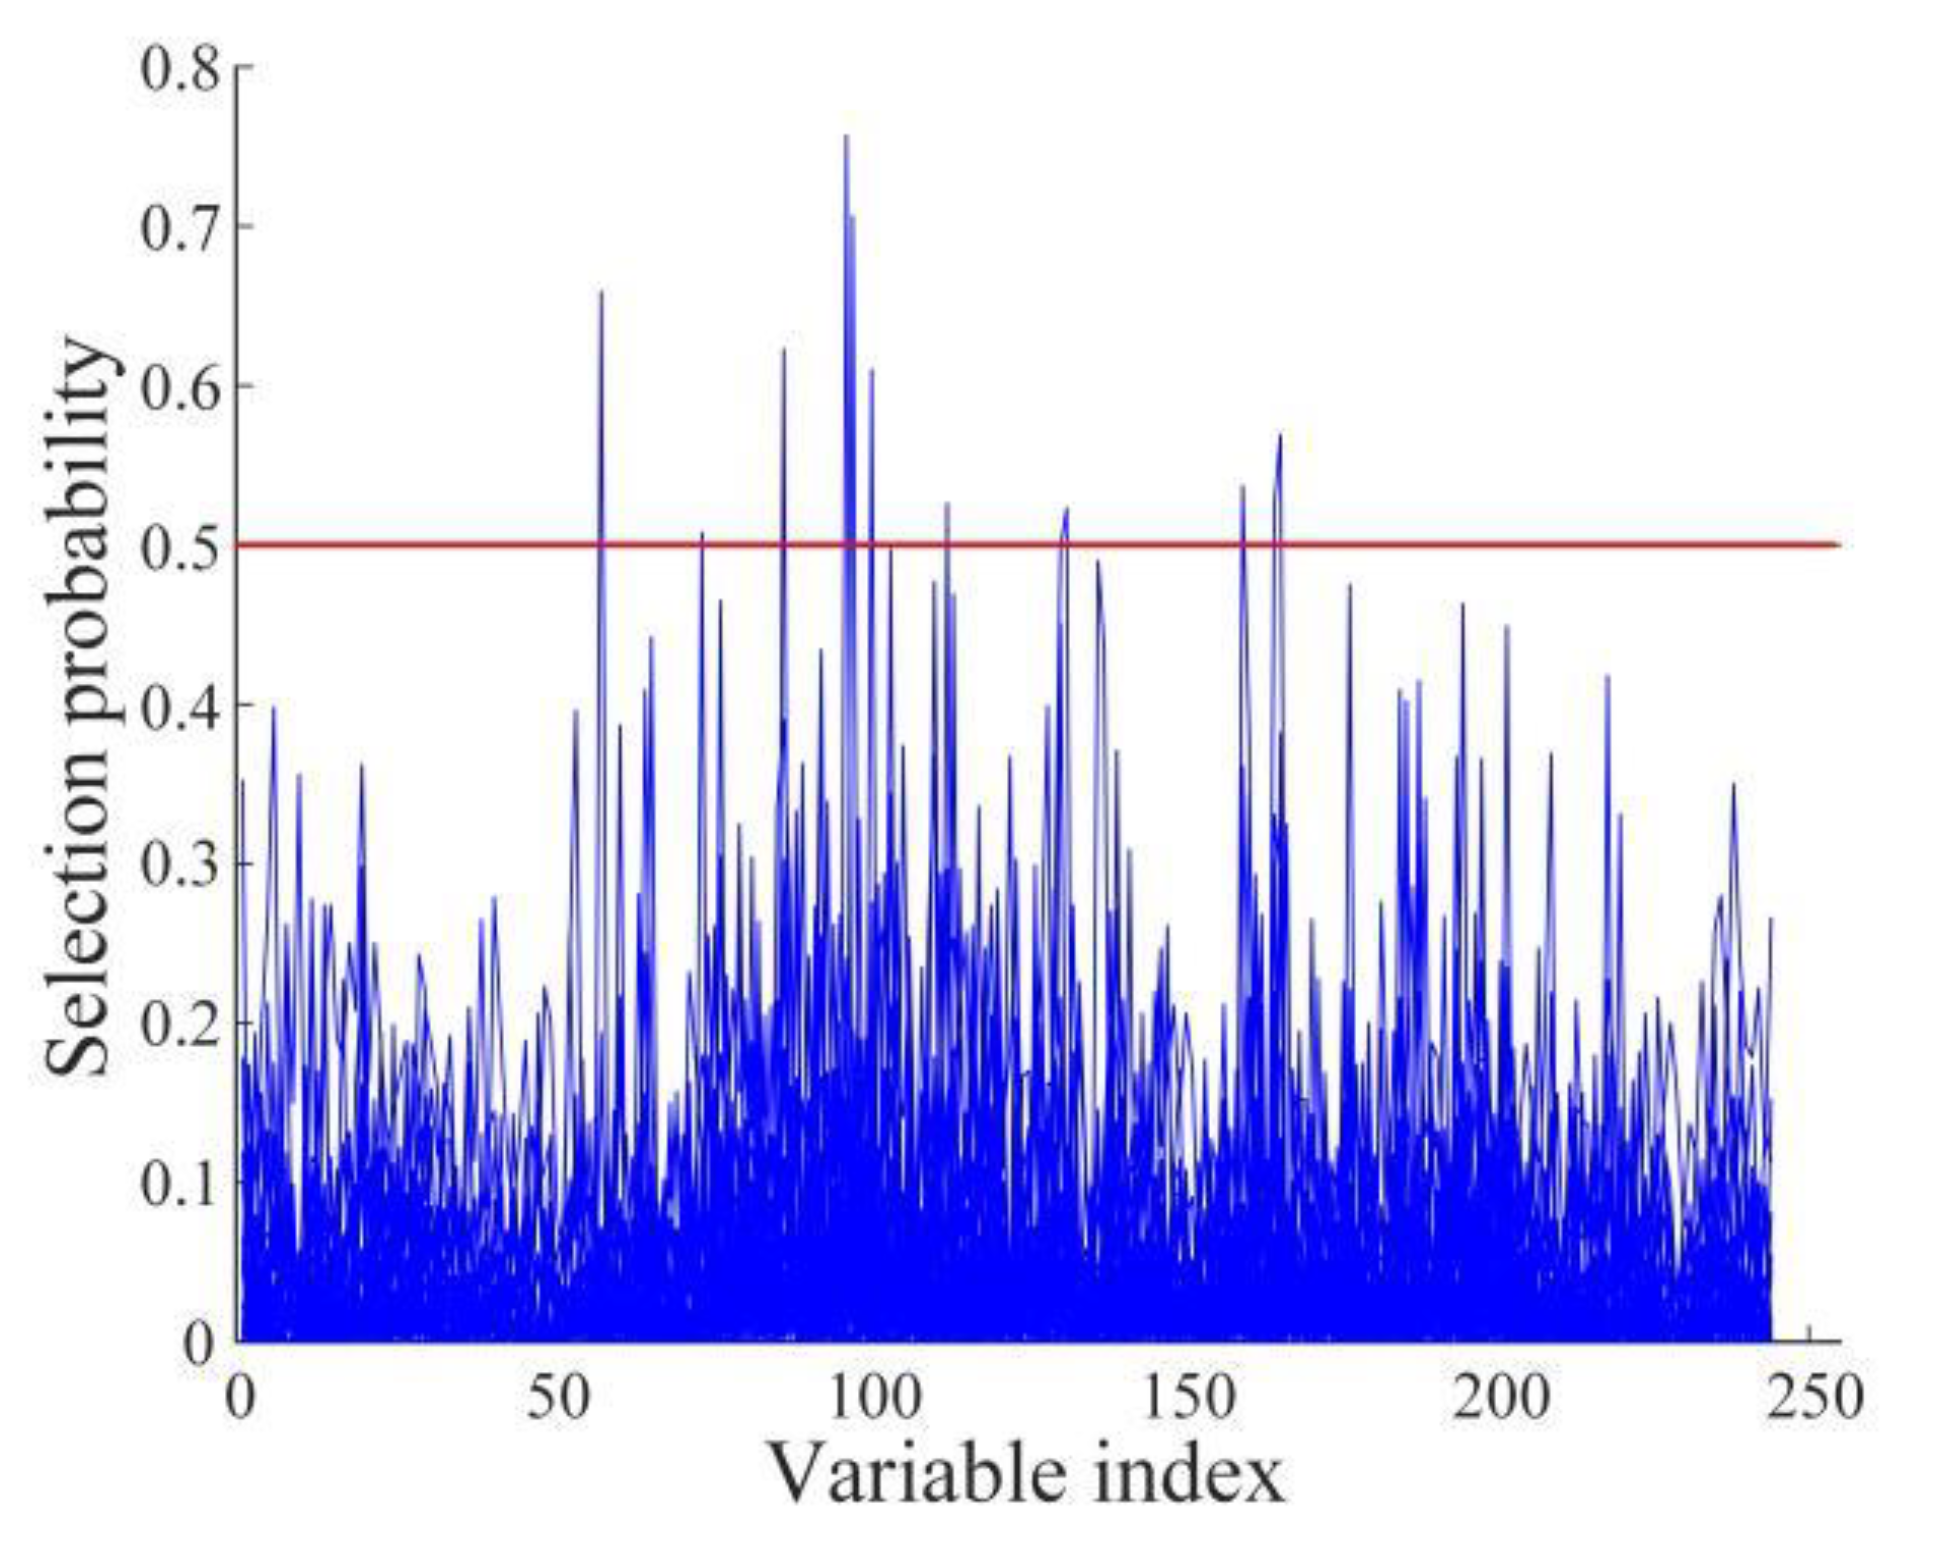
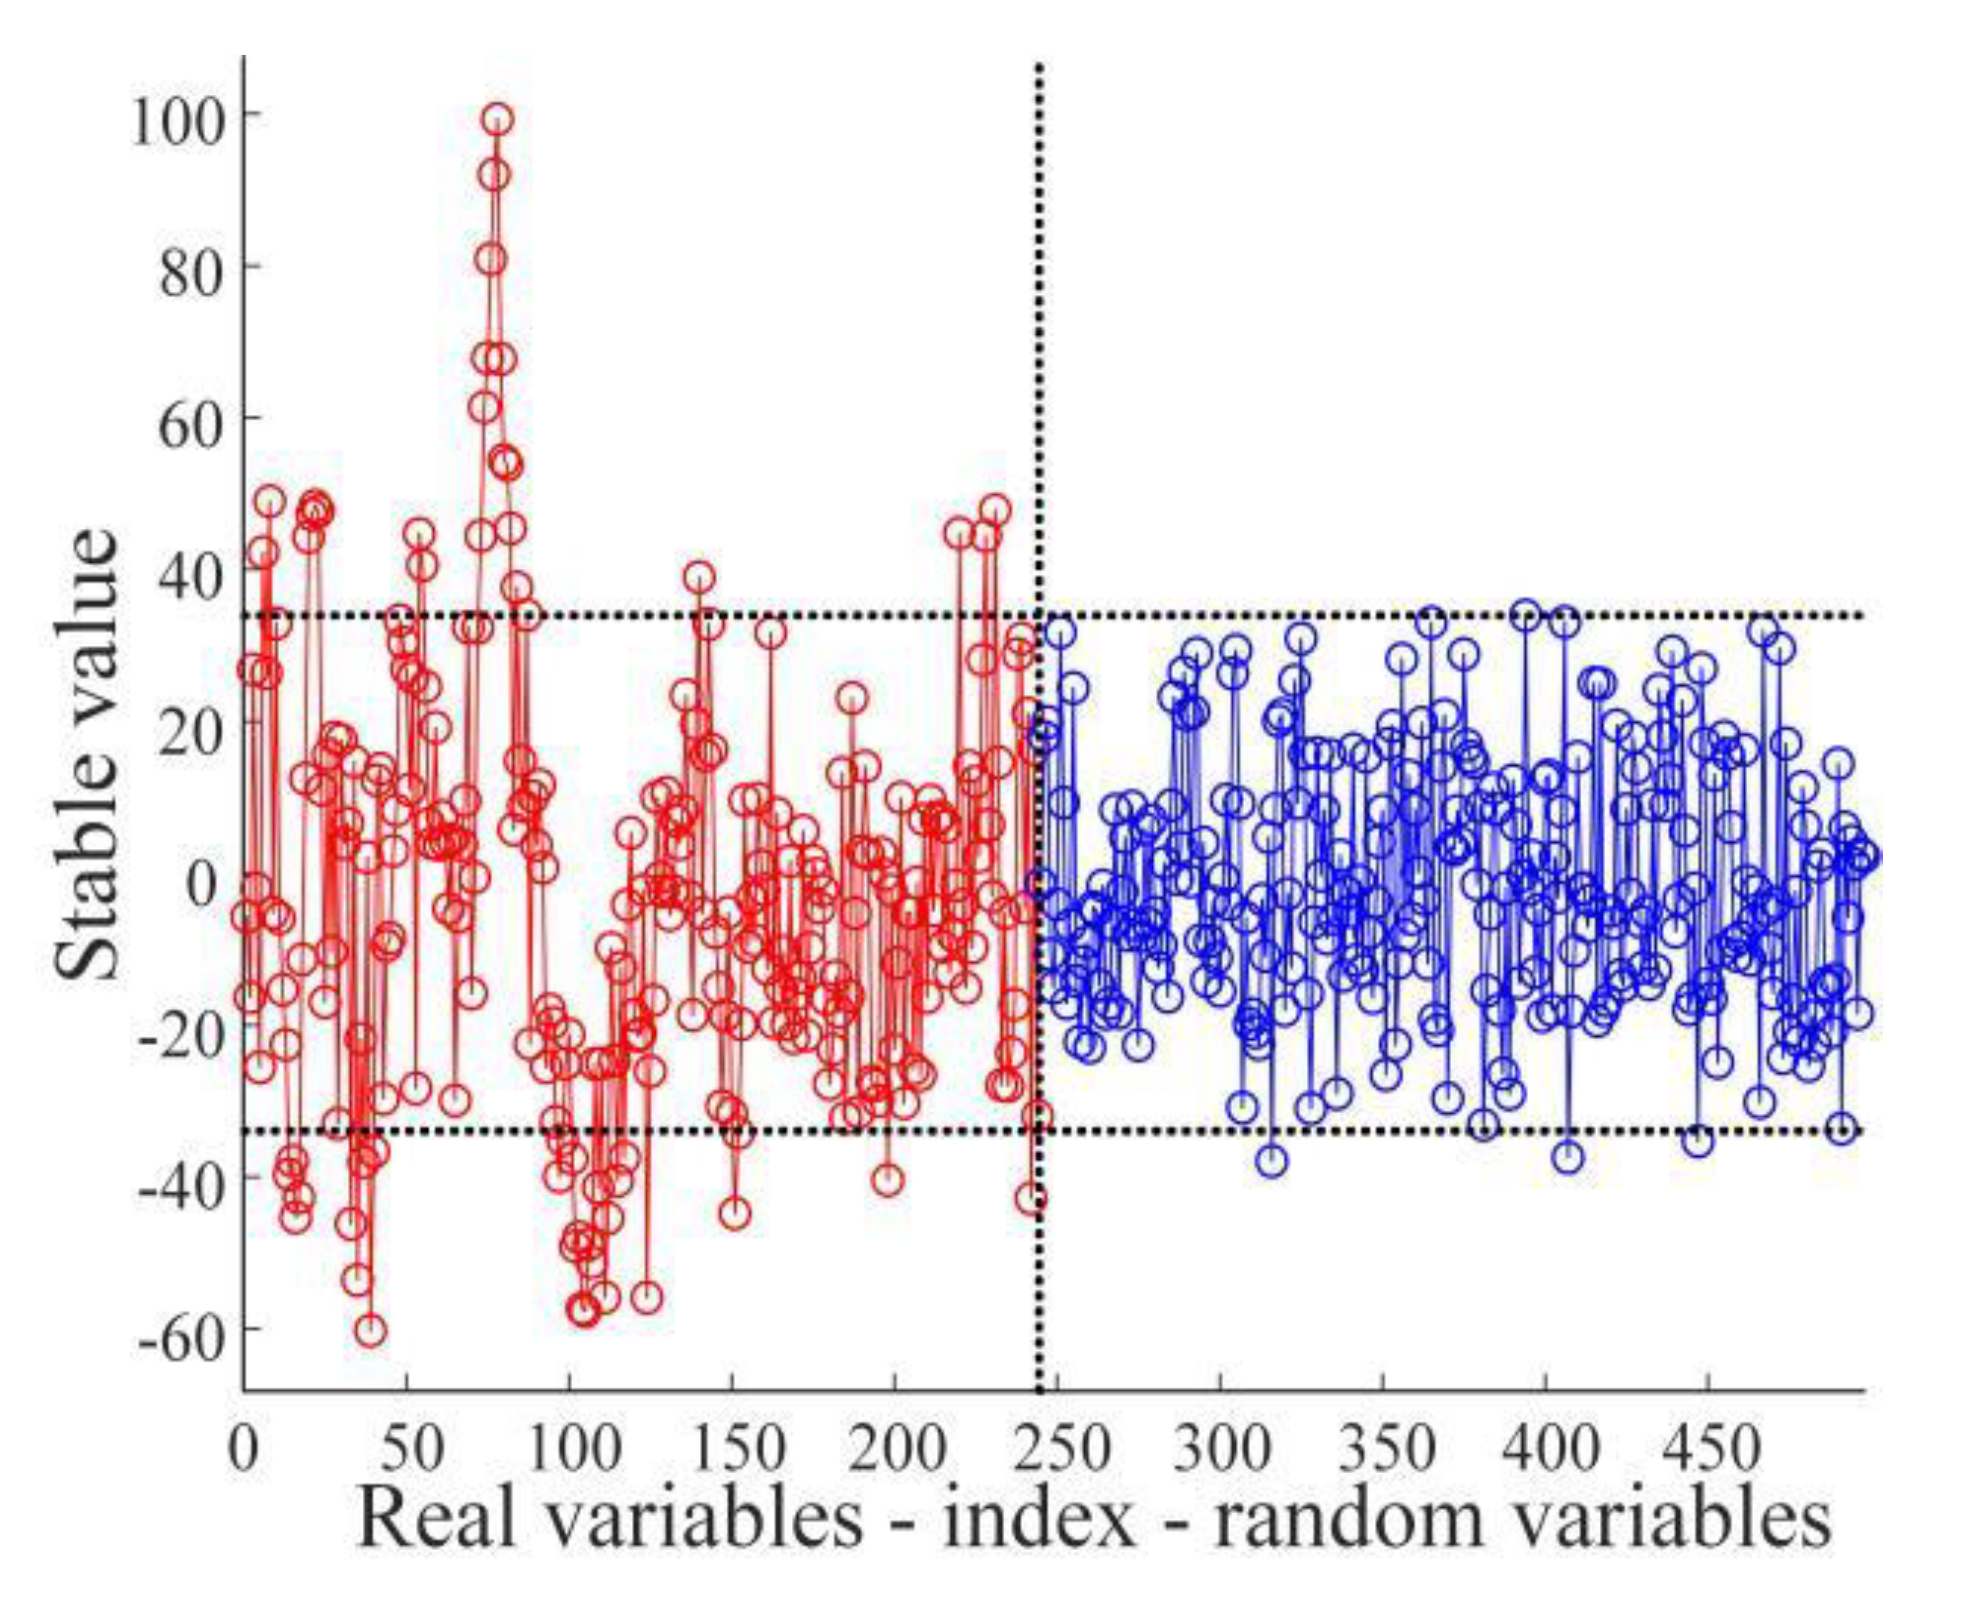
- The SNV-processed spectral data were extracted by RFA, UVE, and CARS, respectively, and the characteristic wavelengths corresponding to the data were entered into PLS-DA, LSSVM, RF, and ELM discriminant models for modeling and analysis. The comparison with the results of the full wavelength modeling analysis reveals improved modeling results based on characteristic wavelengths, which indicates that the characteristic wavelengths extracted by the three characteristic wavelength extraction algorithms are robust. Additional analyses showed that the combination of CARS and discriminant models had the best performance among the three characteristic wavelength extraction algorithms, while the ELM had the best classification performance among the four discriminant models. Therefore, the SNV-CARS-ELM model was finally chosen as the optimal model.
- (3)
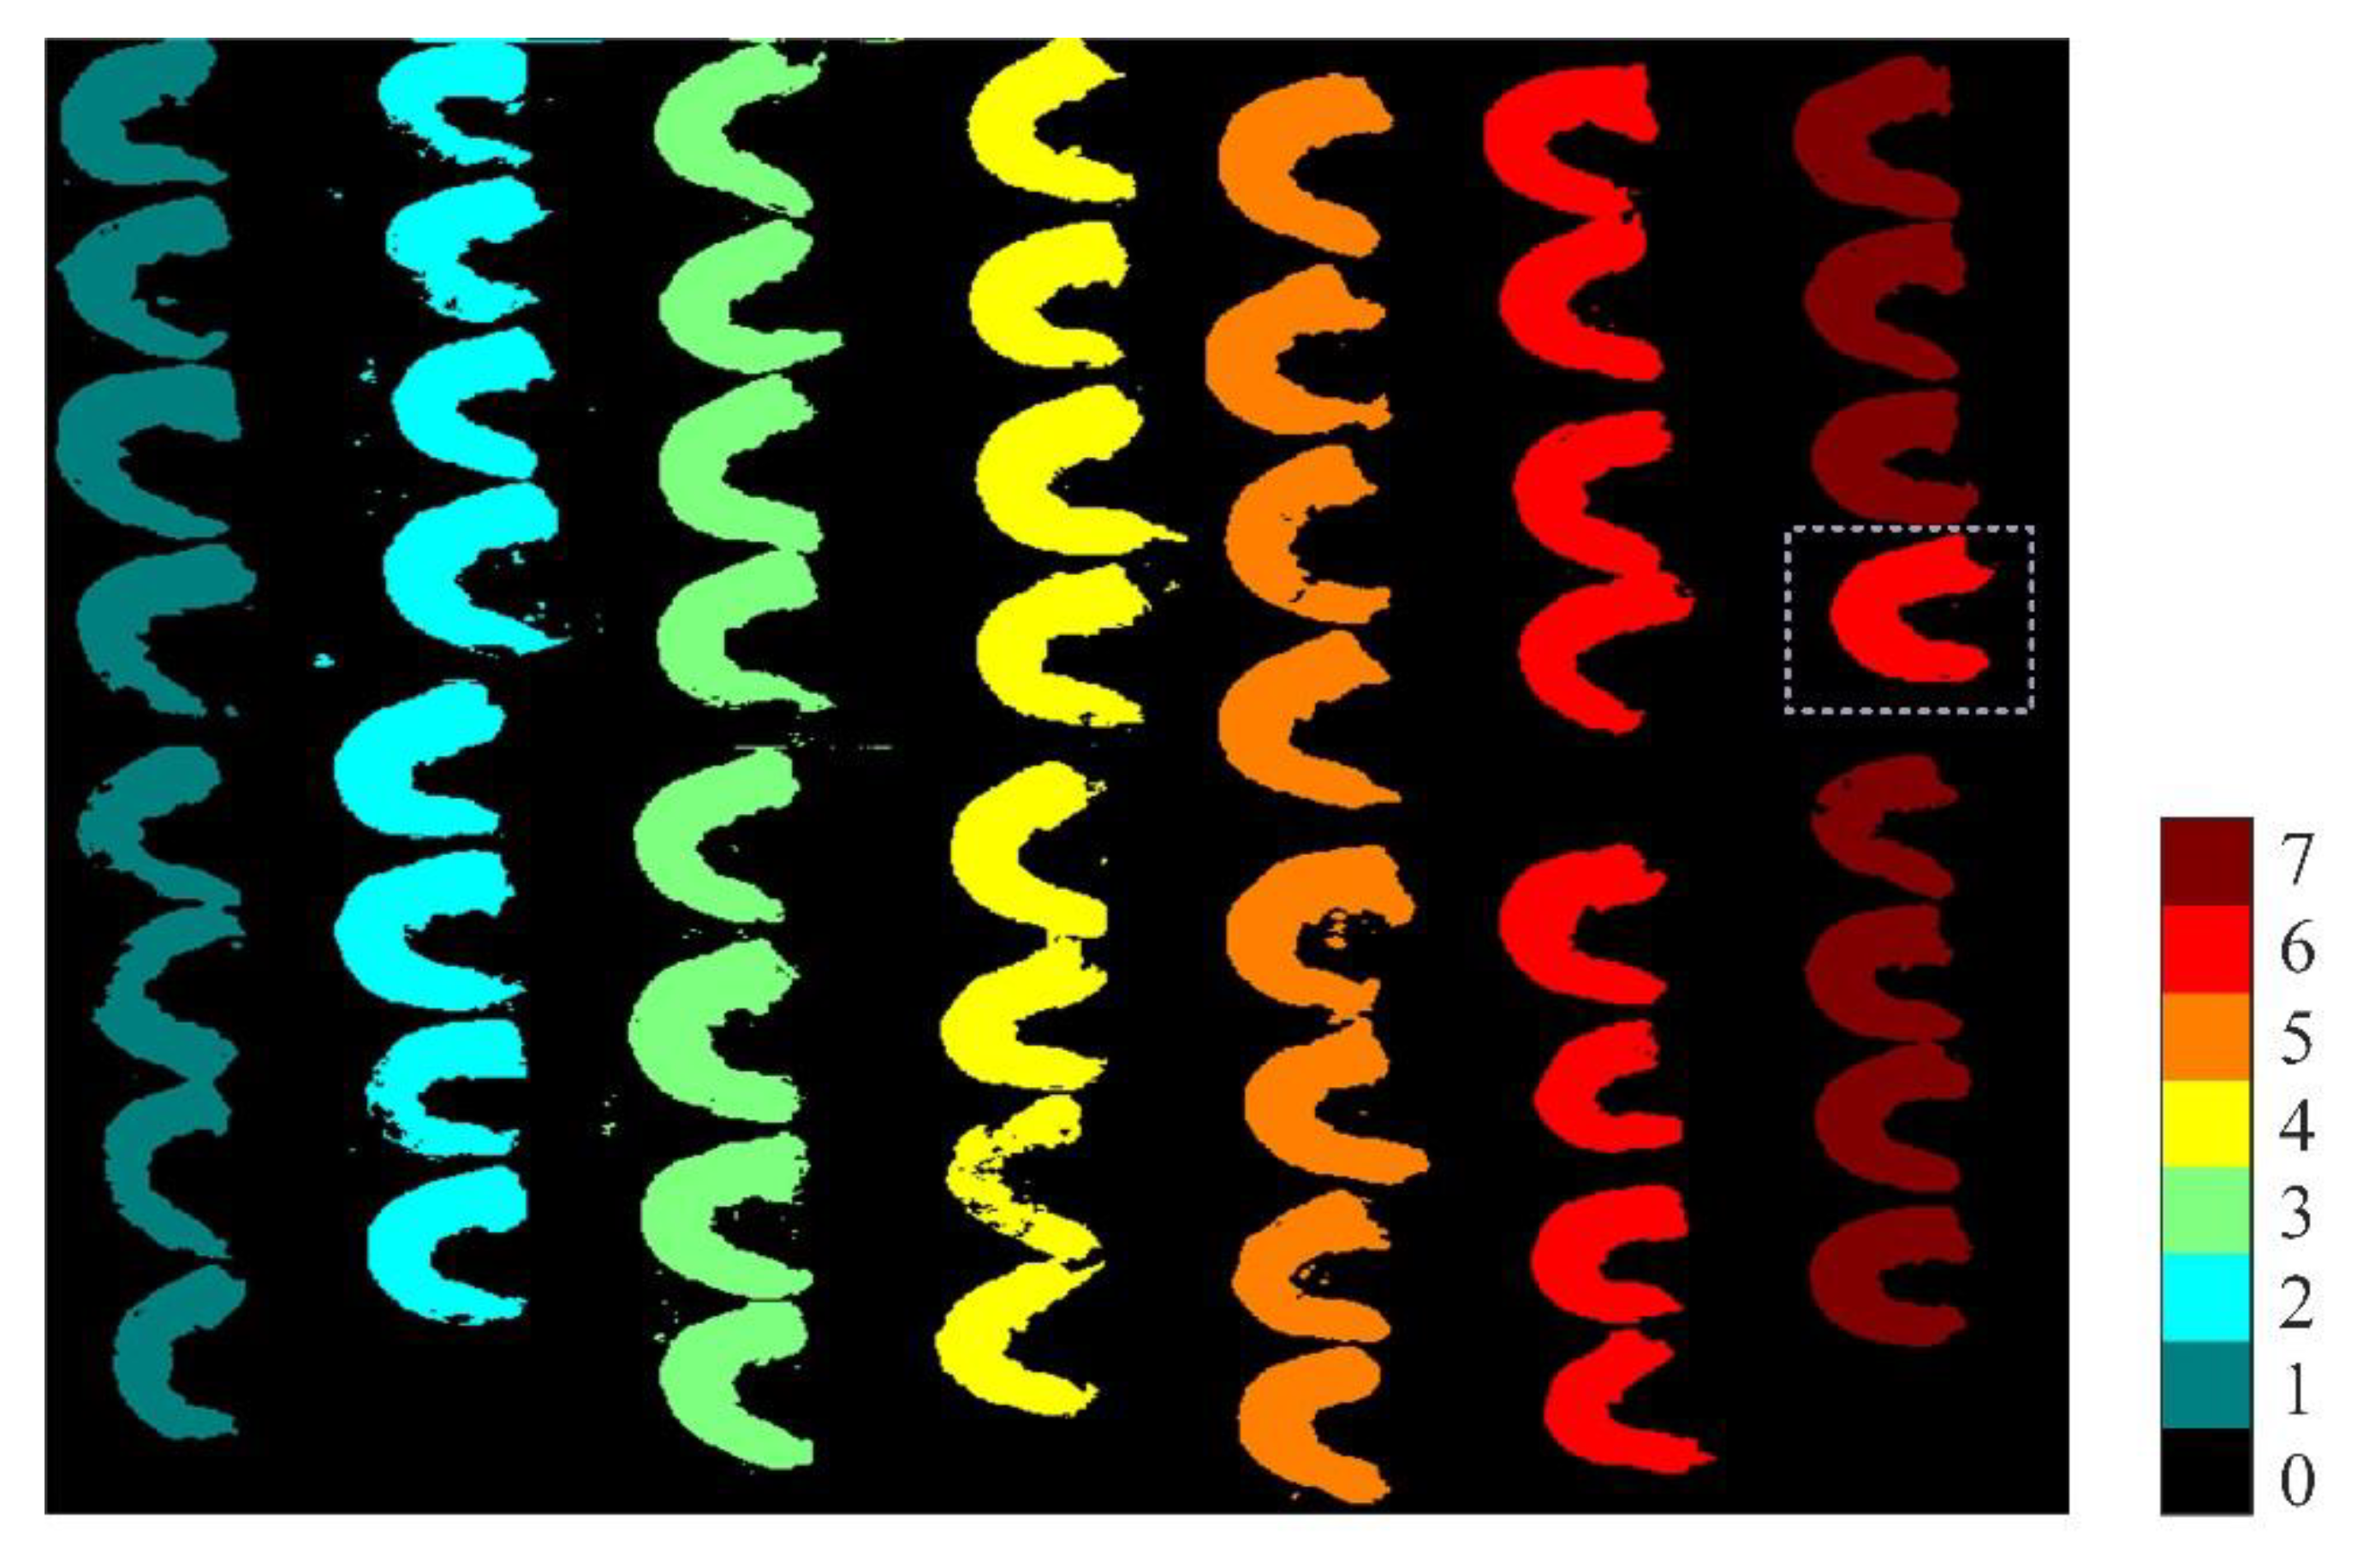
- To intuitively judge the white shrimps of different refrigeration days, a total of 56 random original hyperspectral images were input into the SNV-CARS-ELM model and visualized by the object-wise method. The classification visualization results showed that only 1 sample out of the total of 48 white shrimp samples was misclassified with an aggregate classification accuracy of 97.92%, which indicates the reliability of the chosen model.
Author Contributions
Funding
Acknowledgments
Conflicts of Interest
References
- Qiao, X.; Yang, L.; Gao, Q.; Yang, S.; Li, Z.; Xu, J.; Xue, C. Oxidation evaluation of free astaxanthin and astaxanthin esters in Pacific white shrimp during iced storage and frozen storage. J. Sci. Food Agric. 2019, 99, 2226–2235. [Google Scholar] [CrossRef] [PubMed]
- Yu, L.; Jiang, Q.; Yu, D.; Xu, Y.; Gao, P.; Xia, W. Quality of giant freshwater prawn (Macrobrachium rosenbergii) during the storage at −18°C as affected by different methods of freezing. Int. J. Food Prop. 2018, 21, 2100–2109. [Google Scholar] [CrossRef]
- Pan, C.; Chen, S.; Hao, S.; Yang, X. Effect of low-temperature preservation on quality changes in Pacific white shrimp, Litopenaeus vannamei: A review. J. Sci. Food Agric. 2019, 99, 6121–6128. [Google Scholar] [CrossRef] [PubMed]
- Zamora-Méndez, S.; Robles-Romo, A.; Marin-Peralta, E.; Arjona, O.; Apún-Molina, J.P.; Beltrán-Lugo, A.I.; Palacios, E.; Racotta, I.S. Postmortem Metabolic, Physicochemical, and Lipid Composition Changes in Litopenaeus vannamei in Response to Harvest Procedures. J. Aquat. Food Prod. Technol. 2017, 26, 1093–1106. [Google Scholar] [CrossRef]
- Le, N.T.; Doan, N.K.; Nguyen Ba, T.; Tran, T.V.T. Towards improved quality benchmarking and shelf life evaluation of black tiger shrimp (Penaeus monodon). Food Chem. 2017, 235, 220–226. [Google Scholar] [CrossRef]
- Baptista, R.C.; Horita, C.N.; Sant’Ana, A.S. Natural products with preservative properties for enhancing the microbiological safety and extending the shelf-life of seafood: A review. Food Res. Int. 2020, 127, 108762. [Google Scholar] [CrossRef] [PubMed]
- Olatunde, O.O.; Benjakul, S.; Yesilsu, A.F. Antimicrobial Compounds from Crustaceans and Their Applications for Extending Shelf-Life of Marine-Based Foods. Turk. J. Fish. Aquat. Sci. 2020, 20, 629–646. [Google Scholar] [CrossRef]
- Ghasemi-Varnamkhasti, M.; Goli, R.; Forina, M.; Mohtasebi, S.S.; Shafiee, S.; Naderi-Boldaji, M. Application of Image Analysis Combined with Computational Expert Approaches for Shrimp Freshness Evaluation. Int. J. Food Prop. 2016, 19, 2202–2222. [Google Scholar] [CrossRef]
- Fang, Z.; Zhou, L.; Wang, Y.; Sun, L.; Gooneratne, R. Evaluation the effect of mycotoxins on shrimp (Litopenaeus vannamei) muscle and their limited exposure dose for preserving the shrimp quality. J. Food Process. Preserv. 2019, 43, 1–8. [Google Scholar] [CrossRef]
- Khodanazary, A. Freshness assessment of shrimp Metapenaeus affinis by quality index method and estimation of its shelf life. Int. J. Food Prop. 2019, 22, 309–319. [Google Scholar] [CrossRef]
- Simoes, J.S.; Mársico, E.T.; De La Torre, C.A.L.; Mano, S.B.; Franco, R.M.; Santos, L.F.L.D.; Conte-Junior, C.A. Nutritional and Sensory Quality of the Freshwater Prawn Macrobrachium rosenbergii and the Influence of Packaging Permeability on its Shelf Life. J. Aquat. Food Prod. Technol. 2019, 28, 703–714. [Google Scholar] [CrossRef]
- Thimmappa, M.H.; Manjunatha Reddy, A.; Prabhu, R.M.; Elavarasan, K. Quality Changes in Deep-Sea Shrimp (Aristeus alcocki) During Ice Storage: Biochemical and Organoleptic Changes. Agric. Res. 2019, 8, 497–504. [Google Scholar] [CrossRef]
- Feng, C.; Makino, Y.; Oshita, S.; García Martín, J.F. Hyperspectral imaging and multispectral imaging as the novel techniques for detecting defects in raw and processed meat products: Current state-of-the-art research advances. Food Control. 2018, 84, 165–176. [Google Scholar] [CrossRef]
- Dai, Q.; Cheng, J.; Sun, D.; Zhu, Z.; Pu, H. Prediction of total volatile basic nitrogen contents using wavelet features from visible/near-infrared hyperspectral images of prawn (Metapenaeus ensis). Food Chem. 2016, 197, 257–265. [Google Scholar] [CrossRef]
- Yu, X.; Tang, L.; Wu, X.; Lu, H. Nondestructive Freshness Discriminating of Shrimp Using Visible/Near-Infrared Hyperspectral Imaging Technique and Deep Learning Algorithm. Food Anal. Methods. 2018, 11, 768–780. [Google Scholar] [CrossRef]
- Sivertsen, A.H.; Kimiya, T.; Heia, K. Automatic freshness assessment of cod (Gadus morhua) fillets by Vis/Nir spectroscopy. J. Food Eng. 2011, 103, 317–323. [Google Scholar] [CrossRef]
- Cheng, J.; Sun, D.; Pu, H.; Chen, X.; Liu, Y.; Zhang, H.; Li, J. Integration of classifiers analysis and hyperspectral imaging for rapid discrimination of fresh from cold-stored and frozen-thawed fish fillets. J. Food Eng. 2015, 161, 33–39. [Google Scholar] [CrossRef]
- Reis, M.M.; Van Beers, R.; Al-Sarayreh, M.; Shorten, P.; Yan, W.Q.; Saeys, W.; Klette, R.; Craigie, C. Chemometrics and hyperspectral imaging applied to assessment of chemical, textural and structural characteristics of meat. Meat Sci. 2018, 144, 100–109. [Google Scholar] [CrossRef]
- Ndlovu, P.F.; Magwaza, L.S.; Tesfay, S.Z.; Mphahlele, R.R. Rapid visible-near infrared (Vis-NIR) spectroscopic detection and quantification of unripe banana flour adulteration with wheat flour. J. Food Sci. Technol. 2019, 56, 5484–5491. [Google Scholar] [CrossRef]
- Yuan, R.; Liu, G.; He, J.; Ma, C.; Cheng, L.; Fan, N.; Ban, J.; Li, Y.; Sun, Y. Determination of metmyoglobin in cooked tan mutton using Vis/NIR hyperspectral imaging system. J. Food Sci. 2020, 85, 1403–1410. [Google Scholar] [CrossRef]
- Zhang, L.; Rao, Z.; Ji, H. NIR Hyperspectral Imaging Technology Combined with Multivariate Methods to Study the Residues of Different Concentrations of Omethoate on Wheat Grain Surface. Sensors 2019, 19, 3147. [Google Scholar] [CrossRef] [PubMed]
- Li, J.; Zhang, H.; Zhan, B.; Zhang, Y.; Li, R.; Li, J. Nondestructive firmness measurement of the multiple cultivars of pears by Vis-NIR spectroscopy coupled with multivariate calibration analysis and MC-UVE-SPA method. Infrared Phys. Technol. 2020, 104, 103154. [Google Scholar] [CrossRef]
- Hong, G.; Abd El-Hamid, H.T. Hyperspectral imaging using multivariate analysis for simulation and prediction of agricultural crops in Ningxia, China. Comput. Electron. Agric. 2020, 172, 105355. [Google Scholar] [CrossRef]
- Bai, Z.; Hu, X.; Tian, J.; Chen, P.; Luo, H.; Huang, D. Rapid and nondestructive detection of sorghum adulteration using optimization algorithms and hyperspectral imaging. Food Chem. 2020, 331, 127290. [Google Scholar] [CrossRef] [PubMed]
- Wang, C.; Wang, S.; He, X.; Wu, L.; Li, Y.; Guo, J. Combination of spectra and texture data of hyperspectral imaging for prediction and visualization of palmitic acid and oleic acid contents in lamb meat. Meat Sci. 2020, 169, 108194. [Google Scholar] [CrossRef]
- Hong, Y.; Chen, S.; Chen, Y.; Linderman, M.; Mouazen, A.M.; Liu, Y.; Guo, L.; Yu, L.; Liu, Y.; Cheng, H.; et al. Comparing laboratory and airborne hyperspectral data for the estimation and mapping of topsoil organic carbon: Feature selection coupled with random forest. Soil Tillage Res. 2020, 199, 104589. [Google Scholar] [CrossRef]
- Ahmad, M.; Shabbir, S.; Oliva, D.; Mazzara, M.; Distefano, S. Spatial-prior generalized fuzziness extreme learning machine autoencoder-based active learning for hyperspectral image classification. Optik 2020, 206, 163712. [Google Scholar] [CrossRef]
- Yan, L.; Pang, L.; Wang, H.; Xiao, J. Recognition of different Longjing fresh tea varieties using hyperspectral imaging technology and chemometrics. J. Food Process Eng. 2020, 43, e13378. [Google Scholar] [CrossRef]
- Yan, Y.; Chen, B.; Zhu, D. Near Infrared Spectroscopy-Principles, Technologies and Application; China Light Industry Press: Beijing, China, 2013; pp. 24–25. [Google Scholar]
- Baek, I.; Kusumaningrum, D.; Kandpal, L.; Lohumi, S.; Mo, C.; Kim, M.; Cho, B. Rapid Measurement of Soybean Seed Viability Using Kernel-Based Multispectral Image Analysis. Sensors 2019, 19, 271. [Google Scholar] [CrossRef]


| Method | NO. | Wavelengths (nm) | Molecular Vibration |
|---|---|---|---|
| RFA | 11 | 1078.3 | Second overtone of C-H + Second overtone of C-C |
| 1132.3, 1175.8, 1209.2, 1212.5, 1222.5, 1262.3 | Second overtone of C-H | ||
| 1325.0, 1416.6 | Second overtone of C-H + First overtone of C-H | ||
| 1432.8 | First overtone of N-H | ||
| 1436.1 | First overtone of O-H |
| Method | NO. | Wavelengths (nm) | Molecular Vibration |
|---|---|---|---|
| UVE | 52 | 900.9, 907.8, 928.4, 931.8, 935.3, 938.7, 949.0, 952.4 | Third overtone of C-H |
| 955.8, 959.3, 993.4, 1000.3, 1007.1 | Second overtone of O-H | ||
| 1013.9, 1017.3 | Second overtone of C-H + Third overtone of C-H | ||
| 1064.8, 1068.2 | Second overtone of N-H | ||
| 1128.9, 1132.3, 1135.6, 1139.0, 1142.3, 1145.7, 1149.0, 1152.4, 1155.7, 1159.1, 1165.8, 1175.8, 1209.2, 1212.5, 1222.5, 1225.8, 1229.2, 1232.5, 1235.8, 1239.1, 1242.5 | Second overtone of C-H | ||
| 1249.1, 1255.7, 1259.0, 1269.0, 1275.6, 1298.7, 1351.3, 1387.3, 1390.5 | Second overtone of C-H + First overtone of C-H | ||
| 1539.2 | First overtone of O-H | ||
| 1609.4, 1634.8, 1644.3, 1679.0 | First overtone of C-H |
| Method | NO. | Wavelengths (nm) | Molecular Vibration |
|---|---|---|---|
| CARS | 7 | 890.5 | Second overtone of C-H |
| 1081.7, 1088.5 | Second overtone of C-H + Second overtone of C-C | ||
| 1155.7, 1159.1 | Second overtone of C-H | ||
| 1351.3, 1357.8 | Second overtone of C-H + First overtone of C-H |
| Model | Parameter | Accuracy of Calibration Set (CCR/%) | Accuracy of Prediction Set (CCR/%) |
|---|---|---|---|
| SNV-RFA-PLS-DA | 7 | 85.08 | 82.86 |
| SNV-UVE-PLS-DA | 26 | 90.16 | 85.71 |
| SNV-CARS-PLS-DA | 3 | 92.06 | 88.57 |
| SNV-RFA-LSSVM | (1, 1) | 93.65 | 90.48 |
| SNV-UVE-LSSVM | (0.6, 7) | 94.60 | 92.38 |
| SNV-CARS-LSSVM | (1.4, 5) | 94.92 | 93.33 |
| SNV-RFA-RF | (550, 14) | 94.60 | 93.33 |
| SNV-UVE-RF | (600, 17) | 96.83 | 95.24 |
| SNV-CARS-RF | (500, 15) | 98.41 | 97.14 |
| SNV-RFA-ELM | 79 | 95.56 | 95.24 |
| SNV-UVE-ELM | 67 | 98.73 | 97.14 |
| SNV-CARS-ELM | 42 | 99.05 | 98.10 |
© 2020 by the authors. Licensee MDPI, Basel, Switzerland. This article is an open access article distributed under the terms and conditions of the Creative Commons Attribution (CC BY) license (http://creativecommons.org/licenses/by/4.0/).
Share and Cite
Ye, R.; Chen, Y.; Guo, Y.; Duan, Q.; Li, D.; Liu, C. NIR Hyperspectral Imaging Technology Combined with Multivariate Methods to Identify Shrimp Freshness. Appl. Sci. 2020, 10, 5498. https://doi.org/10.3390/app10165498
Ye R, Chen Y, Guo Y, Duan Q, Li D, Liu C. NIR Hyperspectral Imaging Technology Combined with Multivariate Methods to Identify Shrimp Freshness. Applied Sciences. 2020; 10(16):5498. https://doi.org/10.3390/app10165498
Chicago/Turabian StyleYe, Rongke, Yingyi Chen, Yuchen Guo, Qingling Duan, Daoliang Li, and Chunhong Liu. 2020. "NIR Hyperspectral Imaging Technology Combined with Multivariate Methods to Identify Shrimp Freshness" Applied Sciences 10, no. 16: 5498. https://doi.org/10.3390/app10165498
APA StyleYe, R., Chen, Y., Guo, Y., Duan, Q., Li, D., & Liu, C. (2020). NIR Hyperspectral Imaging Technology Combined with Multivariate Methods to Identify Shrimp Freshness. Applied Sciences, 10(16), 5498. https://doi.org/10.3390/app10165498


