Bi-Directional Static Load Tests of Pile Models


Abstract
1. Introduction
2. Methodology
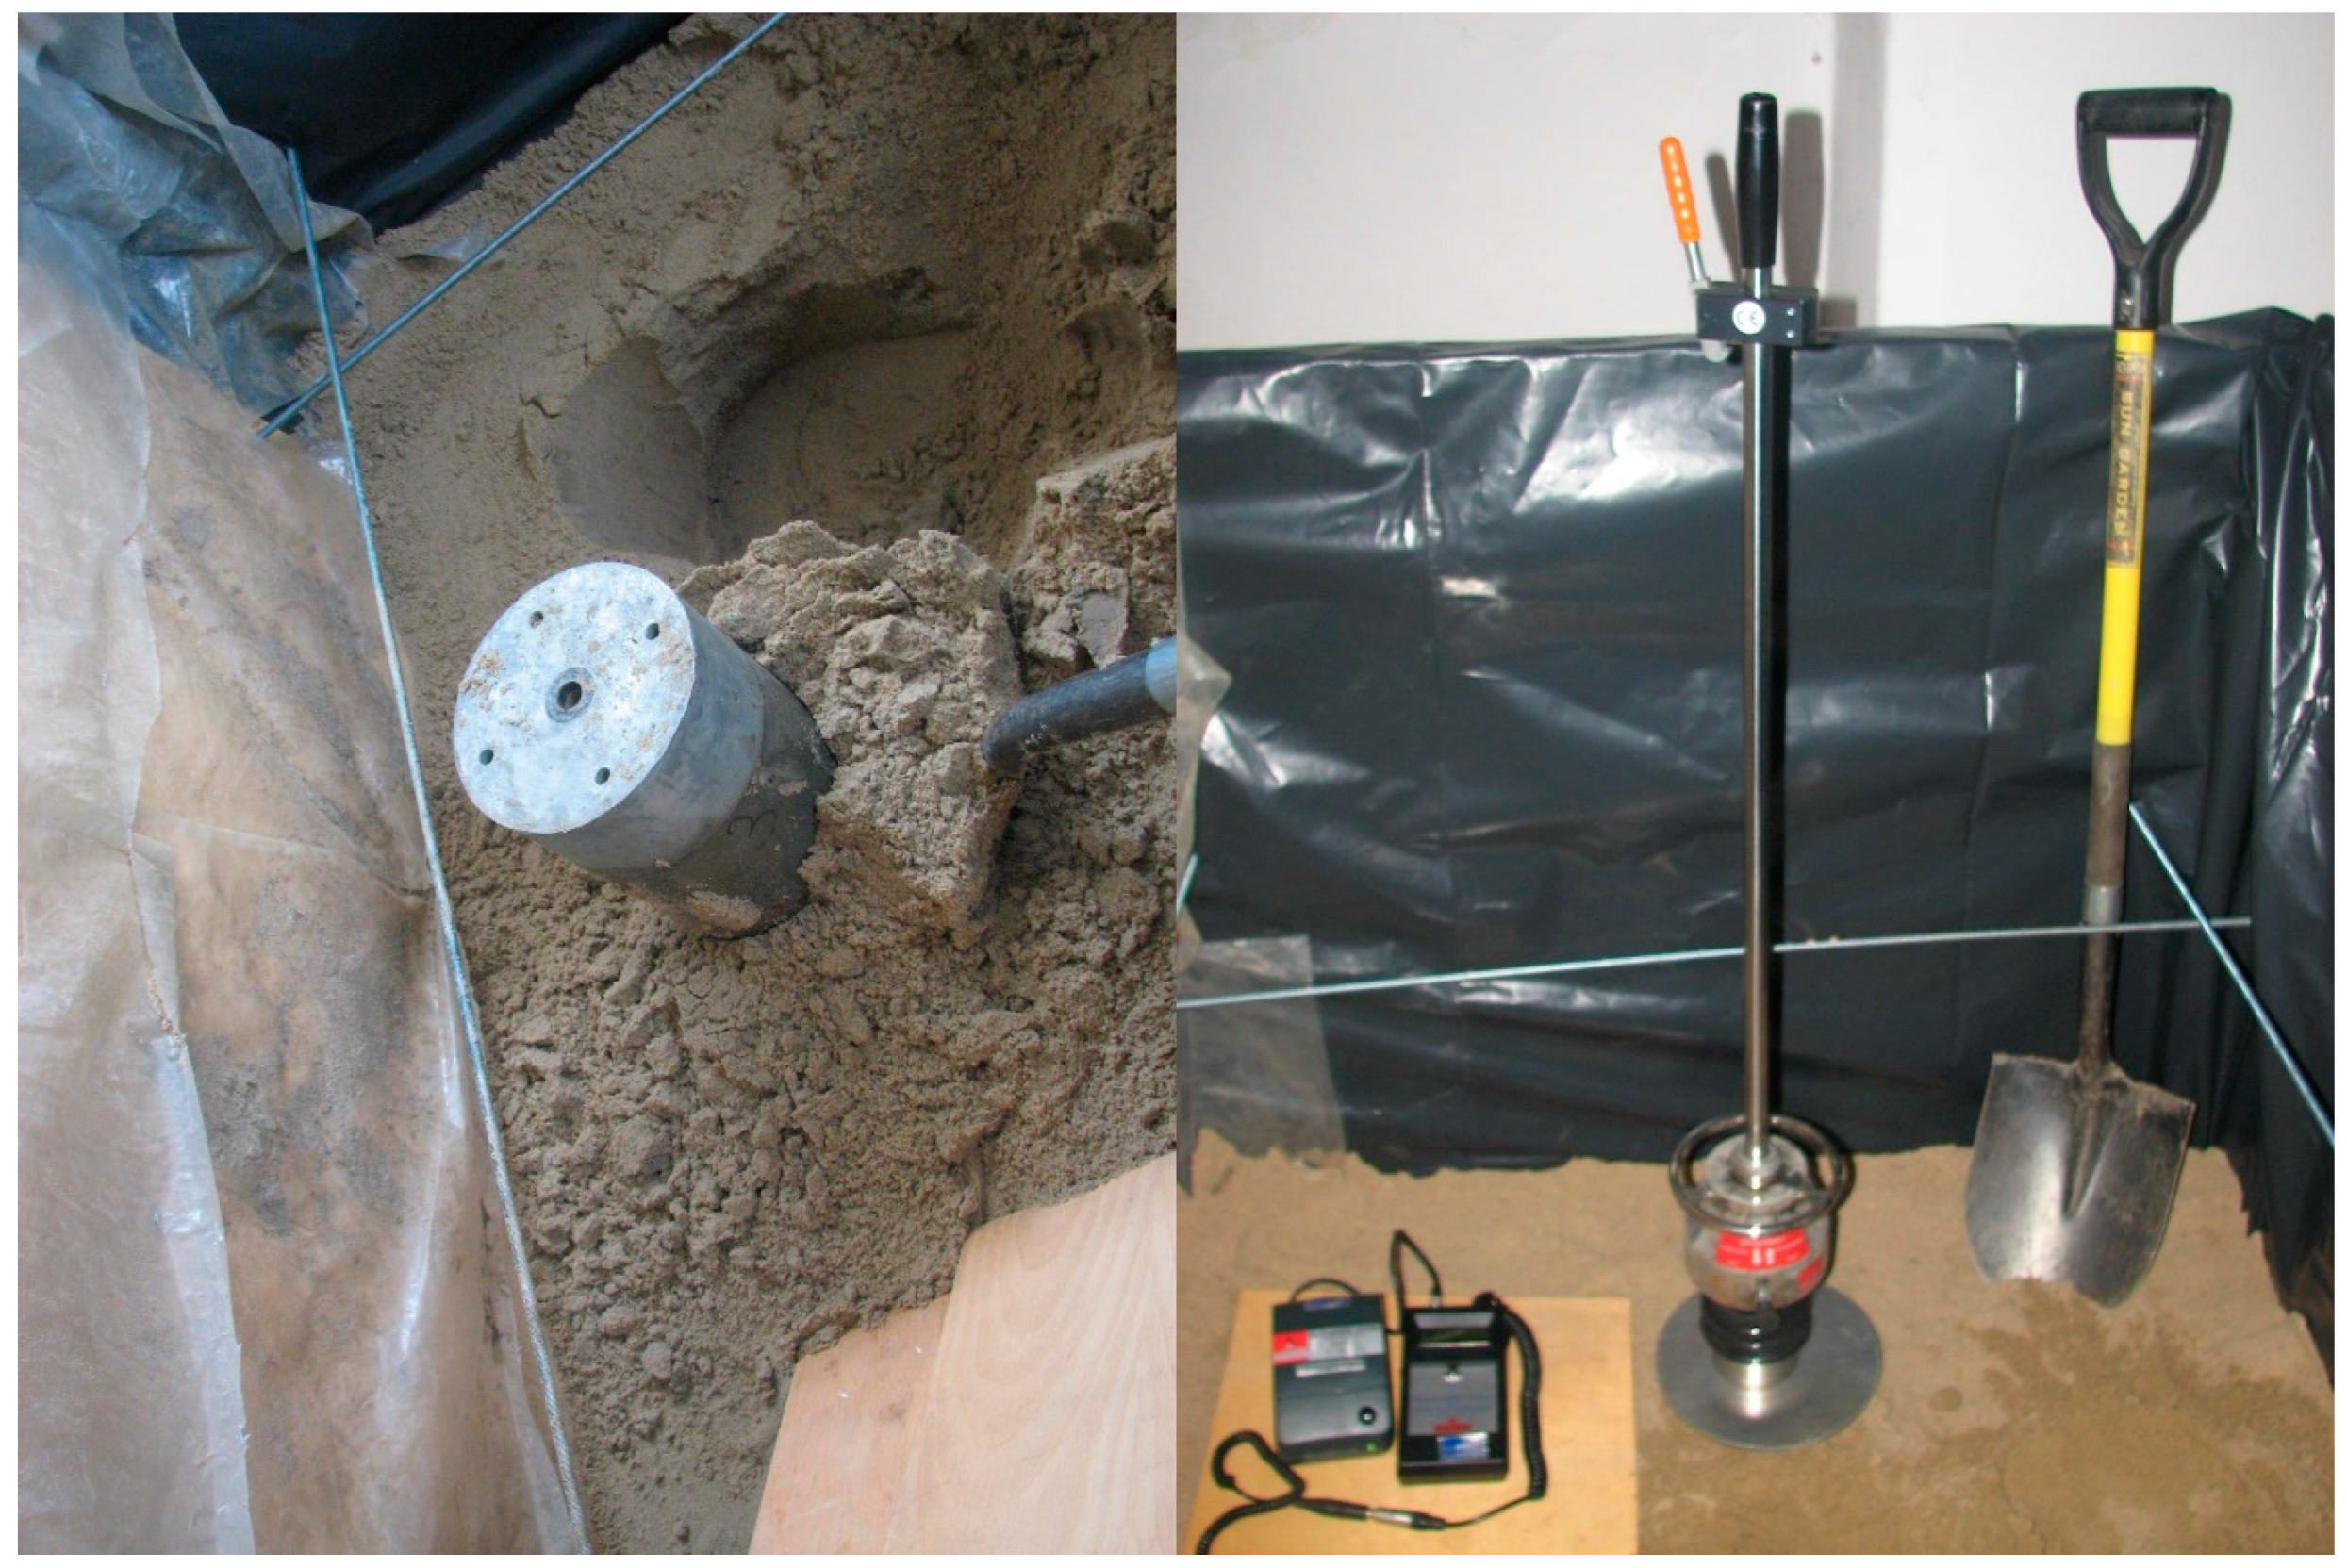
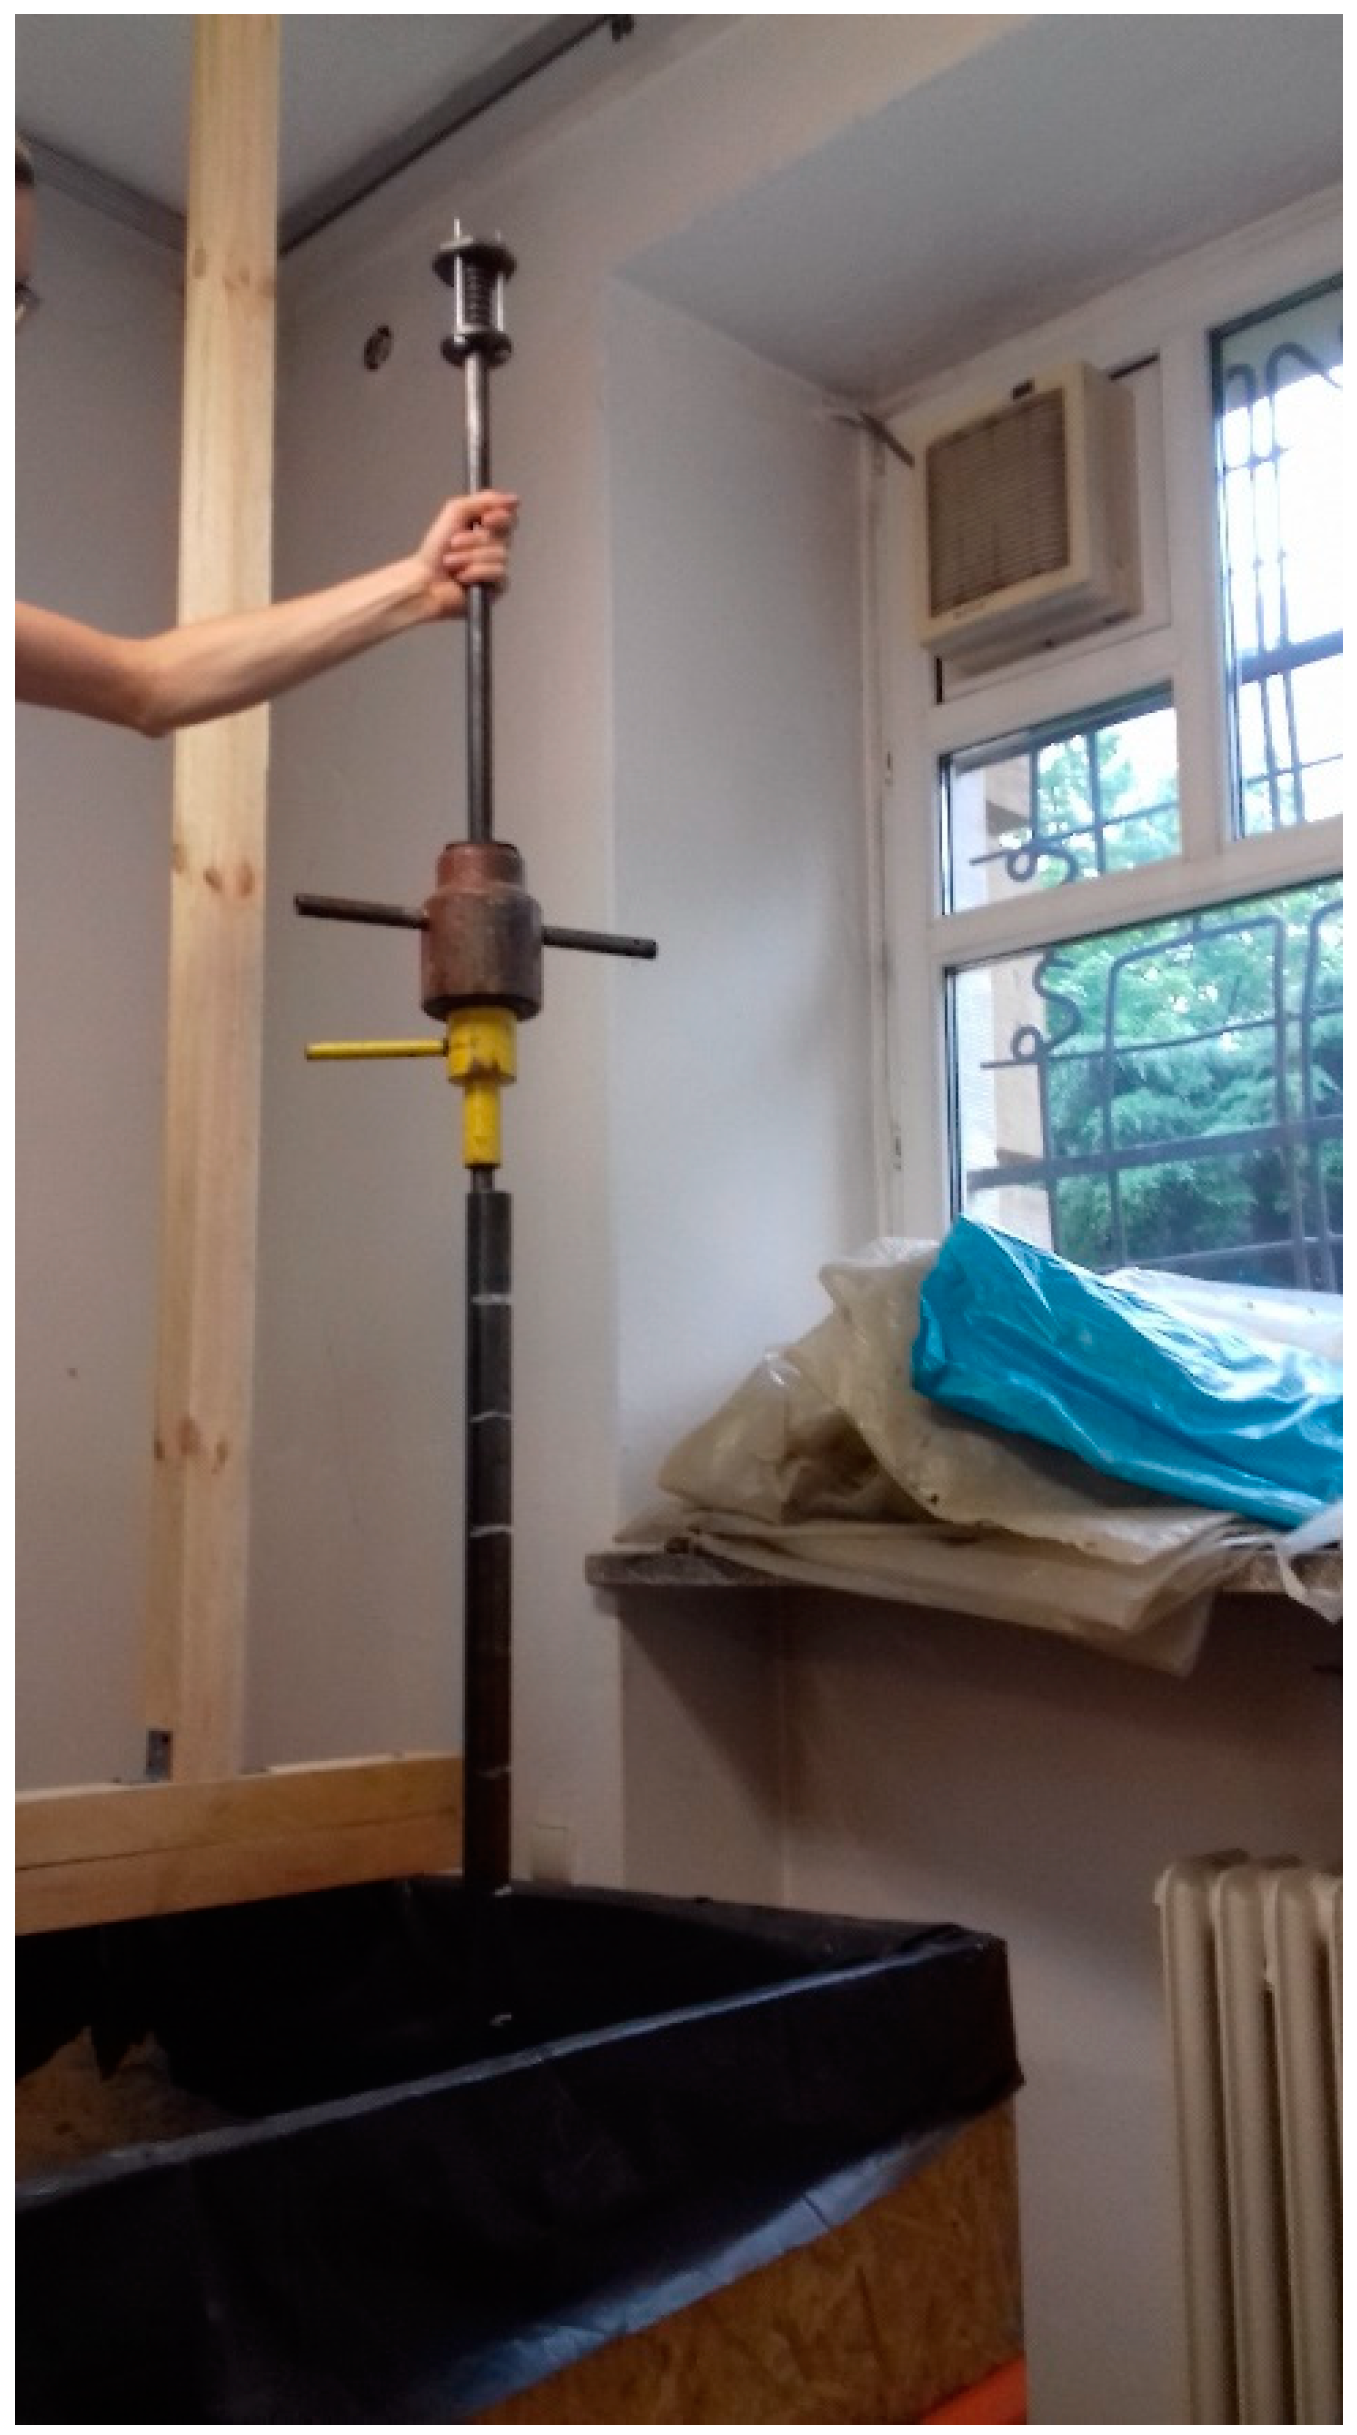
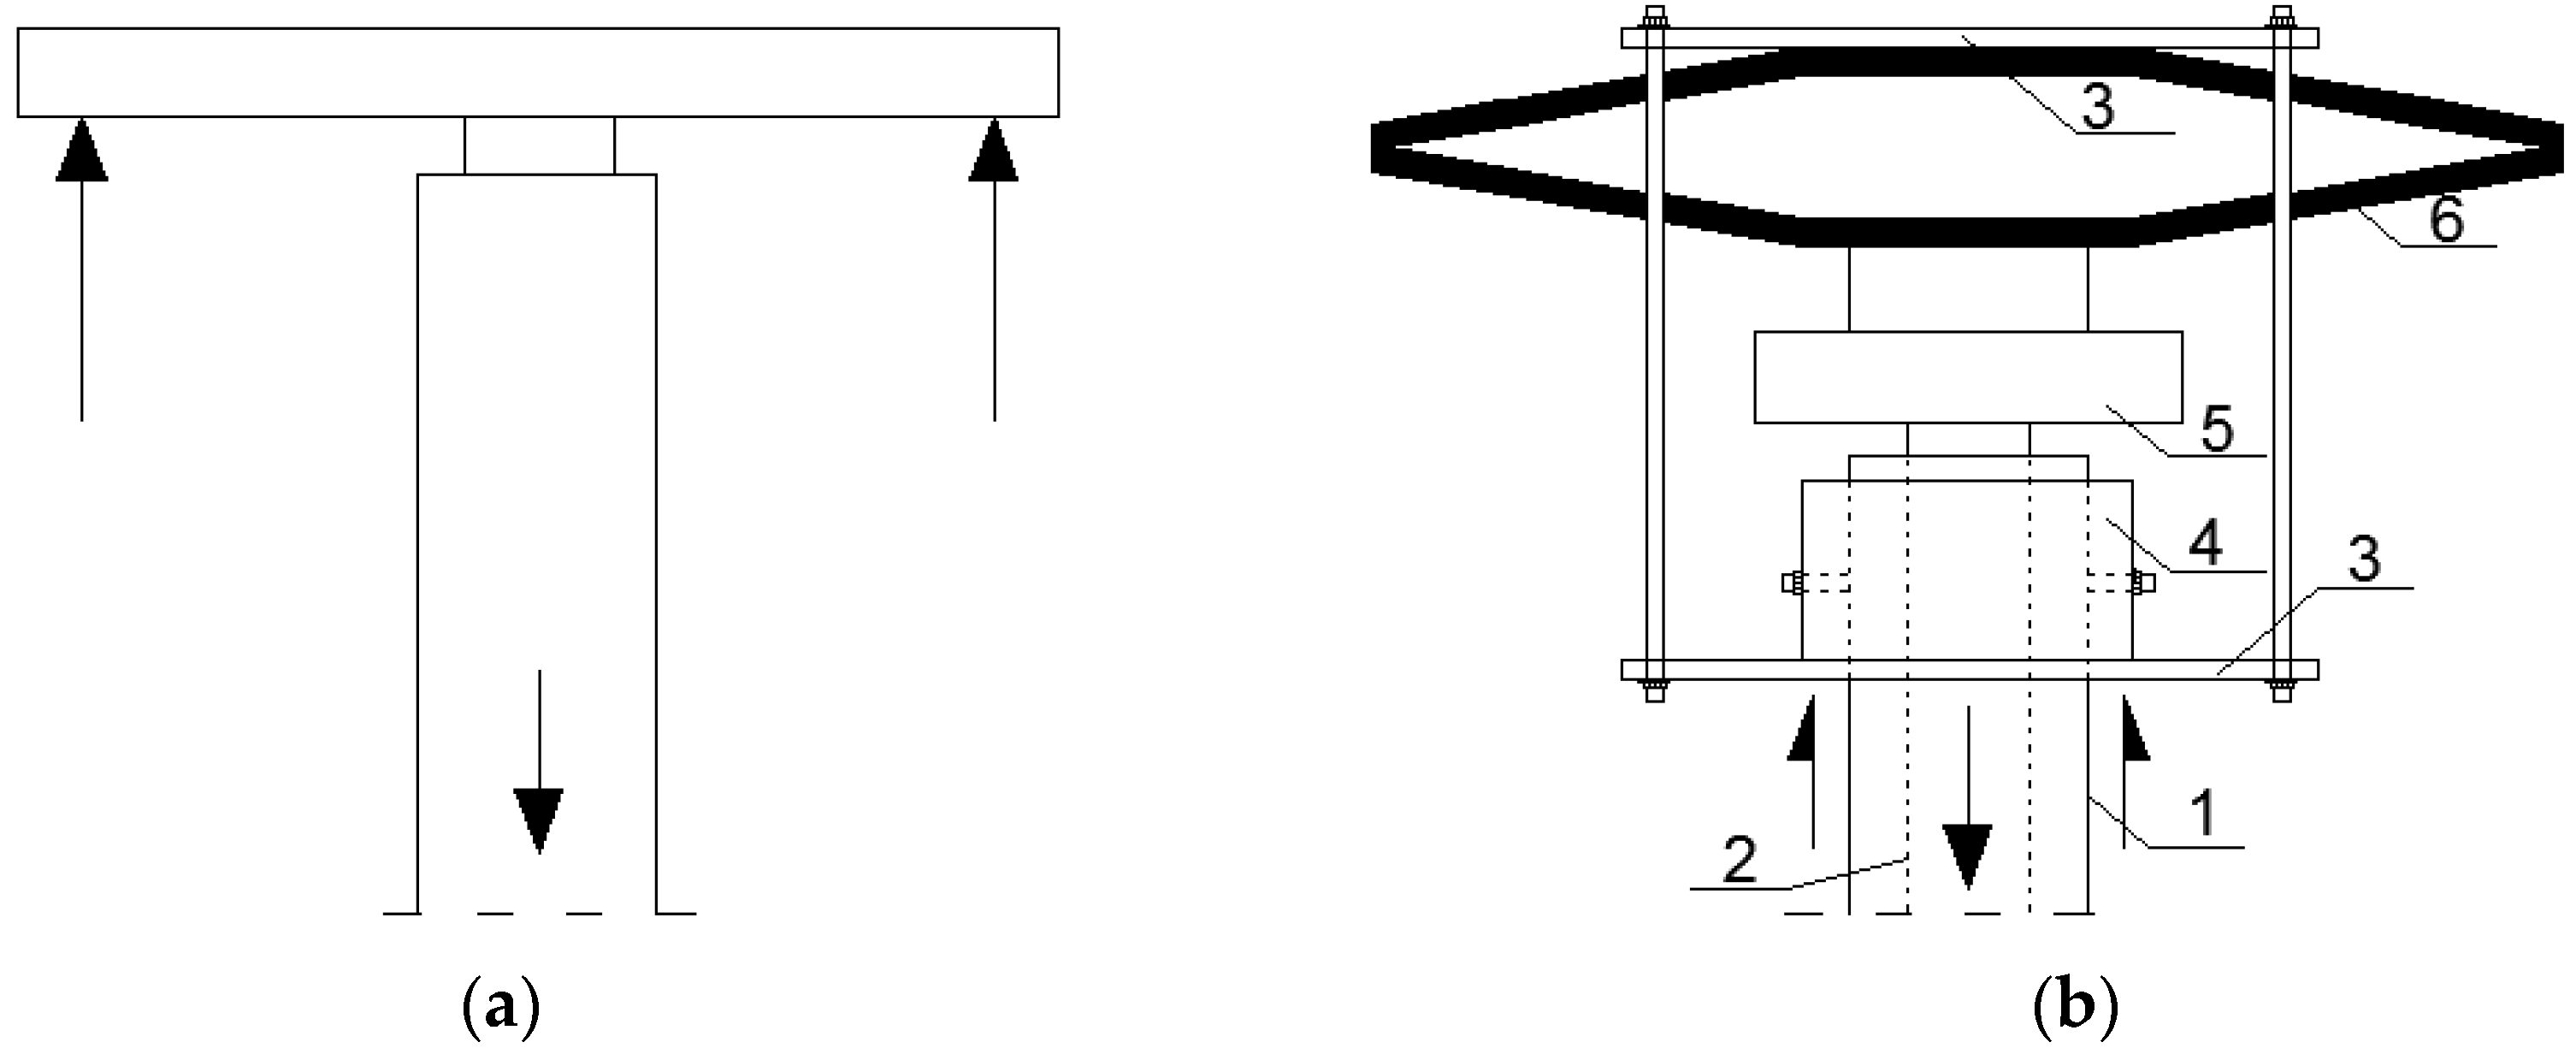
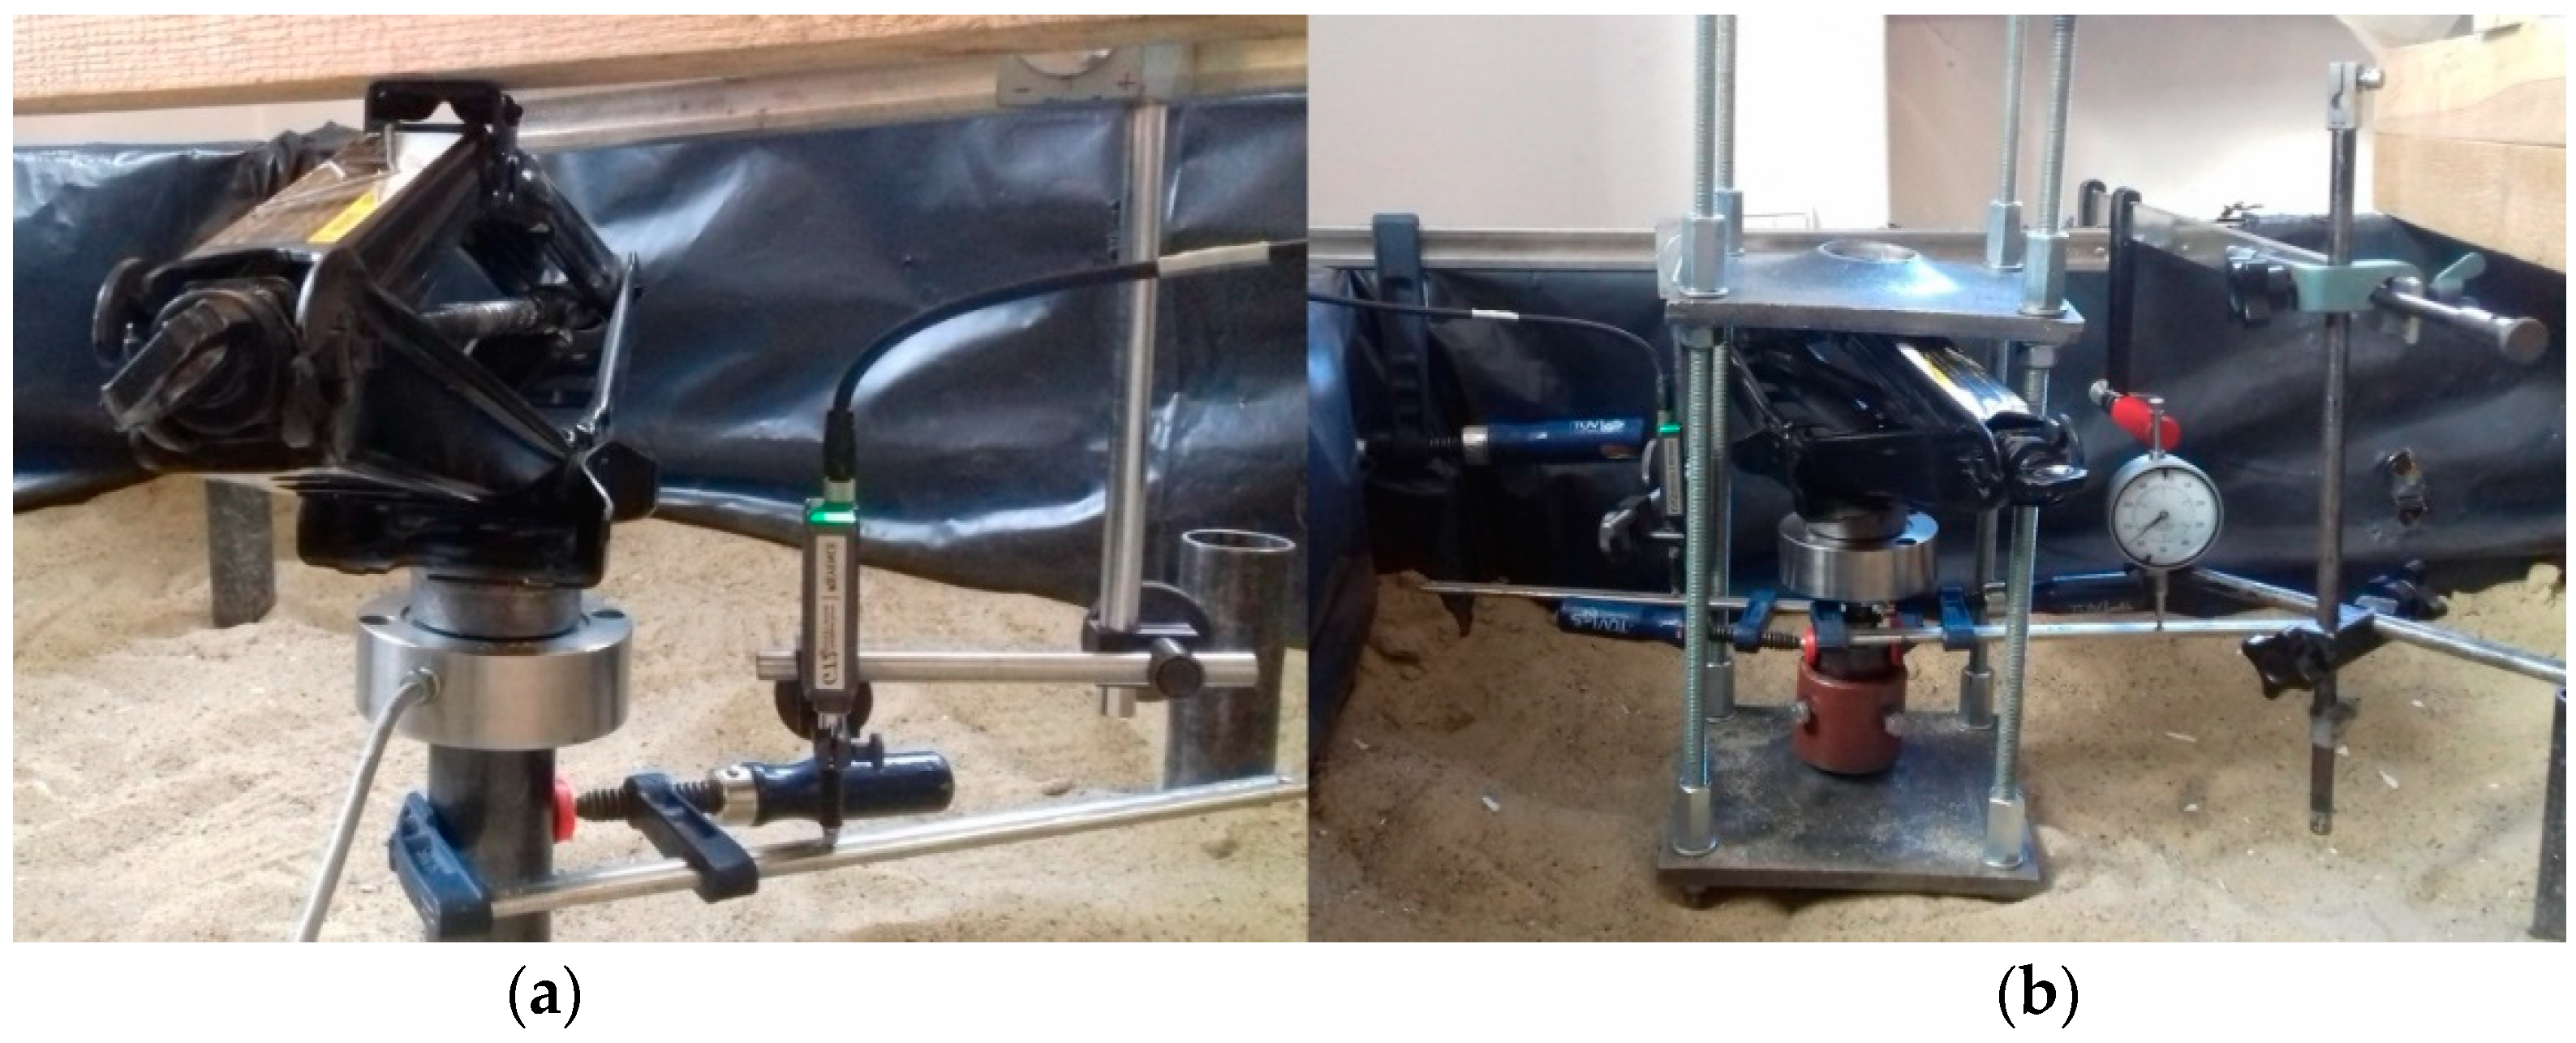
2.1. Test Setup
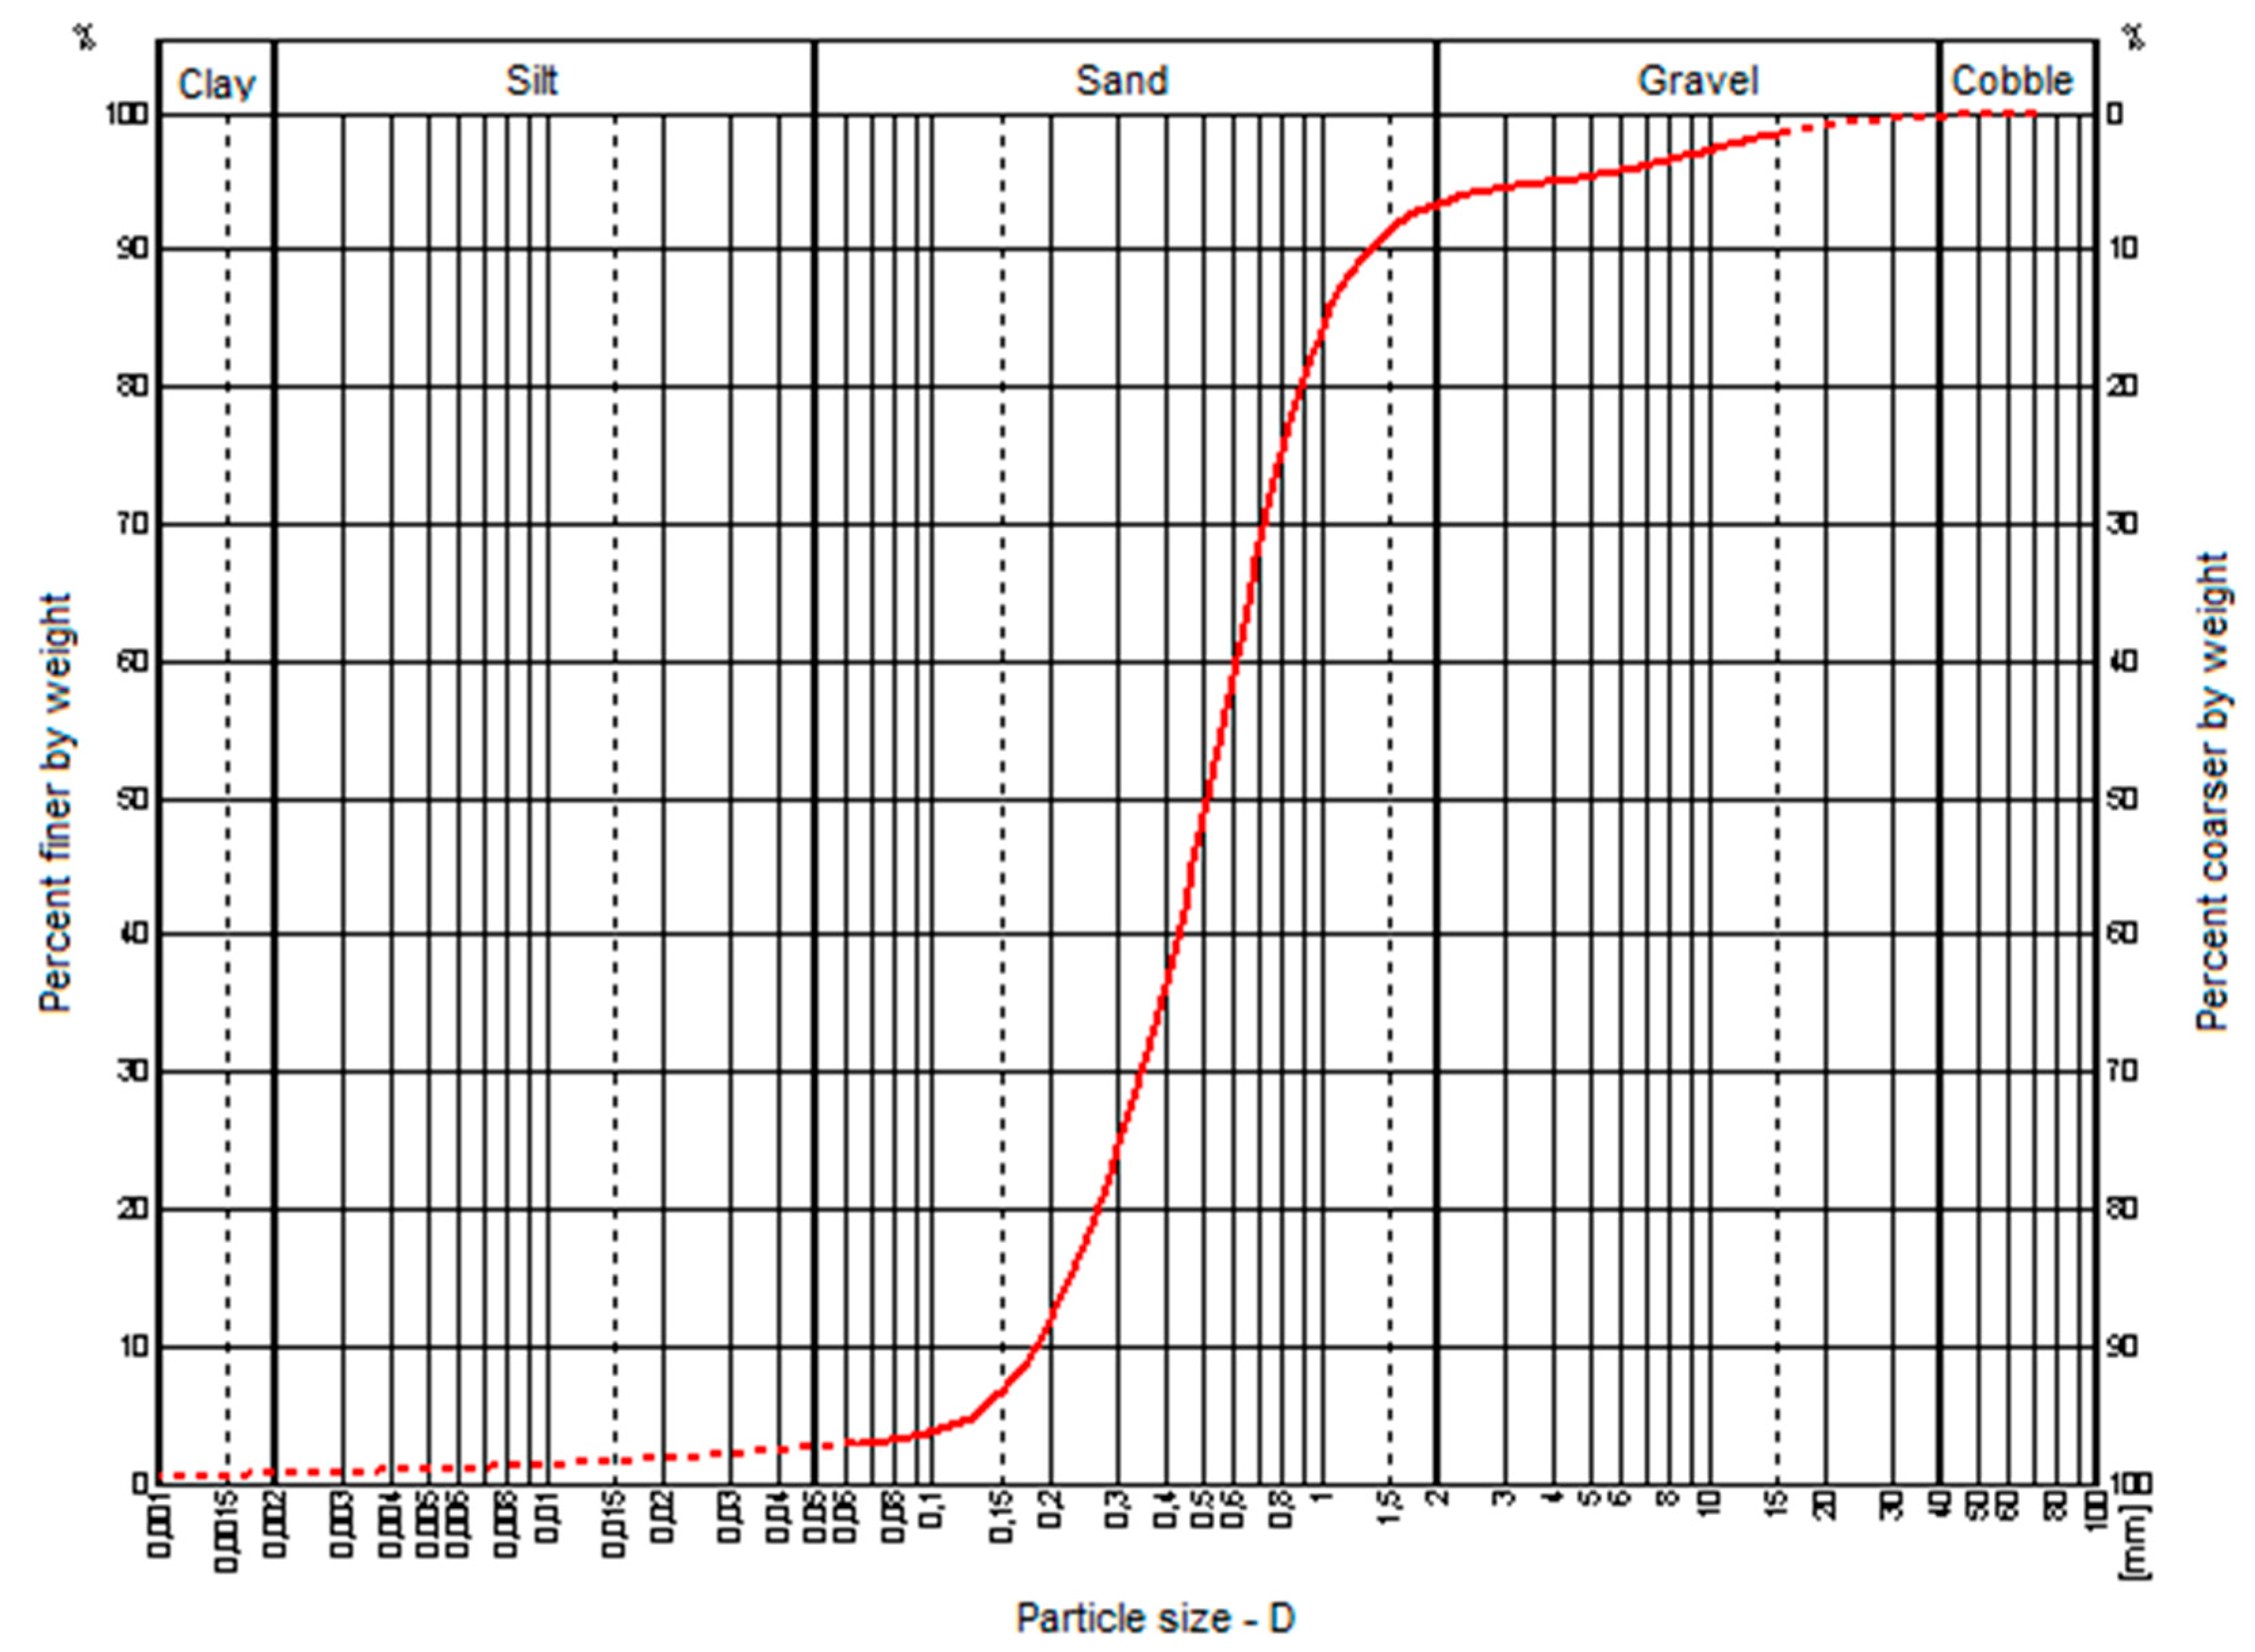
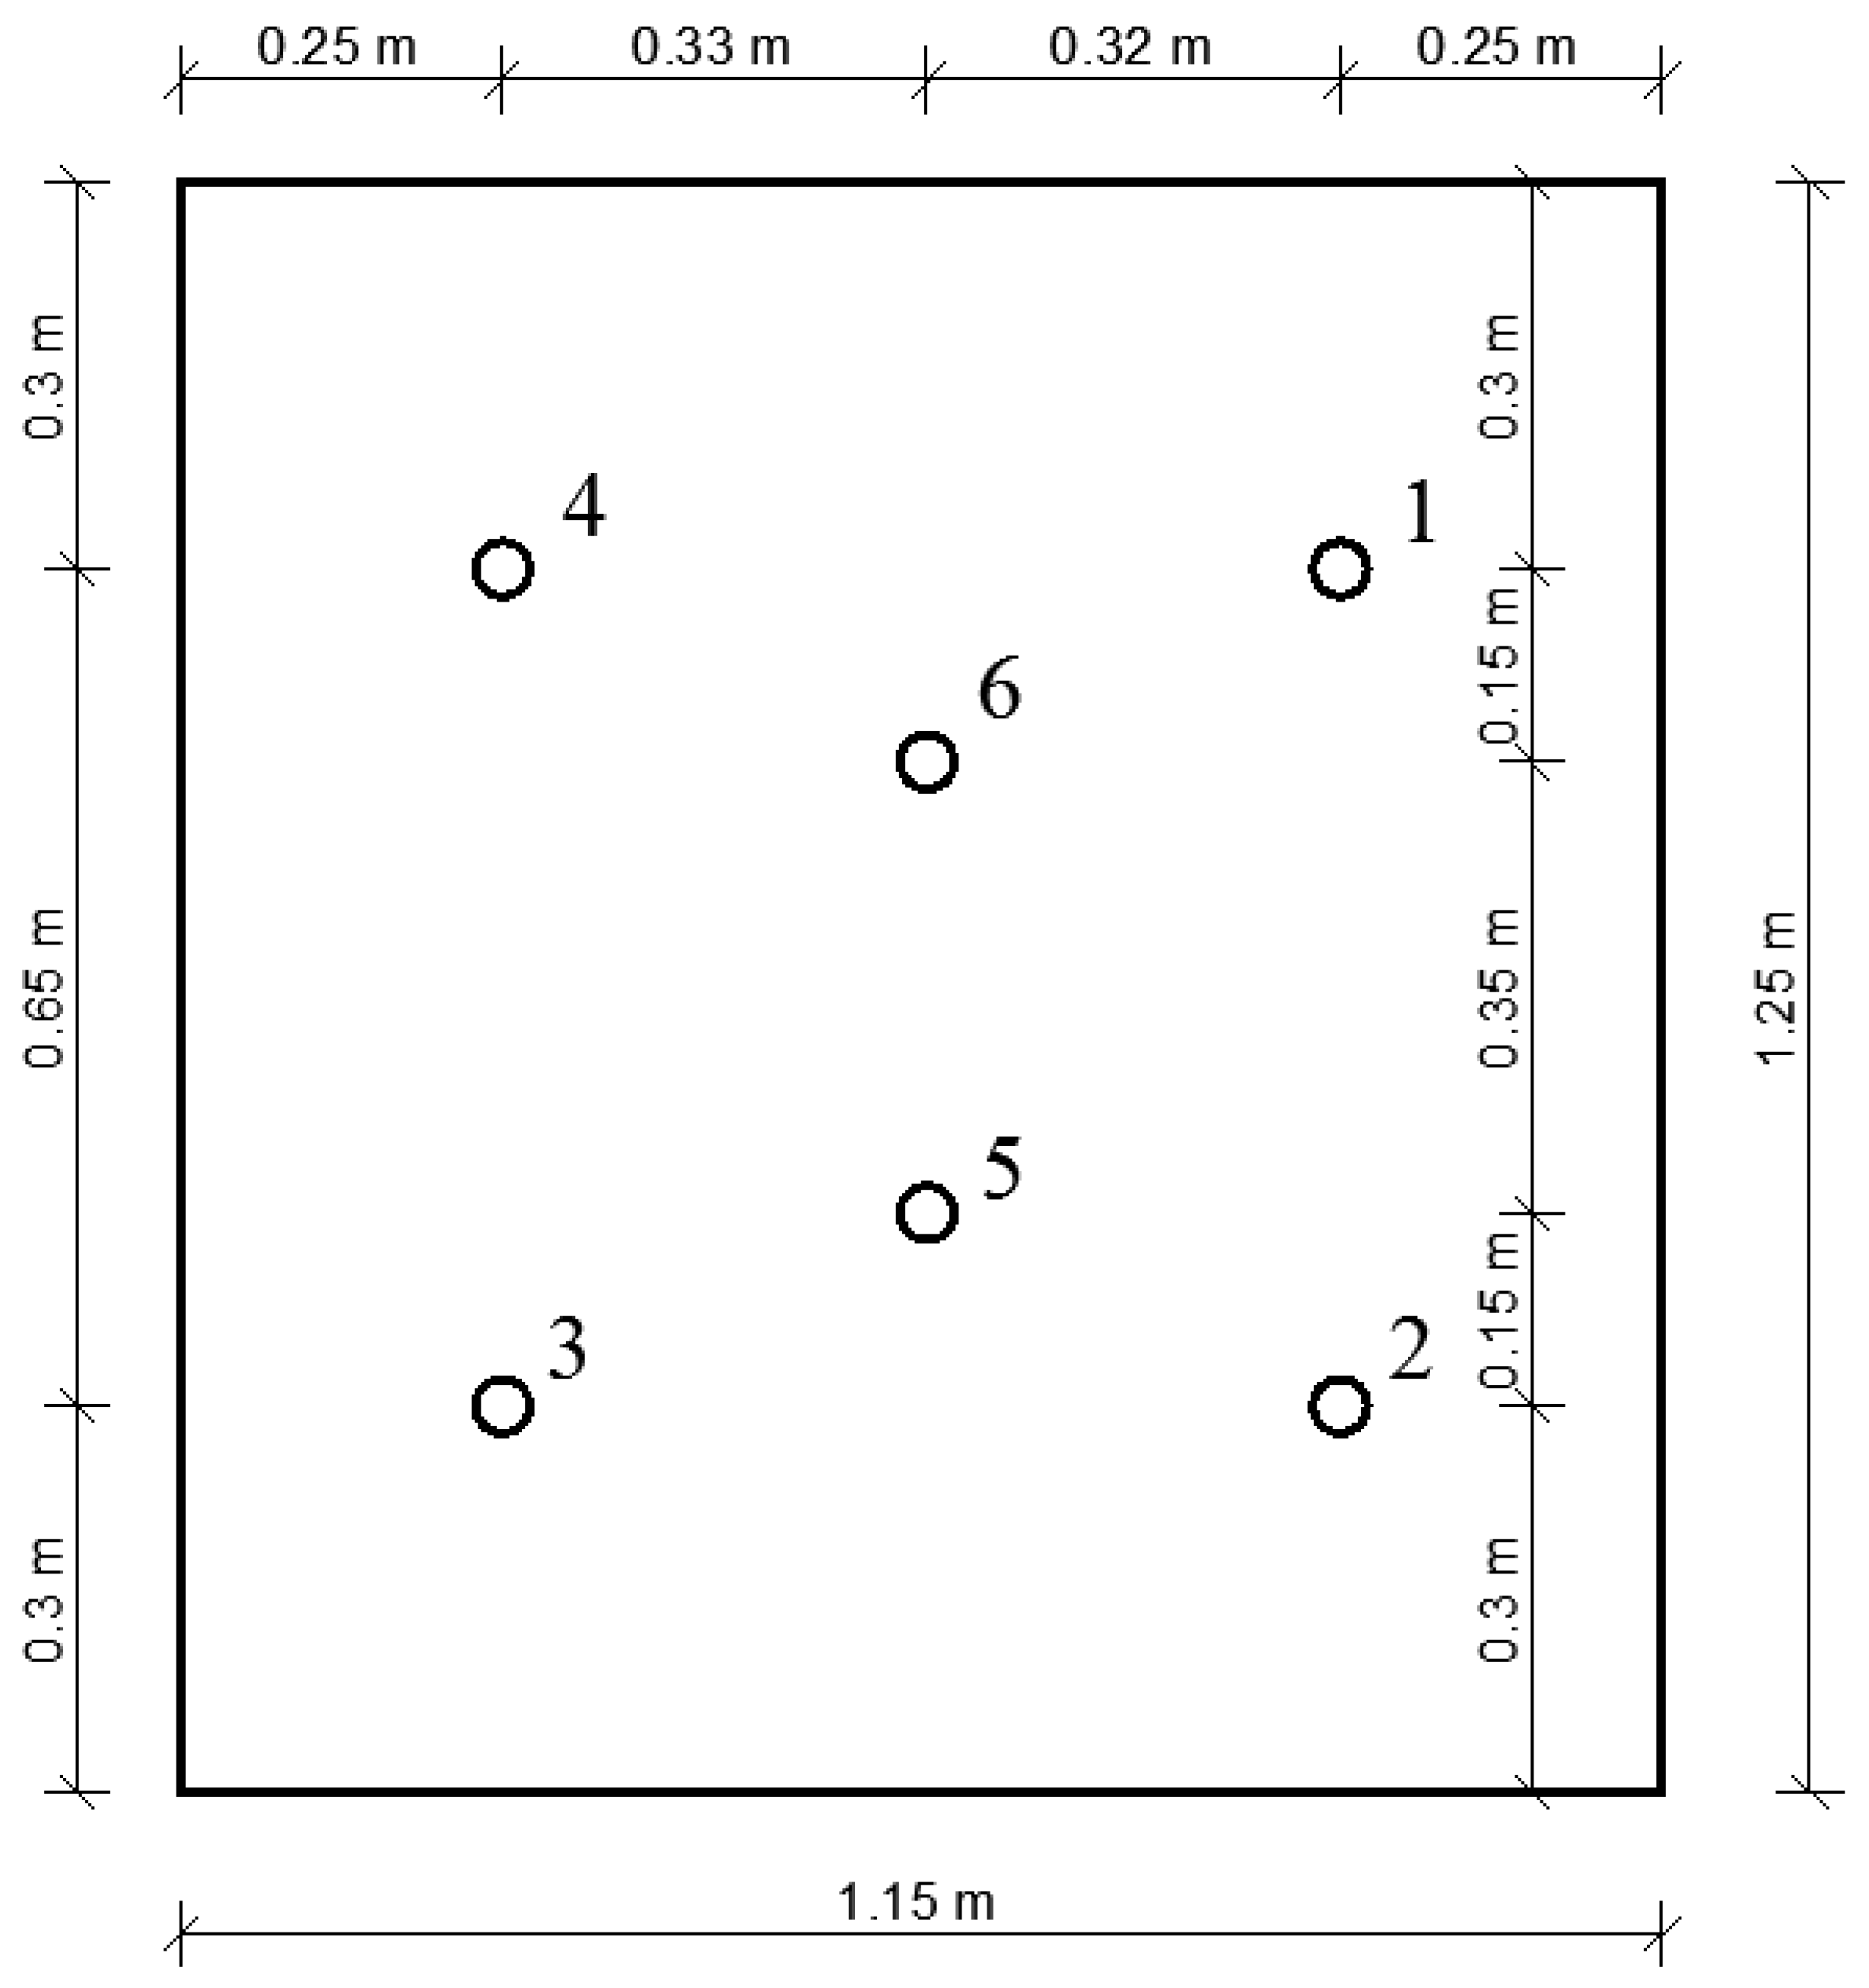
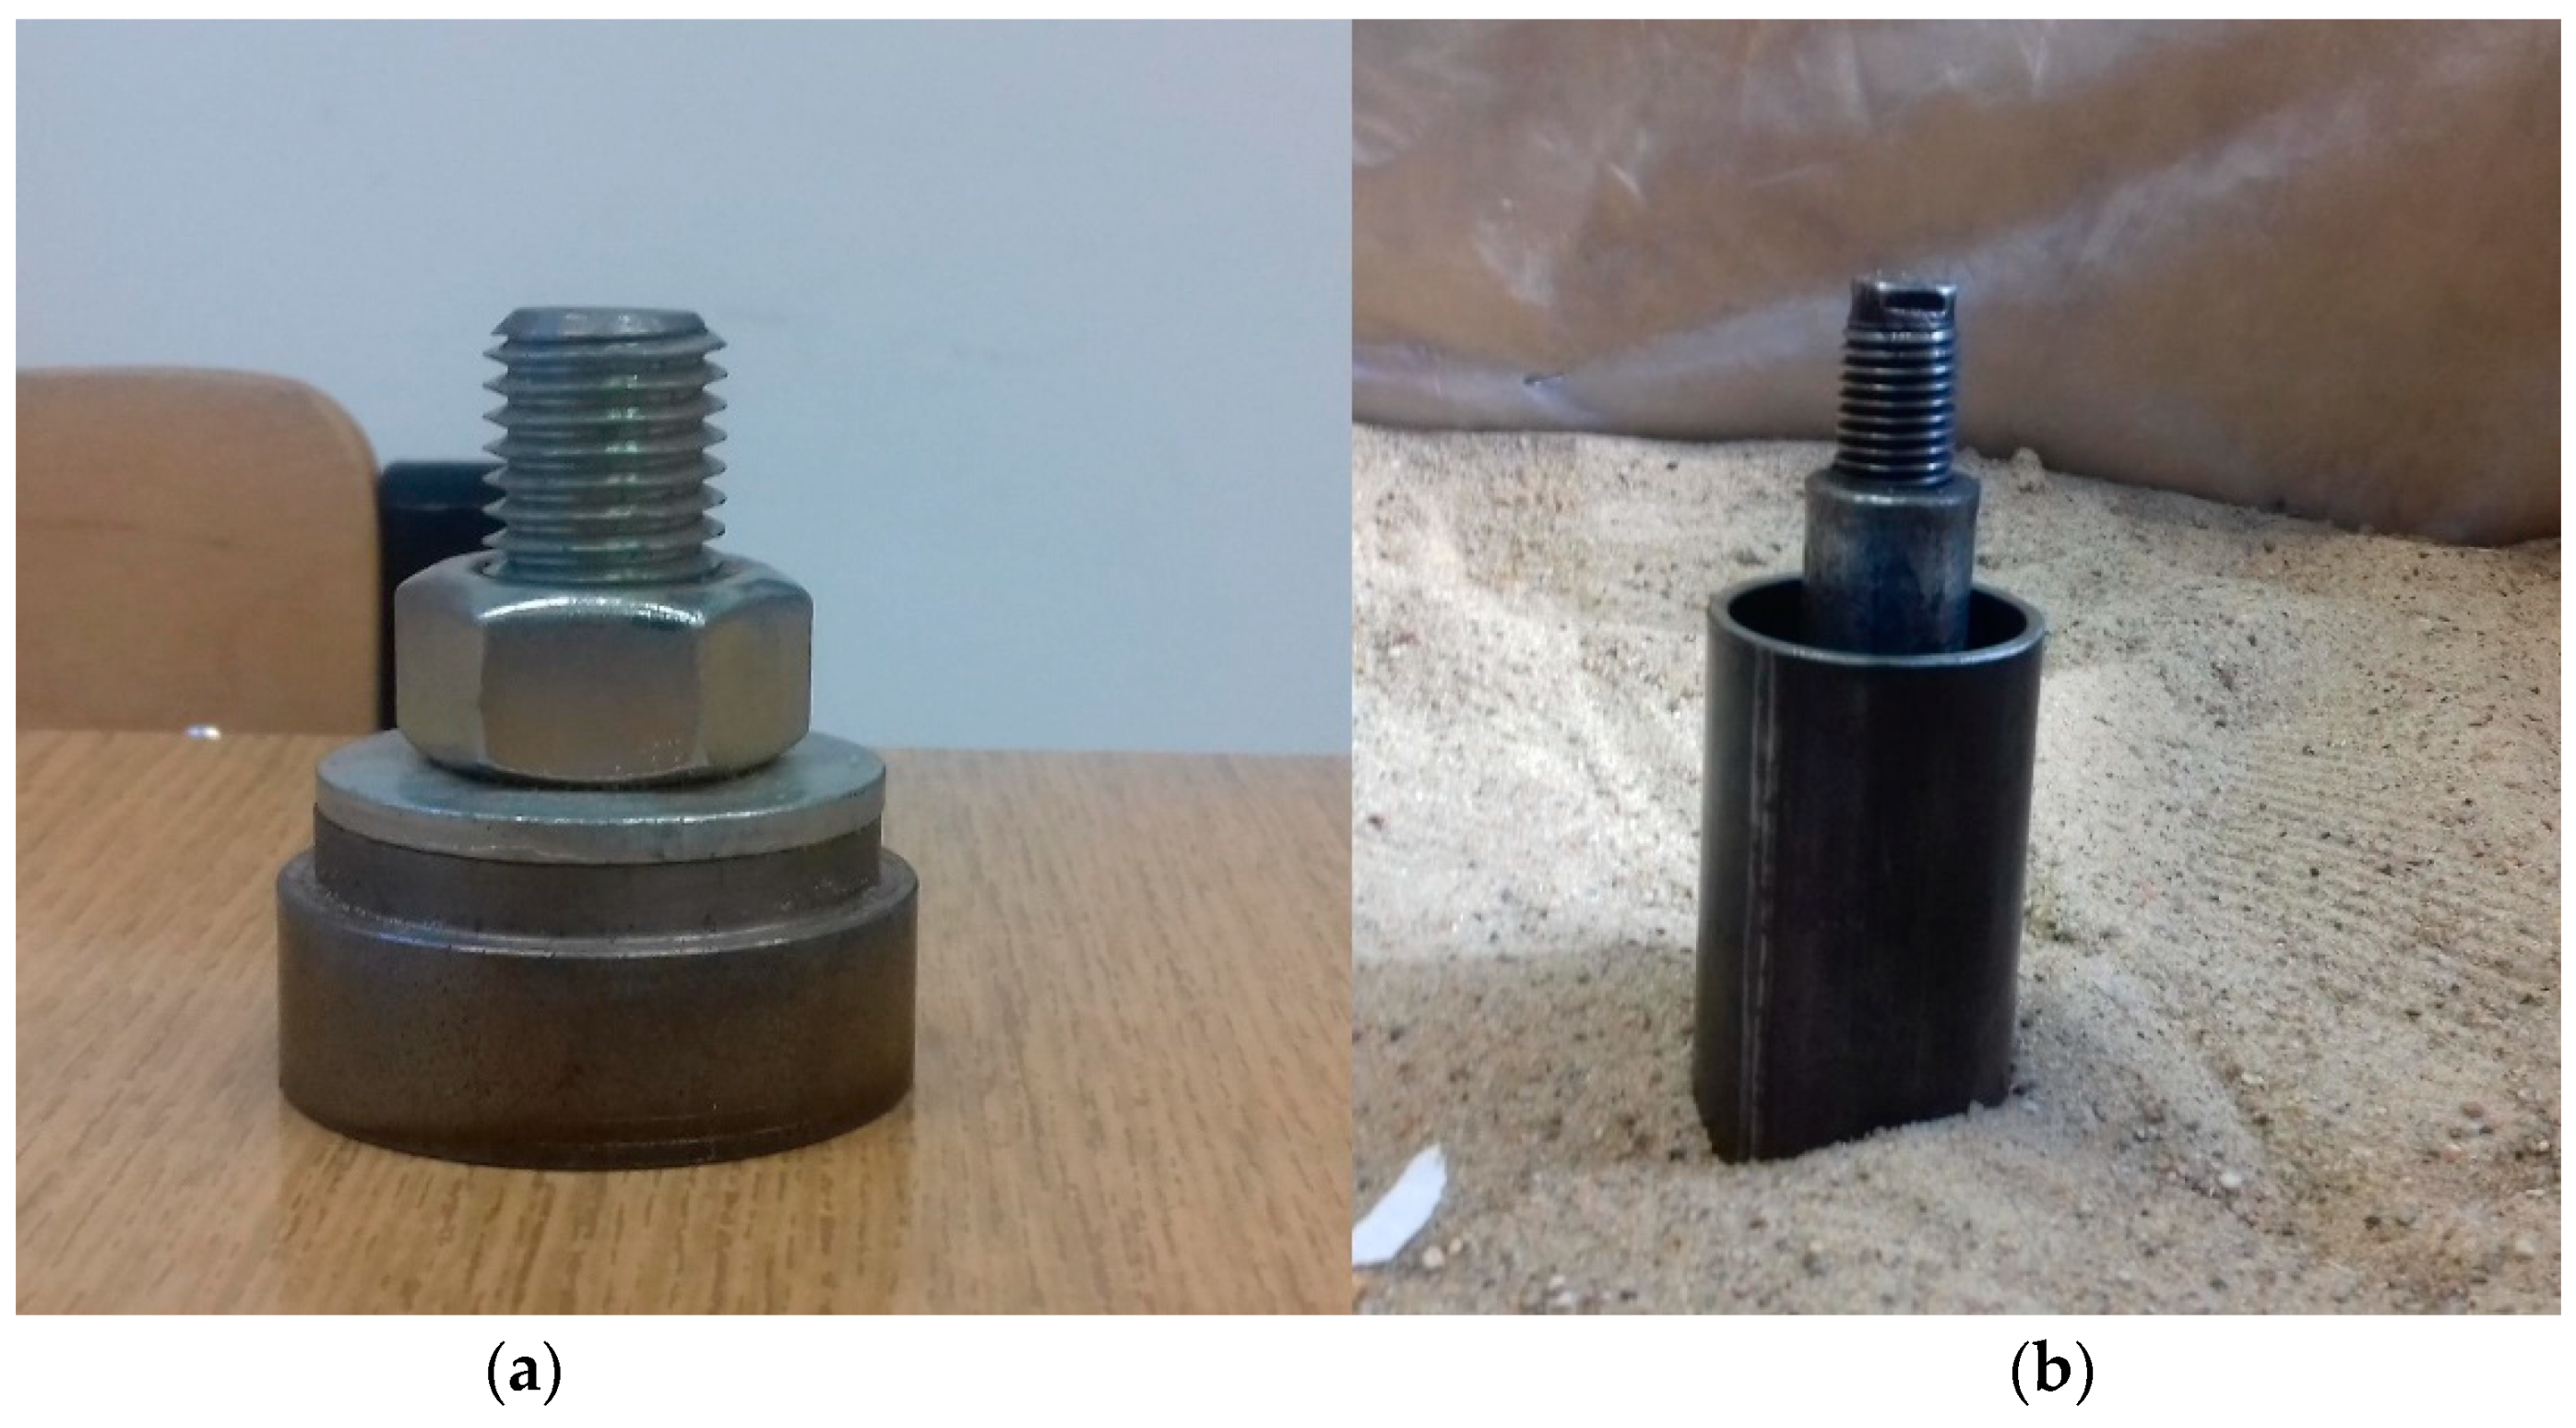
2.2. Pile Models
2.3. Measuring Information
3. Testing Program
3.1. Traditional, Compression Static Load Tests
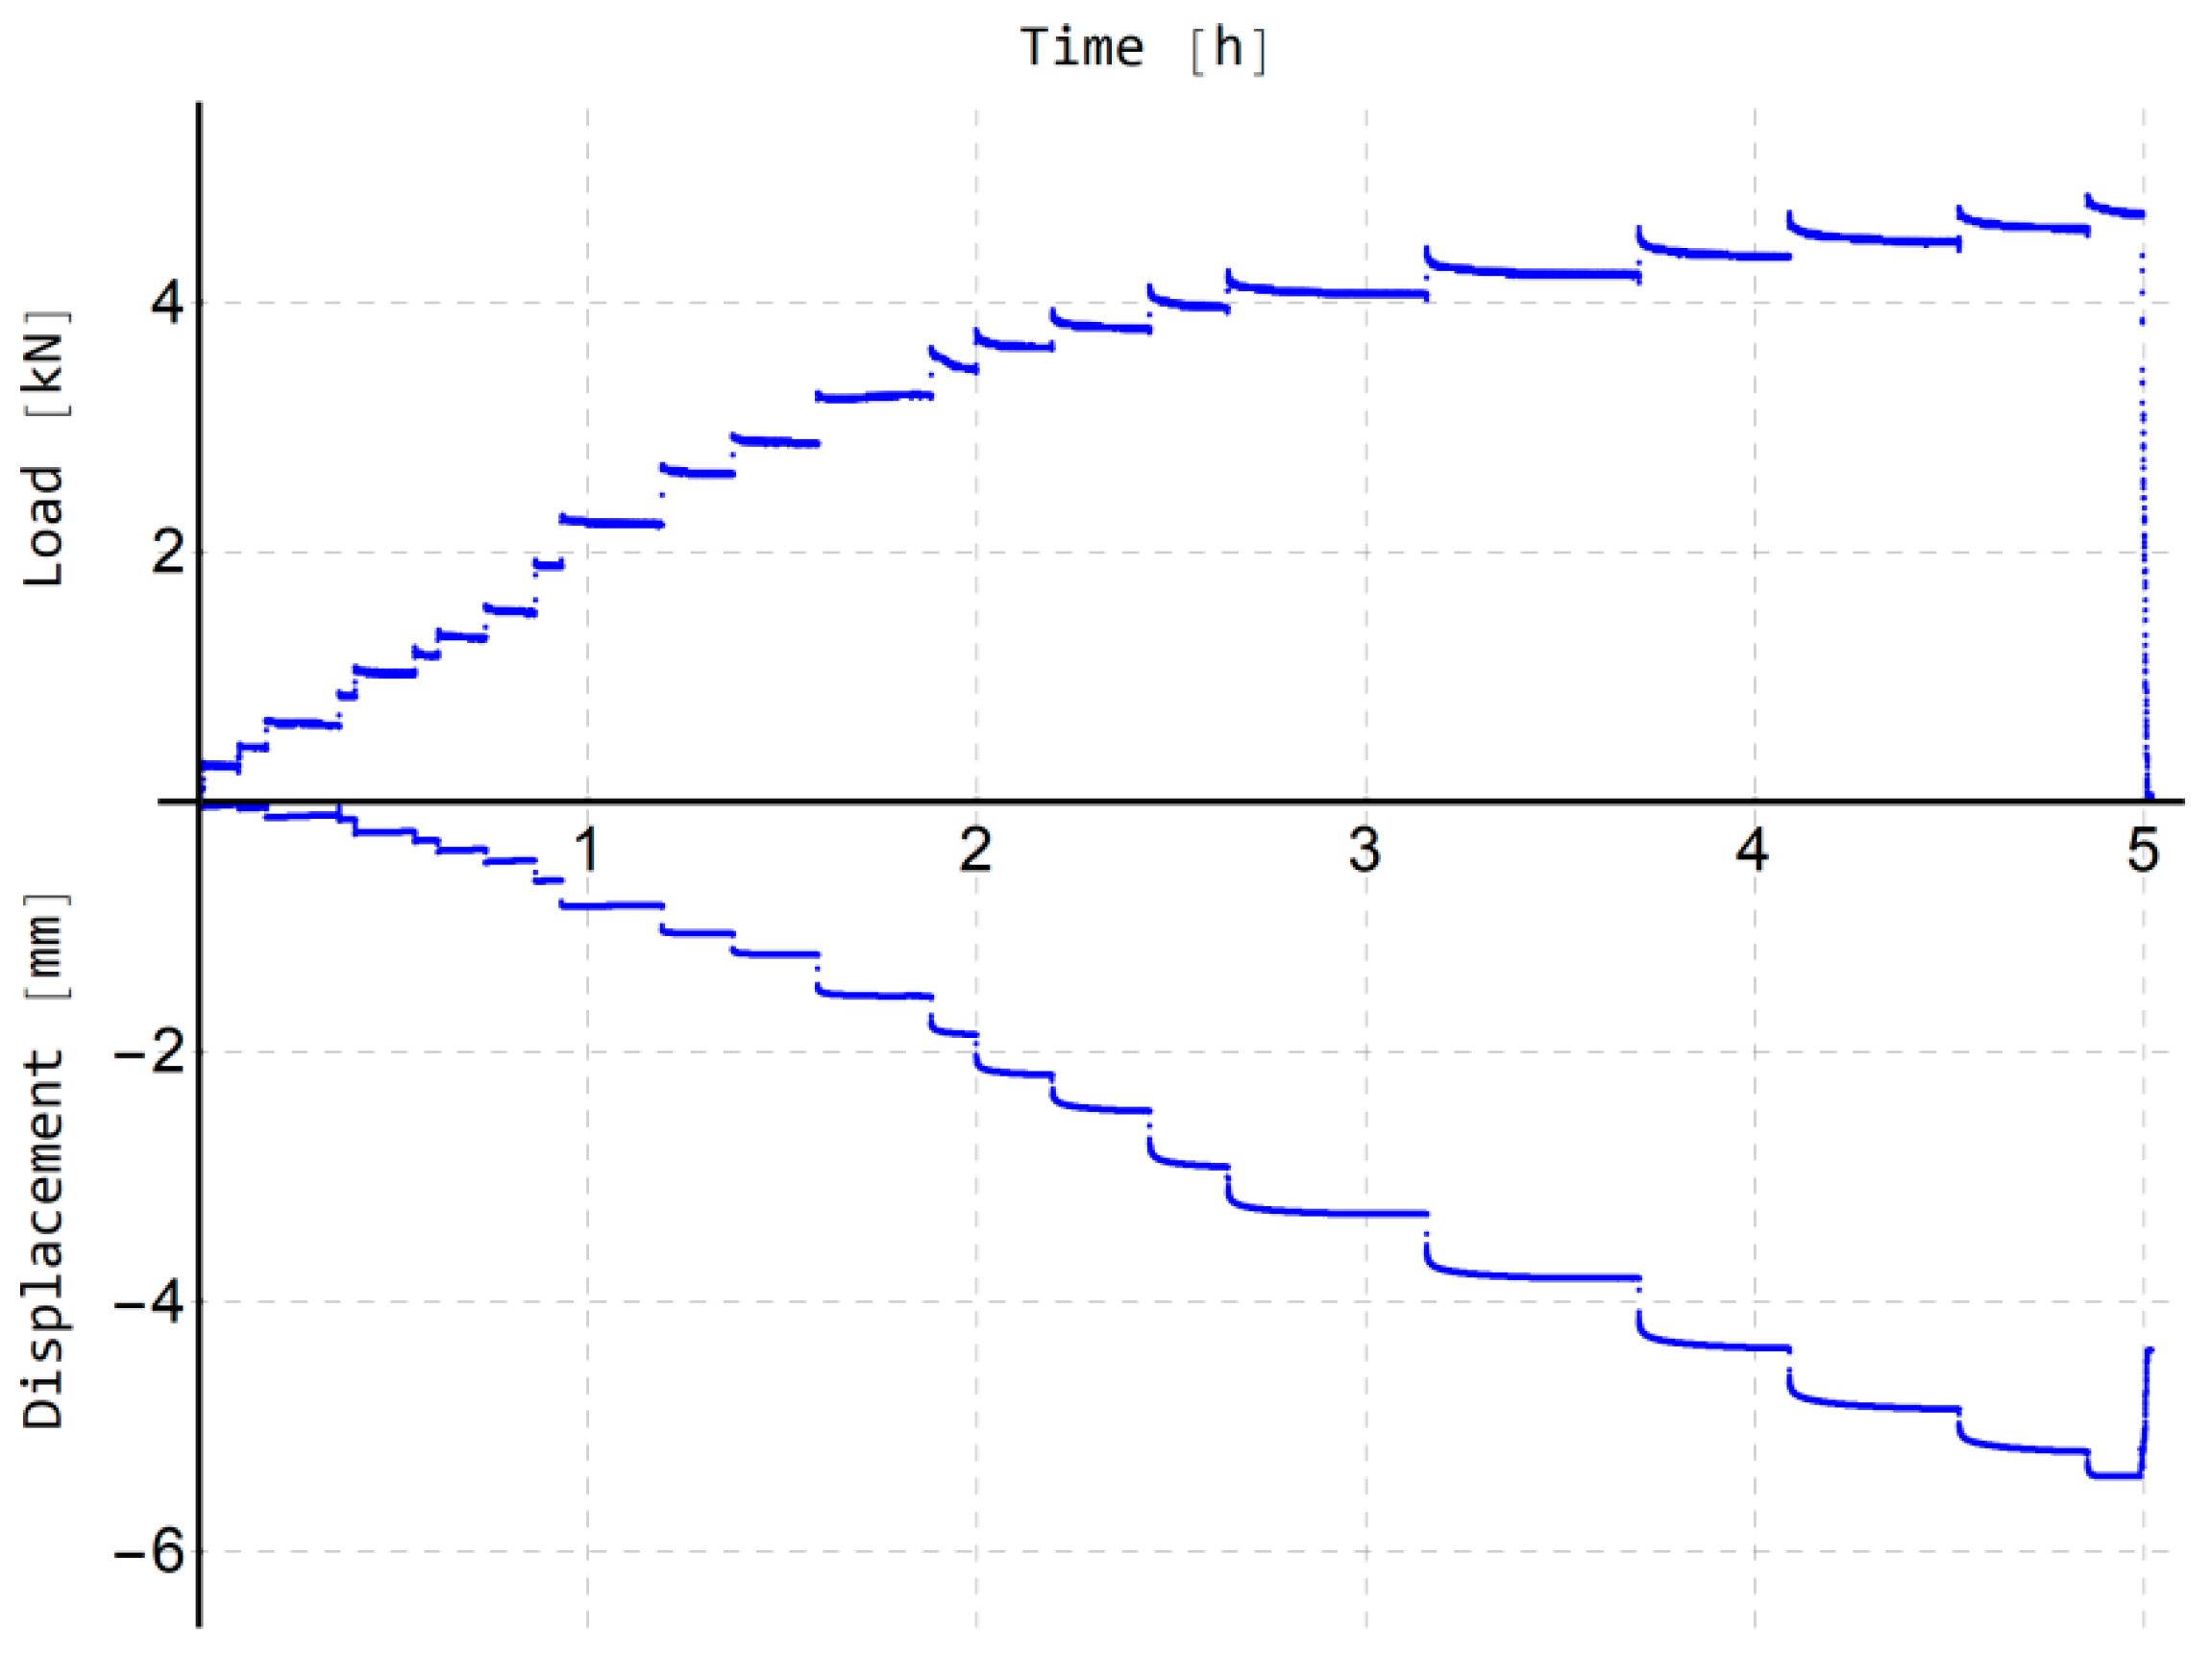
3.2. Bi-Directional Static Load Tests
4. Bearing Capacity Analysis
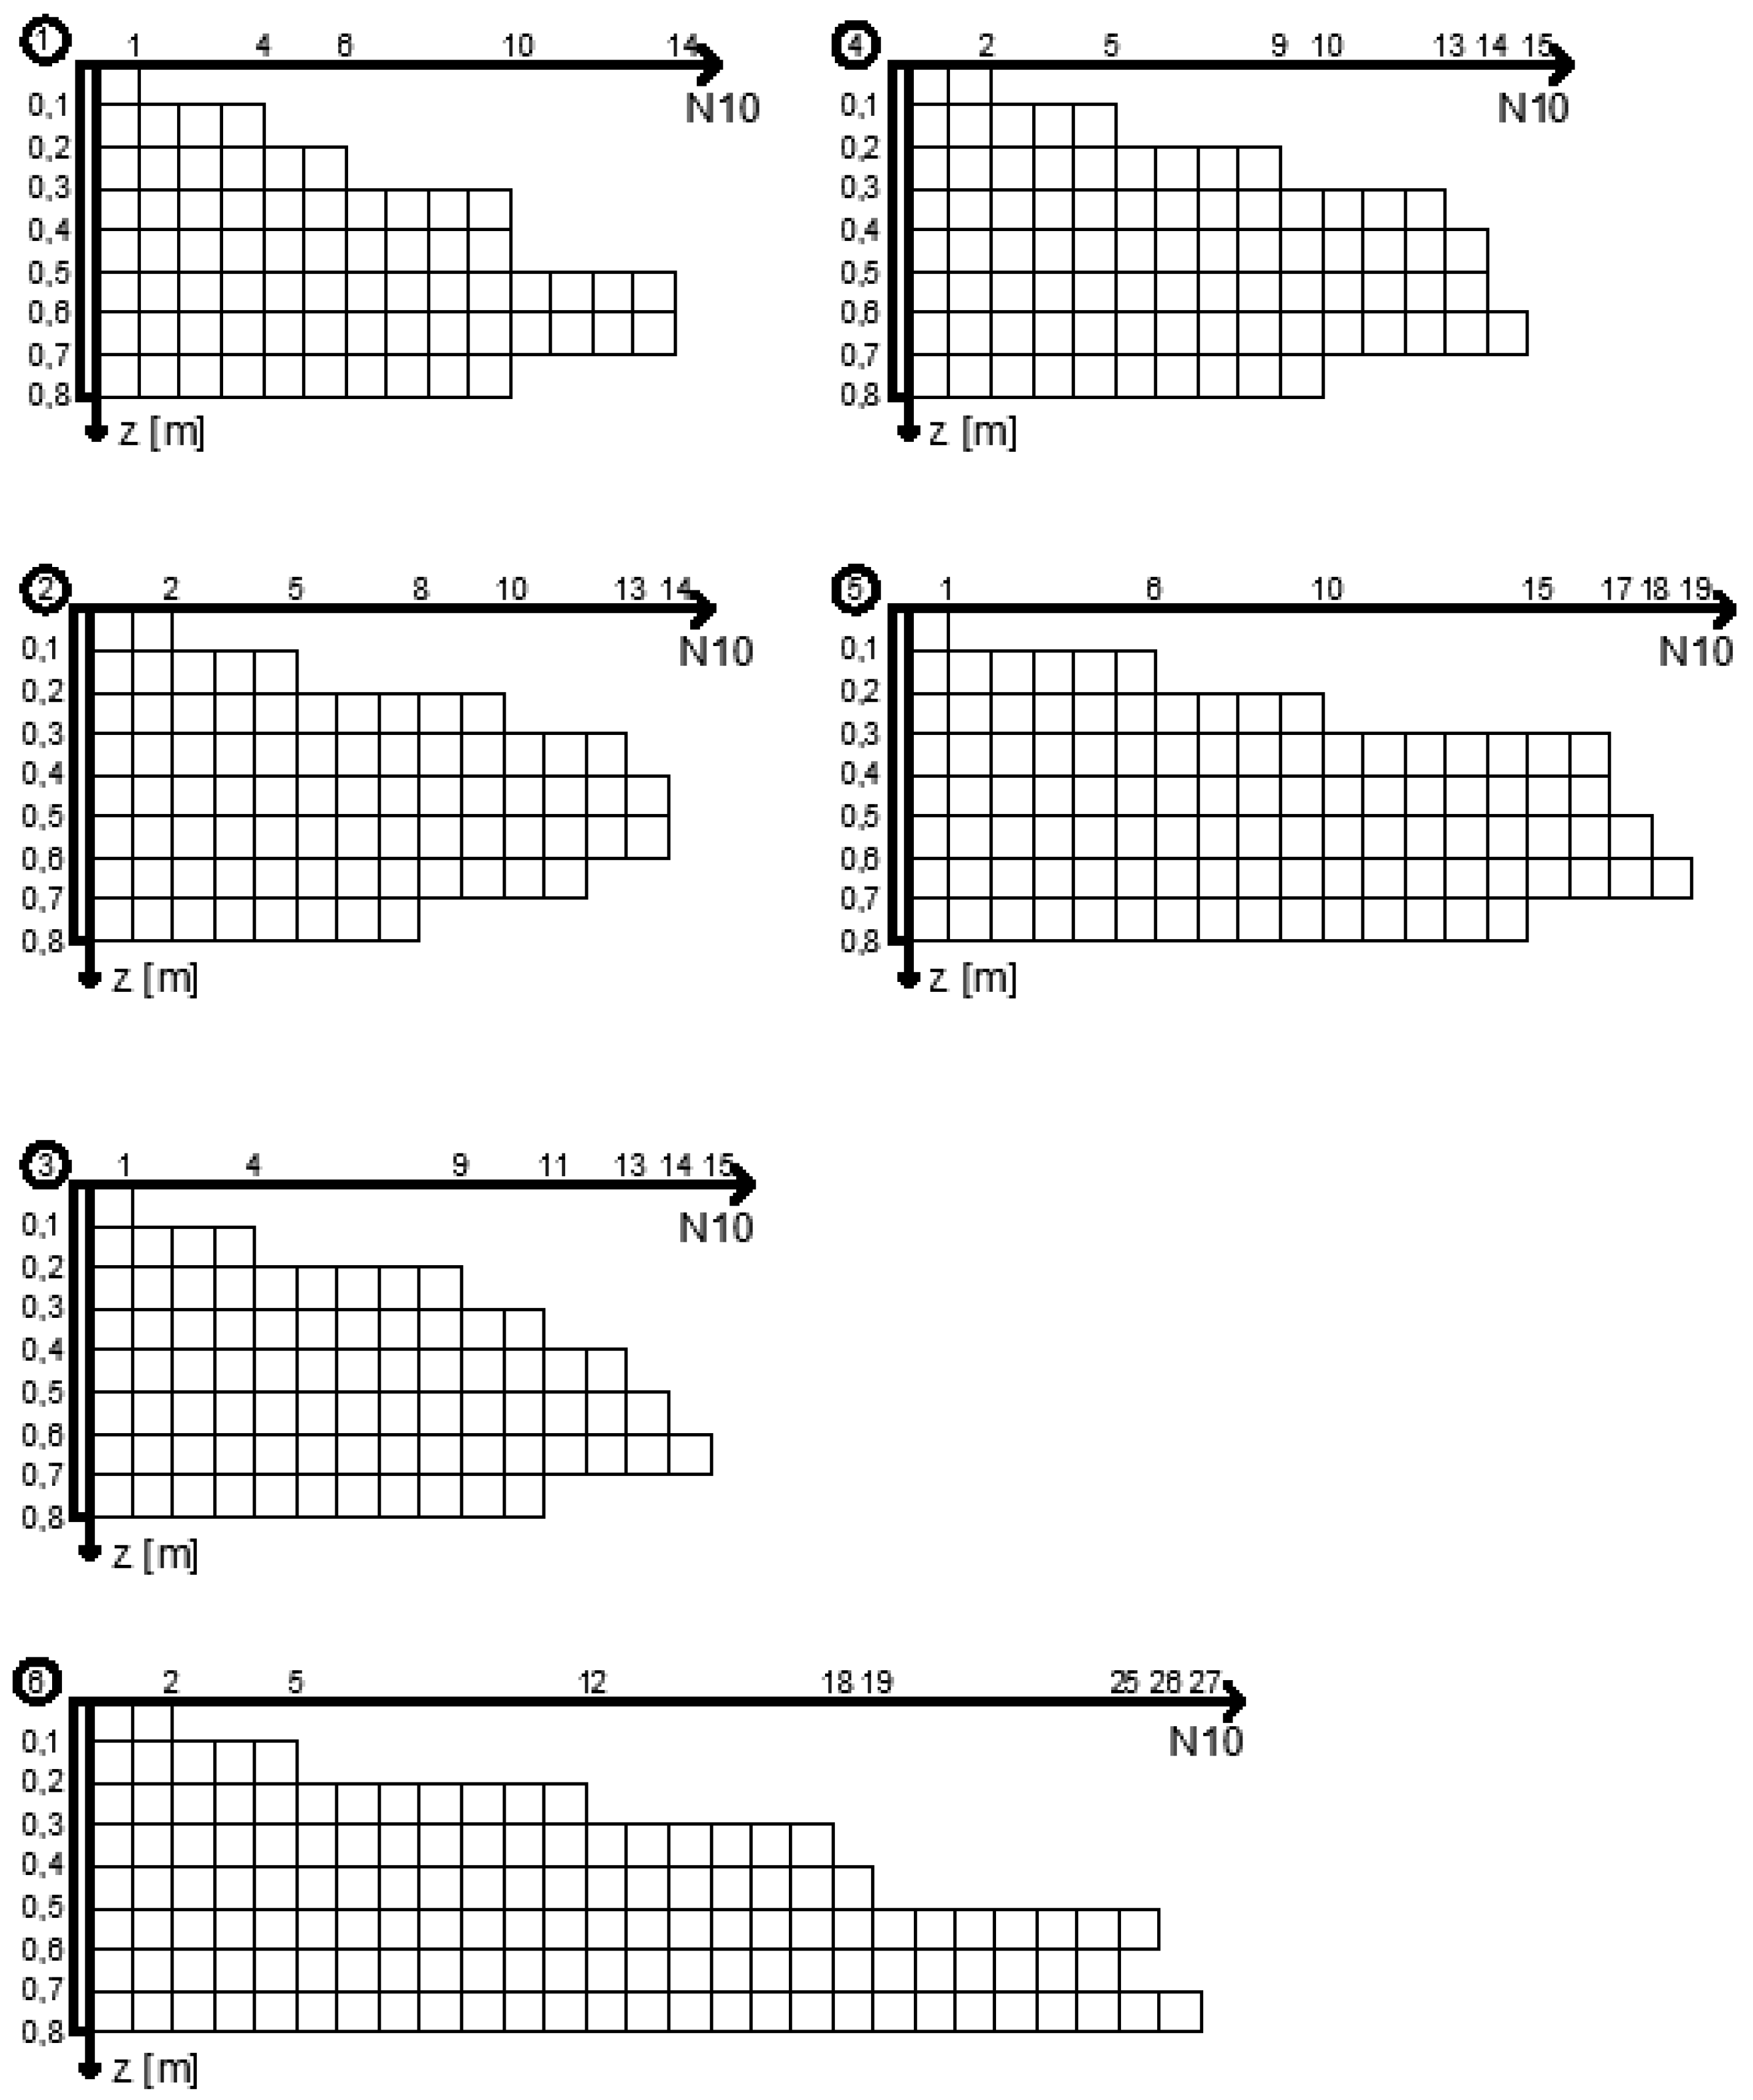
4.1. Determining the Bearing Capacity of Pile Base and Shaft
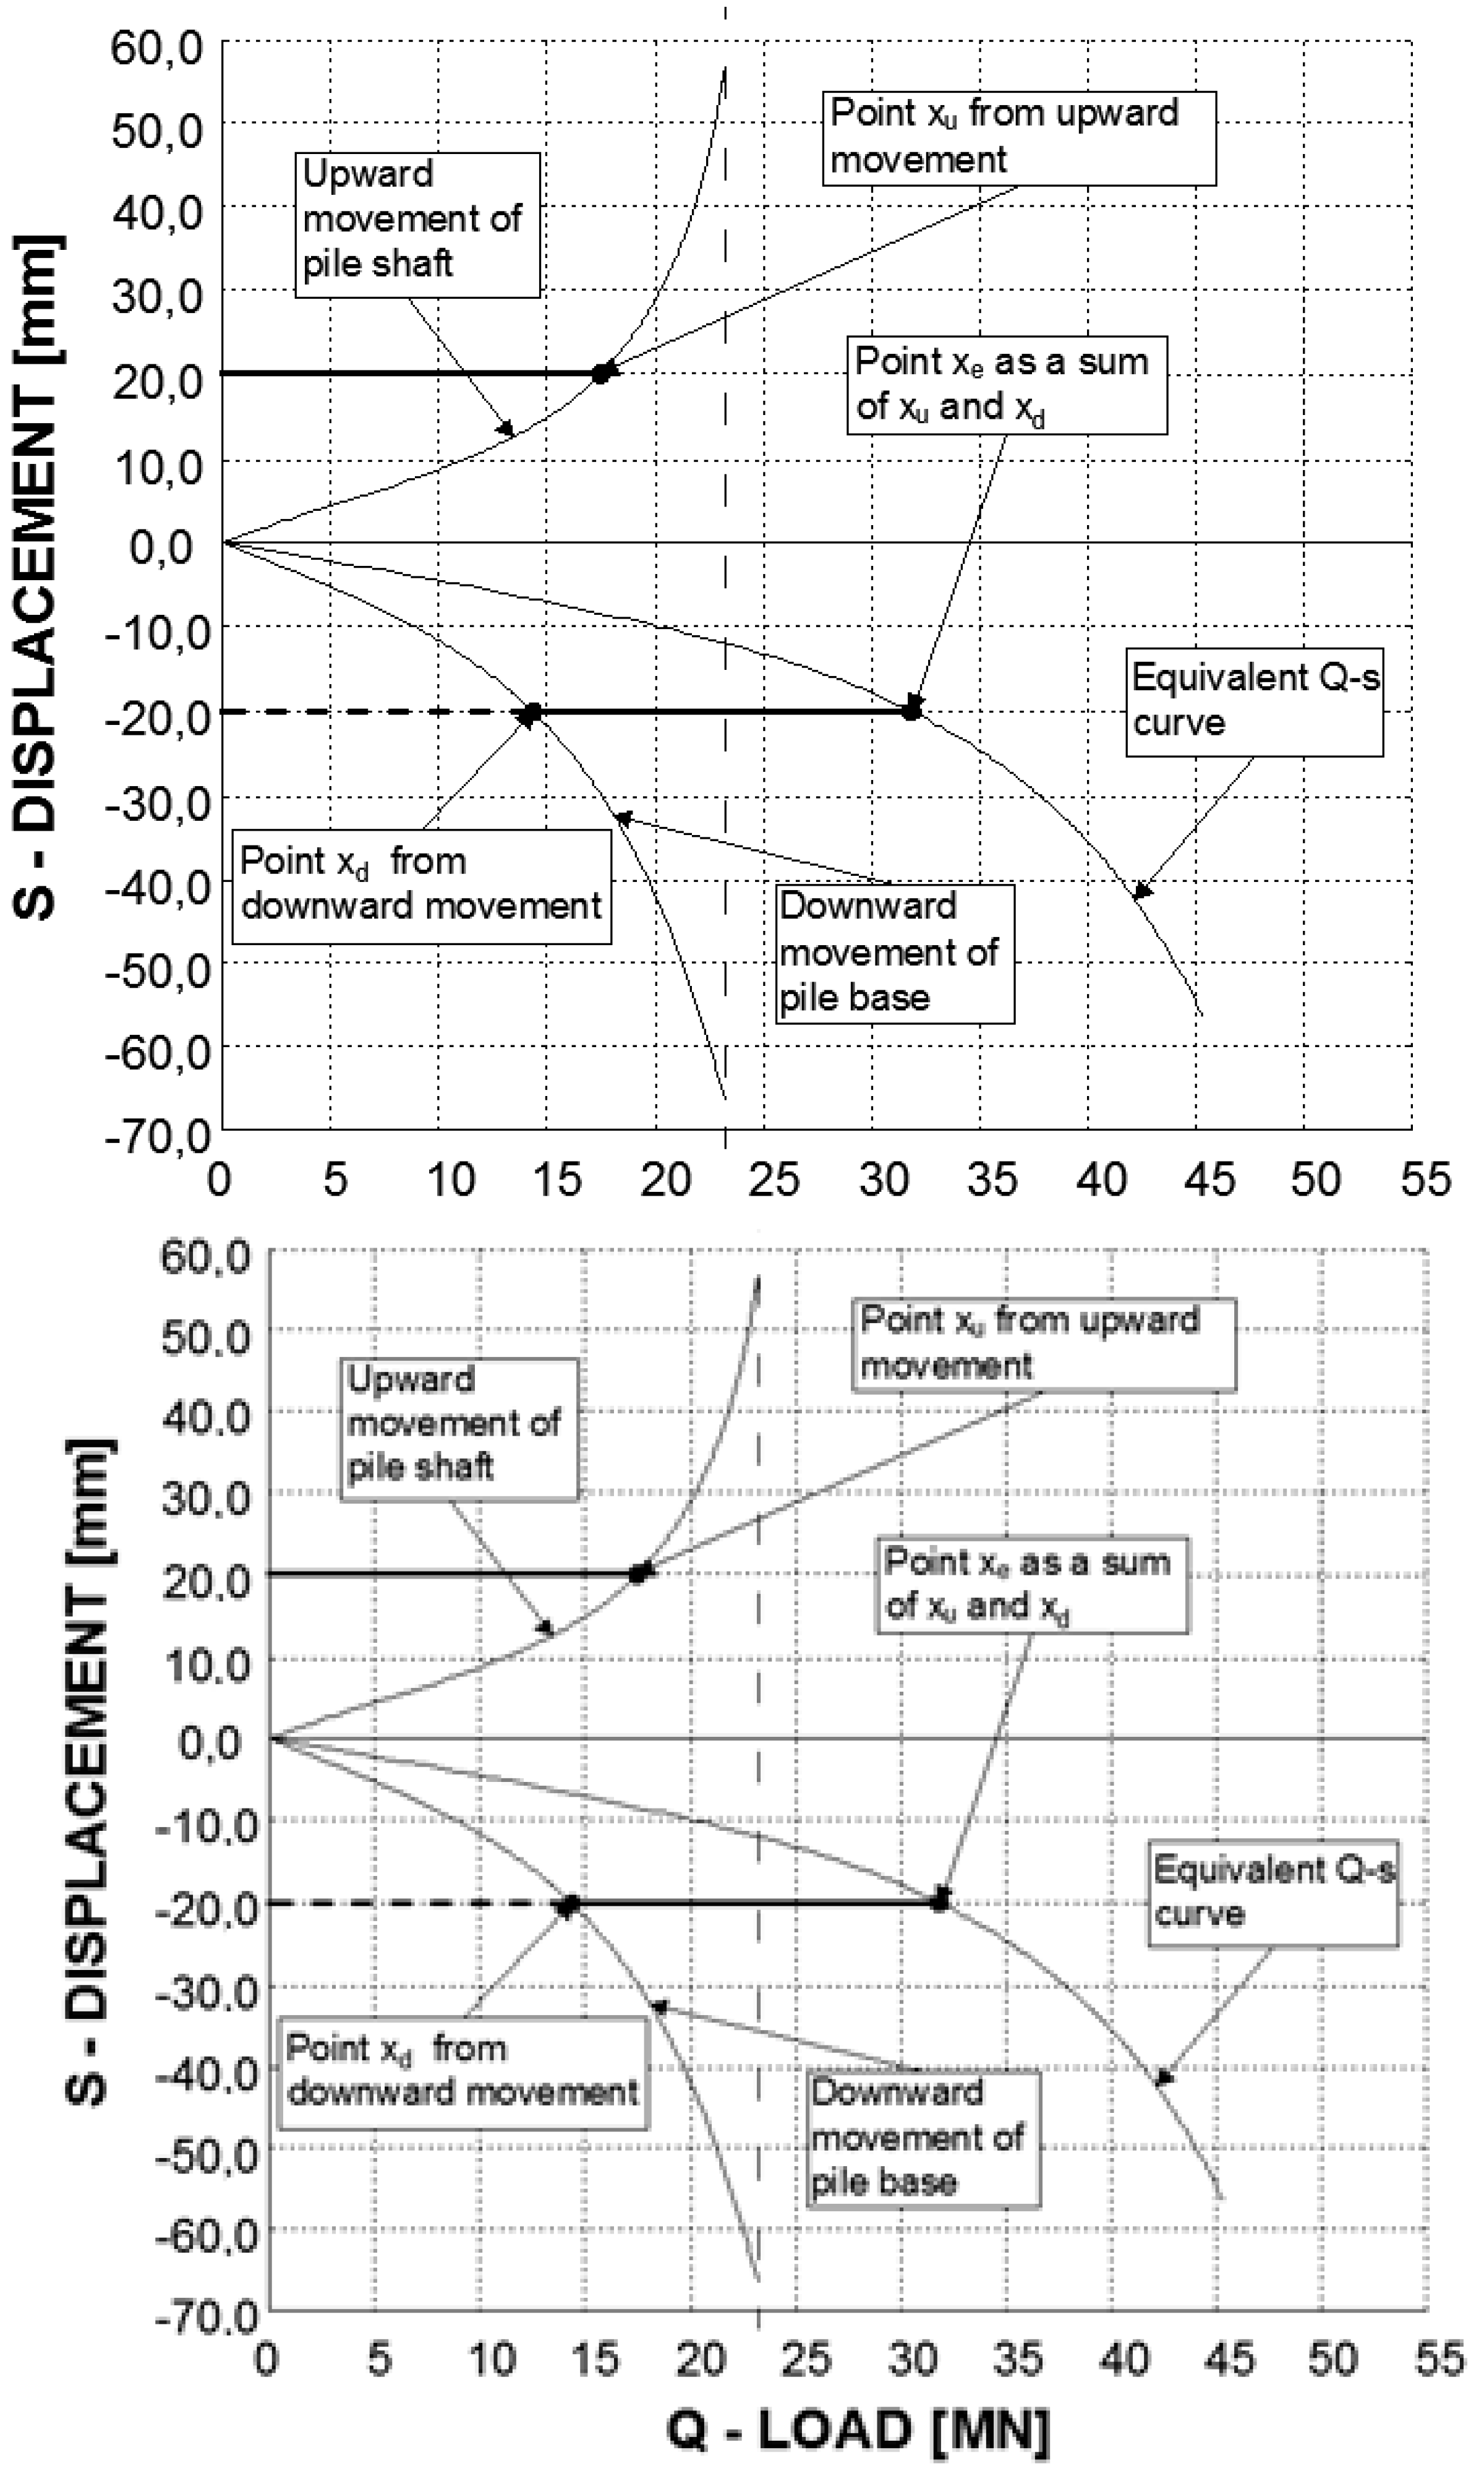
4.2. Constructing the Equivalent Curve
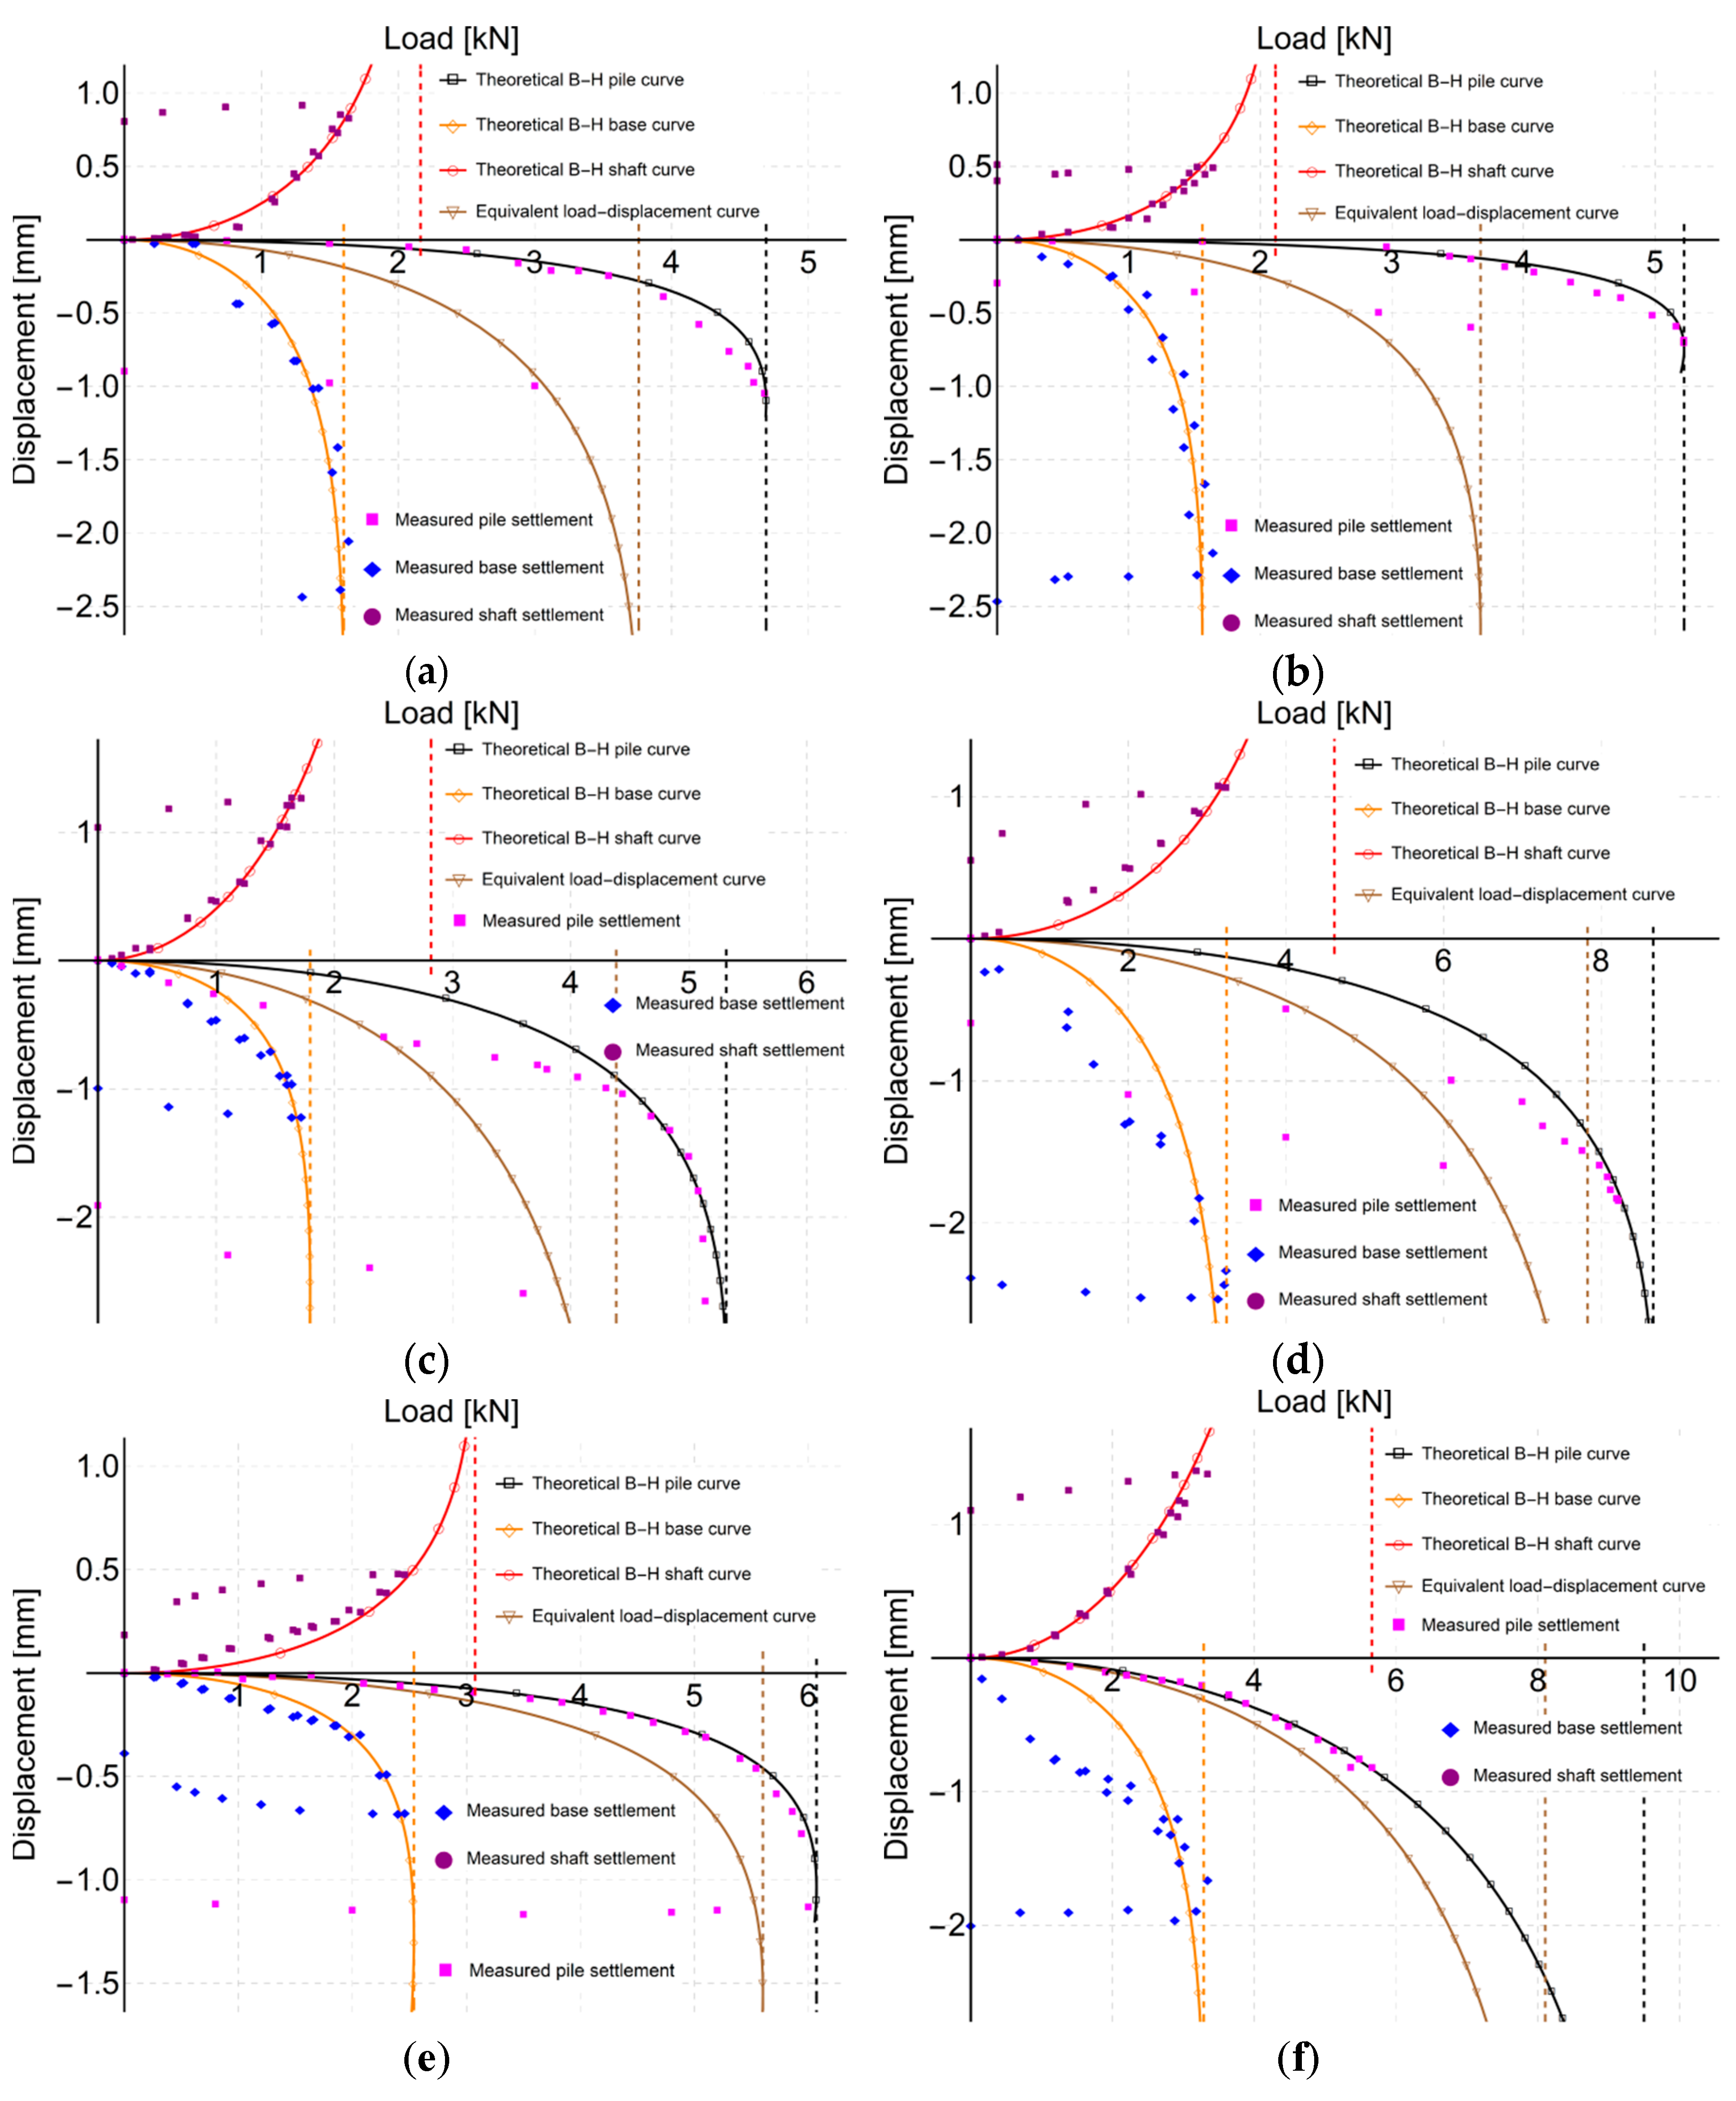
4.3. Results
5. Discussion
6. Summary and Conclusions
Author Contributions
Funding
Conflicts of Interest
References
- Matsumoto, T.; Matsuzawa, K.; Kitiyodom, P. A role of pile load test—Pile load test as element test for design of foundation system. In Application of Stress-Wave Theory to Piles: Science, Technology and Practice; dos Santos, J.A., Ed.; IOS Press: Amsterdam, The Netherlands, 2008; pp. 39–58. [Google Scholar]
- Fleming, K.; Weltman, A.; Randolph, M.; Elson, K. Piling Engineering; CRC Press: London, UK, 2008. [Google Scholar]
- Wang, Y.H.; Liu, X.Y.; Zhang, M.Y.; Sang, S.K.; Bai, X.Y. Test and Study of Pipe Pile Penetration in Cohesive Soil Using FBG Sensing Technology. Sensors 2020, 20, 1934. [Google Scholar] [CrossRef] [PubMed]
- Muszynski, Z.; Rybak, J.; Kaczor, P. Accuracy Assessment of Semi-Automatic Measuring Techniques Applied to Displacement Control in Self-Balanced Pile Capacity Testing Appliance. Sensors 2018, 18, 4067. [Google Scholar] [CrossRef] [PubMed]
- Kou, H.L.; Diao, W.Z.; Liu, T.; Yang, D.L.; Horpibulsuk, S. Field Performance of Open-Ended Prestressed High-Strength Concrete Pipe Piles Jacked into Clay. Sensors 2018, 18, 4216. [Google Scholar] [CrossRef] [PubMed]
- Osterberg, J.O. The Osterberg load test method for bored and driven piles the first ten years. In Proceedings of the 7th International Conference and Exhibition on Piling and Deep Foundations, Vienna, Austria, 15–17 June 1998; pp. 1–28. [Google Scholar]
- Lehane, B.M.; White, D.J. Lateral stress changes and shaft friction for model displacement piles in sand. Can. Geotech. J. 2005, 42, 1039–1052. [Google Scholar] [CrossRef]
- Fakharian, K.; Evgin, E. Cyclic simple-shear behavior of sand-steel interfaces under constant normal stiffness condition. J. Geotech. Geoenvironmental Eng. 1997, 123, 1096–1105. [Google Scholar] [CrossRef]
- Fellenius, B.H.; Altaee, A.; Kulesza, R.; Hayes, J. O-cell testing and Fe analysis of 28-M-deep barrette in Manila, Philippines. J. Geotech. Geoenvironmental Eng. 1999, 125, 566–575. [Google Scholar] [CrossRef][Green Version]
- Hayden, M. Pile HAY-Proof-System: New Test Method for Static Load Tests of Slender Piles. Ground Eng. 2013, 12, 25–28. [Google Scholar]
- Velič, P.; Mišove, P. Static load tests of piles. Inženýrské stavby 2013, 4, 34–35. (In Slovakian) [Google Scholar]
- Lee, J.-S.; Park, Y.-H. Equivalent pile load–head settlement curve using a bi-directional pile load test. Comput. Geotech. 2008, 35, 124–133. [Google Scholar] [CrossRef]
- Bałachowski, L. Size effect in centrifuge cone penetration tests. Arch. Hydro-Eng. Environ. Mech. 2007, 54, 161–181. [Google Scholar]
- Dijkstra, J. On the Modelling of Pile Installation. Doctoral Thesis, Delft University of Technology, Delft, The Netherlands, 2009. [Google Scholar]
- Engin, H.K.; Brinkgreve, R.B.J.; van Tol, A.F. Simplified numerical modelling of pile penetration—The press-replace technique. Int. J. Numer. Anal. Methods Geomech. 2015, 39, 1713–1734. [Google Scholar] [CrossRef]
- Blanc, M.; Thorel, L. Effects of cyclic axial loading sequences on piles in sand. Geotech. Lett. 2016, 6, 163–167. [Google Scholar] [CrossRef]
- El Haffar, I.; Blanc, M.; Thorel, L. Impact of pile installation method on the axial capacity in sand. Geotech. Lett. 2017, 7, 260–265. [Google Scholar] [CrossRef]
- Konkol, J.; Balachowski, L. Influence of Installation Effects on Pile Bearing Capacity in Cohesive Soils—Large Deformation Analysis Via Finite Element Method. Studia Geotech. Mech. 2017, 39, 27–38. [Google Scholar] [CrossRef][Green Version]
- Lee, M.; Bae, K.T.; Lee, I.W.; Yoo, M. Cyclic p-y Curves of Monopiles in Dense Dry Sand Using Centrifuge Model Tests. Appl. Sci.-Basel 2019, 9, 1641. [Google Scholar] [CrossRef]
- Lu, N.; Kim, T.H.; Sture, S.; Likos, W.J. Tensile Strength of Unsaturated Sand. J. Eng. Mech.-Asce 2009, 135, 1410–1419. [Google Scholar] [CrossRef]
- Fellenius, B.H. Basics of Foundation Design—A Textbook; Electronic Edition: Sidney, BC, Canada, 2019. [Google Scholar]
- Fellenius, B.H. The analysis of results from routine pile load tests. Ground Eng. 1980, 13, 19–31. [Google Scholar]
- Altaee, A.; Fellenius, B.H. Physical modeling in sand. Can. Geotech. J. 1994, 31, 420–431. [Google Scholar] [CrossRef]
- Yuan, B.X.; Chen, R.; Li, J.H.; Wang, Y.X.; Chen, W.W. A hydraulic gradient similitude testing system for studying the responses of a laterally loaded pile and soil deformation. Environ. Earth Sci. 2016, 75, 97–103. [Google Scholar] [CrossRef]
- De Nicola, A.; Randolph, M.F. Tensile and compressive shaft capacity of piles in sand. J. Geotech. Eng. 1993, 119, 1952–1973. [Google Scholar] [CrossRef]
- Baca, M. Modelling of Pile Behaviour in the Bi-Directional Static Load Test. Doctoral Thesis, Wroclaw University of Science and Technology, Wroclaw, Poland, 2019. (In Polish). [Google Scholar]


| Sand | ρd (g/cm3) | w (%) | d50 (mm) | Uc = d60/d10 | wopt (%) | ρd,opt (g/cm3) |
|---|---|---|---|---|---|---|
| 1.66 | 7.0 | 0.5 | 5.2 | 11.9 | 1.74 |
| LP | Sand Layer | Soil Constrained Modulus (Evd) | Mean Soil Constrained Modulus (Evd,mean) |
|---|---|---|---|
| cm | MN/m2 | MN/m2 | |
| 1 | 40 | 26.6 | 23.4 |
| 2 | 40 | 20.2 | |
| 3 | 40 | 23.4 | |
| 4 | 70 | 26.9 | 22.9 |
| 5 | 70 | 17.6 | |
| 6 | 70 | 24.1 | |
| 7 | 85 | 21.5 | 18.9 |
| 8 | 85 | 15.9 | |
| 9 | 85 | 19.3 | |
| 10 | 100 | 29.8 | 28.3 |
| 11 | 100 | 30.3 | |
| 12 | 100 | 24.9 |
| LP | Sand Layer | Weight | Mean Weight | Volume | Soil Density | Degree of Compaction |
|---|---|---|---|---|---|---|
| cm | kg | kg | cm3 | g/cm3 | - | |
| 1 | 40 | 4.18 | 4.18 | 2545 | 1.64 | 0.94 |
| 2 | 40 | 4.19 | ||||
| 3 | 40 | 4.18 | ||||
| 4 | 70 | 4.26 | 4.25 | 1.67 | 0.96 | |
| 5 | 70 | 4.24 | ||||
| 6 | 70 | 4.25 | ||||
| 7 | 100 | 4.30 | 4.31 | 1.69 | 0.97 | |
| 8 | 100 | 4.32 | ||||
| 9 | 100 | 4.31 |
| Pile | Rb | Rs | Rc,e | Rc | Rc,e/Rc |
|---|---|---|---|---|---|
| kN | kN | kN | kN | - | |
| 1 | 1.61 | 2.16 | 3.77 | 4.69 | 0.80 |
| 2 | 1.56 | 2.11 | 3.67 | 5.22 | 0.70 |
| 3 | 2.54 | 3.08 | 5.60 | 6.07 | 0.92 |
| 4 | 1.80 | 2.82 | 4.38 | 5.32 | 0.82 |
| 5 | 3.22 | 4.62 | 7.78 | 8.66 | 0.89 |
| 6 | 3.29 | 5.66 | 8.10 | 9.49 | 0.85 |
© 2020 by the authors. Licensee MDPI, Basel, Switzerland. This article is an open access article distributed under the terms and conditions of the Creative Commons Attribution (CC BY) license (http://creativecommons.org/licenses/by/4.0/).
Share and Cite
Baca, M.; Brząkała, W.; Rybak, J. Bi-Directional Static Load Tests of Pile Models. Appl. Sci. 2020, 10, 5492. https://doi.org/10.3390/app10165492
Baca M, Brząkała W, Rybak J. Bi-Directional Static Load Tests of Pile Models. Applied Sciences. 2020; 10(16):5492. https://doi.org/10.3390/app10165492
Chicago/Turabian StyleBaca, Michał, Włodzimierz Brząkała, and Jarosław Rybak. 2020. "Bi-Directional Static Load Tests of Pile Models" Applied Sciences 10, no. 16: 5492. https://doi.org/10.3390/app10165492
APA StyleBaca, M., Brząkała, W., & Rybak, J. (2020). Bi-Directional Static Load Tests of Pile Models. Applied Sciences, 10(16), 5492. https://doi.org/10.3390/app10165492