Article

Hardware Prototype for Wrist-Worn Simultaneous Monitoring of Environmental, Behavioral, and Physiological Parameters

1
Peter L. Reichertz Institute for Medical Informatics of TU Braunschweig and Hannover Medical School, Braunschweig, 38106 Lower Saxony, Germany
2
Faculty of Engineering, University of Ilam, Ilam 69315-516, Iran
3
Center for Life Science Automation, University of Rostock, 18119 Rostock, Germany
*
Author to whom correspondence should be addressed.
Appl. Sci. 2020, 10(16), 5470; https://doi.org/10.3390/app10165470
Submission received: 2 July 2020 / Revised: 27 July 2020 / Accepted: 3 August 2020 / Published: 7 August 2020

Abstract

:
We designed a low-cost wrist-worn prototype for simultaneously measuring environmental, behavioral, and physiological domains of influencing factors in healthcare. Our prototype continuously monitors ambient elements (sound level, toxic gases, ultraviolet radiation, air pressure, temperature, and humidity), personal activity (motion tracking and body positioning using gyroscope, magnetometer, and accelerometer), and vital signs (skin temperature and heart rate). An innovative three-dimensional hardware, based on the multi-physical-layer approach is introduced. Using board-to-board connectors, several physical hardware layers are stacked on top of each other. All of these layers consist of integrated and/or add-on sensors to measure certain domain (environmental, behavioral, or physiological). The prototype includes centralized data processing, transmission, and visualization. Bi-directional communication is based on Bluetooth Low Energy (BLE) and can connect to smartphones as well as smart cars and smart homes for data analytic and adverse-event alerts. This study aims to develop a prototype for simultaneous monitoring of the all three areas for monitoring of workplaces and chronic obstructive pulmonary disease (COPD) patients with a concentration on technical development and validation rather than clinical investigation. We have implemented 6 prototypes which have been tested by 5 volunteers. We have asked the subjects to test the prototype in a daily routine in both indoor (workplaces and laboratories) and outdoor. We have not imposed any specific conditions for the tests. All presented data in this work are from the same prototype. Eleven sensors measure fifteen parameters from three domains. The prototype delivers the resolutions of 0.1 part per million (PPM) for air quality parameters, 1 dB, 1 index, and 1 °C for sound pressure level, UV, and skin temperature, respectively. The battery operates for 12.5 h under the maximum sampling rates of sensors without recharging. The final expense does not exceed 133€. We validated all layers and tested the entire device with a 75 min recording. The results show the appropriate functionalities of the prototype for further development and investigations.

1. Introduction

According to the World Health Organization (WHO), chronic diseases such as chronic obstructive pulmonary disease (COPD) will become the third-main cause of death worldwide by 2020 [1]. The environment (e.g., gases, sound level, and ultraviolet radiation), the patient’s behavior (e.g., activity), and the physiological state of the subject (e.g., vital signs) are important factors of disease development. Furthermore, the simultaneous monitoring of these domains has great importance in the safety monitoring of workplaces. Under the rapid development of technologies, the world has entered into a new era of interconnected networks via the Internet of Things (IoT) as one of the most powerful communication paradigm [2]. The IoT supports the connection of objects putting forward technologies and networking architectures. Numerous objects in houses or vehicles are connected and share information and resources. Therefore, IoT has become a key component in healthcare applications and environmental monitoring [3]. Wireless sensors can also measure environmental conditions and parameters related to the health status [4]. Continuous health monitoring is available and with the methodology of mobile health (mHealth) or electronic health (eHealth), the medical paradigm shifts from diagnostics and treatment towards predictive, preventive, personalized, and participatory (P4) medicine [5,6,7]. In contrast to reactive traditional medicine, P4 medicine is proactively seeking causes rather than symptoms of diseases. It addresses patients, consumers, and physicians. Personalized medicine motivates actively participating lifestyle observation, leading to improved quality of life. Studies have shown that wearable technology has many advantages and benefits in healthcare [8,9]. Wearable sensors gained attention of researchers, vendors, and consumers [10,11,12]. Based on wearable devices and their advantages in healthcare, the medical IoT (mIoT) is the most acceptable solution reaching proactive and personalized medicine [13,14]. Miniaturization and user convenience boosted mass production of non-invasive sensors with the applications in well-being, lifestyle, and personalized healthcare [15,16].
Wireless body area networks (WBAN) are widely used to combine wearables for measuring physiological parameters such as the heart rate (HR), respiration rate (RR), electrocardiography (ECG), body temperature, and blood pressure (BP). WBAN is also applied to measure physical activities (e.g., body positioning, motion tracking) and environmental conditions. Such applications are of great importance for chronic disease management (e.g., COPD) and safety of workplace monitoring (e.g., workers on construction sites). Then health and safety (H&S) are interwoven domains [17,18].
Several publications reported the influence of air pollutants including carbon monoxide (CO), nitric dioxide ( NO 2 ), and particle matter ( PM 2.5 and PM 10 ) [19,20] on health. However, such ambient parameters are not limited to hazardous gases. The loudness of environmental sound is important, too. Long-term exposure yields hearing loss or psychological impairments [21]. Overexposure to ultraviolet (UV) radiation causes skin cancer, eye irritation, and aging skin [22]. Furthermore, air temperature, humidity, and air pressure are usually delivered by wearables (Table 1). Skin temperature and photoplethysmography (PPG) are the commonly monitored physiological signals [23]. Long-term and continuous monitoring of safety conditions with respect to a combination of (i) environmental conditions, (ii) behavioural parameters, and vital signs can significantly contribute protecting health in hazardous situations by early warning systems [24].
Nevertheless, there is lack of efficient wearable systems to monitor environmental, behavioral, and physiological parameters at the same time [2]. In safety monitoring and industrial environments, the current approach is to deploy static wireless sensor nodes for the monitoring of ambient and physiological parameters. Several works report on hybrid systems in the monitoring of environmental-physiological domains based on wireless sensor networks (WSN) [25].
Chen et al. present a smart clothing for ECG, blood oxygen saturation, and temperature assessment. Bluetooth Low Energy (BLE) is adopted to transmit the data to a smartphone as gateway to the cloud [28].
Wu et al. introduced a hybrid distributed system for health and safety monitoring [2]. Two sensor nodes, one for environmental measurement (safety node) and the other for vital signs (health node) are deployed utilizing WBAN. Data from the safety node (temperature, humidity, UV, and CO 2 ) are transmitted to the health node (HR and body temperature) by BLE. For the long-range data transmission to the cloud, low-power wireless area network (LPWAN) is used.
A hybrid and decentralized system including one wrist-worn and one chest-worn device for environmental and physiological monitoring is reported by Dieffendefer et al. [29]. The chest-worn measures ECG, pulse oxygen, skin impedance, and strain; the wrist-worn volatile organic compounds (VOCs) and ozone ( O 3 ), temperature, and humidity. The data are transmitted via smartphone to the cloud.
Haghi et al. present a distributed wearables system for monitoring of environmental, physiological, and behavioural. The authors implement a three tier IoT solution within the scope of WBAN. They describe convenient and comprehensive system including several wearables on wrist and chest. Data are transmitted via a flexible IoT-gateway (i.e., smartphone) to the cloud [30].
The work reported in Reference [25] presents the implementation of a wearable wireless sensor network measuring the harmful gases (e.g., CO 2 ) in industrial environments. The solution is a customized WSN using a low-power low-rate wireless personal area network (LR-WPAN) communications protocol.
Martin et al. propose heart rate and breathing rate monitoring of construction workers by the integration of a noninvasive vital sign monitoring into the workers’ hearing protection devices (HPDs). The solution is based on using a microphone positioned within the ear canal under the HPD followed with developing digital signal processing algorithms [31].
With respect to chronic-disease management, COPD is of particular relevance. COPD patients usually are experiencing an altered skin temperature, making their skin more sensitive to UV light [32]. Many patients are suffering from sleep disorders. Thus, physicians seek a better understanding of the ambient living conditions [33].
As of today, remote or tele-monitoring of COPD patients usually is limited to special programs, a short period of time, or a special parameter such as the trans-cutaneous oxygen saturation ( SpO 2 ) [34]. Contrarily, COPD is impacted by a variety of parameters, for instance, cardiovascular co-morbidity, environmental factors such as exposure to pollutants, and physiological factors [35]. Furthermore, the activity profile is found to be more important for elderly who are suffering from muscle weakness as respiratory parameters [36]. Therefore, multi-dimensional monitoring is necessary and shall not be restricted to particular target populations or parameters, but a wide range of environmental, physiological, and behavioral factors have to be considered [37].
Furthermore, long-term monitoring of the vital signs such as oxygen saturation, heart rate, and near-body temperature indicates the health status [38]. In our aging population, continuous tele-monitoring of patients’ suffering from chronic diseases is important. WHO statistics show chronic diseases are among the leading causes of death [39]. Wearable devices support not only unobtrusive real-time and long-term monitoring of physiological parameters, vital signs, and motion activities but can also track ambient parameters from the environment [40,41]. However, the required sensor integration and data fusion still is missing. For many diseases, and in particular for COPD, we need multi-functional, economic, and user-friendly wearables that are feasible in daily routine of clinical practice to identify individual’s health status and its changes. Such devices should not be limited to a specific group of individuals but applicable to anyone and anywhere [42]. Nonetheless, previous works on wearable devices and technological platforms for the monitoring of COPD patients are either focused on physical activities, or physiology and vital signs, but only a few approaches actually combine several domains. Long-term physical activities are considered most, as body positioning and mobility indicate the health status [15]. Therefore, several works are published in this area, mainly utilizing accelerometers and gyroscopes [43,44].
Contrarily, Kollmann et al. developed an ear-worn prototype of pulse oximeter. The prototype is designed for low-cost, convenient, and long-term continuous monitoring. Technological, it is based on a vertical cavity surface emitting laser and shaped in style of hearing aids [45].
In “VTAMN” four electrodes for ECG and two for skin temperature measurement are combined with accelerometer and gyroscope for fall detection. Events are either launched manually by the patient or generated automatically from remote signal analytic for fall, hyper- and hypothermia, and tachycardia detection [46].
“SweetAge” is a distributed system that monitors heart rate, skin and near-body temperatures, and physical activity by a wrist band, which is connected via Bluetooth to a smartphone. A commercial pulse-oximeter is coupled as second component. The phone operates as gateway receiving data from the wearable sensors and transmitting it to the monitoring system [38].
Likewise, “HealthWear” is based on wearable garment with several textile-embedded biomedical sensors including 6-lead ECG, pulse rate, and respiratory movements and rate. Data is transmitted to a so-called portable patient unit (PPU). The PPU further connects external sensors such as an oximeter. All data is transmitted via the general packet radio service (GPRS) to a centralized server [47].
In Reference [48], motion activities, heart rate, and breathing rate are measured through a combination of wearable devices for vital signs and a camera for motion tracking and gesture detection. Heart rate and respiratory-induced intensity variation (RIIV) are extracted from a photo-plethysmographic headset. Data are transmitted via BLE to a personal computer (PC).
Bellos et al. introduced “CHRONIOUS” as an integrated platform composed of several wearable devices. Data are obtained from several wearable sensors, fused, and transmitted to a server as decision support system (DSS). The smart T-shirt integrates 3-lead ECG, a microphone as context-audio sensor, a pulse oximeter, two respiration bands (thoracic and abdominal), an accelerometer, and sensors to measure humidity, body and ambient temperature. Additionally, external sensors capture body weight, blood pressure, respiratory volume, and glucose level [49].
The “WELCOME” platform is proposed by Chouvarda et al. as a bi-directional approach between the COPD patient and a care center. The platform is composed of three modules named patient hub, cloud, and application. The platform measures parameters in the domains of heart failure, diabetes, anxiety, and lifestyle issues. The patient hub interacts with the patient via a light vest-jacket including in total 26 non-invasive sensors for: SpO 2 , electrical impedance tomography (EIT), chest sound, multi-lead ECG, and activity tracking. The cloud implements storage server, feature extraction, and DSS [50].
In summary, comprehensive and efficient monitoring of COPD patients requires simultaneous assessment of all three domains of influencing factors: environmental, physiological, and behavioral parameters (Table 2).
However, the state-of-the-art is focused on physiological and behavioral monitoring, or on designing platforms to combine separated devices, which all come with their individual overhead, synchronization, calibration, power supply and data transmission (distributed approach). However, chronic diseases in general and COPD in particular need convenient and integrated measures of environmental parameters such as hazardous and/or toxic gases (e.g., NO 2 , CO , O 3 ) and other pollutants, as they cause breathing and heart problems; UV radiation exposure, as COPD patients have an increased risk of skin cancer; and ambient sound level, as this impacts sleep quality and causes sleep disorders. Furthermore, conditions and priorities of COPD patients demand centralized data collection and processing with ubiquitous devices.
Our previous work was concentrated on the design of wrist-worn hardware for monitoring environmental parameters. Hardware design, sensor calibration and fusion, power consumption, and data logging in internal memory while BLE disconnections have been discussed in Reference [51]. In this paper, we aim to design and implement a low-cost and convenient prototype for simultaneously monitoring of environmental, behavioral, and physiological parameters. As a focus of this work and an important aspect of wearables, we prolong the monitoring through a careful and seamless hardware design and software development. The work concentrates on technical development and its features rather than its clinical application to improve the flexibility and applicability of the prototype by enhancing the configurability and improving the wearability via downsizing the design. Therefore, we:
  • extend environmental and behavioral to physiological monitoring of skin temperature and heart rate,
  • re-design the hardware to downsize the prototype and significantly improve its wearability,
  • add a sensor layer that sticks at the bottom of the prototype directly touching the user’s wrist,
  • improve the signal quality of gas sensors by additional voltage reference,
  • remove the sound pressure level module, design, and integrate the respective electronics circuit,
  • eliminate mismatching impedance via a gain unity buffer, and
  • add a UV sensor to complete the requirements for COPD patients and safety workplaces monitoring.
To the best of our knowledge, we are the first to contribute a wrist-worn prototype that integrates all three (environmental, physiological, and behavioral) domains of health monitoring for COPD patients and industrial workers. Therefore, our concept and prototypical realization of an all-in-one and wrist-worn device may significantly contribute to personalized healthcare monitoring.

2. Materials and Methods

The basic idea behind this work is to design a ubiquitous, cost effective, convenient, and easy to use prototype as an all-in-one approach to support people identifying their health status as well as to predict and prevent adverse events. Hence, we design our prototype according to four principle pillars. Comprehensive, Convenience, Continuous, and Cost-effective (4C) are taken into consideration as the principles. We provide the strict definitions for each component of this term as: Comprehensive—indicates multi-parameters monitoring and the combination of the effective areas in personalized healthcare [52]. Convenience—discusses and addresses the mode of wearability including the size and weight of the prototype [53]. Continuous—refers to prolonged monitoring which is a serious concern in wearable monitoring [40]. Cost-effective—targets the final cost of the prototype which is a concern. The personalized healthcare becomes more and more important and popular and wearables as the main means are receiving more attention. Thus to encourage the users to use them, these devices must be affordable [54].
The fundamental concept is to construct the hardware in z-direction (3D-MPL approach). Each task and parameter is implemented through mounting the sensor/actuator (or number of sensors from the same domain) on the same physical layer. These layers are located one on top of another through a board-to-board connector. Therefore, ( x , y ) -plane remains unchanged (in contrast to other prototypes/products) but the height of the prototype is expanded slightly—but still appropriate for a wrist-worn device. The connectors provide signaling between layers and the main platform. The measurements are displayed on the prototype and transmitted to the smartphone in real-time. The smartphone is used as mid-term storage and gateway to a server for permanent storage and data analysis. We support the prototype configuration in BLE connected mode by sensor activation/deactivation. Thus, we develop a smartphone application for bidirectional data communication between the prototype and the smartphone. User activates the intended sensor by pressing the respective button on the application and the data are measured, processed, and transmitted to the smartphone. Upon the pressing the button, a string including the sensor’s name is transmitted from the smartphone which is handled on the prototype. This string is used as a condition for sensor activation. We apply centralized data processing and a strict data protection policy. All sensors are connected and communicate to microcontroller via Inter-Integrated Circuit (IIC), Analogue to Digital Converter (ADC), or a combination of both interfaces. Behavioral sensors, air condition sensors, and skin temperature are supported with IIC, PPG sensor, loudness, and UV are supported with ADC, and gas sensors are taking the combination of both for initialization and configuration. The data from all sensors are pre-processed and processed on the prototype prior than transmission to the smartphone. This includes filtering the noise, pattern creation, and data conversion to the target data unit. All data are either transmitted directly via BLE or stored in the integrated memory, if BLE connection temporarily is unavailable (see Figure 1 and Algorithm 1).
Algorithm 1: Operational Strategy of the Device
Applsci 10 05470 i001

2.1. Concept and Architecture

Hardware: eleven sensors measure 15 parameters from three domains: (i) ambient parameters (toxic/hazardous gases (e.g., CO , NO 2 ), UV, sound level, air pressure, air temperature, and air humidity), (ii) vital signs (skin temperature, heart rate), and (iii) motion tracking (raw data from gyroscope, magnetometer, and accelerometer) in nine degrees of freedom (DoF). Our prototype follows the common approaches for behavioral data using accelerometer, magnetometer, and gyroscopes and hence is not particularly tested. The hardware is modular and each sensor’s functionality is independent. We present an innovative three-dimensional (3D) multi-physical-layer (MPL) approach.

2.2. Hardware Development and Layer Description

We distribute 11 sensors on 5 physical layers. A detailed description of sensors, companies, and technical specifications is given in Table 3.

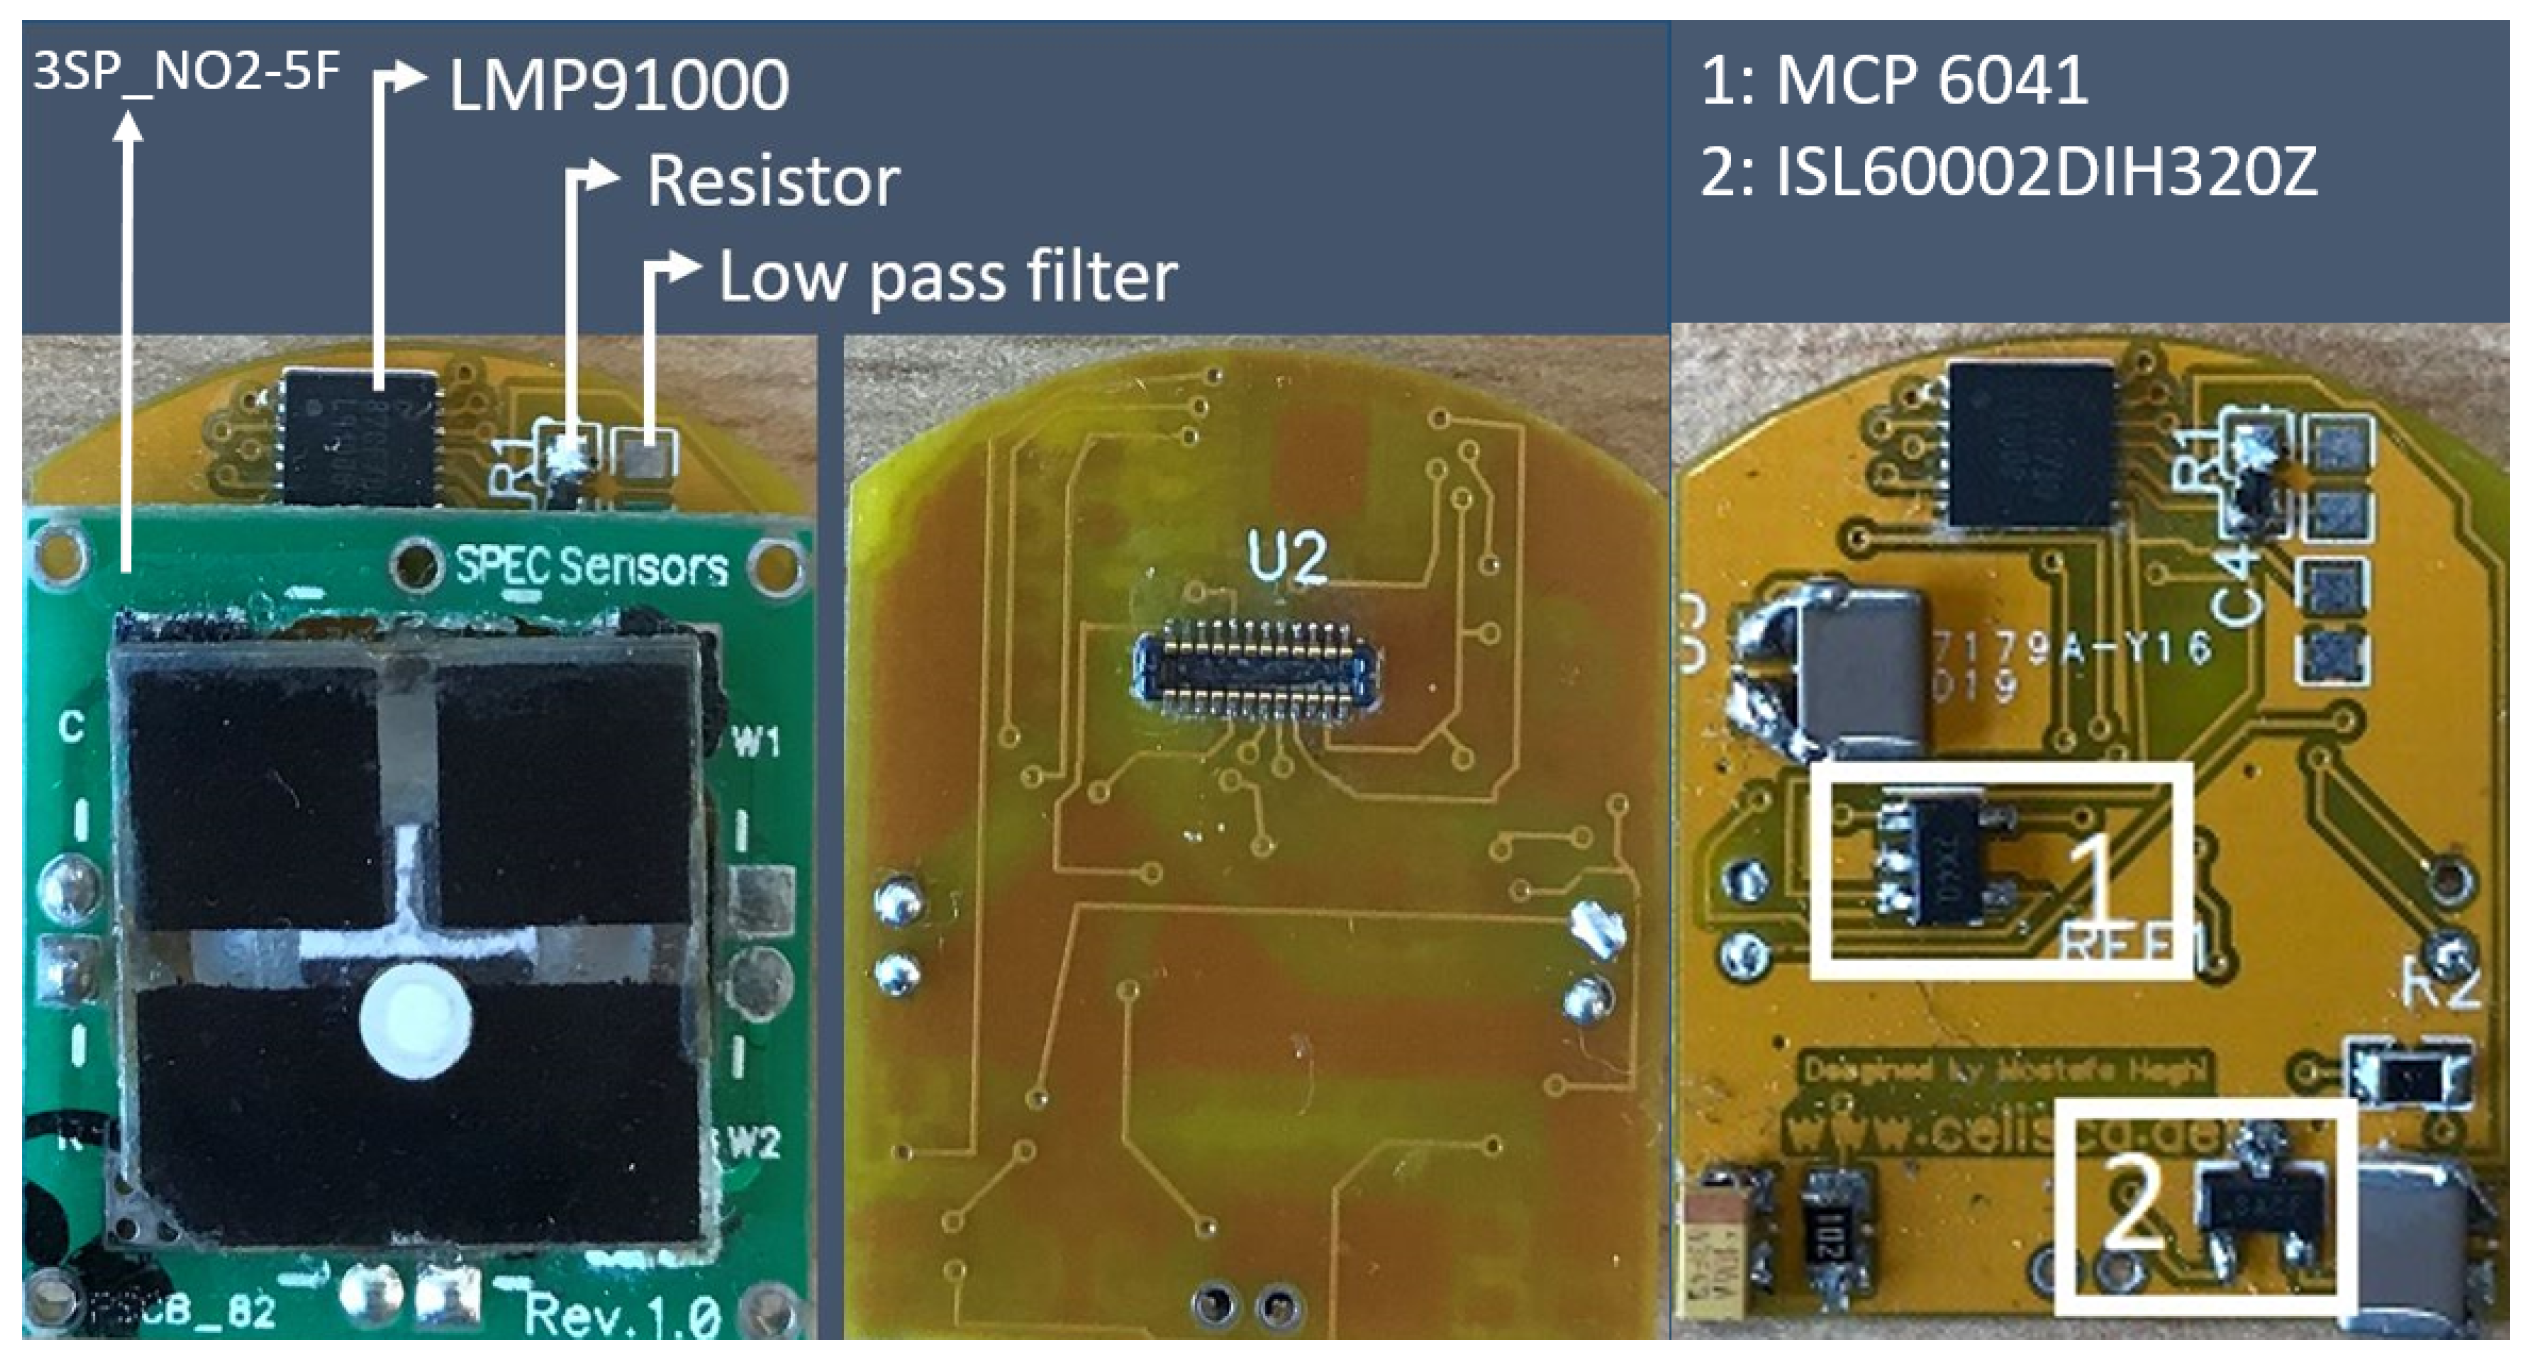
2.2.1. Layer 1: Gas Sensor

The gas sensor (Spec, CA, USA) is placed on the very top for free exposure to pollutants. It is small ( 15 × 15 mm) and has high resolution (0.1 PPM), low response time (between 1 and 15 s), low cost (20€), fast recovery time, ideal cross sensitivity, and low power consumption. Gas sensors can be easily replaced by the 3D-MPL design. In fact, we build a multi-gas sensor, but always only one particular detector is operated (Figure 2).

2.2.2. Layer 2: Gas Sensor Driver

We design the driver in a universal configuration mode, which is compatible with wide range of hazardous/toxic gas sensors (2–3 lead gas sensors). The driver can be used for both, oxidizing and reducing gas sensors (Figure 2).
It includes a 24-pin board-to-board connector, a gain adjuster, a front-end amplifier (LMP91000, Texas Instruments, Dallas, TX, USA), and a signal filter. To improve signal quality during calibration, the voltage reference is strictly held. Thus, in addition to the microcontroller voltage reference, we use a voltage reference chip (Intersil ISL60002DIH320Z-TK). We implement a low-pass filter to eliminate ripples. To tackle the possible mismatch impedance between the output signal of the gas sensor and the ADC micro-controller, a gain unity buffer (MicroChip MCP6041T-I/OT) is used (Figure 2).

2.2.3. Layer 3: Hardware Interface

The physical layers, sensors, and the display are connected to this layer from three sides. It interconnects the gas layers (Layers 1 & 2) to main platform (Layer 4). Furthermore, it hosts the microphone and UV sensor. We designed and implemented sound (LM358) and UV circuits (GUAV-S12SD) to fit the board (Figure 3).

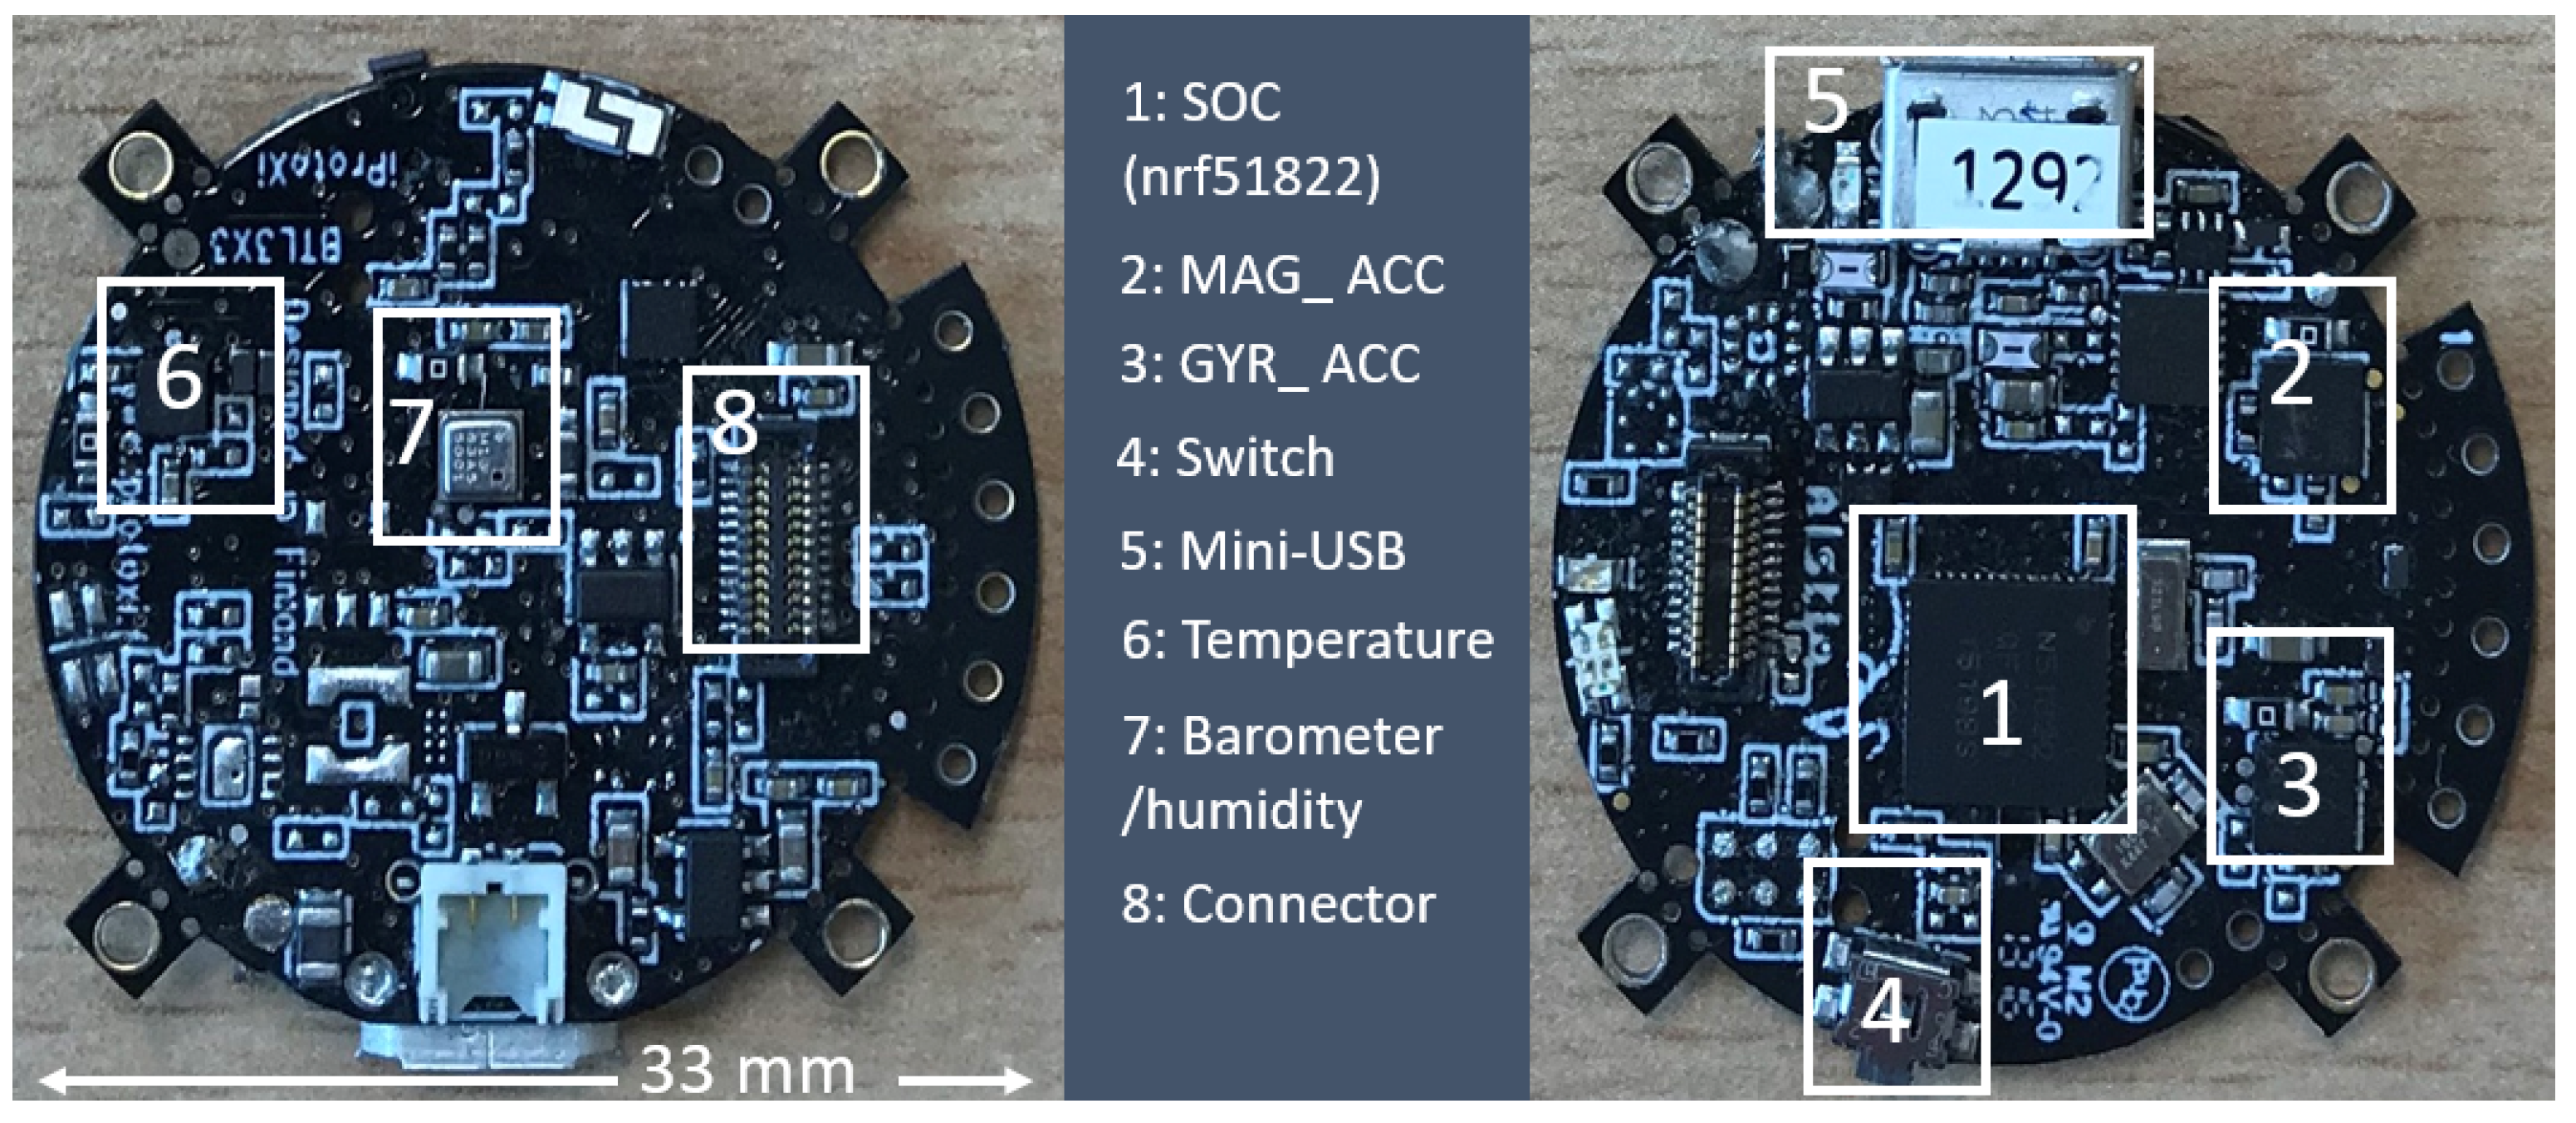
2.2.4. Layer 4: Host Platform

This layer performs data collection, processing, calibration, conversion, and transmission. We selected a n r f 51822 -based microcontroller ( B T L 3 H 3 , iProtoxi, Oulu, Finland). The circular platform (33 mm in diameter) is enriched with accelerometer, gyroscope, and magnetometer for motion tracking, air temperature, pressure, and humidity sensors, as well as internal memory. The sensors and memory components utilize the IIC bus with different sampling rates (Figure 4). We also apply the ambient physical parameters (air pressure, air temperature, and air humidity) for gas sensor calibration.

2.2.5. Layer 5: Physiological Sensors

This layer holds the biomedical sensors. We locate the layer at the very bottom in direct contact to the user’s skin. Skin temperature (MAX30205) and Photoplethysmography (PPG) are measured by the sensors mounted on this layer (Figure 5). It connects the bottom of the host platform and communicates with the microcontroller via the IIC bus at a 15 s time interval. We detect the PPG by optical sensing. The PPG sensor consists of light emitting diode (AM2520ZGC09) and photo diode (APDS9008). Currently, we process the PPG signal to analyse and determine the heart rate only but further parameter extraction (e.g., breathing rate) is planned.
After the detail description of layers of 1 to 5 and also with respect to general strategy of operation described in Figure 1 and Algorithm 1, the assembled version of the prototype is seen in Figure 6.

2.3. Software Architecture and Bidirectional Communication

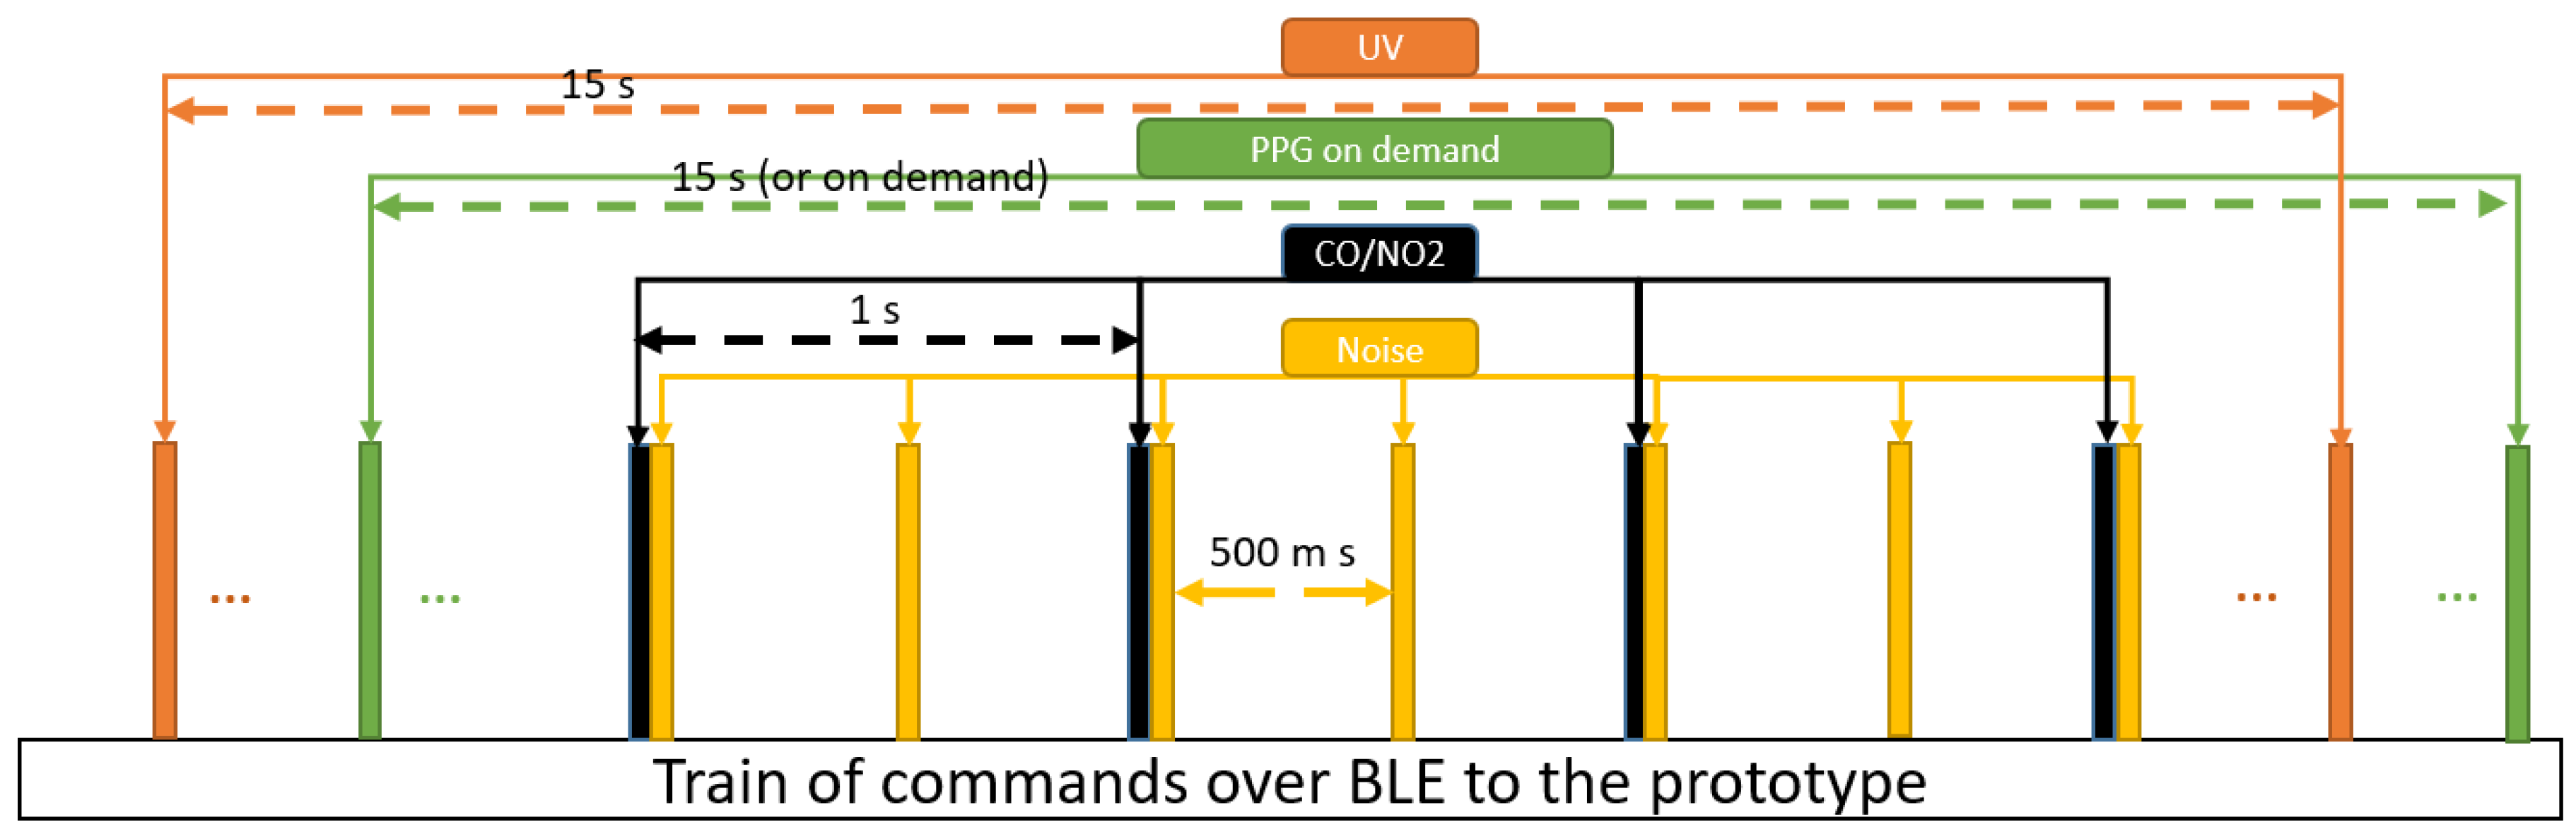
Software: the prototype is flexible. Smartphone’s commands are sent via BLE to activate/deactivate the sensor nodes (Figure 7). Such comprehensive wearable with sensor activation on demand is the first-of-its-kind. Implementing an efficient software is the second part of our work. Therefore, we have developed an interactive application. The application has three major parts: parameters and values- data-, interactive buttons to activates the sensors, and the status bar which indicate the status of sensors whether are activated (1) or deactivated (0). Re-pressing an interactive button changes the status (see Figure 8). The application has been developed in Visual studio with C# programming languages. The software shall enable synchronization of data for further analysis and save power consumption. Therefore, communication of device and smartphone is implemented in seven packets:
  • F1: The motion tracking parameters includes gyroscope, magnetometer, and accelerometer. Each of this parameter is three dimensional and thus, nine values are transmitted. Packet F1 starts with one identifying byte followed by the sequence number (one byte). Each dimension of parameter is coded with 12 bits and packets are separated with another 4 bits. Therefore, the total length of F1 is 17 bytes.
  • F2: Air pressure, temperature, and humidity also are merged in one packet. Again, the first byte is an identifier followed by the sequence number and total of 6 bytes of data (two bytes for each parameter). Hence, 8 bytes per second are transmitted.
  • F3 – F7: These packets contain the identifier, sequence number, and 2 bytes of data for UV radiation, sound level, pollutants, skin temperature and heart rate, respectively. The total of 4 bytes is transmitted for each.
Sensors as well as data communication consume energy. For instance, the PPG uses an optical sensor that requires high energy. In contrast to other wearable devices, we suggest bidirectional communication to activate/deactivate particular sensors through commands from the smartphone. In our implementation, the user presses buttons to send these commands, but task- or measurement-depending automatic commands can easily be implemented, too. This feature supports an anytime-anywhere-anything-anyone concept in wearable devices. In the manual setting, the wearer can decide at what time and in which location what type of data is collected. In our prototype, we use it for gas, sound level, UV light, and PPG (PPG implementation is tested in debugging mode). This concept targets the applicability of the prototype and the monitoring status. We briefly describe, how the developed software application, the feature, and prototype are acting as the complementary items to support this concept.
  • Anytime: the smartphone application as an interactive and flexible feature can activate/deactivate the sensors at any time, when the user is willing, by pressing the button.
  • Anywhere: the compact structure of the prototype with a diameter of 33 mm and a height of 20 mm, is very convenient to be worn at anywhere without user daily routine interference.
  • Anything: covering a large effective range of parameters from major areas of interest in healthcare, broadband the range of application of this prototype. However, this feature needs to be further developed and extended.
  • Anyone: Combination of all the previous three features that supports convenient, comprehensive plus cost-effective and continuous monitoring device make the prototype applicable by users from different categories.
Due to the high accuracy requirements of the data in motion tracking, no sensor activation is applied for gyroscope, accelerometer, and magnetometer. Here, the data are transmitted to the smartphone, immediately after BLE establishes the channel. As the air pressure, temperature, and humidity values are used for calibration, their data are also transmitted continuously without sensor activation/deactivation. Furthermore, we strictly aim at protecting measured data. We integrated memory (256 kB) to buffer data when BLE is temporarily unavailable. Due to the limited capacity of the memory, it is used only if necessary. A specific scenario for retrieving data from the internal memory has been implemented, too. So far, the transmission of buffered data requires a user decision. Once the user has pressed the “Data log” button on the smartphone, data are transmitted in a first-in-first-out (FIFO) mode as they have been stored. The last packet of stored data is followed with an empty packet that indicates the re-start of real-time data acquisition (Algorithm 1).

2.4. Experimental Conditions and Setup

We tested the functionality of the all layers and prototype comprehensively, indoors as well as outdoors. The test lasts from several minutes to a few hours up to days (30 h is the longest after battery charging). In general, six prototypes have been tested by five volunteers including three males and two females aged 26 to 48 years old. Users have been from different occupations ranging from ordinary workers with no technical information on the functionalities of the prototype to scientists in the fields. In every experiment, the user has been asked to wear the prototype on the top side of left-hand with outside-oriented microphone, in a good skin contact and comfortable. Users have been recommended to wear the prototype in a fix location on the left-hand to avoid moving the prototype. Besides, we have strongly asked the subjects to avoid covering the surface and microphone of the prototype. All users have been trained to only switch on/off the prototype, pair BLE, and configure the prototype with the application. Additionally, each user has been asked to avoid interruption of the data transmission unless otherwise necessary. At the end of each experiment, user has reported the technical problems and data interruption, if any. Each user also submitted the written protocol, specifying the activities and switching time between, if applicable. In each test, the prototype was BLE-paired with a smartphone, which starts the bidirectional data transmission. If activated, the sensors have sampling rates of sound level (2 Hz), gas (1 Hz), UV radiation (15 s time interval), air temperature (1 Hz), air humidity (1 Hz), air pressure (1 Hz), skin temperature (15 s time interval), PPG (15 s time interval), gyroscope (50 Hz), magnetometer (50 Hz), and accelerometer (50 Hz). During the tests, the prototype measured a surrounding sound level of 32 to 85 dB, with the resolution of 1 dB. NO 2 and CO are limited to 52 and 1680 ppm with the resolution of 1 and 5 ppm, respectively. This specification for UV index is restricted up to 9 with the resolution of 1. For all tests, we extracted the presented data from the smartphone in Comma-Separated Value (CSV) format. The sampling rates, specified above are constant and have been applied in every experiment. We have not imposed any specific conditions/restrictions to users, unless otherwise it is clearly stated. Hereafter, we will support the functionaries of the prototype with two types of tests: from Section 3.1, Section 3.2, Section 3.3, Section 3.4 and Section 3.5, the experimental tests are focused on the detail description of the tests for each sensor and the respective parameters. In these sections, the general conditions and specifications mentioned in Section 2.4 are applicable. However, if additional conditions have been available due to the nature of experiment(s), will be reported in the that particular subsection. We support the comprehensive functionaries of the prototype, data synchronization, accurate time stamp, and labeling the activities in Section 3.6.

3. Results

3.1. General Device

This test aims at testing the general functionalities of environmental conditions consist of humidity, air temperature, sound level, and N O 2 sensors. All conditions of using the prototype stated in the Section 2.4 are applied in this experiment. A male subject carried out the experiment during a daily routine. As the test was subjected to measure the environmental parameters, we have strongly recommended the user to not cover the prototype by dressing appropriately. The device was worn on left-hand, with outside-oriented microphone for 75 min, and 4500 samples of sound level, 2250 samples of air humidity and temperature, and 300 samples of N O 2 were collected (Figure 9—Left). In particular, the user performed an outdoor test using different modes of transportation (train, bus, and walking). According to the reported protocol, the samples from 1250 to 2200 and from 2450 to 3350 belong to riding the bus and train, respectively. The interval between samples 170 and 1100 indicate higher loudness and lower temperature. This period corresponds to the outside walk. As expected, temperature and humidity are in a reverse correlation. Nguyen et al. consider this indicating proper functionality of the sensors and platform [55].

3.2. Gas Sensors

To evaluate the sensitivity of our prototype to hazardous gases, we conducted tests for both CO and NO 2 individually in a chemical laboratory (Center for Life Science Automation, Rostock, Germany). We co-locate a calibrator (BW alert, IL, USA) at similar position and distance to the gas sources and calibrated both devices before the test. The calibration of the prototype lasts about 10 s to read the environmental humidity, pressure, and temperature and calibrate the gas sensor. The red LED and beeper indicate the process. When the sensor sticks to zero, the alert is stopped and the device is ready for measurement. After the calibration, a container is filled with gas. The values are measured and monitored in real-time (Table 4). Regarding the calibrator values as ground truth, the accuracy of our prototype in majority of the tests is above 95% (error less than 5%).
The NO 2 test was performed by a technician wearing the prototype. The set up, configuration, sampling rate, and location of the prototype are the same comply with the regulations stated in Section 2.4. We have asked the subject to fold up the sleeve to avoid covering the sensor. As the part of chemical tests at center for life science automation, the digestion acid of vessels in microwave is performed. These vessels contain high concentration of NO 2 which are measured by opening the lead. This is a realistic performance of chemical technicians which more often is implemented. Thus, we decided to do this experiment, testing the air pollutant sensor of the prototype exposed to hazardous gases. The reason was to carefully check the characteristics of sensor (response time, recovery time, resolution, and spin). This also can be an application of the prototype in safety monitoring of workplaces for chemical laboratories. Following the laboratory’s safety conditions, seven vessels of microwave digestion are opened one after another (Figure 10). As this was a realistic experiment with hazardous air pollutants in chemical laboratory, at the day of experiment the number of sampling vessels prepared by the technician were seven. This does not indicate any specific reason.
In some tests with high gas concentration, the response time is instant, while the recovery time is increased. The maximum gas concentration was recorded for the vessels 1, 2, 4, and 6 with 52.8 ppm. This is the saturation boundary of the device. As the minimum, the device measures 8.9 ppm for vessel 3. Vessels 6 and 7 yield 21.7 and 37.6 ppm, respectively. These concentrations are extremely dangerous and yield alerts from the prototype. Figure 10 also shows the rising (response) and recovery times of sensor, which are defined as the time required for the sensor to react to an exposure and to reach back the zero-level after removal of the gas, respectively. The response time of the sensor did not exceed 2 s. The recovery time of the sensor node varies from 5 s to 30 s.

3.3. UV Sensor

This experiment was particularly designed to test the functionality of UV sensor. The general regulation of experiments, set up sampling rate, and the configuration were the same as mentioned earlier. We did not impose any additional conditions but strictly have asked the subject to maintain the following: 1- do not put the left-hand in pockets, 2- do not cover the surface of the prototype with any types of external objects, and 3- the test must be performed only outdoor. As clouds filter UV light, we selected a windy and cloudy day to test the UV sensor. Our prototype was worn by a user who logged the sun occlusions over a period of 20 min (Figure 9—right). The opening window of the UV sensor covers at most up to angle of 130 ° . With partly occlusions, the measured UV index is not exceeding 2.0. After about 7 min, the thick clouds covered the sun completely and did not release it anymore. Therefore, the measured UV index is zero after about 400 samples (Figure 9—right).
In particular, the photo diode detects the 240–370 nm range of light (which covers UVB and most of UVA spectrum). It delivers a signal of nano amperes. We tossed on an operational amplifier to yield an output voltage level of UV detection in the range of 0.1 to 1 V. Hence, for calibration and conversion from voltage to UV index, the output needs to be divided by 10 (Table 5).

3.4. PPG Sensors

We further conducted preliminary tests to measure vital signs. The obtained PPG is displayed on an oscilloscope (Figure 11—top). The emitting green LED has the peak wavelength of 515 nm and peak wavelength of photodiode is 565 nm. The reflected light from transmissive LED is measured by APDS-9008. The raw signal needs to be pre-processed by filtering the noise and also amplification. The output signal is followed by a composition of RC as the first passive low pass filter (LPF). Furthermore, the signal is filtered by a high pass filter (HPF) by the second composition of CR. We have set the cut-off frequency in the range of approximately 0.07–3.4 Hz. Output signals of physiological parameters are in a very small range of amplitude (µV). Therefore, to feed the signal to the microcontroller, we have adjusted the gain to 330. As the signal of PPG is in the range of 20–40 Hz, therefore, according to Nyquist sampling theory, the sampling frequency must be greater than or equal to twice of original signal ( f f s ). In order to meet the conditions of the theory and be in the safe side to restore the signal, the sampling frequency of the microcontroller has been set to 500 Hz. The detected peak of the PPG signal is 280 mV. In each iteration of 15 s, the PPG signal is acquired for 3 s. Except some saturation artefacts (Figure 11—top, left panel), the curves nicely correspond to the expected shape of a PPG signal (Figure 11—top, right panel), as described, for instance, in Reference [56].
From our measurement, we can extract clearly the systolic amplitude, which indicate the pulsating changes in the volume of blood [57] and relate to stroke [58]; and the diastolic amplitude, which is mathematically the point where the first derivative is zero [59]. Furthermore, the peak-to-peak interval is easily derived from our measured data. The 180 ms correspond to the R-wave interval of the ECG signal [56]. The amplitude and time differences of systolic and diastolic amplitude (in our test 120 mV and 70 ms, respectively) provide valuable information for understanding the cardiovascular system [60], as this parameter changes on gender and age of the subject [61,62].

3.5. Skin Temperature Sensor

Furthermore, we asked a user to perform a skin temperature test for 50 min as a daily routine. The user experienced indoor and outdoor activities. The cycle starts with 7 min outdoor walking (first 28 samples in Figure 11—Right) followed with entering a saloon for a social event for 18 min (samples between 29 to 100 in Figure 11—Right). Thereafter, the user left the saloon and entered an office where she had a conversation. This conversation lasts for 7 min (samples 101 to 128 in Figure 11—Right). Then, the user left the office for outdoor walking.
The skin temperature output, however, is influenced by several environmental factors such as air pressure and temperature, activities, location, attachment of the device, the sensor surface, and contact to the skin [63,64]. Having this in mind, the recorded data seems compatible with the protocol description.

3.6. Prototype Test and Data Synchronization

In this subsection we present the collected data from an approximately 25 min of prototype test (see Figure 12). The subject has been asked to wear the prototype on her left wrist and not covering the surface, do not interrupt the measurement unless it occurs due to the technical issue generated from the prototype. The subject did not have information on the functionality of the prototype and only was trained to switch on, configure and at the end of the experiment disconnect and switch off the prototype. The subject was a healthy female with 28 years old. According to the protocol reported by the subject, she has started the experiment in the morning at 9:55, 3 min before leaving her office, and it was completed at 10:19 at the other side of city ending to the other indoor location. Based on the protocol, the user spends three minutes in her indoor workplace. During this time, she experiences exposing the loudness of 32 to 57 dB, a room temperature of approximately 26 °C with the humidity range of 60% to 63% RH. During this period, as we expect the prototype does not detect any UV and N O 2 . Skin temperature is in the range of 19 to 23 °C. The subject continue to her daily routine by walking outdoor heading to train station. In this period, loudness, UV, air temperature, air humidity, and skin temperature are in the range of 32–59 dB, 0–5 index, 26–28 °C, 63–56 RH, and 18–28 °C, respectively. Interestingly, the 0.7 ppm has been recorded for N O 2 . We can indicate this event as a waiting time behind a red traffic light on a cross section in a close distance to vehicles. This period lasts 8 min approximately. Riding a train for less than four minutes is the next activity of the subject. The loudness is significantly reduced (32–53 dB) and UV is detected in the range of 0–3 index. This may be considered as the indication of sitting the subject in window seat, which is comply with her written protocol. The subject spends the next 7 min walking from the train station to her target location. We perceive increasing the average of loudness as expected. While the highest UV index (5) is recorded in this period, the longest zero value of UV also is observed. This indicate the diversity of the route that user has been under gone. The last four minutes of this experiment has been recorded in indoor, again. Zero UV index and low average intensity of loudness can be considered as the location change. The subject, did not report interruption in data transmission nor any malfunctioned. As a result of this experiment, we have successfully tested the whole prototype for testing data transmission, sensor adequate functionality, and data synchronization.

3.7. Hardware Costs

Several authors pointed out the importance of pricing of such devices [65,66]. Of course, the final price respects many parameters, not only the hardware. Food and Drug Administration (FDA) approval, for instance, is a costly and long procedure process that is applied to medical devices as well. However, we estimated hardware costs when producing ten prototypes. From this small charge, the hardware price is as low as 132 Euros (Table 6, which will significantly be reduced when charge size is increased.

3.8. Power Consumption

Continuous healthcare monitoring is the function of total power consumption and is a critic aspect of designing wearables [67]. Currently, a lithium-ion battery of capacity C bat = 230 mAh powers on the prototype. The total average current and the power consumption is approximately I ave = 18.35 mA and P ave = 51.38 mW , respectively. The main current consumers are (Table 7):
  • Basic functionalities (A), which refer to all hardware and software preparation while powering on. This includes boot-loading, all interfaces and sensors’ initialization, (not necessarily configuration), hardware check, and so forth. It also includes powering the BLE connection;
  • Internal memory (B);
  • Behavioral sensors (C), which are collecting data continuously and start measuring with powering on the device;
  • Physiological sensors, that is, the skin temperature (D) and the PPG (E);
  • Environmental sensors, gas (F), loudness (G), and UV sensors (H) that consume in average 2.23 mA, 4.013 mA, and 0.46 mA, respectively. In addition, we have the air condition sensors such as pressure, temperature, and humidity (I); and
  • Display (K), which dissipates slightly less than 2.7 mA.
We measure the total power consumption and the battery operation time according to strict measurement of current consumption. To construct the power consumption profile we have identified the major sources of consumption. We have also included the current leakage and minor resources consumption in the final calculation by inserting basic functionality (A) profile. The battery is connected to the prototype via a 100 Ohm resistor, and consequently is monitored on the oscilloscope. The current consumption is measured in three specific conditions of activation, standby, and deep sleep and is applied to each sensor and component, if applicable (see Equations (1) and (2)).
I a v e = i = 0 2 I i × t i t t o t a l ,
where i indicates the status of sensor in activation, standby, and deep sleep modes.
P a v e = i = 0 2 I i × V s u p p l y × t i t t o t a l .
The sensors and components are activated one after another via embedded code to assure the functionality of the sensors. In addition, the minor resources also which are detected are included in the measurement. Activation of a sensor is followed with recognition of sensor status (activation, standby, and deep sleep). The period of each mode will influence the final calculation. In general, the sensors with high sampling rate (e.g., behavioral) will not be subjected to deep sleep mode. The current power consumption is subtracted from the previous recorded measurement and the consumption of the particular sensor/component is specified. I m a x and I m i n indicate the sampling and deep sleep/standby mode, respectively. When BLE is connected, the internal memory is excluded from the total power consumption but an additional current of 1.35 mA is imposed. This yields for the total battery runtime:
T = C bat I ave = 230 mAh 18.35 mA = 12.53 h .
Table 8 shows the minimum and maximum peaks recorded without considering the duty cycle. Comparison of maximum and average current consumption of PPG, significantly indicates the signal cycle activation (time interval: 15 s). The average current and power consumption have been calculated according to deep sleep, standby and activation modes.

4. Discussion

There is large agreement that the safety monitoring of workplaces and COPD requires the monitoring of environmental, behavioral, and physiological parameter [68,69]. However, the majority of scientific work in mobile health and safety monitoring is limited to one at most two of these domain [2,46]. Furthermore, the authors still use decentralized data collection and processing systems [47,49]. Usually, they integrate sensors into wearables and combine with commercial devices (mostly for vital signs) to enhance the range of monitored parameters [30,50]. In addition, many existing platforms offer data collection with several single-parameter devices integrated into a wireless body area network (WBAN) [70], and in some cases (unavoidable) stationary medical equipment [71]. However, there are common concerns regarding the practical application of these platforms in terms of convenience, economic, reliability, long-term usage, user-friendly, pervasive monitoring, and general performance [72].
The wrist-worn prototype proposed in this work introduces an innovative hardware solution with the 3D MPL approach. We intend to provide COPD patients an efficient companion for multi-parameter monitoring and real-time data transmission. However, patients can use our prototype also within sensor platforms [73,74]. Nevertheless, with respect to the convenient wearability of the prototype, it can be applied for safety monitoring of workers in construction sites without interfering in the daily working routine and reducing the maneuverability.
In comparison with the state-of-the-art in safety [2,30] and COPD monitoring devices [49,50], the proposed device improves wearability and increases the dimensions of monitoring (Table 9). Indeed, for the first time, we consider environmental monitoring and combine it with behavioral and physiological domains, all embedded into a lightweight wrist-worn device. Despite work that focuses on monitoring via distributed approaches and WBAN [29,50] or integration of commercial devices [30,49], we concentrate on standalone and independent monitoring with central data processing. The design supports convenient (wrist-worn) monitoring without imposing difficulties from weight [46], wire based communication [49], and interfering the users routine [50]. Moreover, our prototype supports sensor (de-) activation. This feature allows patient (user)-specific customization, for example, turning from single to multiple hazardous gas monitoring. Thus, there is bi-directional interaction of smartphone (as the gateway) and the device. In the long term, medical caregivers will configure the device.
We briefly discuss the interpretation of the results and experimental tests. The output results of Section 3.1 shows a large range of loudness swinging. The respective sensor was set to high sensitivity to detect any changes (record the peaks) but taking the average changes into consideration and comparing with the delivered protocol, indicate the mode of transportation changes. Performing this experiment in a coastal city and large difference in humidity and temperature within a limited period of test is considered as the travel direction (e.g., toward sthe coast or in opposite direction) and the fine performance of the prototype. The specified resolution, response time, and recovery time of the prototype with the respect to air pollutants, depend on concentration of the exposed target gases. Higher concentration of pollutant and shorter distance to the source, reduce the response time and consequently increased the recovery time. As a result, the visualized saturation state of Figure 10 exhibits the concentrations beyond the boundary of the prototype. The results of skin temperature as a physiological parameter are influenced by external players. Environmental parameters (e.g., air temperature) and the mode and location of wearability affect the measured output. Comparing the recorded skin temperature with the written protocol during the tests, indicates the effect of air temperature on the output. Swinging the data under the constant environmental conditions can be due to movement of the prototype caused by a loose attachment.
However, there are limitations of the device. The boundary measurement of CO , NO 2 , UV index, and loudness are 0 to 1680 ppm, 0 to 52.8 ppm, 0 to 9, and 32 to 85 dB, respectively. The resolution is 5 ppm, 0.1 ppm, 1, and 1 dB, respectively. It is also worth mention that the multi-gas monitoring works only in BLE-paired status. In contrast to existing approaches (Table 9), our device supports internal data storage in BLE-disconnected mode for approximately 10 h. So far, we recommend the immediate data transmission of the logged data when BLE is resumed, which will be performed automatically in future versions of the device software. While conducting the experimental tests, we observed dependencies of PPG, skin temperature, and UV measurements regarding the wearing location, tight or loose mounting, and relative angle of sensors. Furthermore, external material must not cover the device. Hence, the user must make sure that the physiological layer is appropriately located and tight on the wrist. The prototype is required to be outside-oriented, as the used microphone is omni-directional. Also, more comprehensive evaluations and field test are required before the device can be confirmed in clinical trials.
In future, if a user is willing to extend his/her health monitoring conditions and already has an integrated diagnostic system in the private spaces, our prototype can be readily integrated to smart-homes [75] and smart-cars [76] for data correlation, expanding the application usage, and improving the reliability of collected data. Assuming stable communication between device and smart environments, the off-line time can be extended significantly when the device is worn in such environments.
Furthermore, medical application is not limited to COPD. The acute respiratory distress syndrome (ARDS), for instance, also needs monitoring of environmental, behavioral, and physiological parameters [77], as ARDS patients are encountering an often severe shortness of breath, have a cough, and may have fever [78]. Furthermore, ARDS patients have difficulties when inhaling and exhaling, and thus a chest-worn device is infeasible [79]. Most people with ARDS stay in bed, many in critical states [80]. Therefore, embedding our device in smart environments will further broadband the monitoring and link vital signs to non-medical data (e.g., environmental and behavioral) for status assessment and early detection of abnormalities. In future studies we plan to shift the concentration from testing the functionality to improve the accuracy of measured data. Thus we will compare the data measured with the developed prototype with those measured with gold standard instruments to enhance the performance in terms of accuracy and uncertainty. For the next version of the prototype, we plan to implement a notification system to alert abnormalities detected from domain-fused sensor data. Currently, we have reserved the required circuit on Layer 5. Furthermore, we aim at driving research towards self-powered devices and consider a hybrid power-harvesting scenario. With a more comprehensive evaluation, we also plan to use the prototype for COPD patients in the clinical setting.

5. Conclusions

In conclusion, MPL is an innovative approach for the design of wearable safety and health monitors yielding convenient, comprehensive, cost-effective, and continuous monitors. Wrist-worn devices can integrate parameters from the environmental, behavioral, and physiological domain. Sensor activation and deactivation support patient-specific device configuration. Standalone (offline) and BLE-paired (online) operation modes secure data recorded with mobile health monitors.

Author Contributions

Conceptualization: M.H.; methodology: M.H.; hardware & software development: M.H.; formal analysis: M.H., K.T., S.D. and T.M.D.; investigation: M.H. and S.D.; data curation: M.H., S.D., T.M.D.; visualization: M.H., K.T. and S.D.; supervision: K.T., S.D. and T.M.D.; project administration: M.H., S.D., K.T., J.M.W., J.W., T.M.D.; wrting—original draft, M.H.; writing—review and editing, M.H., S.D., K.T., J.M.W., J.W., T.M.D. All authors have read and agreed to the published version of the manuscript.

Funding

We acknowledge support by the German Research Foundation and the Open Access Publication Funds of the Technische Universität Braunschweig. The previous version of this research was funded by the Ministry of Economics, Employment and Health of the Government of Mecklenburg-Vorpommern, Germany, under Project MV (TBI-V-1-127-VBW-044).

Acknowledgments

Authors would like to express the gratitude to Negar Haghi for the clinical consultants, Heiko Engelhardt, Sybille Horn, and Anne Reichelt for the technical supports.

Conflicts of Interest

The authors declare no conflict of interest.

Abbreviations

The following abbreviations are used in this manuscript:
WHOWorld Health Organization
COPDChronic Obstructive Pulmonary Disease
COCarbon Monoxide
NO2Nitric Dioxide
O3Ozone
PMParticle Matter
UVUltraviolet
PPGPhotoplethysmography
GUIGraphical User Interface
PPUPortable Patient Unit
GPRSGeneral Packet Radio Service
RIIVRespiratory-Induced Intensity Variation
MPLMulti-Physical Layer
BLEBluetooth Low Energy
PCPersonal Computer
DSSDecision Support System
PPMPart Per Million
EITElectrical Impedance Tomography
FIFOfirst-in-first-out
ADCAnaloge to Digital Converter
IICInter Integrated Circuit
DOFDegrees of Freedom
4CComprehensive, Convenience, Continuous, and Cost-effective
PPGPhotoplethysmogram
ARDSAcute Respiratory Distress Syndrome
FDAFood and Drug Administration
CSVComma-Separated Values

References

  1. Lilly, E.J.; Senderovich, H. Palliative care in chronic obstructive pulmonary disease. J. Crit. Care 2016, 35, 150–154. [Google Scholar] [CrossRef]
  2. Wu, F.; Wu, T.; Yuce, M.R. An internet-of-things (IoT) network system for connected safety and health monitoring applications. Sensors 2019, 19, 21. [Google Scholar] [CrossRef] [Green Version]
  3. Wu, F.; R’udiger, C.; Yuce, M.R. Real-time performance of a self-powered environmental IoT sensor network system. Sensors 2017, 17, 282. [Google Scholar] [CrossRef] [Green Version]
  4. Misra, V.; Bozkurt, A.; Calhoun, B.; Jackson, T.; Jur, J.S.; Lach, J.; Lee, B.; Muth, J.; Oralkan, Ö.; Öztürk, M.; et al. Flexible technologies for self-powered wearable health and environmental sensing. Proc. IEEE 2015, 103, 665–681. [Google Scholar] [CrossRef]
  5. Flores, M.; Glusman, G.; Brogaard, K.; Price, N.D.; Hood, L. P4 medicine: How systems medicine will transform the healthcare sector and society. Pers. Med. 2013, 10, 565–576. [Google Scholar] [CrossRef] [Green Version]
  6. Cosoli, G.; Spinsante, S.; Scalise, L. Wrist-worn and chest-strap wearable devices: Systematic review on accuracy and metrological characteristics. Measurement 2020, 159, 107789. [Google Scholar] [CrossRef]
  7. Rupp, M.A.; Michaelis, J.R.; McConnell, D.S.; Smither, J.A. The role of individual differences on perceptions of wearable fitness device trust, usability, and motivational impact. Appl. Ergon. 2018, 70, 77–87. [Google Scholar] [CrossRef]
  8. Rajanna, V.; Lara-Garduno, R.; Behera, D.J.; Madanagopal, K.; Goldberg, D.; Hammond, T. Step up life: A context aware health assistant. In Proceedings of the Third ACM SIGSPATIAL International Workshop on the Use of GIS in Public Health; ACM: New York, NY, USA, 2014; pp. 21–30. [Google Scholar]
  9. Banerjee, S.; Hemphill, T.; Longstreet, P. Wearable devices and healthcare: Data sharing and privacy. Inf. Soc. 2018, 34, 49–57. [Google Scholar] [CrossRef] [Green Version]
  10. Spanakis, E.G.; Santana, S.; Tsiknakis, M.; Marias, K.; Sakkalis, V.; Teixeira, A.; Janssen, J.H.; de Jong, H.; Tziraki, C. Technology-based innovations to foster personalized healthy lifestyles and well-being: A targeted review. J. Med. Internet Res. 2016, 18, e128. [Google Scholar] [CrossRef]
  11. Kroll, R.R.; Boyd, J.G.; Maslove, D.M. Accuracy of a wrist-worn wearable device for monitoring heart rates in hospital inpatients: A prospective observational study. J. Med. Internet Res. 2016, 18, e253. [Google Scholar] [CrossRef]
  12. Scalise, L.; Cosoli, G. Wearables for health and fitness: Measurement characteristics and accuracy. In Proceedings of the 2018 IEEE International Instrumentation and Measurement Technology Conference (I2MTC), Houston, TX, USA, 14–17 May 2018; pp. 1–6. [Google Scholar]
  13. Alonso, S.G.; de la Torre Díez, I.; Zapiraín, B.G. Predictive, personalized, preventive and participatory (4P) medicine applied to telemedicine and eHealth in the literature. J. Med. Syst. 2019, 43, 140. [Google Scholar] [CrossRef] [PubMed]
  14. Wu, R.; Liaqat, D.; de Lara, E.; Son, T.; Rudzicz, F.; Alshaer, H.; Abed-Esfahani, P.; Gershon, A.S. Feasibility of using a smartwatch to intensively monitor patients with chronic obstructive pulmonary disease: Prospective cohort study. JMIR mHealth uHealth 2018, 6, e10046. [Google Scholar] [CrossRef] [PubMed]
  15. Wortley, D.; An, J.Y.; Nigg, C.R. Wearable technologies, health and well-being: A case review. Digit. Med. 2017, 3, 11. [Google Scholar] [CrossRef]
  16. Schall, M.C., Jr.; Sesek, R.F.; Cavuoto, L.A. Barriers to the adoption of wearable sensors in the workplace: A survey of occupational safety and health professionals. Hum. Factors 2018, 60, 351–362. [Google Scholar] [CrossRef]
  17. Alex, G.; Varghese, B.; Jose, J.G.; Abraham, A. A modern health care system using IoT and Android. Int. J. Comput. Sci. Eng. 2016, 8. [Google Scholar]
  18. Gholizadeh, A. Miniaturized Electronic Sensors and Actuators for Healthcare and Environmental Monitoring. Ph.D. Thesis, Rutgers University-School of Graduate Studies, New Brunswick, NJ, USA, 2019. [Google Scholar]
  19. Ko, F.W.; Hui, D.S. Air pollution and chronic obstructive pulmonary disease. Respirology 2012, 17, 395–401. [Google Scholar] [CrossRef]
  20. Hu, G.; Zhong, N.; Ran, P. Air pollution and COPD in China. J. Thorac. Dis. 2015, 7, 59. [Google Scholar]
  21. Zannin, P.H.T.; Diniz, F.B.; Barbosa, W.A. Environmental noise pollution in the city of Curitiba, Brazil. Appl. Acoust. 2002, 63, 351–358. [Google Scholar] [CrossRef]
  22. D’Orazio, J.; Jarrett, S.; Amaro-Ortiz, A.; Scott, T. UV radiation and the skin. Int. J. Mol. Sci. 2013, 14, 12222–12248. [Google Scholar] [CrossRef] [Green Version]
  23. Shimazaki, T.; Hara, S.; Okuhata, H.; Nakamura, H.; Kawabata, T. Cancellation of motion artifact induced by exercise for ppg-based heart rate sensing. In Proceedings of the 2014 36th Annual International Conference of the IEEE Engineering in Medicine and Biology Society, Chicago, IL, USA, 26–30 August 2014; pp. 3216–3219. [Google Scholar]
  24. Gatti, U.C.; Schneider, S.; Migliaccio, G.C. Physiological condition monitoring of construction workers. Autom. Constr. 2014, 44, 227–233. [Google Scholar] [CrossRef]
  25. Antolín, D.; Medrano, N.; Calvo, B.; Pérez, F. A wearable wireless sensor network for indoor smart environment monitoring in safety applications. Sensors 2017, 17, 365. [Google Scholar] [CrossRef] [PubMed]
  26. Ghorani-Azam, A.; Riahi-Zanjani, B.; Balali-Mood, M. Effects of air pollution on human health and practical measures for prevention in Iran. J. Res. Med. Sci. Off. J. Isfahan Univ. Med. Sci. 2016, 21. [Google Scholar] [CrossRef]
  27. Search Results: UV Radiation Standard. Available online: https://www.who.int/search?page=1&pagesize=10&query=UV (accessed on 17 April 2020).
  28. Chen, M.; Ma, Y.; Song, J.; Lai, C.F.; Hu, B. Smart clothing: Connecting human with clouds and big data for sustainable health monitoring. Mobile Netw. Appl. 2016, 21, 825–845. [Google Scholar] [CrossRef]
  29. Dieffenderfer, J.; Goodell, H.; Mills, S.; McKnight, M.; Yao, S.; Lin, F.; Beppler, E.; Bent, B.; Lee, B.; Misra, V.; et al. Low-power wearable systems for continuous monitoring of environment and health for chronic respiratory disease. IEEE J. Biomed. Health Inform. 2016, 20, 1251–1264. [Google Scholar] [CrossRef] [PubMed]
  30. Haghi, M.; Neubert, S.; Geissler, A.; Fleischer, H.; Stoll, N.; Stoll, R.; Thurow, K. A Flexible and Pervasive IoT Based Healthcare Platform for Physiological and Environmental Parameters Monitoring. IEEE Internet Things J. 2020, 7, 5628–5647. [Google Scholar] [CrossRef]
  31. Martin, A.; Voix, J. In-ear audio wearable: Measurement of heart and breathing rates for health and safety monitoring. IEEE Trans. Biomed. Eng. 2017, 65, 1256–1263. [Google Scholar] [CrossRef]
  32. Majewski, S.; Pietrzak, A.; Tworek, D.; Szewczyk, K.; Kumor-Kisielewska, A.; Kurmanowska, Z.; Górski, P.; Zalewska-Janowska, A.; Piotrowski, W.J. Skin condition and its relationship to systemic inflammation in chronic obstructive pulmonary disease. Int. J. Chron. Obstruct. Pulmon. Dis. 2017, 12, 2407. [Google Scholar] [CrossRef] [Green Version]
  33. Kumar, S.; Matreja, P.; Gupta, A.; Singh, A.; Garg, P. To assess the quality of life (QOL) of caregivers and patients suffering from chronic obstructive pulmonary disease (COPD). J. Aller. Ther. S. 2012, 2, 2. [Google Scholar] [CrossRef]
  34. Donner, C.F.; Raskin, J.; ZuWallack, R.; Nici, L.; Ambrosino, N.; Balbi, B.; Blackstock, F.; Casaburi, R.; Dreher, M.; Effing, T.; et al. Incorporating telemedicine into the integrated care of the COPD patient a summary of an interdisciplinary workshop held in Stresa, Italy, 7–8 September 2017. Respir. Med. 2018, 143, 91–102. [Google Scholar] [CrossRef]
  35. Prudente, R.; Franco, E.A.T.; Mesquita, C.B.; Ferrari, R.; de Godoy, I.; Tanni, S.E. Predictors of mortality in patients with COPD after 9 years. Int. J. Chron. Obstruct. Pulmon. Dis. 2018, 13, 3389. [Google Scholar] [CrossRef] [Green Version]
  36. Beghé, B.; Fabbri, L.M.; Garofalo, M.; Schito, M.; Verduri, A.; Bortolotti, M.; Stendardo, M.; Ruggieri, V.; Fucili, A.; Sverzellati, N.; et al. Three-year hospitalization and mortality in elderly smokers with chronic obstructive pulmonary disease or chronic heart failure. Respiration 2019, 97, 223–233. [Google Scholar] [CrossRef] [PubMed]
  37. Velloso, M.; Stella, S.G.; Cendon, S.; Silva, A.C.; Jardim, J.R. Metabolic and ventilatory parameters of four activities of daily living accomplished with arms in COPD patients. Chest 2003, 123, 1047–1053. [Google Scholar] [CrossRef] [PubMed] [Green Version]
  38. Pedone, C.; Chiurco, D.; Scarlata, S.; Incalzi, R.A. Efficacy of multiparametric telemonitoring on respiratory outcomes in elderly people with COPD: A randomized controlled trial. BMC Health Serv. Res. 2013, 13, 82. [Google Scholar] [CrossRef] [PubMed] [Green Version]
  39. Hung, K.; Zhang, Y.T.; Tai, B. Wearable medical devices for tele-home healthcare. In Proceedings of the 26th Annual International Conference of the IEEE Engineering in Medicine and Biology Society, San Francisco, CA, USA, 1–5 September 2004; Volume 2, pp. 5384–5387. [Google Scholar]
  40. Binkley, P.F. Predicting the potential of wearable technology. IEEE Eng. Med. Biol. Mag. 2003, 22, 23–27. [Google Scholar] [CrossRef] [PubMed]
  41. Boric-Lubeke, O.; Lubecke, V.M. Wireless house calls: Using communications technology for health care and monitoring. IEEE Microw. Mag. 2002, 3, 43–48. [Google Scholar] [CrossRef]
  42. Sul, A.R.; Lyu, D.H.; Park, D.A. Effectiveness of telemonitoring versus usual care for chronic obstructive pulmonary disease: A systematic review and meta-analysis. J. Telemed Telecare 2018. [Google Scholar] [CrossRef]
  43. Beg, M.S.; Gupta, A.; Stewart, T.; Rethorst, C.D. Promise of wearable physical activity monitors in oncology practice. J. Oncol. Pract. 2017, 13, 82–89. [Google Scholar] [CrossRef]
  44. Patel, S.; Mancinelli, C.; Healey, J.; Moy, M.; Bonato, P. Using wearable sensors to monitor physical activities of patients with copd: A comparison of classifier performance. In Proceedings of the 2009 Sixth International Workshop on Wearable and Implantable Body Sensor Networks, Berkeley, CA, USA, 3–5 June 2009; pp. 234–239. [Google Scholar]
  45. Kollmann, D.; Hogan, W.K.; Steidl, C.; Hibbs-Brenner, M.K.; Hedin, D.S.; Lichter, P.A. VCSEL based, wearable, continuously monitoring pulse oximeter. In Proceedings of the 2013 35th Annual International Conference of the IEEE Engineering in Medicine and Biology Society (EMBC), Osaka, Japan, 3–7 June 2013; pp. 4156–4159. [Google Scholar]
  46. Noury, N.; Dittmar, A.; Corroy, C.; Baghai, R.; Weber, J.; Blanc, D.; Klefstat, F.; Blinovska, A.; Vaysse, S.; Comet, B. VTAMN-A smart clothe for ambulatory remote monitoring of physiological parameters and activity. In Proceedings of the 26th Annual International Conference of the IEEE Engineering in Medicine and Biology Society, San Francisco, CA, USA, 1–5 September 2004; Volume 2, pp. 3266–3269. [Google Scholar]
  47. Katsaras, T.; Milsis, A.; Rizikari, M.; Saoulis, N.; Varoutaki, E.; Vontetsianos, A. The use of the “Healthwear” wearable system in chronic patients’ early hospital discharge: Control randomized clinical trial. In Proceedings of the 2011 5th International Symposium on Medical Information and Communication Technology, Montreux, Switzerland, 27–30 March 2011; pp. 143–146. [Google Scholar]
  48. Tey, C.K.; An, J.; Chung, W.Y. A novel remote rehabilitation system with the fusion of noninvasive wearable device and motion sensing for pulmonary patients. Comput. Math. Methods Med. 2017, 2017, 5823740. [Google Scholar] [CrossRef]
  49. Bellos, C.C.; Papadopoulos, A.; Rosso, R.; Fotiadis, D.I. Identification of COPD patients’ health status using an intelligent system in the CHRONIOUS wearable platform. IEEE J. Biomed. Health Inform. 2014, 18, 731–738. [Google Scholar] [CrossRef]
  50. Chouvarda, I.; Philip, N.Y.; Natsiavas, P.; Kilintzis, V.; Sobnath, D.; Kayyali, R.; Henriques, J.; Paiva, R.P.; Raptopoulos, A.; Chételat, O.; et al. WELCOME—Innovative integrated care platform using wearable sensing and smart cloud computing for COPD patients with comorbidities. In Proceedings of the 2014 36th Annual International Conference of the IEEE Engineering in Medicine and Biology Society, Chicago, IL, USA, 26–30 August 2014; pp. 3180–3183. [Google Scholar]
  51. Haghi, M.; Stoll, R.; Thurow, K. A low-cost, standalone, and multi-tasking watch for personalized environmental monitoring. IEEE Trans. Biomed. Circuits Syst. 2018, 12, 1144–1154. [Google Scholar] [CrossRef]
  52. Yilmaz, T.; Foster, R.; Hao, Y. Detecting vital signs with wearable wireless sensors. Sensors 2010, 10, 10837–10862. [Google Scholar] [CrossRef] [PubMed]
  53. Kim, J.; Campbell, A.S.; de Ávila, B.E.F.; Wang, J. Wearable biosensors for healthcare monitoring. Nat. Biotechnol. 2019, 37, 389–406. [Google Scholar] [CrossRef] [PubMed]
  54. Kumari, P.; Mathew, L.; Syal, P. Increasing trend of wearables and multimodal interface for human activity monitoring: A review. Biosens. Bioelectron. 2017, 90, 298–307. [Google Scholar] [CrossRef] [PubMed]
  55. Nguyen, J.L.; Schwartz, J.; Dockery, D.W. The relationship between indoor and outdoor temperature, apparent temperature, relative humidity, and absolute humidity. Indoor Air 2014, 24, 103–112. [Google Scholar] [CrossRef] [PubMed] [Green Version]
  56. Yousef, Q.; Reaz, M.; Ali, M.A.M. The analysis of PPG morphology: Investigating the effects of aging on arterial compliance. Meas. Sci. Rev. 2012, 12, 266–271. [Google Scholar] [CrossRef] [Green Version]
  57. Asada, H.H.; Shaltis, P.; Reisner, A.; Rhee, S.; Hutchinson, R.C. Mobile monitoring with wearable photoplethysmographic biosensors. IEEE Eng. Med. Biol. Mag. 2003, 22, 28–40. [Google Scholar] [CrossRef] [Green Version]
  58. Murray, W.B.; Foster, P.A. The peripheral pulse wave: Information overlooked. J. Clin. Monit. 1996, 12, 365–377. [Google Scholar] [CrossRef]
  59. Millasseau, S.C.; Kelly, R.; Ritter, J.; Chowienczyk, P. Determination of age-related increases in large artery stiffness by digital pulse contour analysis. Clin. Sci. (Lond.) 2002, 103, 371–377. [Google Scholar] [CrossRef] [Green Version]
  60. Poon, C.; Teng, X.; Wong, Y.; Zhang, C.; Zhang, Y. Changes in the photoplethysmogram waveform after exercise. In Proceedings of the 2004 2nd IEEE/EMBS International Summer School on Medical Devices and Biosensors, Hong Kong, China, 26 June–2 July 2004; pp. 115–118. [Google Scholar]
  61. Elgendi, M. On the analysis of fingertip photoplethysmogram signals. Curr. Cardiol. Rev. 2012, 8, 14–25. [Google Scholar] [CrossRef]
  62. Hartmann, V.; Liu, H.; Chen, F.; Qiu, Q.; Hughes, S.; Zheng, D. Quantitative comparison of photoplethysmographic waveform characteristics: Effect of measurement site. Front. Physiol. 2019, 10, 198. [Google Scholar] [CrossRef]
  63. MacRae, B.A.; Annaheim, S.; Spengler, C.M.; Rossi, R.M. Skin temperature measurement using contact thermometry: A systematic review of setup variables and their effects on measured values. Front. Physiol. 2018, 9, 29. [Google Scholar] [CrossRef] [PubMed] [Green Version]
  64. Oh, W.; Ooka, R.; Nakano, J.; Kikumoto, H.; Ogawa, O. Evaluation of mist-spraying environment on thermal sensations, thermal environment, and skin temperature under different operation modes. Build. Environ. 2020, 168, 106484. [Google Scholar] [CrossRef]
  65. Xie, L.; Chen, P.; Chen, S.; Yu, K.; Sun, H. Low-Cost and highly sensitive wearable sensor based on napkin for health monitoring. Sensors 2019, 19, 3427. [Google Scholar] [CrossRef] [PubMed] [Green Version]
  66. Mosenia, A.; Sur-Kolay, S.; Raghunathan, A.; Jha, N.K. Wearable medical sensor-based system design: A survey. IEEE Trans. Multi-Scale Comput. Syst. 2017, 3, 124–138. [Google Scholar] [CrossRef]
  67. Chan, M.; Estève, D.; Fourniols, J.Y.; Escriba, C.; Campo, E. Smart wearable systems: Current status and future challenges. Artif. Intell. Med. 2012, 56, 137–156. [Google Scholar] [CrossRef] [PubMed]
  68. Tomasic, I.; Tomasic, N.; Trobec, R.; Krpan, M.; Kelava, T. Continuous remote monitoring of COPD patients—Justification and explanation of the requirements and a survey of the available technologies. Med. Biol. Eng. Comput. 2018, 56, 547–569. [Google Scholar] [CrossRef] [PubMed] [Green Version]
  69. Moraveji, N.; Golz, P.; Hollenbach, J.; Holt, M.; Murray, R. Long-Term, ambulatory respiratory monitoring of COPD patients using garment-adhered sensors. In Proceedings of the 2019 IEEE International Symposium on Medical Measurements and Applications (MeMeA), Istanbul, Turkey, 26–28 June 2019; pp. 1–6. [Google Scholar]
  70. Manirabona, A.; Fourati, L.C.; Boudjit, S. Investigation on healthcare monitoring systems: Innovative services and applications. In Wearable Technologies: Concepts, Methodologies, Tools, and Applications; IGI Global: Pennsylvania, PA, USA, 2018; pp. 1264–1283. [Google Scholar]
  71. Shi, S.; Xie, Y.; Li, M.; Liu, A.X.; Zhao, J. Synthesizing wider WiFi bandwidth for respiration rate monitoring in dynamic environments. In Proceedings of the IEEE INFOCOM 2019-IEEE Conference on Computer Communications, Paris, France, 29 April–2 May 2019; pp. 181–189. [Google Scholar]
  72. Wu, A.C.; Tse, S.M.; Balli, F. Mobile applications and wearables for chronic respiratory disease monitoring. In Precision in Pulmonary, Critical Care, and Sleep Medicine; Springer: Berlin/Heidelberg, Germany, 2020; pp. 291–304. [Google Scholar]
  73. Radogna, A.V.; Fiore, N.; Tumolo, M.R.; De Luca, V.; De Paolis, L.T.; Guarino, R.; Leo, C.G.; Mincarone, P.; Sabato, E.; Satriano, F.; et al. Exhaled breath monitoring during home ventilo-therapy in COPD patients by a new distributed tele-medicine system. J. Ambient Intell. Humaniz Comput. 2019, 1–9. [Google Scholar] [CrossRef]
  74. Merone, M.; Pedone, C.; Capasso, G.; Incalzi, R.A.; Soda, P. A decision support system for tele-monitoring COPD-related worrisome events. IEEE J. Biomed. Health Inform. 2017, 21, 296–302. [Google Scholar] [CrossRef]
  75. Schwartze, J.; Schrom, H.; Wolf, K.H.; Marschollek, M. Facilitating inter-domain synergies in ambient assisted living environments. Stud. Health Technol. Inform. 2016, 228, 476–480. [Google Scholar]
  76. Wang, J.; Warnecke, J.M.; Deserno, T.M. The vehicle as a diagnostic space: Efficient placement of accelerometers for respiration monitoring during driving. Stud. Health Technol. Inform. 2019, 258, 206–210. [Google Scholar]
  77. Diehl, J.L.; Vimpere, D.; Guérot, E. Obesity and ARDS: Opportunity for highly personalized mechanical ventilation? Respir. Care 2019, 64, 1173–1174. [Google Scholar] [CrossRef] [PubMed]
  78. Aliverti, A. Monitoring of Respiratory Mechanics. In Acute Respiratory Distress Syndrome; Springer International Publishing: Cham, Switzerland, 2017; pp. 225–243. [Google Scholar]
  79. Guo, J.; Yan, W.; Yang, Y.; Wang, Z.; Tian, F. Monitoring of vascular endothelial growth factor and its soluble receptor levels in early trauma. J. Trauma Acute Care Surg. 2017, 82, 766–770. [Google Scholar] [CrossRef] [PubMed]
  80. Spadaro, S.; Park, M.; Turrini, C.; Tunstall, T.; Thwaites, R.; Mauri, T.; Ragazzi, R.; Ruggeri, P.; Hansel, T.T.; Caramori, G.; et al. Biomarkers for acute respiratory distress syndrome and prospects for personalised medicine. J. Inflamm. (Lond.) 2019, 16, 1. [Google Scholar] [CrossRef] [PubMed]
Figure 1. General strategy of operation.MCU: Microcontroller Unit.
Applsci 10 05470 g001
Figure 2. Layer 1: Gas sensor (left); Layer 2: Gas sensor driver’ bottom (middle) and top (right).
Applsci 10 05470 g002
Figure 3. Layer 3: Hardware interface with a UV sensor (top view, left) and sound module (bottom view, right).
Applsci 10 05470 g003
Figure 4. Layer 4: Host platform in top (left) and bottom (right) view with integrated sensors.
Applsci 10 05470 g004
Figure 5. Layer 5: Physiological sensors. Top view (right): LED for measuring skin temperature and heart rate; Bottom view (left): temperature sensor and photo diode.
Applsci 10 05470 g005
Figure 6. Assembled prototype. Top line: top, bottom, and a subject wearing the wrist-worn device views; bottom line: side views of layers: 1-gas sensor, 2-gas sensor driver, 3-hardware interface, 4-main platform, 5-physiological layer. Diameter and height of the prototype are 33 mm and 20 mm, respectively.
Applsci 10 05470 g006
Figure 7. To activate the sensor(s), user presses the buttons on the smartphone.
Applsci 10 05470 g007
Figure 8. Developed application for bidirectional communication between smartphone and the prototype.
Applsci 10 05470 g008
Figure 9. (Left) general device test. A typical daily routine (75 min) while recording sound level, NO 2 , air humidity, and temperature. (Right) UV Test. The radiation is measured outside for 1200 s (20 min).
Applsci 10 05470 g009
Figure 10. NO 2 test in a chemical laboratory. Vessels 1 to 7 indicate the output of microwave digestion; the yellow and red horizontals mark the danger level of 2 ppm and 5 ppm, respectively.
Applsci 10 05470 g010
Figure 11. Left: measured photoplethysmography (PPG) displayed on an oscilloscope (left) and expected shape (right). Right: skin temperature test. The monitoring of skin temperature lasts 50 min.
Applsci 10 05470 g011
Figure 12. A subject wearing the prototype for 25 min.
Applsci 10 05470 g012
Table 1. Standard level of environmental pollutants and their sources with health impact [26,27].
Environmental PollutantsMajor Source of EmissionAverage TimeStandard LevelHealth Impact Target Organs
COmotor engines, burning coal, oil and wood, activities, smokes1 h35 mg/m3CNS and cardiovascular damages
NO2fuel combustion, burning coal1 h75 mg/m3respiratory and CNS involvement, eye irritation
UVBsun, light bulbs, UV lampsdepending on the type of skin1–2: safely stay outside
3–7: seek shade during middy hours
8–11: avoid being outside during middy hours
skin cancer, aging skin, age-related macular
degeneration of the retina and cortical cateracts
Sound loudnessvehicle, industry, traffic1 h60–70 dBear damage and hearing loss, CNS involvement, sleep disorder
Table 2. Effective parameters and their domains in healthcare with indication and consequences for chronic obstructive pulmonary disease (COPD) patients and monitoring of workplaces safety.
DomainParameterIndicationConsequence
Environmentalair conditiongeneral healthextreme temperature and/or humidity increase breathing difficulty and lower general well-being
air pollutantsrespiratory and cardiovascular problemsincreased risk of heart failure and mortality due to breathing difficulty and worsen lung condition
sound levellowered sleep quality or sleep disordersimpacts well-being, protracts recovery, and increases mortality
UV exposuresensitized skin with higher temperaturehigher risk of skin cancer
Physiologicalheart ratehigher rate or high variabilityincreased risk for cardiovascular problems and higher mortality
skin temperatureincreased temperatureindicates the status of COPD patients
breathing raterespiratory problemsincreased mortality
pulse oximetryarterial carbon dioxidea critical criteria for general health status of COPD patients
Behavioralmotion tracking, step countingmobility disordersreduced physical activities worsen general health status
Table 3. Sensors and components of the prototype. Note: ppm: part per million, HW: hardware, IIC: Inter-integrated circuit, ADC: analogue-to-digital converter, T: time, Int: interval, Pow: power, Cons: consumption.
Sensor/ComponentCompanyLayerCategoryParameterT. Int. (ms)InterfacePow. Supply (V)Pow. Cons. ( μ W)Resolution
3SP_NO2_5FSpecgasambient-chem. NO 2 1000IIC & ADC 10.0–50.00.1 ppm
3SP_CO_1000SpecCO1000 10.0–50.05 ppm
MCP6041Microchip 1.6–61.98
ISL60002DIH320ZIntersil 2.8–5.51.15
LMP91000TI NA2.8–5.510
MicrophonePanasonicHW interfaceambient-phys.sound level500ADC2.0–10.01500 (Max.)1 dB
LM358TI5002.0–321.65
GUVA-S12SDEocincUV15,0002.0–5 1 index
MCP6001MicrochipNA1.8–6
MAX30205Maximphysiologicalvital signskin temp.15,000IIC2.7–3.31301 ° C
AM2520ZGC09Kingbrightheart rate15,000ADC2.7–6
APDS9008Broadcom15,0001.6–5.51900
KXG03Kionixhost platformmotionacc/gyr20IIC1.8–3.6
KMX62- 1031Kionixmag.201.7–3.6
KX122-1037Kionixaccel.201.71–3.6
LPS25HBSTMicr.ambient-phys.barometer10001.7–3.6 1 hPa
SHT31- DIS-BSensirionhum./temp.10002.4–5.5 1%RH/1 ° C
Table 4. CO test. Comparison of the prototype performance with a CO-calibrator in ppm.
Prototype 512255090185205265290
Calibrator 410245295192204271298
Table 5. Voltage to UV index conversion.
Voltage (mV) 97196302405498601708801891
UV index 123456789
Table 6. Hardware costs for the prototype. final expense of the wrist-worn prototype.
ItemQuantityPrice (€)
Host plaform10690.00
PCB (physiological layer)104.50
PCB (hardware interface)104.50
PCB (gas sensor driver)101.80
Gas sensor10170.00
UV sensor1026.00
Microphone1018.00
LM358102.83
MCP6001T-I / OT102.20
MAX30205MTA + T(skin temp.)1031.60
AM2520ZGC09 (LED)106.80
APDS-9008-0201012.80
DF37B-24DP-0.4V (connector)109.00
DF37NB-24DS-0.4V (connector)107.30
LMP910001034.00
MCP6041-T-I/OT105.40
ISL60002DIH320Z-TK1027.30
Capacitors + resistors1060.00
Bracelet10150.00
Battery1060.00
Estimated total price1132.40
Table 7. Estimated average of current and power consumption.
Sensors/Components I ave [mA] P ave [mW]
A + C4.42512.39
I0.120.336
B + K2.77.56
B + F ( N O 2 )2.236.24
B + G4.01311.23
B + H0.4631.29
B + D0.1930.54
B + E2.868.01
Total17.047.6
Total + BLE18.3551.38
Table 8. Estimated maximum and minimum current consumption.
Sensors and Sources of Consumption I min [mA] I max [mA]
A + C4.44.9
A + C + I5.45.9
A + B + C + K6.28.4
A + B + C + E8.812.9
A + B + C + G12.313.5
A + B + C + H9.611.1
A + B + C + D7.77.9
A + B + C + E2830.9
Table 9. Comparison of the proposed device with the most applicable works in COPD patient’s and safety monitoring.
DeviceDomainLocationData TransmissionData ProcessingData Protection (Storage)Description
VCSEL [45]physiologicalear-wornBLEcentralizednoIt is a sign-parameter, low-cost, and long-term pulse-oximeter monitoring, developed for COPD patients.
[2]physiological, environmentalattach to garment and helmetBLE, LoRadistributednoIt is a hybrid distributed system for health and safety monitoring.
VTAMN [46]behavioral, physiologicalgarmentGSMdistributednoIt measured ECG, skin temperature, and detect fall.
SweetAge [38]behavioral, physiologicalwrist-wornBluetoothdistributednoSkin temperature, heart rate, and user activities are monitored. Moreover, commercial devices can be integrated into the system.
HealthWear [47]physiologicalarm-bandGPRSdistributednoECG, pulse rate, and respiratory movement and rate are integrated into a convenient T-shirt.
[48]behavioral, physiologicalhead-setBLEdistributednoA camera is used for motion tracking and guesture detection.
[29]physiological, environmentalwrist-worn, chest-wornBLE, WiFidistributednoTwo wearables with several integrated sensors measure ECG, pulse oxygen, skin impedance, and strain V O C s and O 3 , temperature, and humidity.
CHRONIOUS [49]environmental, behavioral, physiologicalgarmentBLEdistributednoThe approach is using several wearables integrated into a T-shirt for data collection. Besides, external devices are used for supporting additional physiological parameters and inegrated into the system.
[30]physiological, environmental, behaviouralWrist-worn, chest-wornBLE, BluetoothdistributedyesIt is a physiological-environmental-behavioural parameters monitoring with a flexible IoT gateway to adopt different commercial devices.
WELCOME [50]behavioral, physiologicallight-vestWiFidistributednoWELCOME supports a comprehensive physilogical monitoring through Body Area Network. It also supports decision support system.
Our prototypeenvironmental, behavioral, physiologicalwrist-wornBLEcentralizedyesOur device supports sensor activation/deactivation. It is low-power and prolonged monitoring.

