Article

Study on the Ultimate Supporting Force of Shield Excavation Face Based on Anisotropic Strength Theory

School of Civil Engineering and Architecture, Shandong University of Science and Technology, Qingdao 266590, Shandong, China
*
Author to whom correspondence should be addressed.
Appl. Sci. 2020, 10(15), 5222; https://doi.org/10.3390/app10155222
Submission received: 10 July 2020 / Revised: 25 July 2020 / Accepted: 27 July 2020 / Published: 29 July 2020

Abstract

:

Featured Application

Ultimate supporting force of shield excavation face optimization with excavation face instability mode and anisotropy of soil strength.

Abstract

The determination of the ultimate supporting force of the shield excavation face is an important problem to be solved in shield construction. Considering that the tunnel burial depth ratio has a significant effect on the instability mode of the excavation face, the classic “wedge-prism” limit equilibrium model is improved. Based on the rotation effect of principal stress axis, the Casagrande anisotropic strength equation is introduced into the modified limit equilibrium model of “wedge-prism”, and then the limit equilibrium solution of the ultimate supporting force of shield excavation face in anisotropic soil is deduced. Finally, the influence of each calculation parameter on the ultimate supporting force is analyzed by examples. The research results show that the results of the modified “wedge-prism” calculation model proposed in this paper are slightly larger than those of the centrifugal test. If the influence of the instability mode of excavation face and the anisotropy of soil strength on ultimate supporting force of the shield excavation face is not taken into account, the calculation result will be unsafe. The limit supporting force of shield tunnel excavation surface has a simple linear relationship with the anisotropy ratio. When the anisotropy ratio is greater than 1, the ultimate supporting force of shield excavation face decreases first and then tends to be stable with an increase in the buried depth ratio. When the anisotropy ratio is less than 1, the law is reversed. The more obvious the anisotropy of soil strength, the greater the rate of change of ultimate supporting force. The limit supporting force of the shield excavation face decreases linearly with the exertion of loosening earth pressure, linearly decreases with the increase in soil cohesion, and decreases nonlinearly with the increase in the angle of internal friction in soil. The relevant conclusions will provide theoretical guidance for controlling the reasonable chamber pressure of shield tunneling, and ensure the safety of construction.

1. Introduction

In recent years, the development of urban rail transit in China has been changing rapidly. Up to now, a total of 36 cities in mainland China have constructed and put into operation urban rail transit, with a total mileage of 5766.6 km. Among them, 4354.3 km of subway accounted for 75.6%. In urban rail transit construction, the shield method is often used for subway construction. Shield tunneling is a three-dimensional dynamic process. The magnitude of the supporting force of excavation surface during construction determines the impact degree of shield excavation on surrounding strata. With the increase or decrease in the supporting force, different displacement of surrounding strata will occur. When the supporting force of excavation face is less than limit minimum supporting force, the soil will lose its stability, and the corresponding instability accidents of excavation face have been reported frequently [1]. Therefore, the determination of the limit supporting pressure provides a basis for ensuring the normal construction of the shield and the selection of control pressure.
At present, domestic and foreign scholars have conducted many studies on the stability of the excavation face. Theoretical methods include the excavation surface stability coefficient method [2], the plastic limit analysis method [3,4,5], the wedge-shaped limit equilibrium analysis method [6,7], etc. In terms of experimental research, Tang et al. [8] confirmed through a centrifugal model test of sand that when the excavation surface of sand tunnel is destroyed, the front is a wedge and the upper part is a prism. Due to the tedious calculation process of the limit analysis method based on the elastoplastic theory, it is difficult apply to practical engineering. However, the wedge-shaped calculation model has specific calculation assumptions and clear concepts, so it is widely used in the calculation of limit-supporting force for shield tunnels. Horn [9] first proposed a three-dimensional limit equilibrium model for the stability analysis of tunnel excavation face. The model consists of a wedge in front of excavation face and its upper silo. Then, Jancsecz and Steiner [10] established a new limit equilibrium model of excavation face stability based on Horn [9]. In this model, the front of the excavation face was a wedge and its upper part was a prism cuboid; Broere [11], Wei [12], Hu [13], Anagnostou [14] and Chen [15] improved the model and further derived the analytical solution. However, in the above studies, the destabilizing “prisms” all extend to the surface in the limit state. The height of the “prism” is roughly equal to the distance from the top of the tunnel to the surface, and it is not affected by the shielding depth ratio of the shield, which is obviously inconsistent with the actual project. Furthermore, previous studies on the stability of shield excavation surfaces only focused on isotropic soil. However, in fact, due to the natural deposition and the change of soil stress, the strength of soil is anisotropic. Lo [16] verified the anisotropy equation of soil strength derived by Casagrande [17] with experiments; Wrzesinski et al. [18,19] used laboratory tests to study the anisotropy of undrained shear strength of cohesive soil caused by principal stress rotation. The Casagrande anisotropy equation has been widely used in the study of slope stability [20], foundation pit anti-uplift stability [21] and foundation bearing capacity [22]. However, there is no relevant literature to discuss the limit equilibrium solution of the limit support force of shield excavation surface in anisotropic soil.
The instability mode of excavation face and the anisotropy of soil strength will inevitably have a greater influence on the ultimate supporting force of shield tunnel excavation face. In order to consider these effects and calculate the limit supporting force of shield excavation face more reasonably, the influence of tunnel depth ratio on the height of unstable prism and the anisotropy of soil strength are considered in the modified “wedge-prism” theoretical model, and the rotation effect of principal stress axis caused by unloading of shield excavation face is introduced, and the limit equilibrium solution of the limit supporting force of shield excavation face is derived. Finally, the applicability of the proposed method is verified by comparing with the centrifugal model test results, and further parameter analysis is made.

2. Methodology

2.1. Casagrande Anisotropic Strength Theory

The anisotropy of soil means that its cohesive force changes with the direction of principal stress. According to the study of Casagrande [17], the change of cohesive force direction can be approximated by the curve shown in Figure 1.
When the angle between the principal stress and the vertical direction is α, the cohesion of soil can be calculated by Equation (1).
c α = c h + ( c v c h ) c o s 2 α
where c h is the cohesive force of the soil when the direction of applying the maximum principal stress is horizontal. c v is the cohesive force of the soil when the direction of applying the maximum principal stress is vertical. α is the angle between the principal stress direction and the vertical direction. Known from the geometric relationship in Figure 2, α = θ ψ . Where θ represents the angle between the fracture surface of the soil element and the vertical direction. ψ represents the angle between the maximum principal stress direction of the soil element and the fracture surface, and the recommended value is ψ = π / 4 , which is the experimental result of LO [16].
Defined the anisotropy ratio k = c h / c v . For a certain point in the soil, it can be assumed that k is a constant [23]. Then Equation (1) can be expressed as:
c α = c v [ k + ( 1 k ) c o s 2 α ]

2.2. Rotation Effect of Principal Stress Axis

During the excavation of the shield tunnel, if the supporting pressure is not applied in time or the supporting pressure applied is too small, a large amount of soil in front of excavation surface will enter the pressure chamber, causing excessive settlement of the foundation and even surface collapse. At this time, the supporting pressure of excavation face is less than the static earth pressure of naturally deposited soil. When the excavation face is far away from the study section, the principal stress direction of the study section does not rotate, and the direction of the maximum principal stress is still vertical. With the excavation going on, the principal stress direction of the study section began to rotate slowly. When the excavation reaches the study section, the principal stress direction of the soil around the excavation face changes obviously, and the principal stress axis rotates obviously. After the excavation passes through the study section, the main stress axis of the soil of this section continues to rotate and eventually stabilizes. The direction of the maximum principal stress of the soil around the tunnel contour is finally rotated to a direction parallel to the contour. Wrzesinski [24] proposed an artificial neural network method to evaluate the undrained shear strength change of cohesive soil caused by principal stress rotation. It had better predictive quality of normalized undrained shear strength than linear regression models, where the highest determination coefficient was 0.951.
The rotation of soil principal stress axis caused by tunnel excavation is shown in Figure 3. In the figure, C represents the overlying soil thickness, D is the diameter of the tunnel, and ζ is the angle between the slip surface of the wedge and the vertical direction. σ 1 represents the large principal stress of the soil unit.

3. Modified “Wedge-Prism” Theoretical Calculation Model

The existing research shows that the classical “wedge-prism” limit equilibrium model is usually conservative in calculating the limit supporting force of shield excavation face, and the main reason is that the instability mode of excavation face is different from the actual situation [14,25].
The reasonable instability mode is the premise of using limit equilibrium method to calculate the ultimate supporting force accurately. In the classical “wedge-prism” limit equilibrium model, the unstable “prism” has been extended to the ground surface in the limit state, and the height H of the prism is approximately equal to the distance C from the top of the tunnel to the ground surface, which is not affected by the buried depth ratio C/D. Chambon [26] found that the tunnel buried depth ratio has a significant influence on the instability mode (mainly reflected in the height of prism) through centrifuge model test on the instability of shield excavation face in sandy soil layer. As shown in Figure 4, when the tunnel depth is relatively small (such as C/D = 0.5), the instability zone has expanded to the surface in the limit state, and the height H of the “prism” is equal to the distance C from the top of the tunnel to the surface. When the depth of the tunnel is relatively large (such as C/D = 1 and 2), the instability zone does not extend to the surface (still inside the soil) in the limit state, and the height of the “prism” is less than the distance from the top of the tunnel to the surface. It can be seen that when the classic “wedge-prism” limit equilibrium model is used to calculate the ultimate supporting force of the shield excavation surface, the value of the “prism” height is only applicable to relatively shallow buried tunnels (such as C/D = 0.5). When calculating relatively deep buried tunnels (such as C/D = 1 and 2), the value of its “prism” height is too large. Therefore, in order to calculate the limit supporting force of shield excavation face more accurately, the influence of tunnel buried depth ratio on the height H of unstable prism should be considered in the modified “wedge-prism” theoretical model.
Figure 5 is the revised “wedge-prism” theoretical calculation model proposed in this paper considering the influence of burial depth ratio on the instability mode of excavation face. Compared with the classical “wedge-prism” limit equilibrium model (Anagnostou 1996), the improvement of the model is that the value of the height of the unstable “prism” is related to the buried depth ratio C/D of the tunnel, rather than the unstable “prisms” all extend to the surface in the limit state.
In order to clarify the value of “prism” height in the modified “wedge-prism” model, the author statistically gives the height of unstable “prism” under different tunnel buried depth ratios in previous studies [26,27,28,29,30,31,32] (Table 1). As shown in Table 1, when the tunnel burial depth ratio is relatively small (such as C/D = 0.5), the height of the “prism” is equal to the buried depth of tunnel vault. When the tunnel buried depth ratio is relatively large (such as C/D = 1 and 2), the height of “prism” is smaller than the buried depth of the tunnel vault, and the height width ratio of prism is H/L = 1.5~2.2, and the average value of H/L is about 1.9. It can be seen that in the modified “wedge-prism” model, when the buried depth ratio is relatively small, H = C is taken; when the buried depth ratio is relatively large, H = 1.9 L is approximately taken. In summary, the height of the “prism” in the “wedge-prism” model is modified to H = min{C, 1.9 L}.

4. Calculation Model of “Wedge-Prism”

4.1. Considering Anisotropy of Soil Strength

Using the modified “wedge-prism” limit equilibrium model in Section 2 of this paper, and considering the loosening earth pressure of the soil column above the wedge, the calculation model of the ultimate supporting force is established as shown in Figure 1.
The ultimate supporting force of the excavation face can be obtained by taking wedge for force analysis, as shown in Figure 6.
The forces acting on the wedge include:
(1) Resultant force V of vertical overburden pressure acting on surface cdef. V = σ v B L , where, σ v is the earth pressure at the top of the tunnel, L is the length of the top of the sliding block, and B is the equivalent shield diameter [33]. Assuming that the area of the square and the circle are equal, we can get B = π D / 2 , where D is the diameter of the shield.
(2) The weight of the block G. G = π γ D 3 / 8 cot β , where γ is the bulk density of the soil and β is the “wedge angle”.
(3) p is the horizontal force acting on the excavation face abcd. σ s is the ultimate supporting force acting on the excavation face abcd, P = π D 2 4 σ s .
(4) The frictional resistance T1 and normal force N1 on the sliding surface of the wedge. T 1 = c α = ζ π 4 B 2 / s i n   β + N 1 t a n φ , where c is the cohesive force of soil.
(5) The frictional resistance T2 and normal force N2 on the side of the wedge. T 2 = B 2 ( c α = π 4 + K 0 σ z   t a n   φ ) / ( 2 t a n   β ) , where K0 is the lateral earth pressure coefficient of the prism [33]. K 0 = 1 s i n   φ , where φ is the angle of internal friction in soil. σ z = ( 2 σ v + B γ ) / 3 is the vertical average stress of the wedge [6].
The magnitude of the ultimate supporting force σ s is determined by analyzing the force of the sliding block. It can be obtained from the horizontal force balance of the block:
P + T 1 c o s β + 2 T 2 c o s β = N 1 s i n β
From the vertical force balance can be obtained:
V + G = T 1 s i n β + 2 T 2 s i n β + N 1 c o s β
The calculation equation of the minimum horizontal force acting on the excavation face is obtained as follows:
P = ε ( V + G ) ( c α = ζ π 4 B 2 s i n β + 2 T 2 ) ( ε s i n β + c o s β )
Then the effective limit supporting force acting on the excavation face is as follows:
σ s = 4 π D 2 ε ( V + G ) ( 4 c α = ζ π 4 B 2 π s i n β D 2 + 8 T 2 π D 2 )   ( ε s i n β + c o s β )
where ε = t a n ( β φ ) = t a n ( 45 ° φ / 2 ) . The variable β is the angle between the slip surface of the wedge and the horizontal direction. Different β will result in different σ s .

4.2. Casagrande Anisotropic Strength Theory

The resultant force V of vertical overburden earth pressure is calculated by Terzaghi’s theory of loose earth pressure. The horizontal micro unit cell of prism is taken for force balance analysis, as shown in Figure 7. Where G is the self-weight of the horizontal microcell. σ x and σ y are the lateral earth pressures in the x and y directions, respectively. σ z is the vertical stress. τ is the lateral friction, τ = K l σ x / K l σ y . Establish the equation as follows:
( σ z σ z d σ z ) π 4 D 2 cot β + γ D 2 cot β d z = 2 ( π 2 D + π 2 D cot β ) [ K 0 σ z t a n φ + c α = π / 4 ] d z
It can be obtained by sorting out the above equation:
d σ z d z + 4 K 0 t a n φ ( 1 + cot β ) π D cot β σ z = γ 2 c v ( 1 + k ) ( 1 + cot β ) π D cot β
where σ z is the vertical earth pressure at the z position.
Solving the ordinary differential Equation (8) and substituting the initial condition z = 0 , σ z = q 0 , we can obtain:
σ z = γ π D cot β 4 + 4 cot β c v ( 1 + k ) 2 K 0 t a n φ ( 1 e 4 K 0 t a n φ + K 0 t a n φ cot β π D cot β z ) + q 0 e 4 K 0 t a n φ + K 0 t a n φ cot β π D cot β z
where q 0 is the overload acting on the top surface of the prism.
Let z = H , we can obtain:
σ v = γ π D cot β 4 + 4 cot β c v ( 1 + k ) 2 K 0 t a n φ ( 1 e 4 K 0 t a n φ + K 0 t a n φ cot β π D cot β H ) + q 0 e 4 K 0 t a n φ + K 0 t a n φ cot β π D cot β H
H = m i n { C ,   1.9 D tan β }
q 0 = γ × { C m i n { C ,   1.9 D tan β } }
where, H is the height of the instability zone. C is the distance from the top of the tunnel to the surface.
Then the resultant force V of the vertical earth pressure acting on the top surface cdef of the wedge is:
V = π σ v D 2 cot β 4
By substituting Equations (12) and (13) into Equation (6), the limit supporting force of shield excavation face considering the anisotropy of soil strength and instability mode can be obtained. At the same time, the limit supporting force is related to the angle β between the sliding surface of wedge and horizontal direction.

5. Case Study and Test

5.1. Case Study

Some scholars [14,34] obtained the value of excavation face supporting force under different wedge angle by changing the “wedge angle” β, and finally took the maximum value of the above supporting force as the limit supporting force of excavation face [35]. This method is also used in the author’s calculation.
The basic variables assumed in the calculation are as follow: unit weight of soil γ = 17 kN/m3, soil cohesion when the maximum principal stress is applied in the vertical direction c v = 4 kPa, the angle of internal friction φ = 30°, tunnel buried depth ratio C/D = 2, anisotropy ratio k = 1.0.
It can be seen from Figure 8 that the supporting pressure of the shield excavation surface is the largest when the “wedge angle” β = 62°~63°, which is the limit supporting force σ s . When the angle of internal friction in the soil changes, the “wedge angle” β corresponding to the limit supporting force also changes. The “wedge angle” β decreases with the increase in φ , and the ultimate supporting force also decreases accordingly. Therefore, it can be considered that the “wedge angle” β corresponding to the ultimate supporting force is a variable that has an equivalent relationship with the angle of internal friction φ , which is consistent with the conclusion of reference [34].

5.2. Model Checking

In order to verify the rationality of the modified “wedge-prism” calculation model, the results are compared with those from previous centrifuge model tests.
Based on the research results of the centrifugal model test of excavation surface stability of Chambon [26], the improved “wedge-prism” calculation model is verified. Under certain soil layer parameters, tunnel burial depth and tunnel diameter, the ultimate supporting force of the excavation surface obtained by the centrifugal test results and the calculation model is shown in Table 2. It can be seen from Table 2 that the calculation model results are in good agreement with the centrifugal test results. With the increase in buried depth, the results of the “wedge-prism” calculation model are larger than those of centrifugal test, and the difference increases with the increase in buried depth. The main reason might be: with the increase in buried depth, a soil arching effect appears in centrifugal test and gradually plays a role. However, the soil arching effect is not fully considered in the “wedge-prism” calculation model, which results in insufficient consideration of the soil force on the sliding block in the calculation model.
It can be seen that the modified “wedge-prism” model has good accuracy in calculating the ultimate supporting force of the relatively deep buried tunnel. When the burial depth is large (such as C/D > 3), although the calculated ultimate supporting force is relatively conservative, it still has high safety.
It should be further noted that for relatively deep buried tunnels (such as C/D > 1), the height H of the “prism” in the “wedge-prism” is revised to be 1.9 times the width L of the “prism” (i.e., H = 1.9 L). Studies have shown that the range of H/L in relatively deep tunnels is about 1.5~2.2 (as shown in Table 1). Therefore, it is necessary to objectively evaluate the calculation error of the limit supporting force σ s caused by the value of H in the modified “wedge-prism” model. In the modified “wedge-prism” model, two extreme cases of H/L = 1.5 and H/L = 2.2 are considered, respectively, and the derivative of function (10) with respect to H is calculated. Since the derivative of σ v with respect to H is less than 0, σ v decreases with the increase in H. Because the ultimate supporting force σ s increases with the increase in σ v (as shown in Figure 9), σ s decreases with the increase in H. Using σ s H / L = 1.5 , σ s H / L = 1.9   and   σ s H / L = 2.2 denotes the ultimate supporting force σ s when H = 1.5 L, 1.9 L and 2.2 L, respectively. According to the previous analysis, σ s decreases with the increase in H, so σ s H / L = 1.5 > σ s H / L = 1.9 > σ s H / L = 2.2 . According to Table 2, when H = 1.9 L, the calculation results are safe and accurate. Therefore, when H = 1.5 L, the calculation results tend to be conservative; When H = 2.2 L, the safety of calculation results is significantly reduced.
In summary, when the burial depth ratio is small, the modified “wedge-prism” model can accurately calculate the limit supporting force of excavation face, and the calculation results are safe for practical engineering; When the buried depth ratio is large (e.g., C/D > 3), the calculation results are larger than the centrifugal model test results. At this time, the calculation model results tend to be conservative, but the safety of the calculation results is not affected. Because the calculation results are larger than the centrifugal model test results, the shield excavation face will not lose stability due to insufficient support force. At this time, the calculation results are far less than the limit maximum supporting pressure, and the excavation face of the shield will not occur uplift failure. In order to make the model more suitable for the case of a large buried depth, it is suggested that the soil arching effect should be fully considered. In addition, in the practical engineering application, it must be combined with the formation conditions and buried depth to correct. Especially for the stratum with high cohesive force, the displacement required for the overlying soil to reach the ultimate supporting state is generally difficult to reach. Therefore, it is suggested to calculate the overburden earth pressure by considering the loose earth pressure and the full overburden weight, and then select an appropriate value considering the buried depth and compressibility of the soil.

6. Analysis of Parameter Sensitivity

6.1. Influence of Loose Pressure of Overburden Soil

Considering that the loose pressure of soil is related to the mutual displacement and stress transfer between particles, the overlying soil pressure on the wedge block is closely related to the amount of deformation that can be obtained. When the overlying soil body allows sufficient displacement, the force on the sliding block is the limit loosening earth pressure. If there is not enough displacement to cause stress transfer between the particles, the weight of overlying soil should be calculated according to the total weight of overburden. Therefore, the force of overlying soil on the sliding block should be between the limit loosening earth pressure and the total overburden weight.
The relationship between the ultimate supporting force and the acting force of the overlying soil body on the sliding block is shown in Figure 9. It can be seen from the calculation that when the force of the overlying soil on the sliding block is calculated by the full overburden weight, the value of the ultimate supporting force calculated by using the calculation model in this paper is 33 kPa. However, with the exertion of loosening earth pressure, the ultimate supporting force decreases linearly. When the overlying load is considered as the ultimate loosening earth pressure, the ultimate supporting force is reduced to 19 kPa.

6.2. Influence of Anisotropy Ratio

Figure 10 shows the influence of changes in anisotropy ratio on the limit supporting force of shield excavation face. It can be seen that σ s decreases linearly with the increase in k. When k = 1, the strength of soil is isotropic. When k < 1, the anisotropy of soil strength is the strength of the soil when the direction of large principal stress is vertical. At this time, the strength of the soil at this time is greater than that when the direction of the large principal stress is horizontal, and the ultimate supporting force of excavation face is greater than that of isotropic soil. This is because the frictional force of surrounding soil around the sliding crack surface on the sliding prisms and wedges decreases relatively, which makes the ultimate support force of the excavation surface increase. When k > 1, it is the opposite. In engineering practice, the situation of k < 1 is often encountered, so the calculated limit supporting force will be unsafe if the anisotropy of soil strength is not considered.

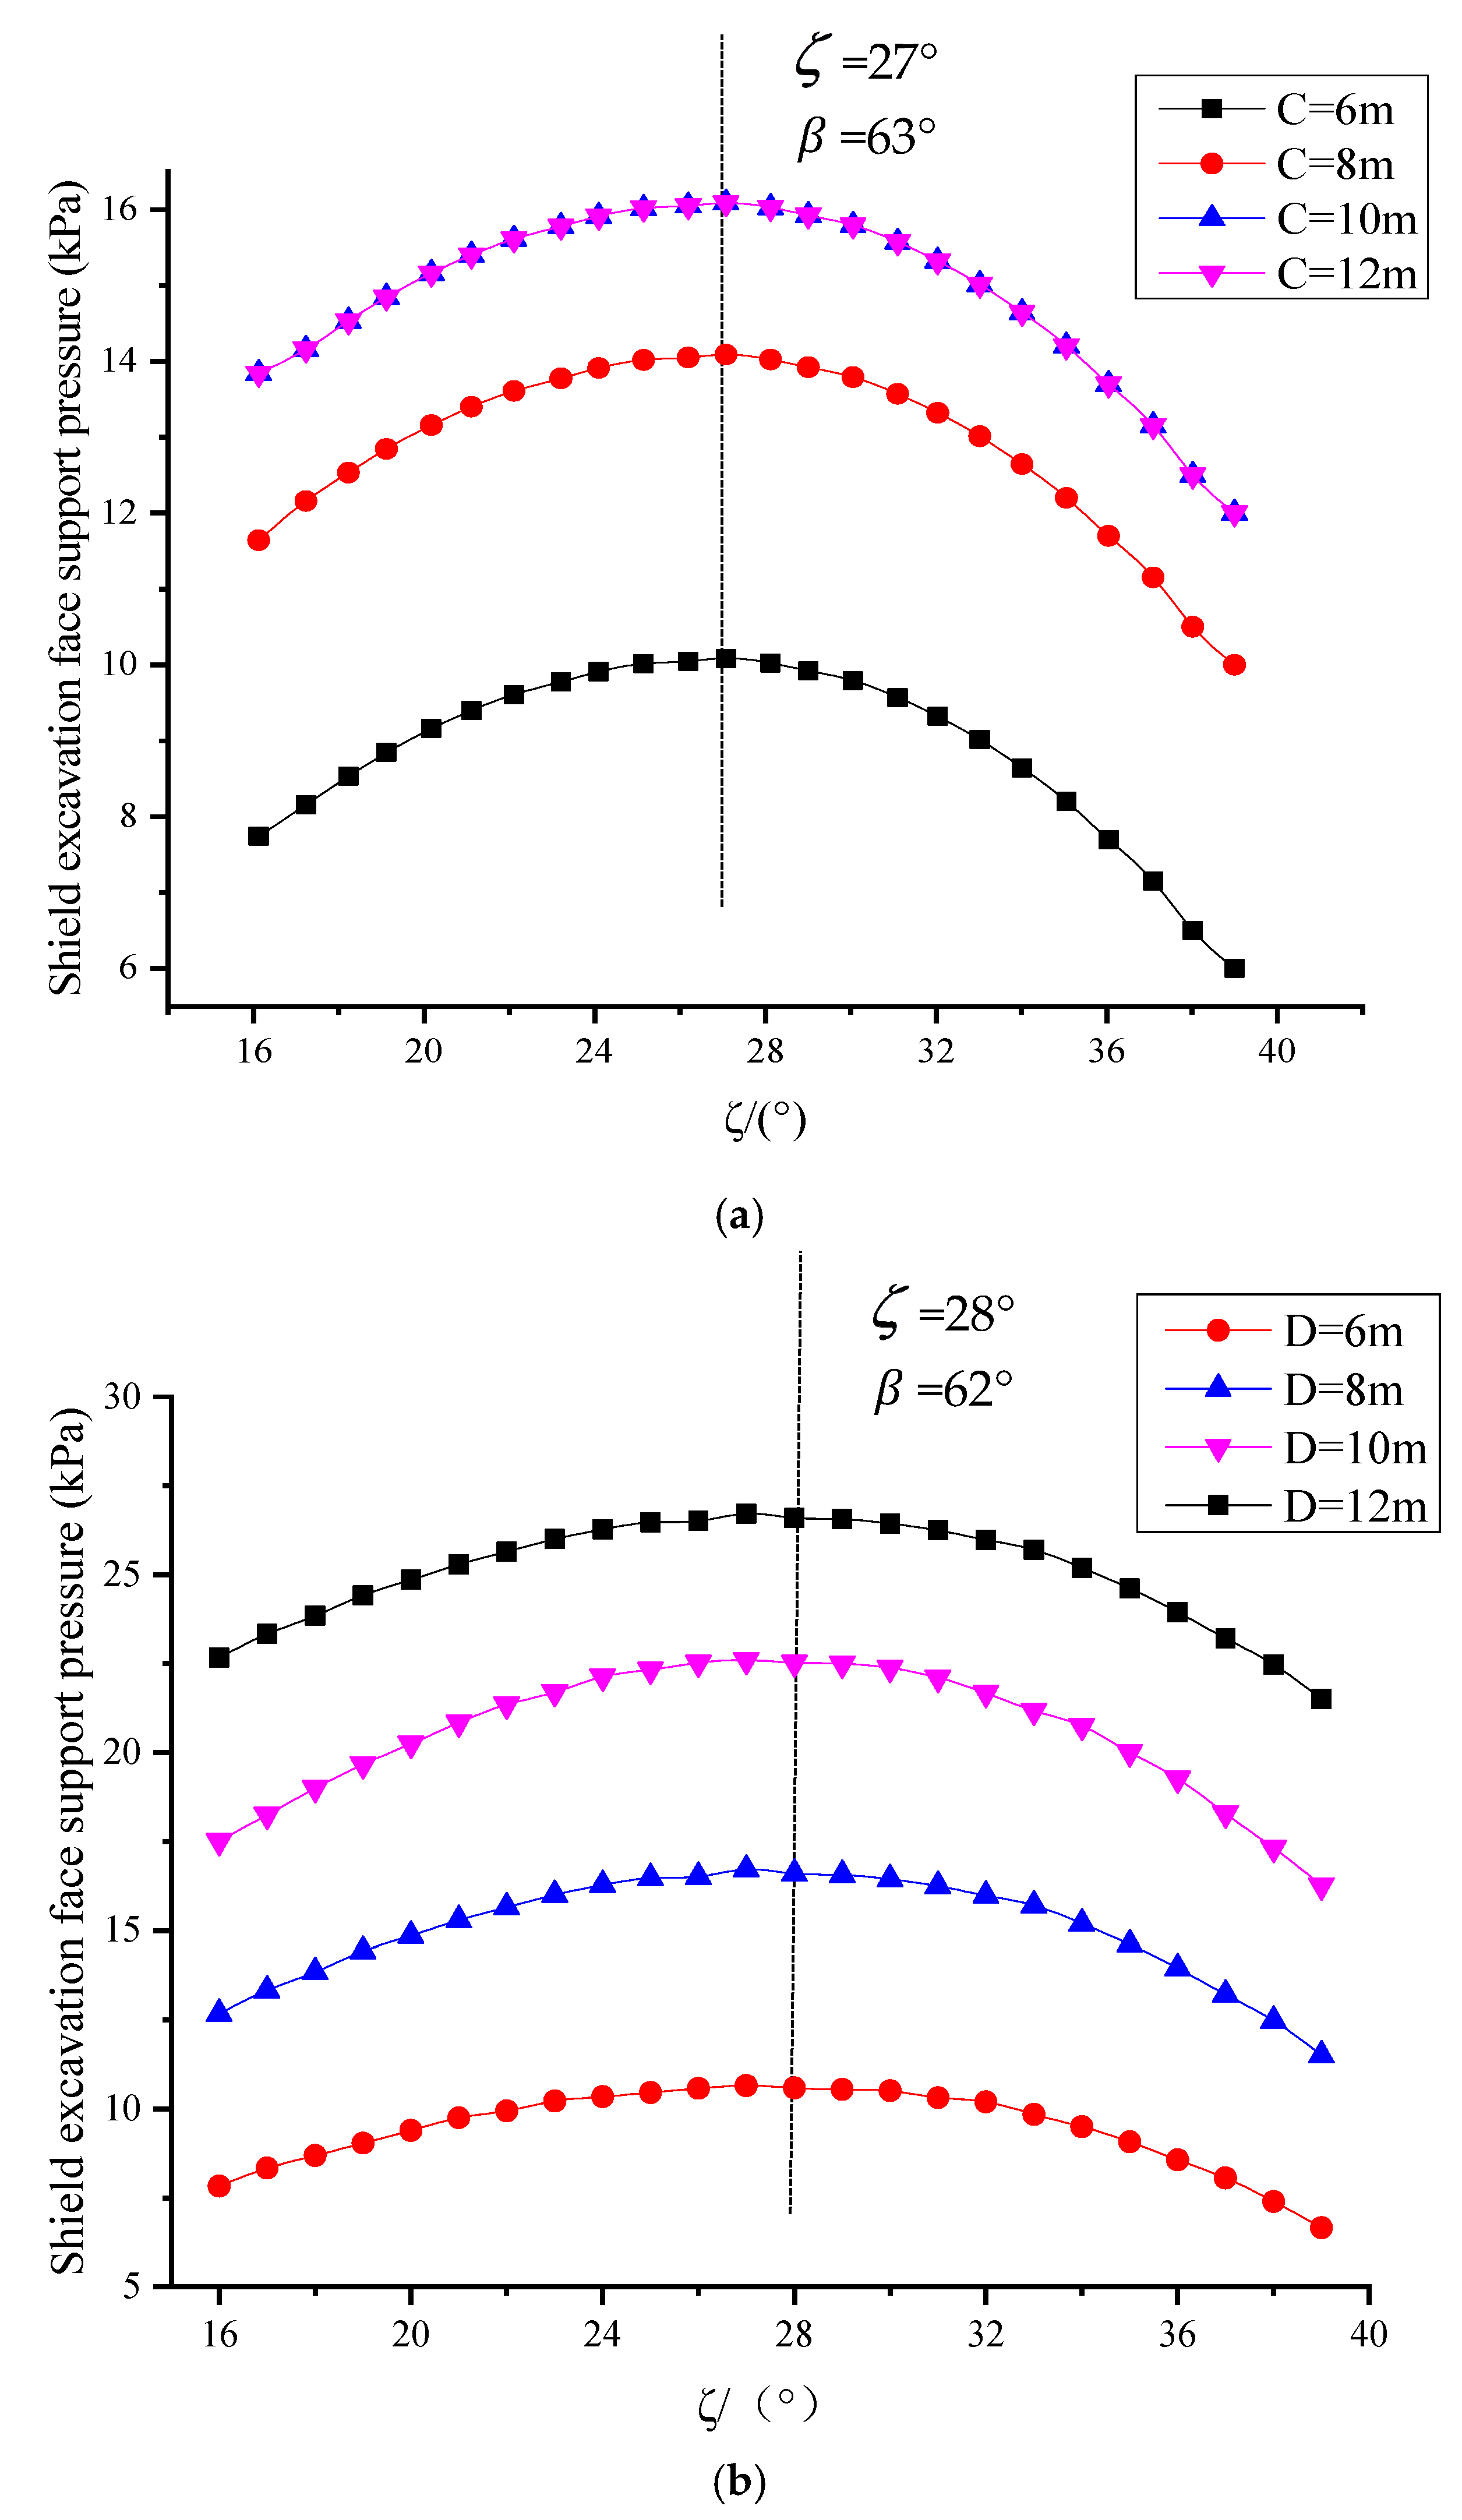
6.3. Influence of Burial Depth Ratio

Figure 11 shows the influence of the change of burial depth ratio C/D on the ultimate supporting force of shield excavation face. It can be seen that when k < 1, σ s increases with the increase in C/D. When C/D > 2, σ s tends to be stable and does not change with the change of C/D; when k > 1, σ s decreases with the increase in C/D. When C/D > 2, σ s tends to be stable; when the soil strength is isotropic (k = 1), σ s decreases slightly with the increase in C/D, and then increases slightly with the increase in C/D, when C/D > 2, σ s tends to be stable. In addition, the more obvious the anisotropy of soil strength, the greater the change in σ s with the change in C/D.

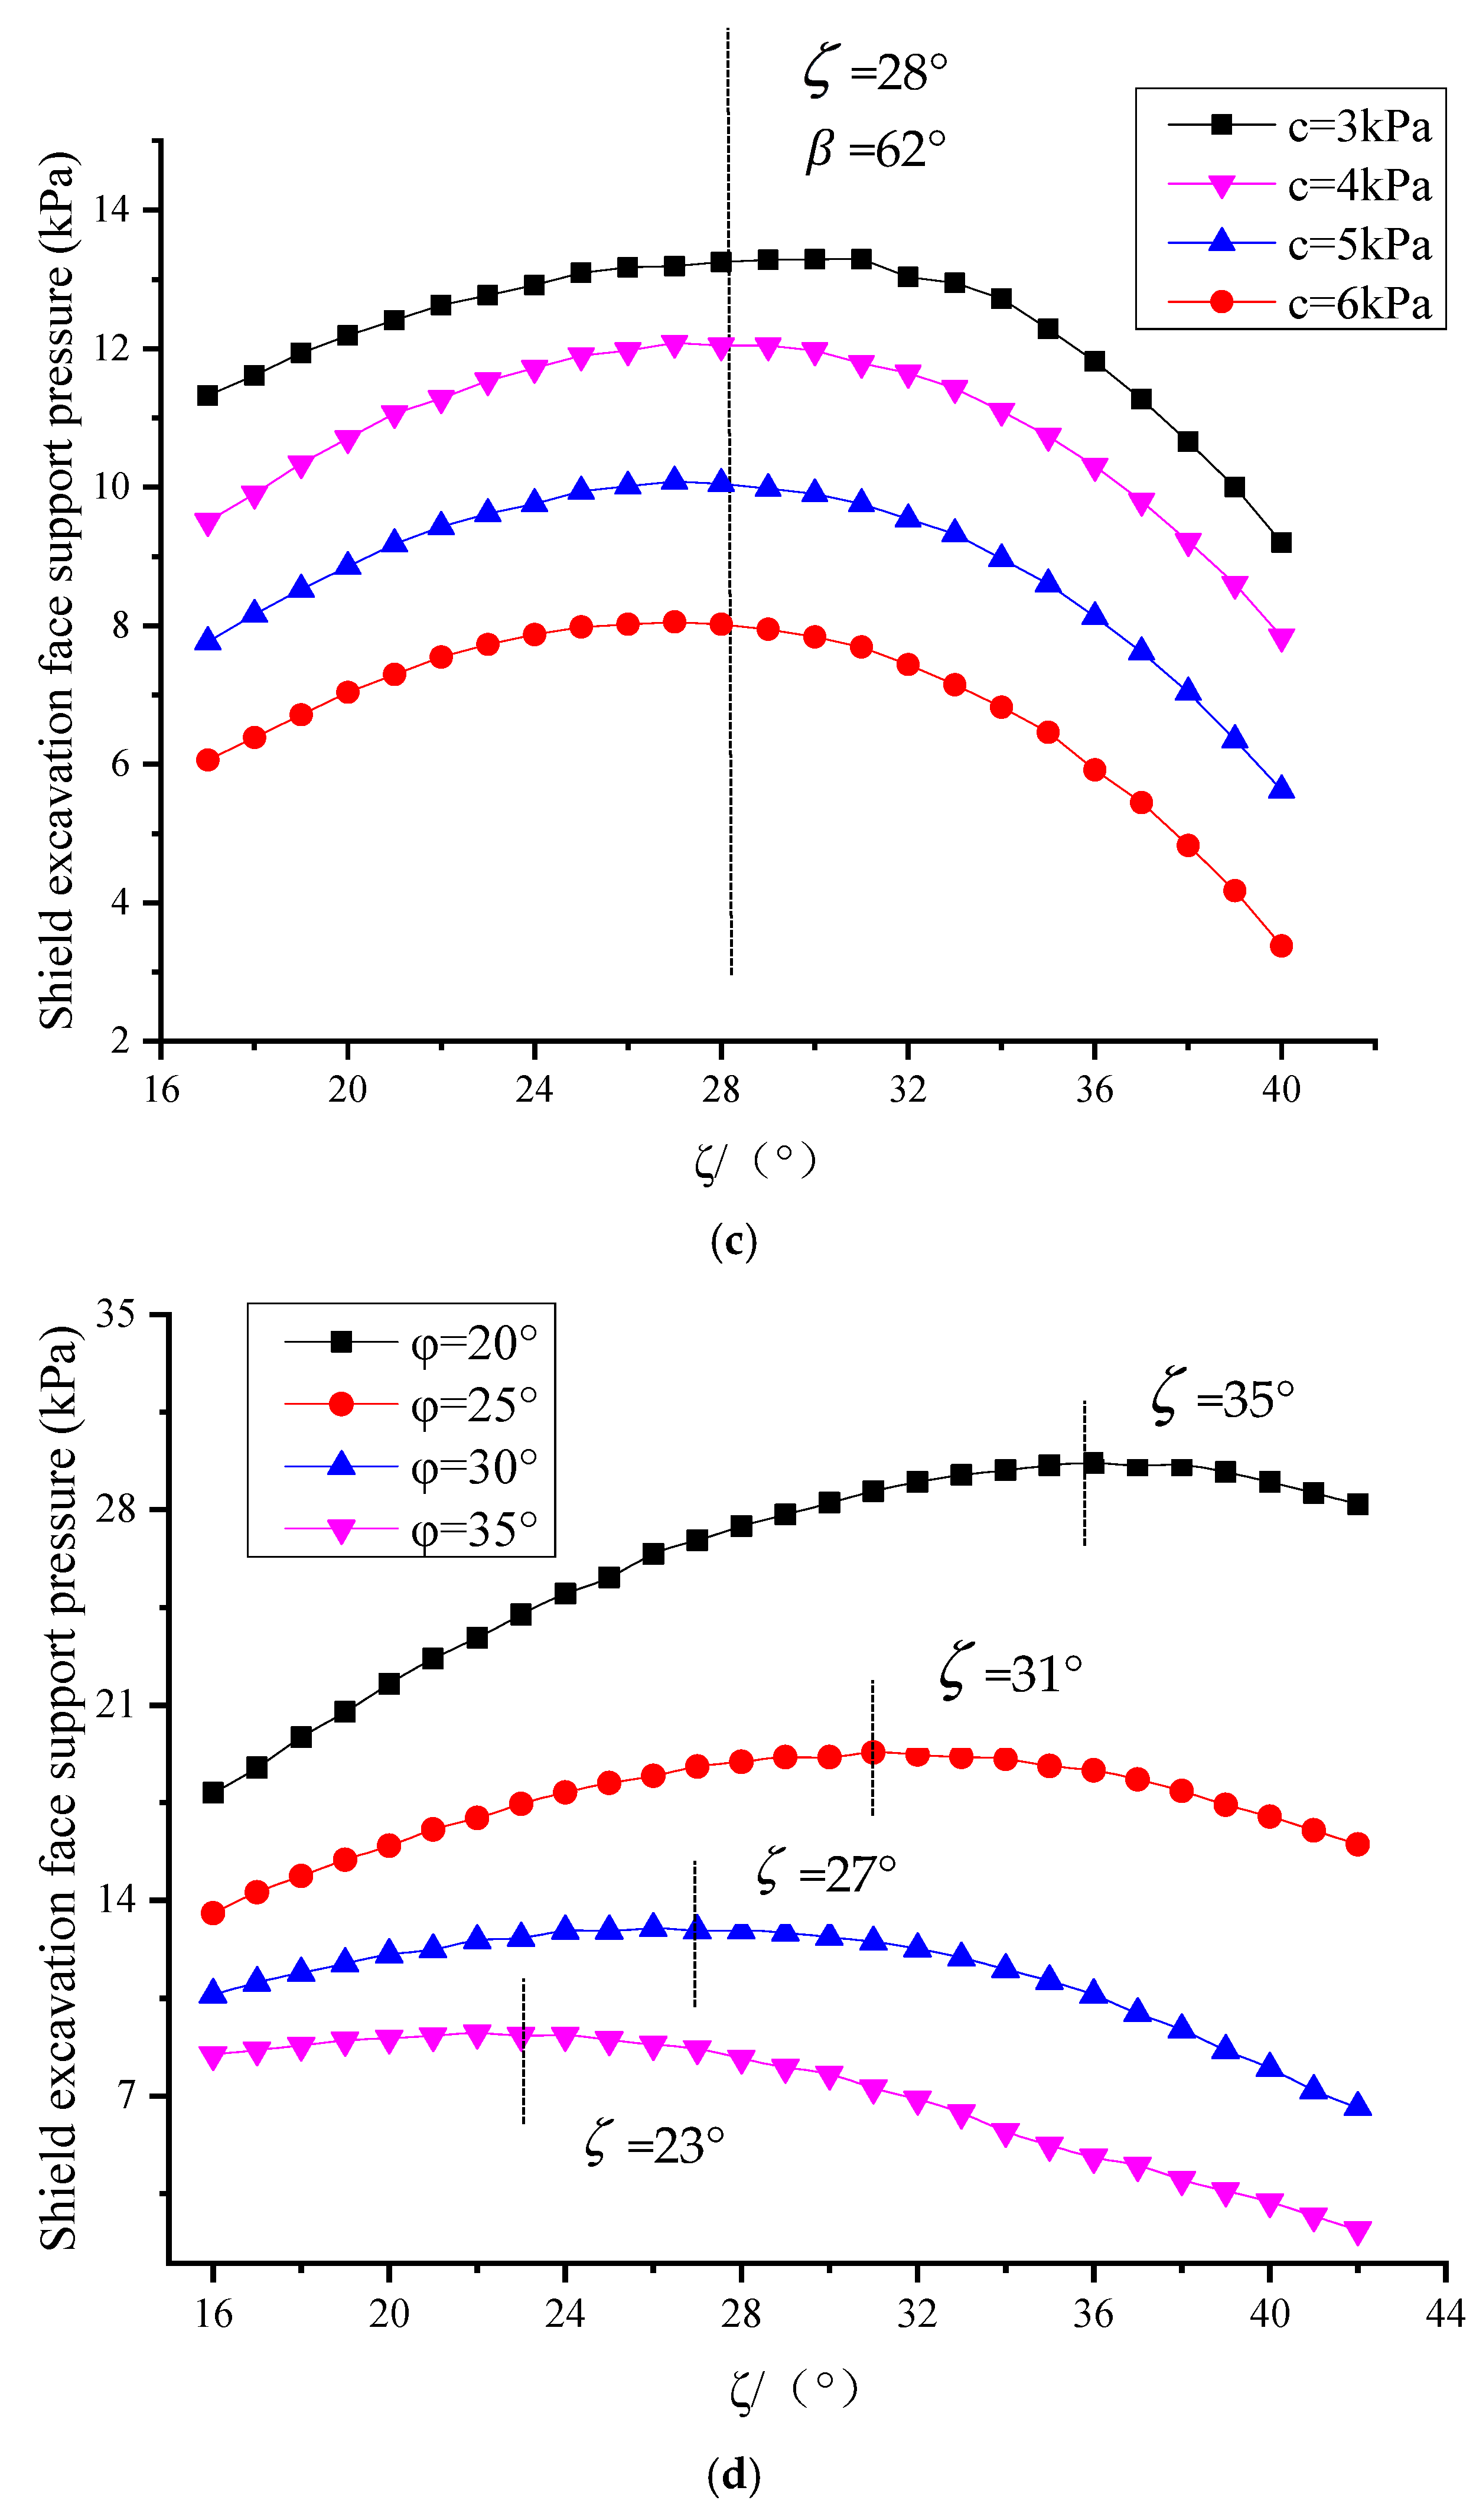
6.4. Influence of Cohesion

Figure 12 shows the effect of the change in soil cohesion force c v on the ultimate supporting force of shield excavation surface when the direction of applying the maximum principal stress is vertical. It can be seen that with the increase in cohesion, the ultimate supporting force of excavation surface decreases linearly, and when the cohesion force reaches a certain value, the excavation surface can be stabilized without supporting stress. In addition, the greater the k, the greater reducing extent of the ultimate supporting force of the shield excavation face.

6.5. Influence of Angle of Internal Friction

Figure 13 shows the influence of the variation of internal friction on the ultimate supporting force of shield excavation face. It can be seen that with the increase in the internal friction, the limit supporting force of the excavation surface decreases nonlinearly, and the decrease range gradually decreases with the increase in φ . In addition, when φ is small, the difference of σ s under different k is more obvious, and with the increase in φ , the difference of σ s gradually becomes smaller.

7. Conclusions

The determination of the limit supporting force of the shield excavation face is the premise of the control of the support pressure of excavation face in normal construction. On the basis of previous studies, considering the instability model of excavation face and the anisotropy of soil strength, the commonly used wedge calculation model is revised and extended. Subsequently, the “wedge-prism” calculation model proposed in this paper is verified by previous centrifugal test results, and some key parameters are analyzed for sensitivity. The main conclusions drawn are as follows:
(1) In the limit state, it is appropriate to select the “wedge-prism” excavation face instability mode, but the height H of “prism” does not necessarily equal the depth C of tunnel arch. Especially for relatively deep buried tunnels, the instability “prism” in the limit state does not extend to the surface. In this paper, the modified “wedge-prism” model in which H is taken as m i n { C ,   1.9 L } is generally reasonable.
(2) The “wedge angle” β when the limit supporting force is reached is a variable that has an equivalent relationship with the angle of internal friction φ in soil.
(3) Parameter sensitivity analysis shows that it is necessary to consider the anisotropy of soil strength in the calculation model of the ultimate supporting force of shield tunnel excavation face. At the same time, the influence of overburden loosening earth pressure and soil cohesion cannot be ignored.
(4) Compared with the traditional calculation method, the results of the modified “wedge-prism” calculation model are more consistent with the centrifugal test results, which provides certain technical support and theoretical guidance for the reasonable setting of soil bin pressure during shield construction.

Author Contributions

Conceptualization, H.S. and C.M.; methodology, H.S.; software, C.D., H.S. and C.M.; validation, C.D. and H.S.; writing—original draft preparation, C.D. and H.S.; writing—review and editing, C.D., H.S. and C.M.; funding acquisition, C.D.; All authors have read and agreed to the published version of the manuscript.

Funding

Ministry of education of Humanities and Social Science Foundation of China (no. 20YJAZH022).

Conflicts of Interest

The authors declare no conflicts of interest.

References

  1. Zhu, W.B.; Ju, S.J. Research on Risk Sources and Typical Accidents in Tunneling Construction; Jinan University Press: Guangzhou, China, 2009; pp. 78–86. [Google Scholar]
  2. Broms, B.B.; Bennermark, H. Stability of clay at vertical openings. J. Soil Mech. Found. Div. ASCE 1967, 96, 71–94. [Google Scholar]
  3. Leca, E.; Dormieux, L. Upper and lower bound solutions for the face stability of shallow circular tunnels in fric-tionalmaterial. Géotechnique 1990, 40, 581–606. [Google Scholar] [CrossRef] [Green Version]
  4. Lee, I.M.; Nam, S.W. The study of seepage forces actingon the tunnel lining and tunnel face in shallow tunnels. Tunn. Undergr. Space Technol. 2001, 16, 31–40. [Google Scholar] [CrossRef]
  5. Lv, X.L.; Wang, H.R.; Hang, M.S. Limit theoretical study on face stability of shield tunnels. Chin. J. Geotech. Eng. 2011, 33, 57–62. (In Chinese) [Google Scholar]
  6. Anagnostou, G.; Kovari, K. The face stability of slurry-shield-driven tunnels. Tunn. Undergr. Space Technol. 1994, 9, 165–174. [Google Scholar] [CrossRef]
  7. Lv, X.L.; Li, F.D.; Huang, M.S.; Wan, J.L. Three-dimensional numerical and analytical solutions of limit support pressure at shield tunnel face. J. Tongji Univ. (Nat. Sci.) 2012, 40, 1469–1473. (In Chinese) [Google Scholar]
  8. Tang, L.J.; Chen, R.P.; Yin, X.S.; Kong, L.G.; Huang, B. Centrifugal model tests on face stability ofshield tunnels in dense sand. Chin. J. Geotech. Eng. 2013, 35, 1830–1838. (In Chinese) [Google Scholar]
  9. Horn, M. Horizontal earth pressure on perpendicular tunnel face. In Proceedings of the Hungarian National Conference of the Foundation Engineer Industry, Budapest, Hungary, 18–21 June 1961; pp. 7–16. (In Hungarian). [Google Scholar]
  10. Jancsecz, S.; Steiner, W. Face support for a large mix-shield in heterogeneous ground conditions. In Proceedings of the Tunneling 94, Institution of Mining and Metallurgy, London, UK, 5–7 July 1994; Springer: New York, NY, USA, 1994; pp. 531–550. [Google Scholar]
  11. Broere, W. Face stability calculations for a slurry shield in heterogeneous soft soils. Tunn. Metrop. 1998, 23, 215–218. [Google Scholar]
  12. Wei, G.; He, F. Calculation of minimal support pressure acting on shield face during pipe jacking in sandy soil. Chin. J. Undergr. Space Eng. 2007, 3, 903–908. (In Chinese) [Google Scholar]
  13. Hu, W.T.; Lv, X.L.; Huang, M.S. Three—Dimensional Limit Equilibrium Solution of the Support Pressure on the Shield Tunnel Face. Chin. J. Undergr. Space Eng. 2011, 7, 853–856. (In Chinese) [Google Scholar]
  14. Anagnostou, G. The contribution of horizontal arching to tunnel face stability. Geotechnik 2012, 35, 34–44. [Google Scholar] [CrossRef]
  15. Chen, R.P.; Tang, L.J.; Yin, X.S. An improved 3d wedge—Prism model for the face stability analysis of the shield tunnel in cohesionless soils. Acta Geotech. 2015, 10, 683–692. [Google Scholar] [CrossRef]
  16. Lo, K.Y. Stability of slopes in anisotropic soils. J. Soil Mech. Found. Div. 2014, 91, 85–106. [Google Scholar]
  17. Casagrande, A. Shear failure of anisotropic materials. J. Boston Soc. Civ. Eng. 1944, 31, 74–87. [Google Scholar]
  18. Wrzesinski, G.; Pawluk, K.; Lendo-Siwicka, M.; Miszkowska, A. Undrained Shear Strength Anisotropy of Cohesive Soils Caused by the Principal Stress Rotation. In Proceedings of the 3rd World Multidisciplinary Civil Engineering, Architecture, Urban Planning Symposium (WMCAUS), Prague, Czech Republic, 18–22 June 2018. [Google Scholar]
  19. Zhang, Q.Y.; Xu, P.P.; Qian, H. Study on Shear Strength Anisotropy of Undisturbed Loess-Paleosol Sequence in Jingyang County. Chin. J. Rock Mech. Eng. 2019, 38, 2365–2376. [Google Scholar]
  20. Aikarni, A.A.; Aikarni, M.A. Study of the effect of soil anisotropy on slope stability using method of slices. Comput. Geotech. 2000, 26, 83–103. [Google Scholar]
  21. Huang, M.S.; Yu, S.B.; Qin, H.L. Upper bound method for basal stability analysis of braced excavations in K0- consolidated clays. Chin. Civ. Eng. J. 2011, 44, 101–108. (In Chinese) [Google Scholar] [CrossRef]
  22. Reddy, A.S.; Rao, K.N.V. Bearing capacity of strip footing on anisotropic and nonhomogeneous clay. Soils Found. 2008, 21, 1–6. [Google Scholar] [CrossRef] [Green Version]
  23. Liu, W.J.; Wang, T.H.; Xiao, J.X. Analysis of Shield Tunnel Excavation Surface Stability in Anisotropic Foundations. J. Chongqing Jiaotong Univ. (Nat. Sci.) 2018, 37, 14–19. (In Chinese) [Google Scholar]
  24. Wrzesinski, G.; Sulewska, M.J.; Lechowicz, Z. Evaluation of the Change in Undrained Shear Strength in Cohesive Soils due to Principal Stress Rotation Using an Artificial Neural Network. Appl. Sci. 2018, 8, 781. [Google Scholar] [CrossRef] [Green Version]
  25. Vereer, P.A.; Ruse, N.M.; Macher, T. Tunnel heading stability in drained ground. Felsbau 2002, 20, 8–18. [Google Scholar]
  26. Chambon, P.; Corte, J.F. Sallow tunnels in cohesionless soil: Stability of tunnel face. J. Geotech. Eng. 1994, 120, 1148–1164. [Google Scholar] [CrossRef]
  27. O’Sullivan, C.; Bray, J.D.; Riemer, M.F. Examination of the Response of Regularly Packed Specimens of Spherical Using Physical Tests and Discrete Element Simulations. J. Eng. Mech. 2004, 130, 1140–1150. [Google Scholar] [CrossRef]
  28. Takano, D.; Otani, J.; Nagatani, H.; Mukunoki, T. Application of X-ray CT houndary value problems in geotechnical engineering—Research on tunnel face failure. In GeoCongress 2006: Geotechnical Engineering in the Information Technology Age; ASCE: Reston, VA, USA, 2006. [Google Scholar]
  29. Chen, R.P.; Li, J.; Kong, L.J. Experimental study on face instability of shield tunnel in sand. Tunn. Undergr. Space Technol. 2013, 33, 12–21. [Google Scholar] [CrossRef]
  30. Tang, L.J. Numerical Investigations and Centrifugal Model Tests on Face Stability of Shield Tunnel in Dry and Saturated Sandy Soils. Ph.D. Thesis, Zhejiang University, Hangzhou, China, 2014. [Google Scholar]
  31. Lv, X.L.; Zhou, Y.C.; Li, F.D. Centrifuge model test and numerical simulation of stability of excavation face of shield tunnel in silty sand. Rock Soil Mech. 2016, 37, 3324–3328. (In Chinese) [Google Scholar]
  32. Jin, D.L.; Yuan, D.J.; Zheng, H.T.; Li, X.G.; Ding, F. Centrifugal model tests on face stability of slurry shield tunnels under high water pressures. Chin. J. Geotech. Eng. 2019, 41, 1653–1660. (In Chinese) [Google Scholar]
  33. Lee, I.M.; Lee, J.S.; Nam, S.W. Effect of seepage force on tunnel face stability reinforced with multistep pipe grouting. Tunn. Undergr. Space Technol. 2004, 19, 551–565. [Google Scholar] [CrossRef]
  34. Qin, J.S. Study on Face Deformation and Collapse of Earth Pressure Shield Tunnel; Hehai University: Nanjing, China, 2005. [Google Scholar]
  35. Li, B.; Li, H. Prediction of tunnel face stability using a naive bayes classifier. Appl. Sci. 2019, 9, 4139. [Google Scholar] [CrossRef] [Green Version]
Figure 1. The anisotropy of cohesion.
Applsci 10 05222 g001
Figure 2. Relationship between consolidation direction and large principal stress direction.
Applsci 10 05222 g002
Figure 3. Stability analysis model of shield excavation face—principal stress direction. (a) Side-looking; (b) Front view.
Applsci 10 05222 g003aApplsci 10 05222 g003b
Figure 4. Instability mode of excavation face in limit state.
Applsci 10 05222 g004
Figure 5. Modified “wedge-prism” theoretical calculation model.
Applsci 10 05222 g005
Figure 6. Analysis of force balance of wedge.
Applsci 10 05222 g006
Figure 7. Force diagram of prism horizontal micro unit cell.
Applsci 10 05222 g007
Figure 8. Variation curve of supporting force of shield excavation face with ζ. (a) Change of buried depth C; (b) Change of tunnel diameter D; (c) Change of soil cohesive force c; (d) Change of the angle of internal friction φ ; (e) Change of unit weight of soil γ ; (f) Change of anisotropy ratio k.
Applsci 10 05222 g008aApplsci 10 05222 g008bApplsci 10 05222 g008c
Figure 9. Relationship between supporting force of excavation face and overburden pressure on sliding block.
Applsci 10 05222 g009
Figure 10. Influence of anisotropy ratio k on σ s .
Applsci 10 05222 g010
Figure 11. Influence of burial depth ratio C/D on σ s .
Applsci 10 05222 g011
Figure 12. Influence of soil cohesion c v on σ s .
Applsci 10 05222 g012
Figure 13. Influence of the angle of internal friction φ on σ s .
Applsci 10 05222 g013
Table 1. Statistics on the height of unstable “prism” with different tunnel depth ratios.
ResearcherResearch MethodC/DHLH/L
Chambon (1994)Centrifuge Model Test0.50.5D0.46D1.09
10.75D0.5D1.5
20.85D0.5D1.7
Oblozinsky (2004)Centrifuge Model Test20.59D0.27D2.19
Takano (2006)1 g Model Test21.19D0.6D1.98
Chen (2013)1 g Model Test21.5D0.75D2
Tang (2014)Centrifuge Model Test0.50.5D0.3D1.67
10.5D0.3D2
20.5D0.3D2
Lv (2016)Centrifuge Model Test0.50.5D0.4D1.25
10.65D0.4D1.63
Jin (2019)Centrifuge Model Test21.3D0.6D2.17
Table 2. Comparison between centrifugal test results and “wedge-prism” calculation model.
Diameter (D)Buried Depth (C)Cohesive Force (c)Unit Weight of Soil (γ) The Angle of Internal Friction (φ) Ultimate Supporting Force (σs)
Results of Centrifugation TestsResults of Calculation Model
mmkPakN/m3°kPakPa
52.5317383.23.953
55317383.54.575
510317384.05.834
1010317387.58.976
1020317388.09.954
1030317388.310.553
1040317388.410.925

