Article

Investigation of the Maturity Changes of Cherry Tomato Using Magnetic Resonance Imaging

1
Department of Bioindustrial Machinery Engineering, College of Agriculture & Life Sciences, Jeonbuk National University, Jeonju 54896, Korea
2
Department of Agricultural Engineering, National Institute of Agricultural Sciences, Jeonju 54875, Korea
3
Department of Horticulture, College of Agriculture & Life Sciences, Jeonbuk National University, Jeonju 54896, Korea
4
Department of Food Science and Technology, University of California, Davis, CA 95616, USA
*
Author to whom correspondence should be addressed.
Appl. Sci. 2020, 10(15), 5188; https://doi.org/10.3390/app10155188
Submission received: 30 June 2020 / Revised: 16 July 2020 / Accepted: 22 July 2020 / Published: 28 July 2020

Abstract

:

Featured Application

Magnetic resonance imaging technique can be applied to almost any agricultural produce, and food and dairy products to monitor internal physicochemical changes due to external impact, maturity stage, storage time, and condition, or other factors impacting quality.

Abstract

The maturity of tomato fruit is normally characterized by external color, and it is often difficult to know when fruit have achieved commercial maturity or become over-mature. The internal structure of tomato fruit changes during development and this study investigates the utility of nondestructive measurement of tomato fruit structure as a function of maturity using magnetic resonance imaging (MRI). The objective of this work is to use analysis of internal tomato fruit structural measurements to characterize maturity. Intact cherry tomato fruit were harvested at six different maturity stages. At each stage of maturity, the internal structure of the fruit was measured using a series of two-dimensional (2D) magnetic resonance (MR) images. Qualitative and quantitative image analyses were performed to correlate internal fruit structure with maturity. Internal structural changes observed in the pericarp region of the tomato fruit are highly correlated with fruit maturity. MR image information combined with classical analysis techniques provides a more complete understanding of structure and physicochemical changes in tomato fruit during maturation. This study demonstrates that MRI is a useful analytical tool to characterize internal changes in agricultural produce as the produce matures. This technique can be applied to almost any agricultural produce to monitor internal physical changes due to external impact, maturity stage, variation in climate, storage time, and condition, or other factors impacting quality.

1. Introduction

Fresh agricultural produce needs quality measurement and monitoring for various processing. Most agricultural produce are not harvested at the same stage of maturity due to their biological and environmental differences. While modern mechanical harvesting for produce decreases production costs, it also increases the need for proper sorting of agricultural products. Even hand-picked produce needs to be sorted based on quality. Generally, produce quality factors are classified as external or internal. Size, shape, surface color, defects, and bruises can be categorized as external quality factors and internal voids, solids, disorder, and composition can be categorized as internal quality factors. Harvested products have different internal structure due to variations in environmental growing conditions, different maturity states, and various physiological disorders. Qualitative analysis related to the changes of internal physicochemical states and structure are crucial in agricultural products’ grading based on internal factors. Many internal quality attributes are hard to detect by nondestructive methods. Many researchers have worked to utilize suitable imaging techniques for acquiring measures of internal quality factors for agricultural produce nondestructively. Quality factors were measured using the optical, acoustical, thermal, and electromagnetic properties of agricultural produce [1]. Among those nondestructive methods, nuclear magnetic resonance (NMR) and X-ray-based imaging techniques can provide true internal cross-section images of various agricultural and food produce [2,3,4,5].
Magnetic resonance imaging (MRI), utilizing NMR properties of target samples, is a versatile tool to investigate most agricultural produce. Having high moisture content, agricultural products yield strong signals when applying an MRI technique. Joyce et al. [6] applied a MRI technique to monitor the ripening of mangoes. They found that signal intensity of the pericarp region in magnetic resonance (MR) images varied with ripening stage. Lim et al. [2] investigated fresh Korean ginsengs for internal quality evaluation and concluded that the age identification of ginseng is possible using one-dimensional image analysis of MR images. Kim et al. [7] used MRI to detect seeds and freeze-damage in mandarins and found that the signal intensity of seeds and freeze-damaged regions was weaker than the signal intensity in normal tissue regions. Taglienti et al. [8] investigated the tissue structure change to evaluate the effect of storage conditions on kiwi fruits and found water migration in the direction of the outer region in the pericarp during storage. Patel et al. [4] intensively reviewed various MRI techniques for food and agricultural products. They explained the contrast of MR images being varied with physicochemical differences in foods and agricultural products. Also, they mentioned that MRI has the capabilities of not only the evaluation of maturity and quality but also the understanding of relating physiological processes.
Tomato ripening stage is classified into 6 stages by color: green, breaker, turning, pink, light red, and red. Tomato ripening is associated with internal structure and chemical changes [9]. It is difficult to quantify internal structure changes during ripening. Many researchers have investigated the physicochemical changes during ripening and storing of tomatoes with NMR-based techniques. Musse et al. [10] studied macroscopic structure changes of tomatoes during ripening. They found that the pericarp structure changed significantly compared with the internal tissues. Ciampa et al. [11] investigated the seasonal physicochemical changes of cherry tomatoes with MRI techniques, and spin-spin and spin-lattice relaxation times measured in the morphological tissues were closely related to seasonal physicochemical changes of cherry tomatoes. Zhang and McCarthy [12] examined the pericarp regions of MR images of processing tomatoes classified as three different maturity groups (green, breaker-right red, and red) using a partial least square discriminant analysis and found the potential of MRI technique for tomato classification according to maturity. Zhang et al. [13] used a MRI technique to examine the morphological features and tissue characteristics of pericarp areas for three different cultivars of processing tomatoes. Tomatoes usually have four or five locules and a thick pericarp wall. However, cherry tomato varieties generally have two or three locules and have a thin pericarp wall. This is the first intensive trial on different cherry tomato cultivars harvested at six different maturity stages using MRI techniques.
The objectives of this study were to examine the internal structure changes of intact cherry tomato harvested at six different maturity stages using MRI and to find a suitable MR image analysis method to classify tomatoes according to their maturity stages.

2. Materials and Methods
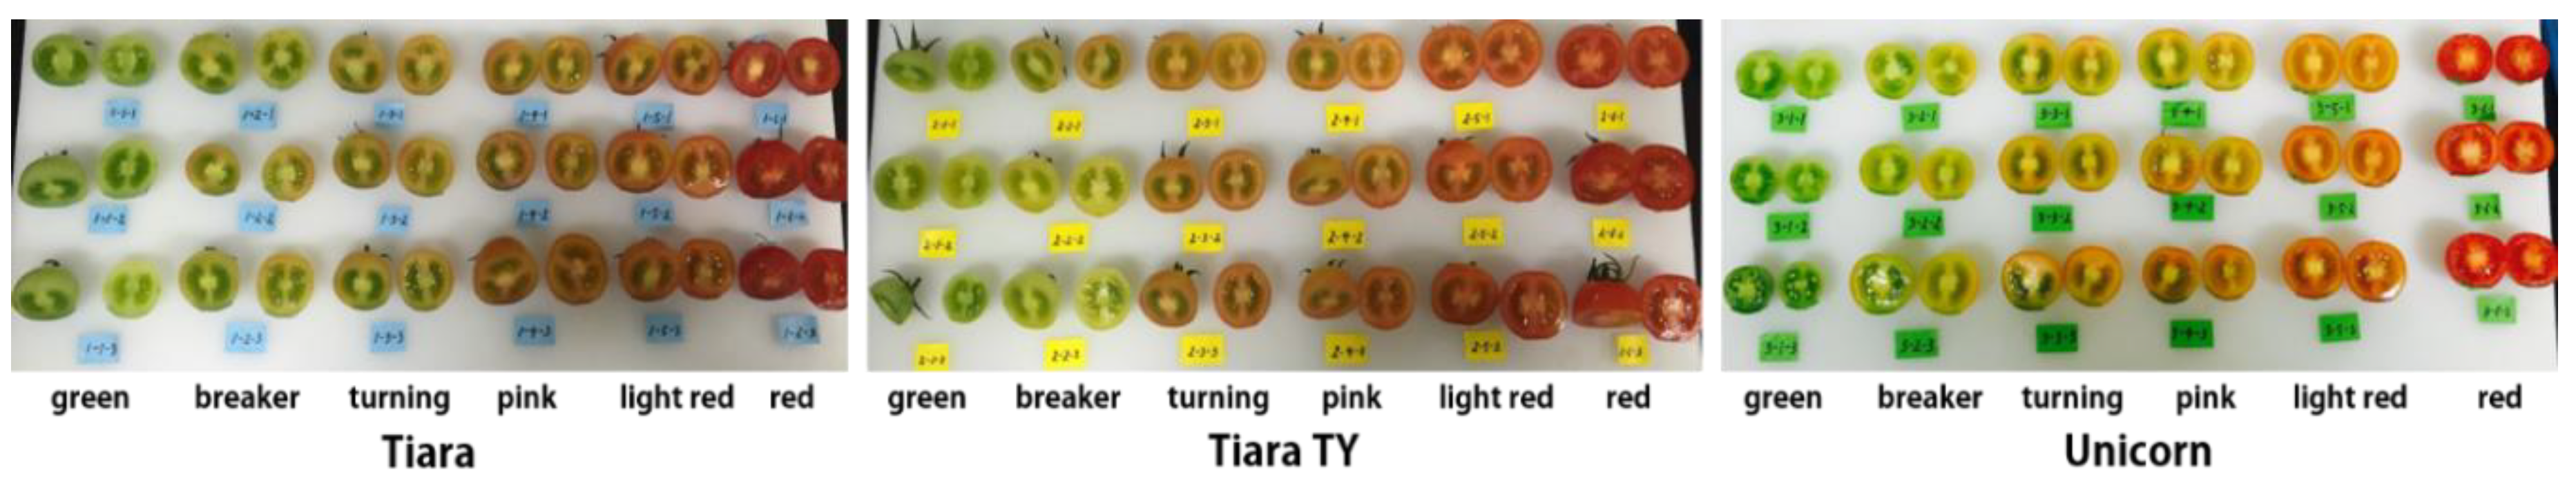
2.1. Materials

To investigate the internal structure changes of cherry tomatoes, three different cultivars (Tiara, Tiara TY, and Unicorn) were used in the study. Figure 1 shows cross-cut-section photos of all samples after the MRI experiment. Tomatoes were harvested at six different maturity stages: green, breaker, turning, pink, light red, and red, based on their colors. Three samples were prepared for each cultivar and maturity stage; thereby, a total of 54 cherry tomato fruits were investigated. The cherry tomatoes were grown under greenhouse conditions at the experimental farm in Jeonbuk National University, Korea, and harvested at different maturity stages by a horticultural expert.

2.2. MRI System and Pulse Sequence

An industrial-grade MRI system (M10, ASPECT Magnetic Technologies Ltd., Shoham, Israel) installed at Jeonbuk National University in Republic of Korea was used to acquire a series of MR images of intact fresh fruits nondestructively. The MRI system was equipped with a permanent magnet, which has 1 Tesla magnetic field strength, and a radio frequency coil holding up to 80 mm outer diameter sample. A Gradient Echo (GRE) pulse sequence with three-dimensional (3D) capability was used to acquire a series of 20 two-dimensional (2D) image sets of a target sample. The repetition and echo times were set to 40 and 15 ms, respectively. The pixel size of the MR image was 256 × 256 pixels. The slice thickness was 0.001 m and the field of view (FOV) of the acquired image was 0.05 × 0.05 m. Thus, we obtained 3D volume data for cherry tomato with spatial voxels of 3.8 × 10⁻¹¹ m3. The acquisition duration of a series of 20 MR images was 388 s. A total of 54 MR image datasets were acquired and examined to investigate internal structure changes of cherry tomato with different maturity stages. Figure 2 shows a series of 20 cherry tomato MR images with an olive oil reference tube, the oil reference was used for checking sample loading direction and magnet homogeneity.

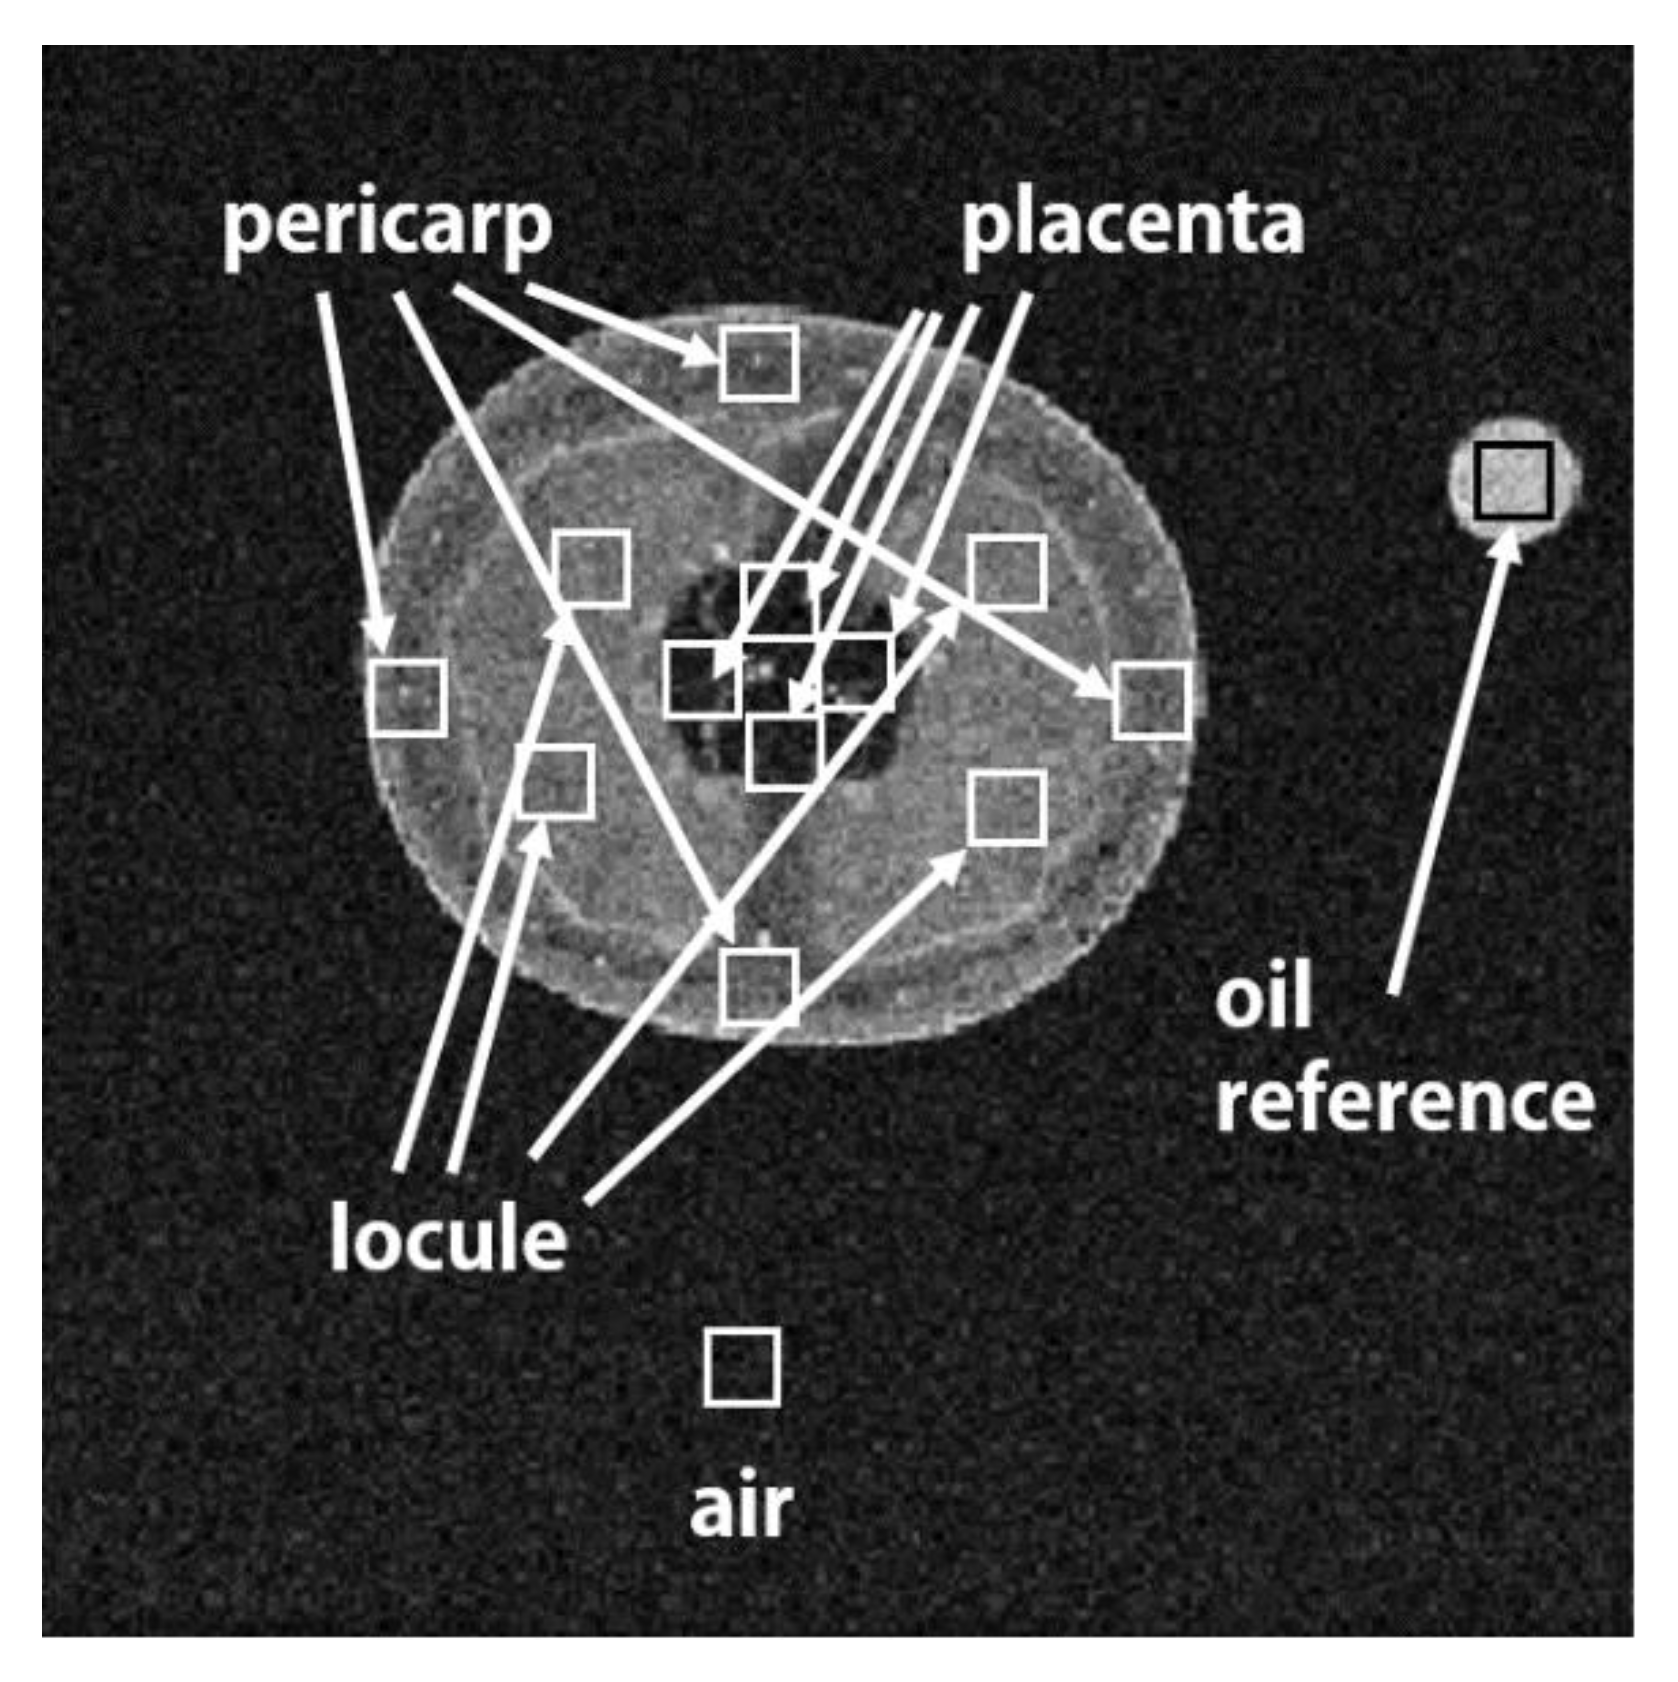
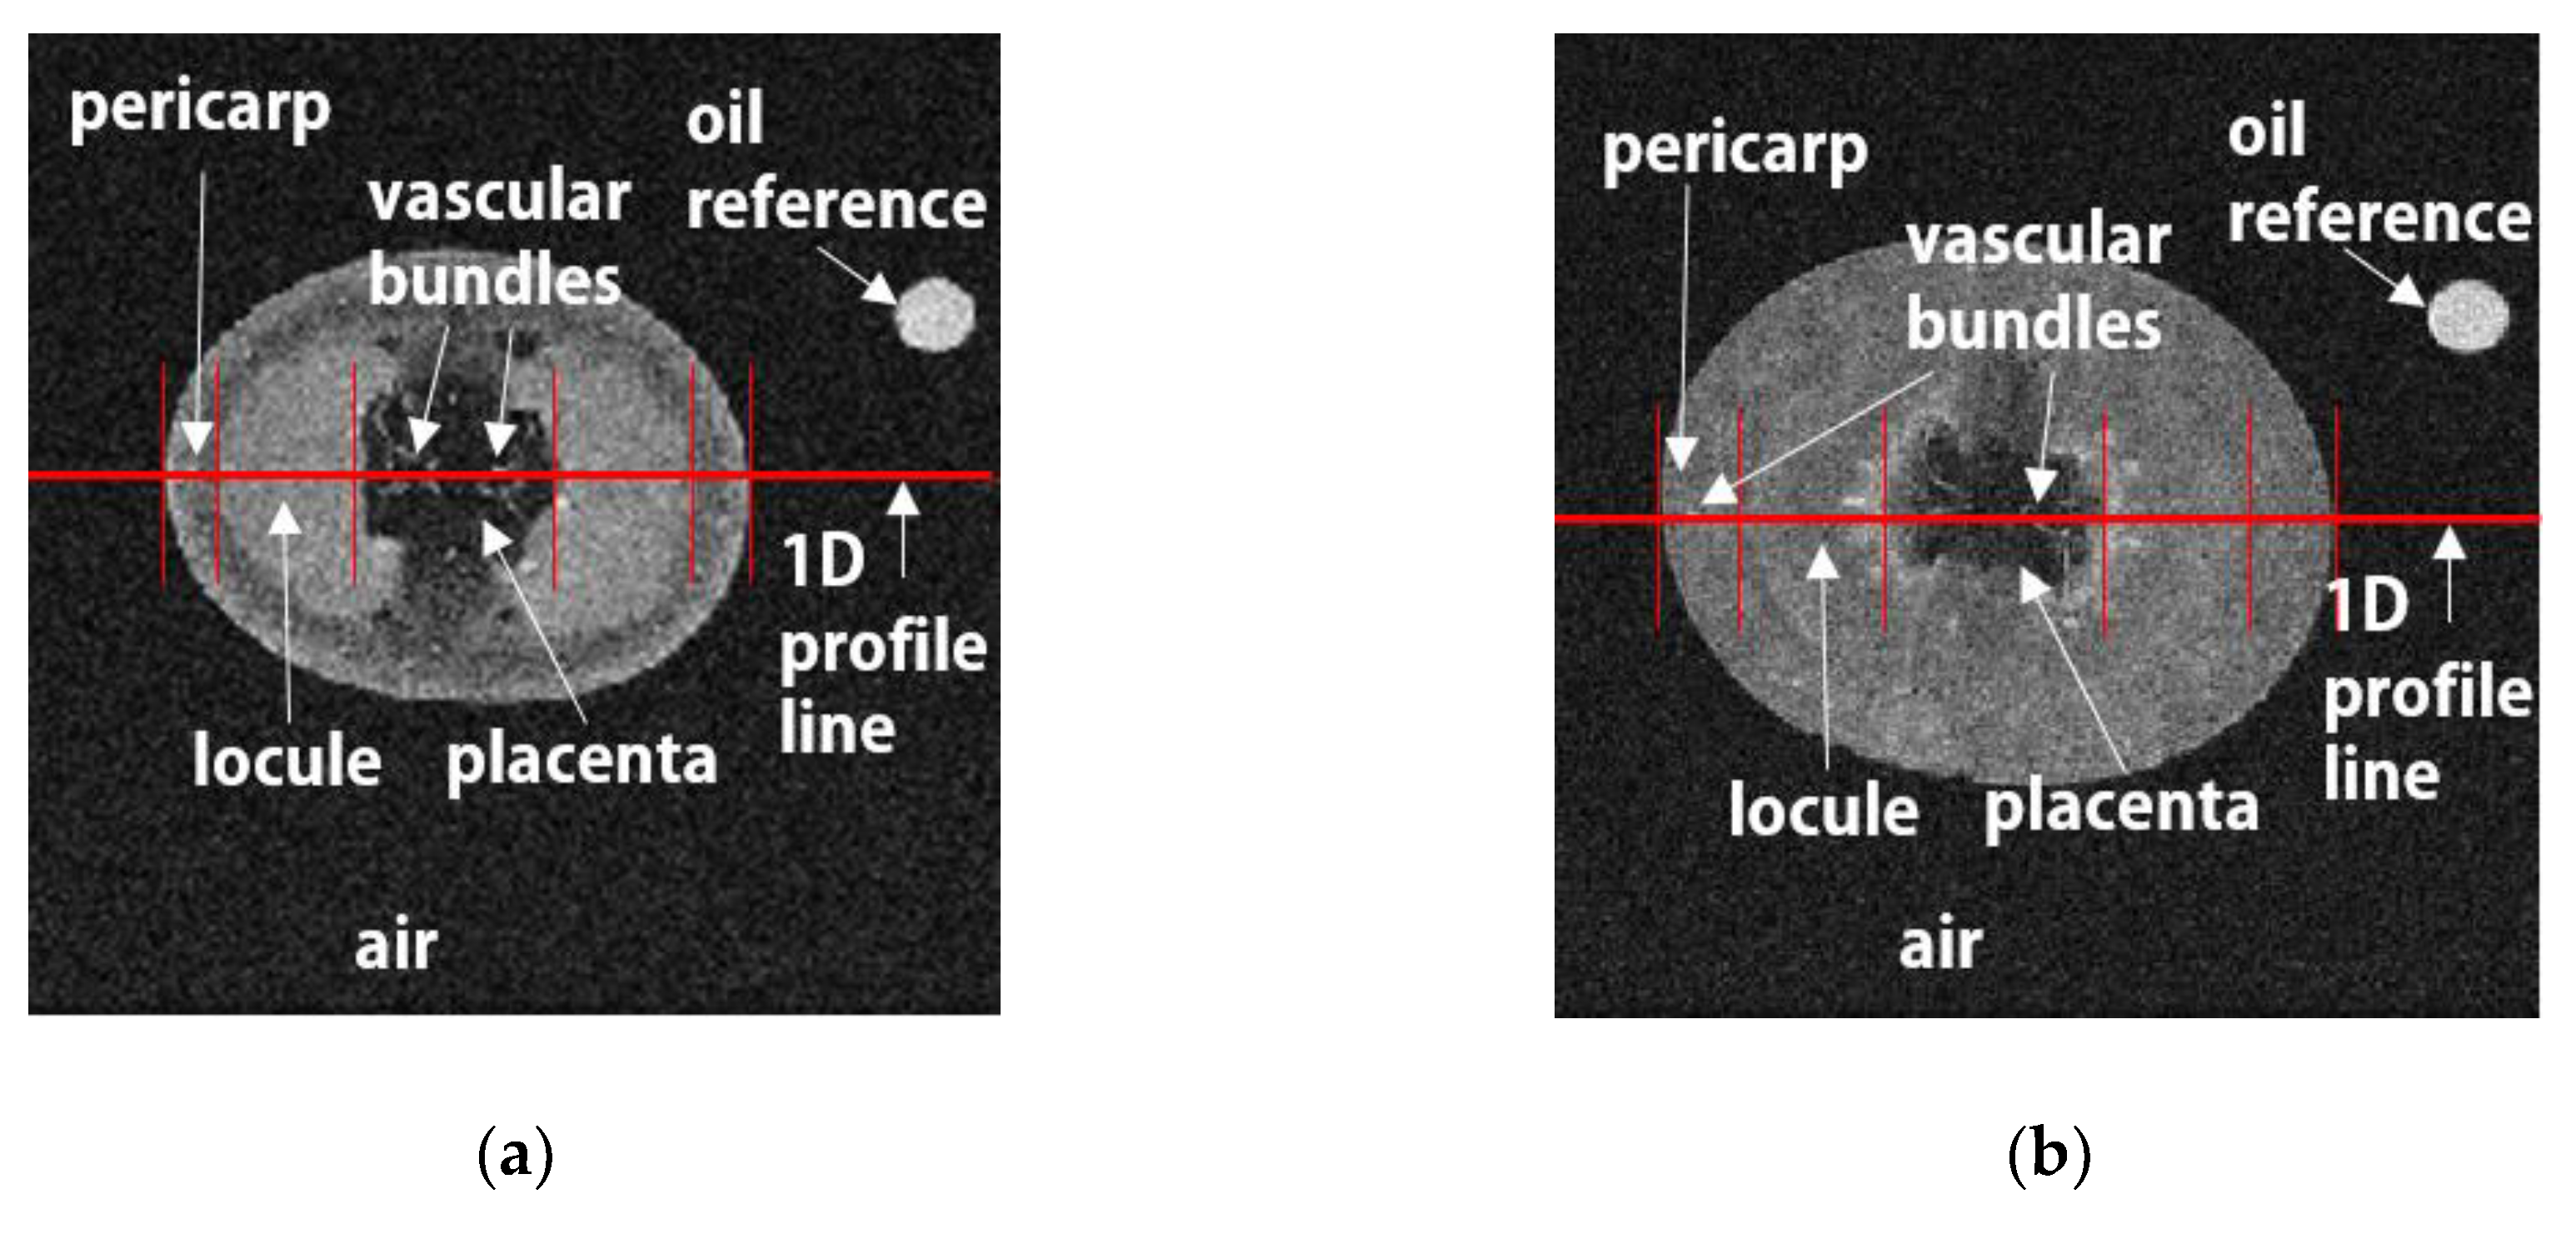
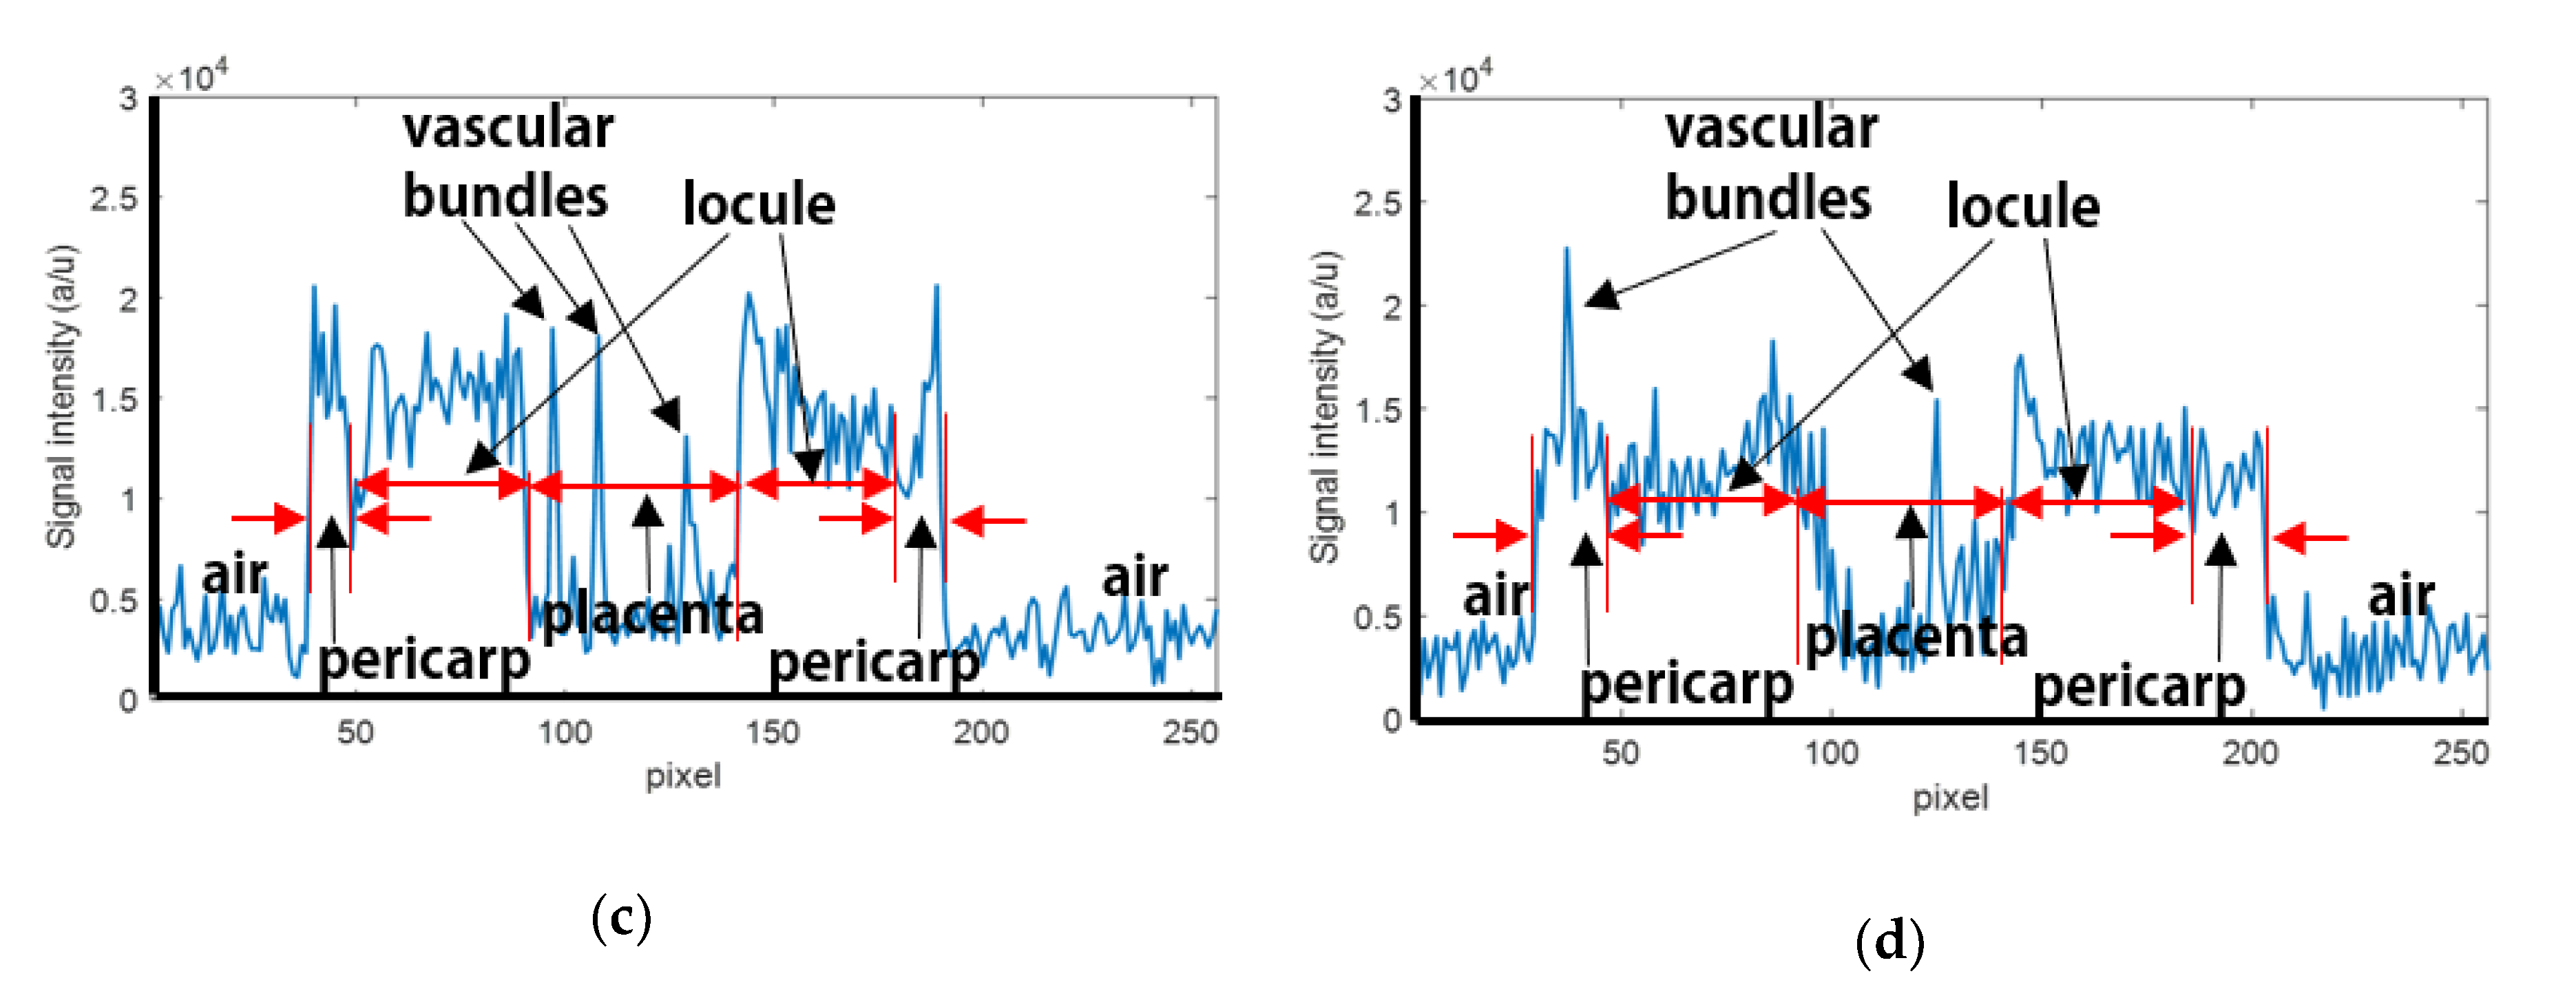
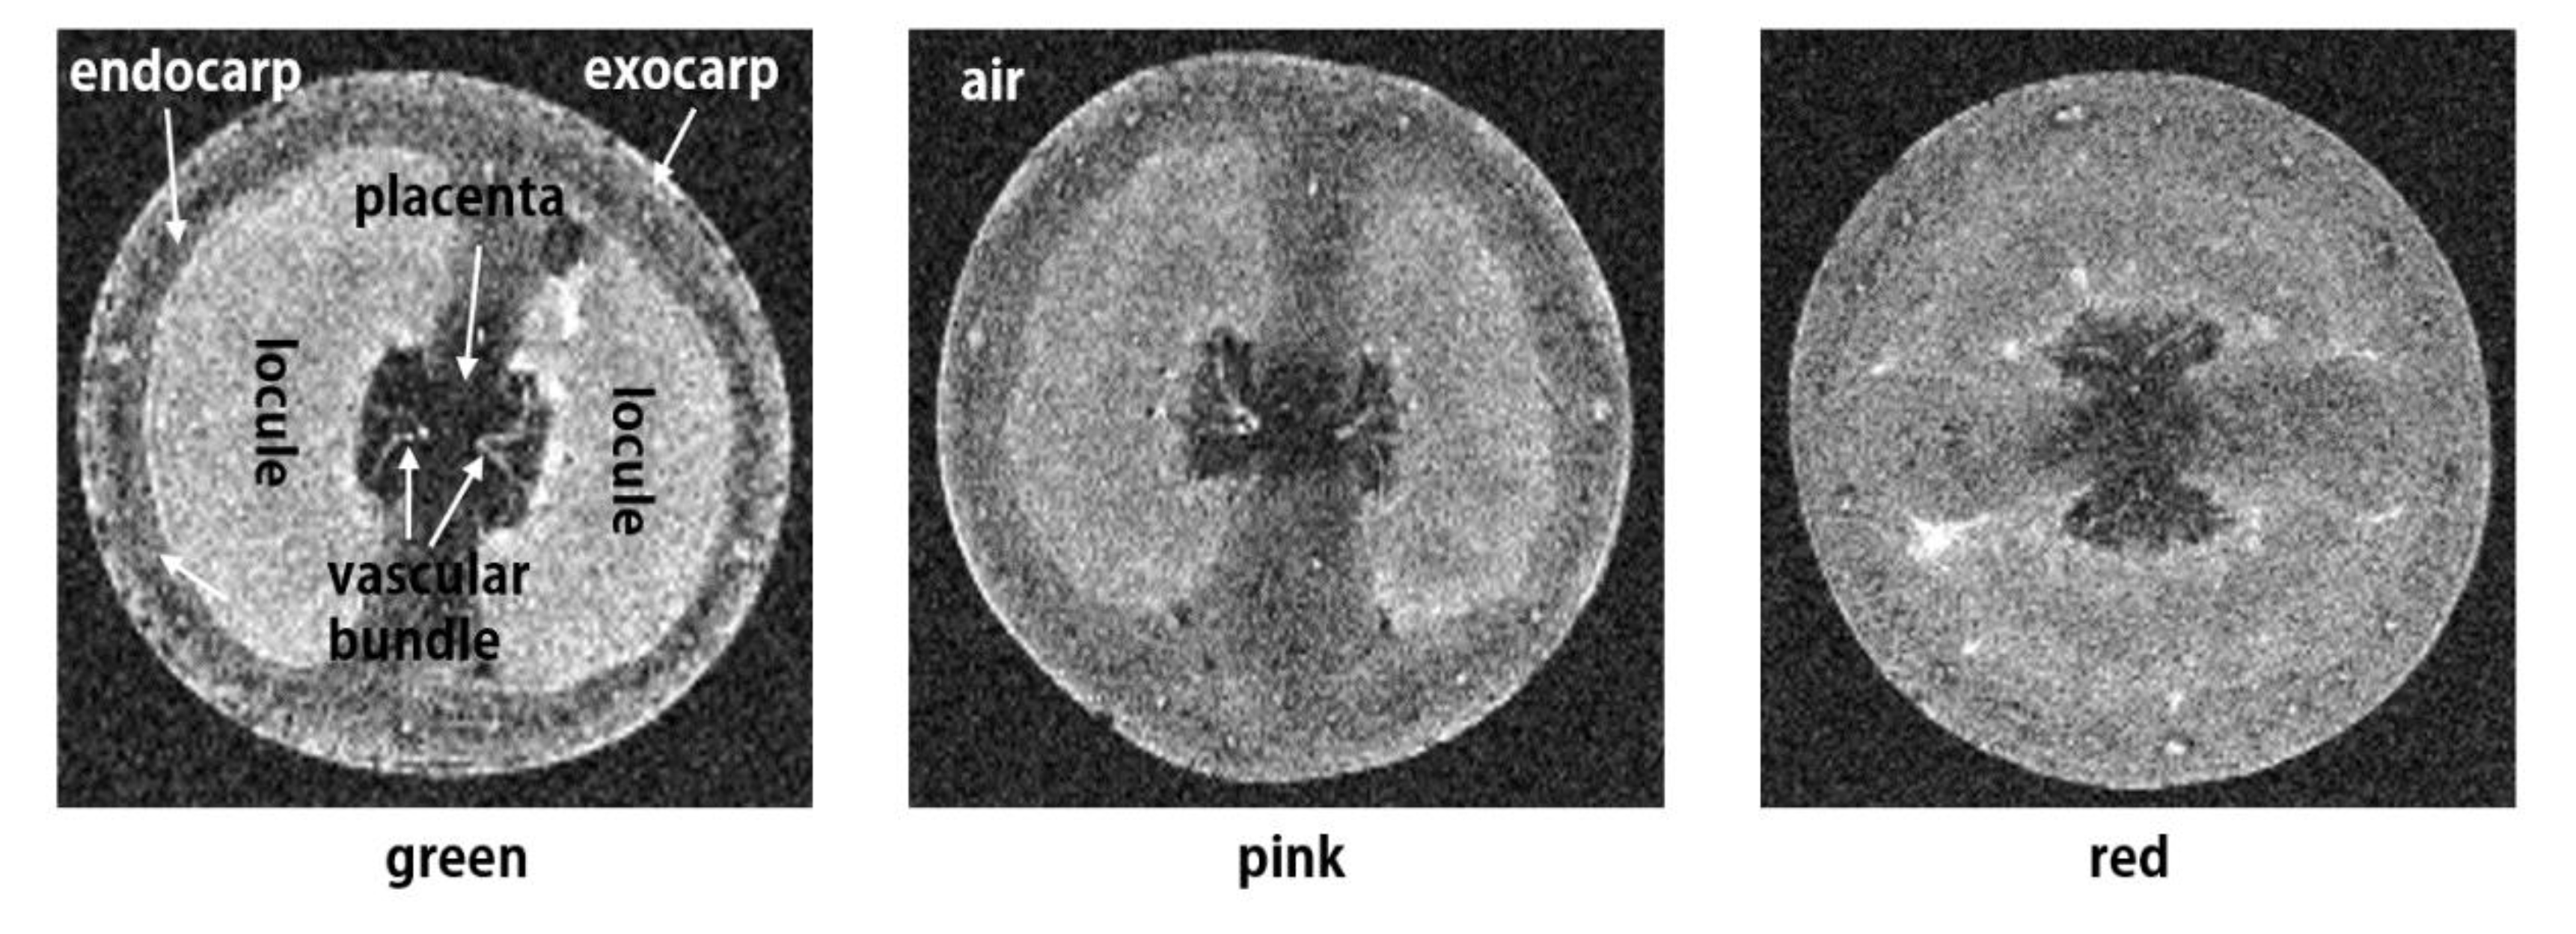
2.3. Characteristics of Magnetic Resonance Images

The file type of MR images is DICOM with a 16-bit integer value. A commercial software (MATLAB R2017b with Image Processing and Statistics Toolboxes, Mathworks Inc., Natick, MA, USA) was used to process DICOM images. Figure 3 shows MR images of selected slices of cherry tomato at green maturity stage—the circle to the right of the tomato in the image is the signal from the oil reference. Generally, signal intensity of an MR image is strongly dependent on the amount of protons in the sample. Therefore, the oil reference and sample generate strong signals and air surrounding the sample generates essentially no signal. Theoretically, all of the different MR image slices should have the same signal intensity for the same quantity of protons; however, the first and last few images have artifacts due to magnetic field inhomogeneity inside the magnet. Those images containing artifacts are not suitable for precise analysis. Therefore, six images from the 8th to the 13th slice in the middle of a series of MR images were used for analysis in this study.

2.4. Data Analysis

Figure 4 shows mean signal intensity (MSI) calculation regions for the MR images. Four rectangular regions from three main parts (pericarp, locule, and placenta) and two more rectangular regions from the oil reference and air were selected manually to include more than 100 pixels from each region. Consequently, a total of 14 regions from each slice of 3D MR image sets were considered for investigating the internal structure changes with different maturity stages of cherry tomatoes. Image slice numbers 8 through 13 were used for the MSI calculation. Therefore, mean values of MSI calculated from 24 regions from each main part and 6 regions from oil reference and air from each sample were used for further analysis.

3. Results

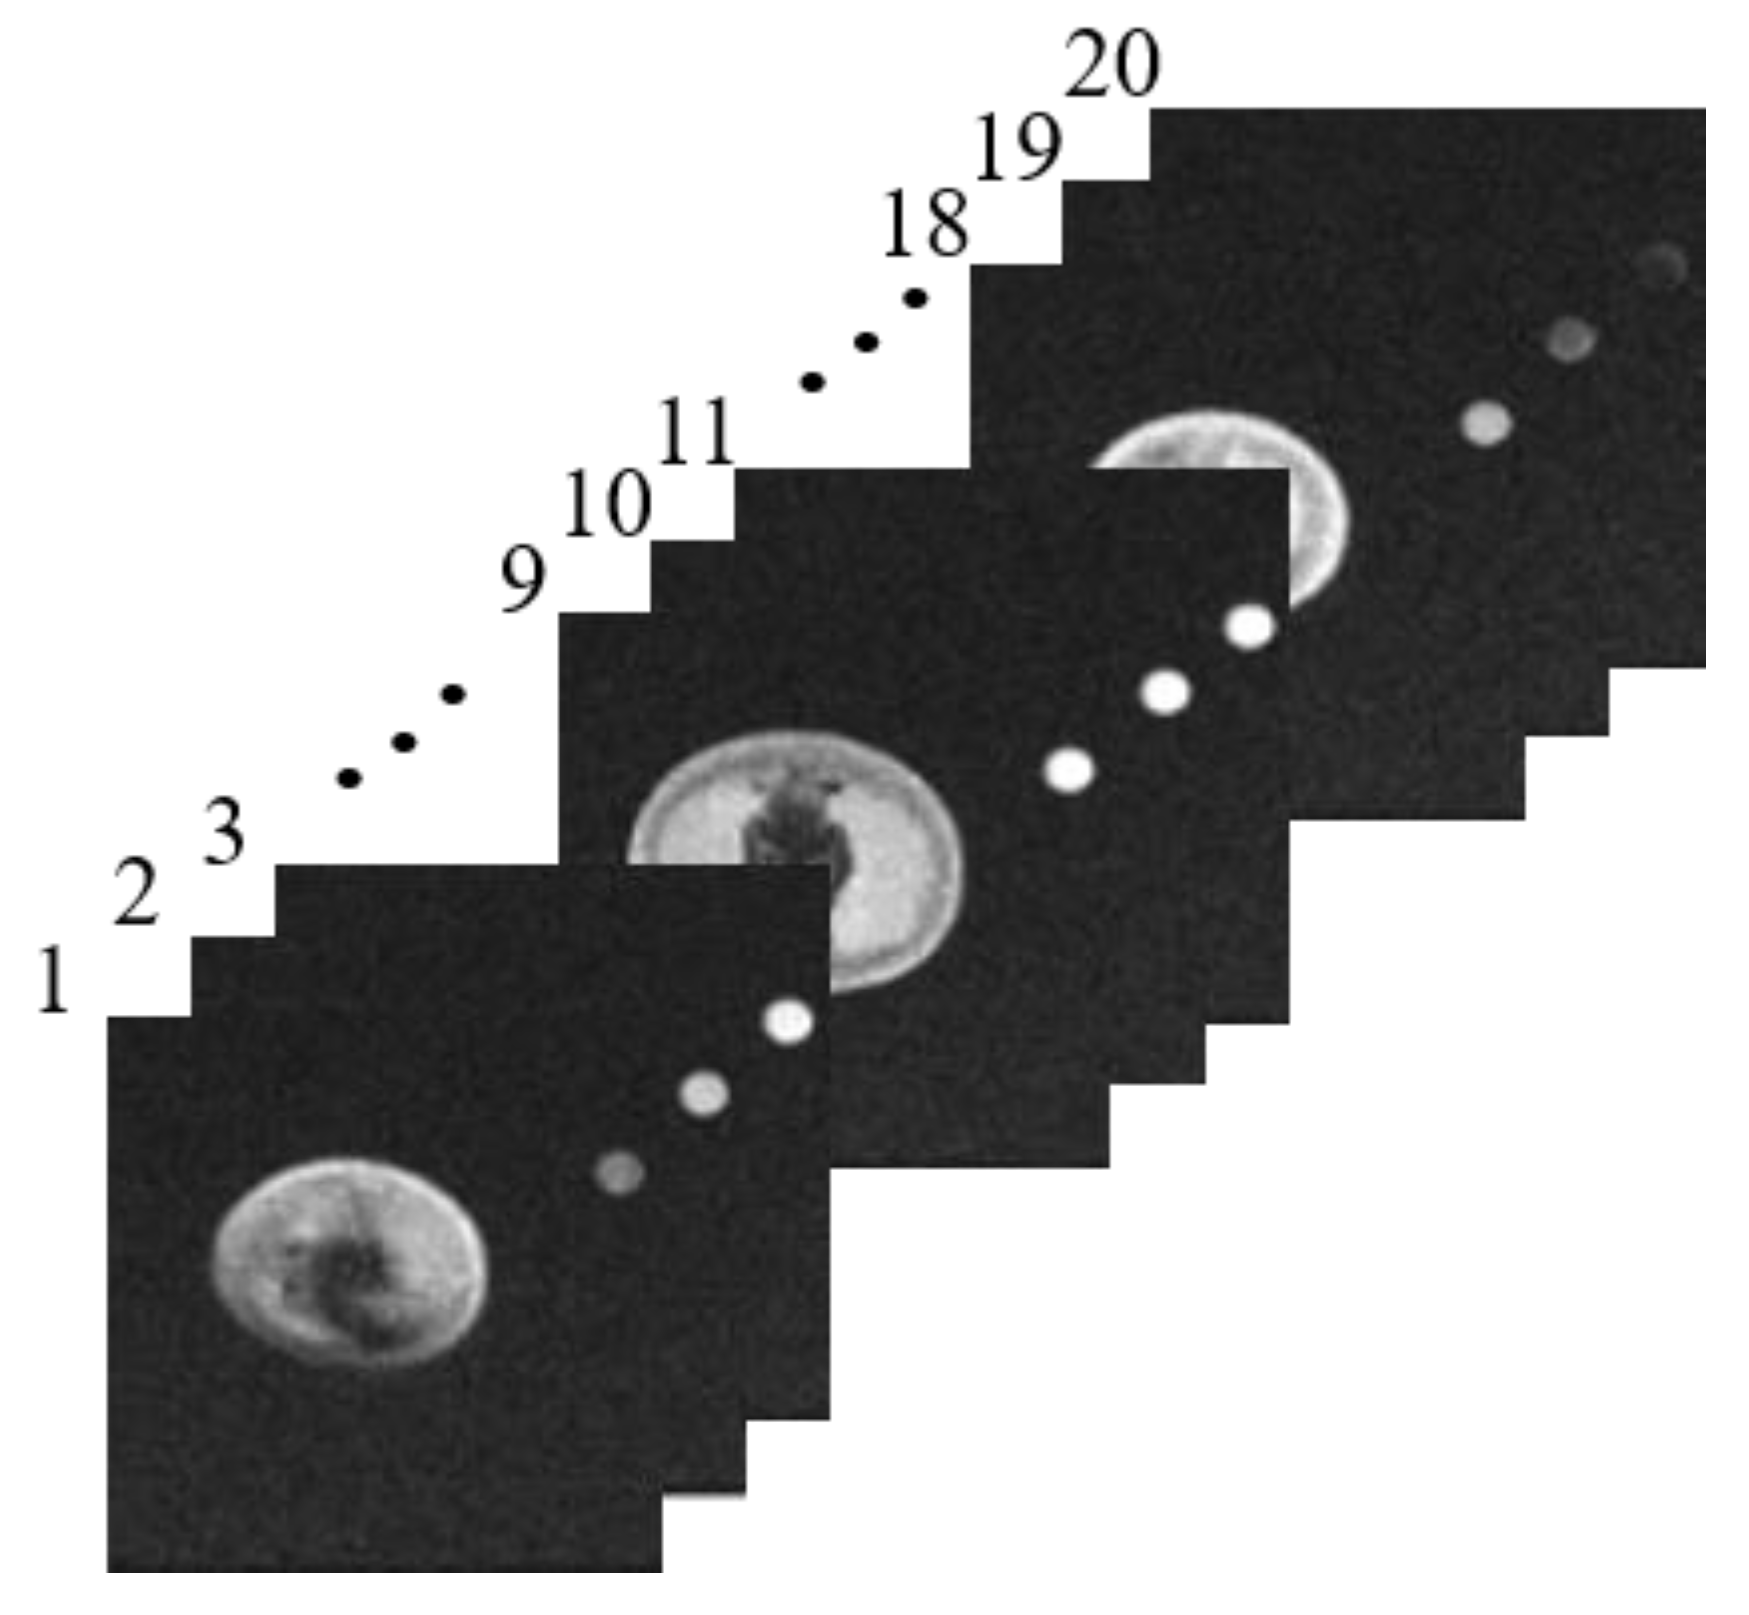
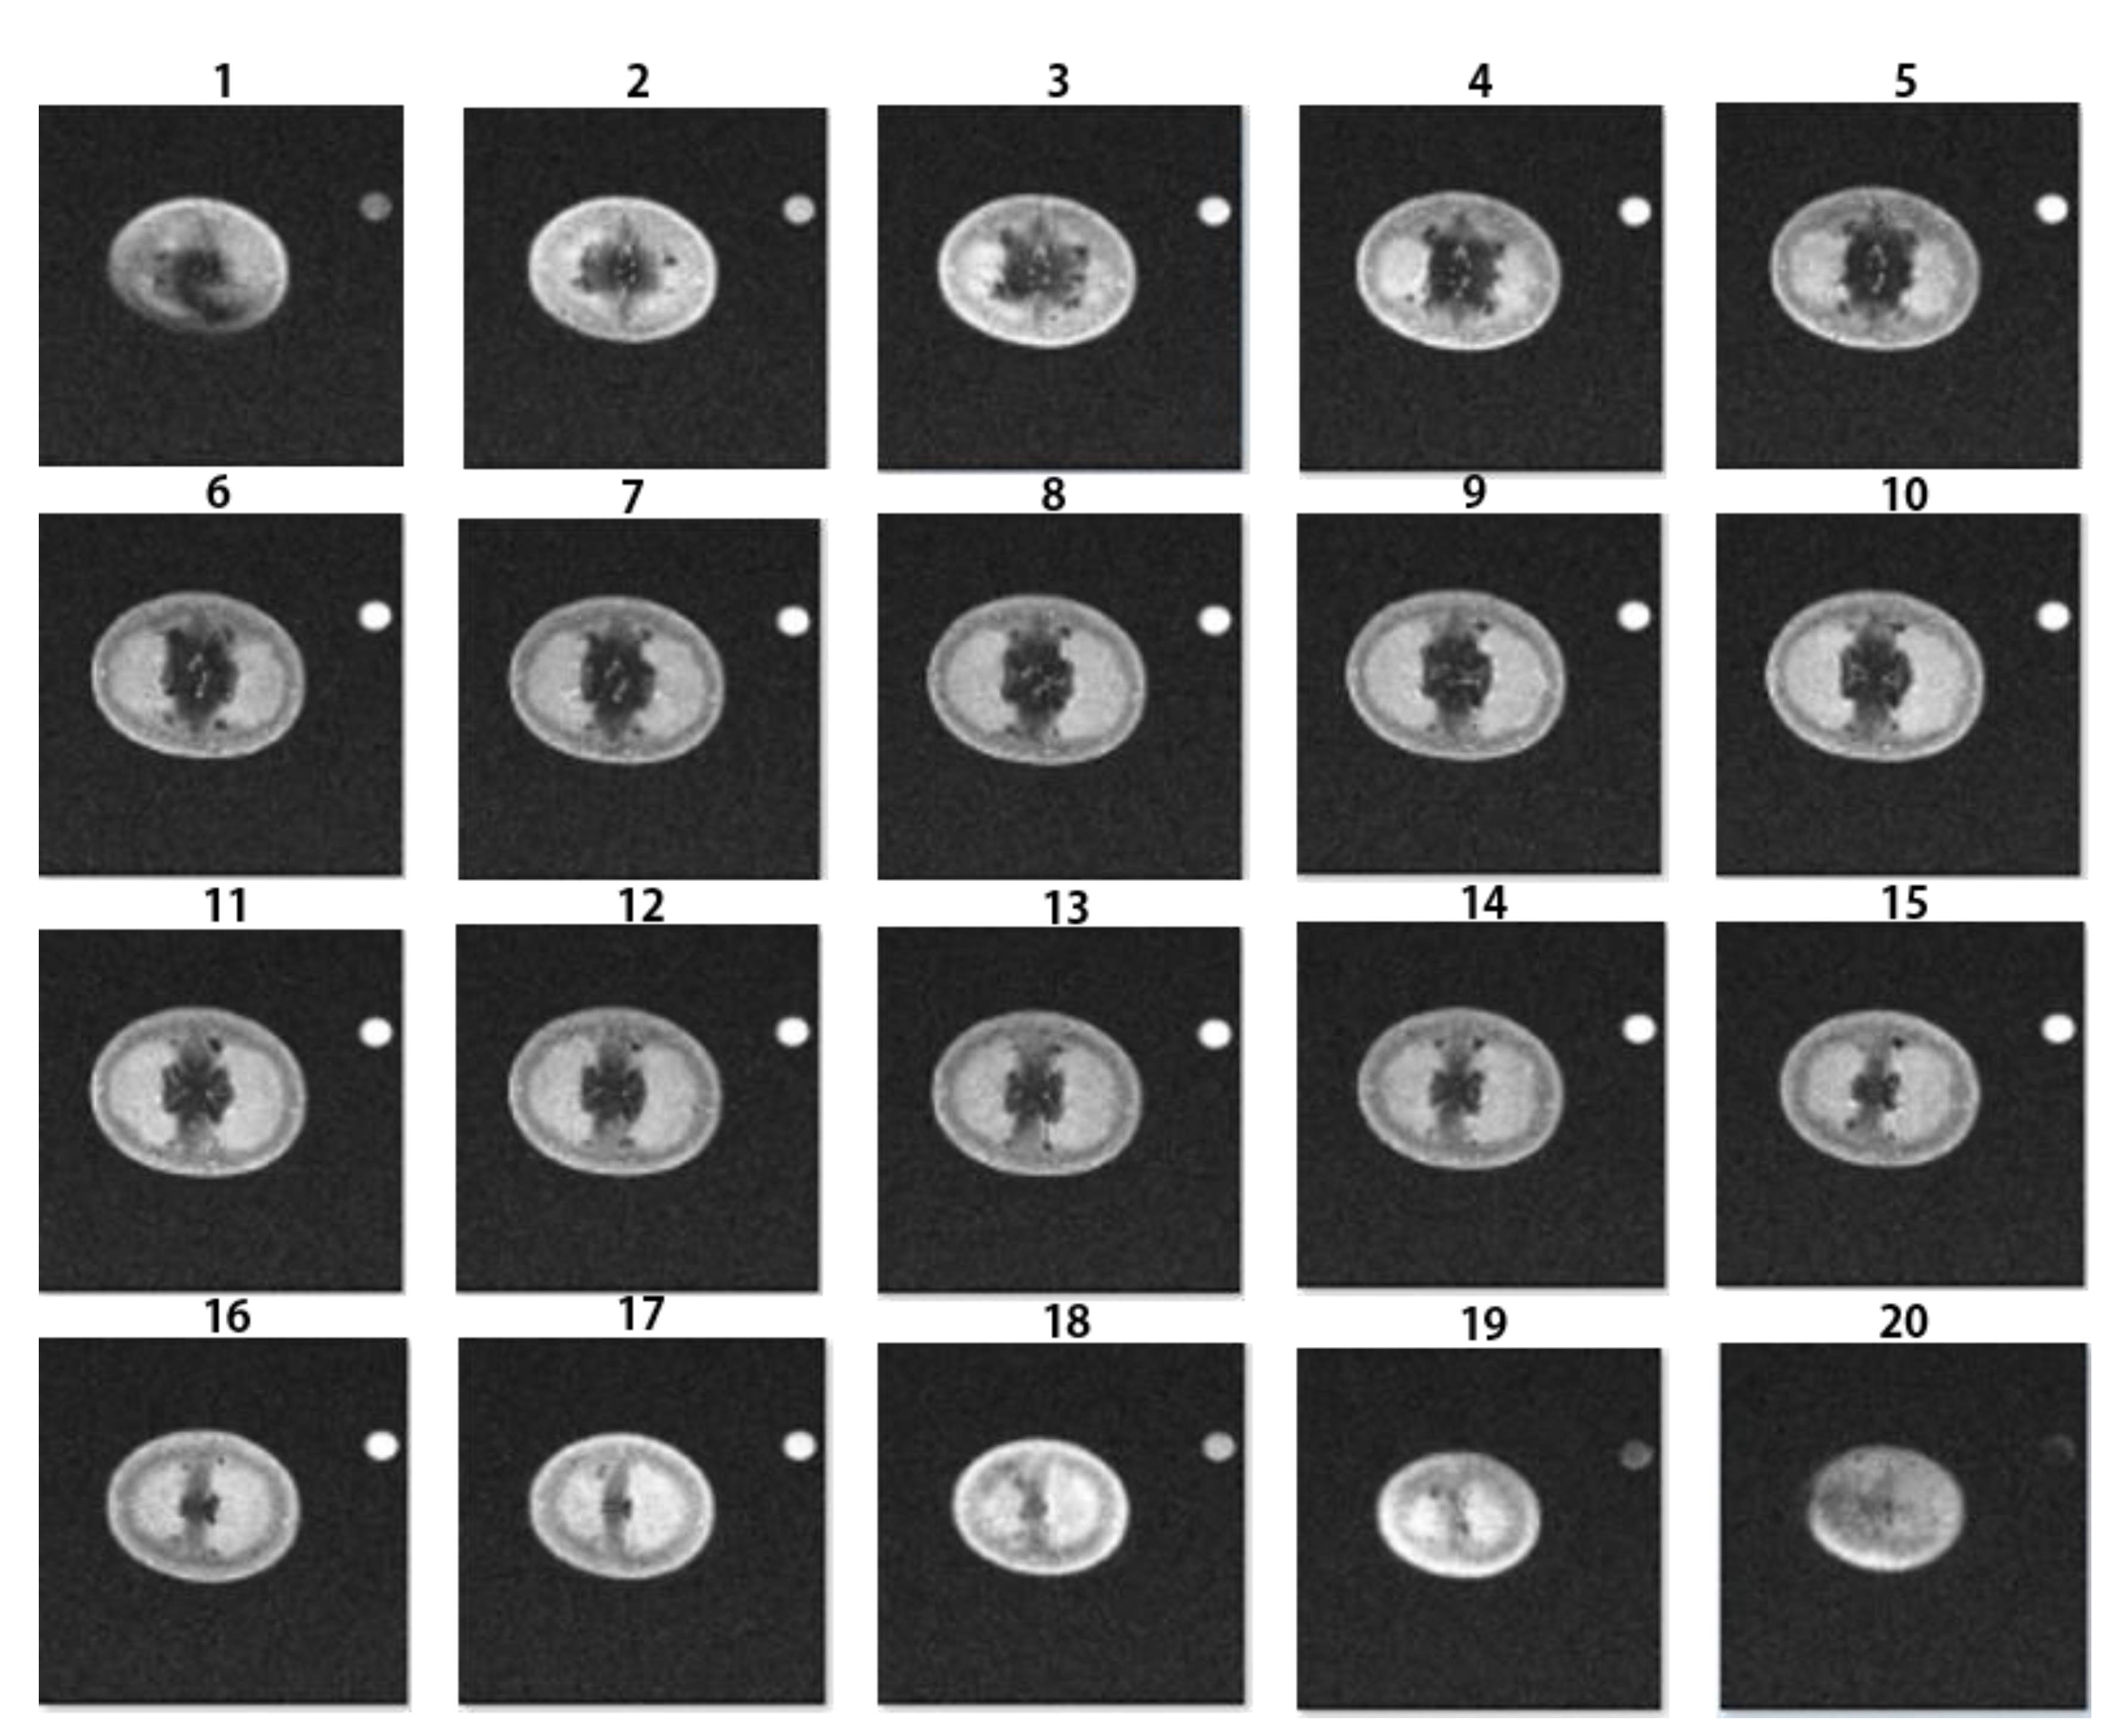
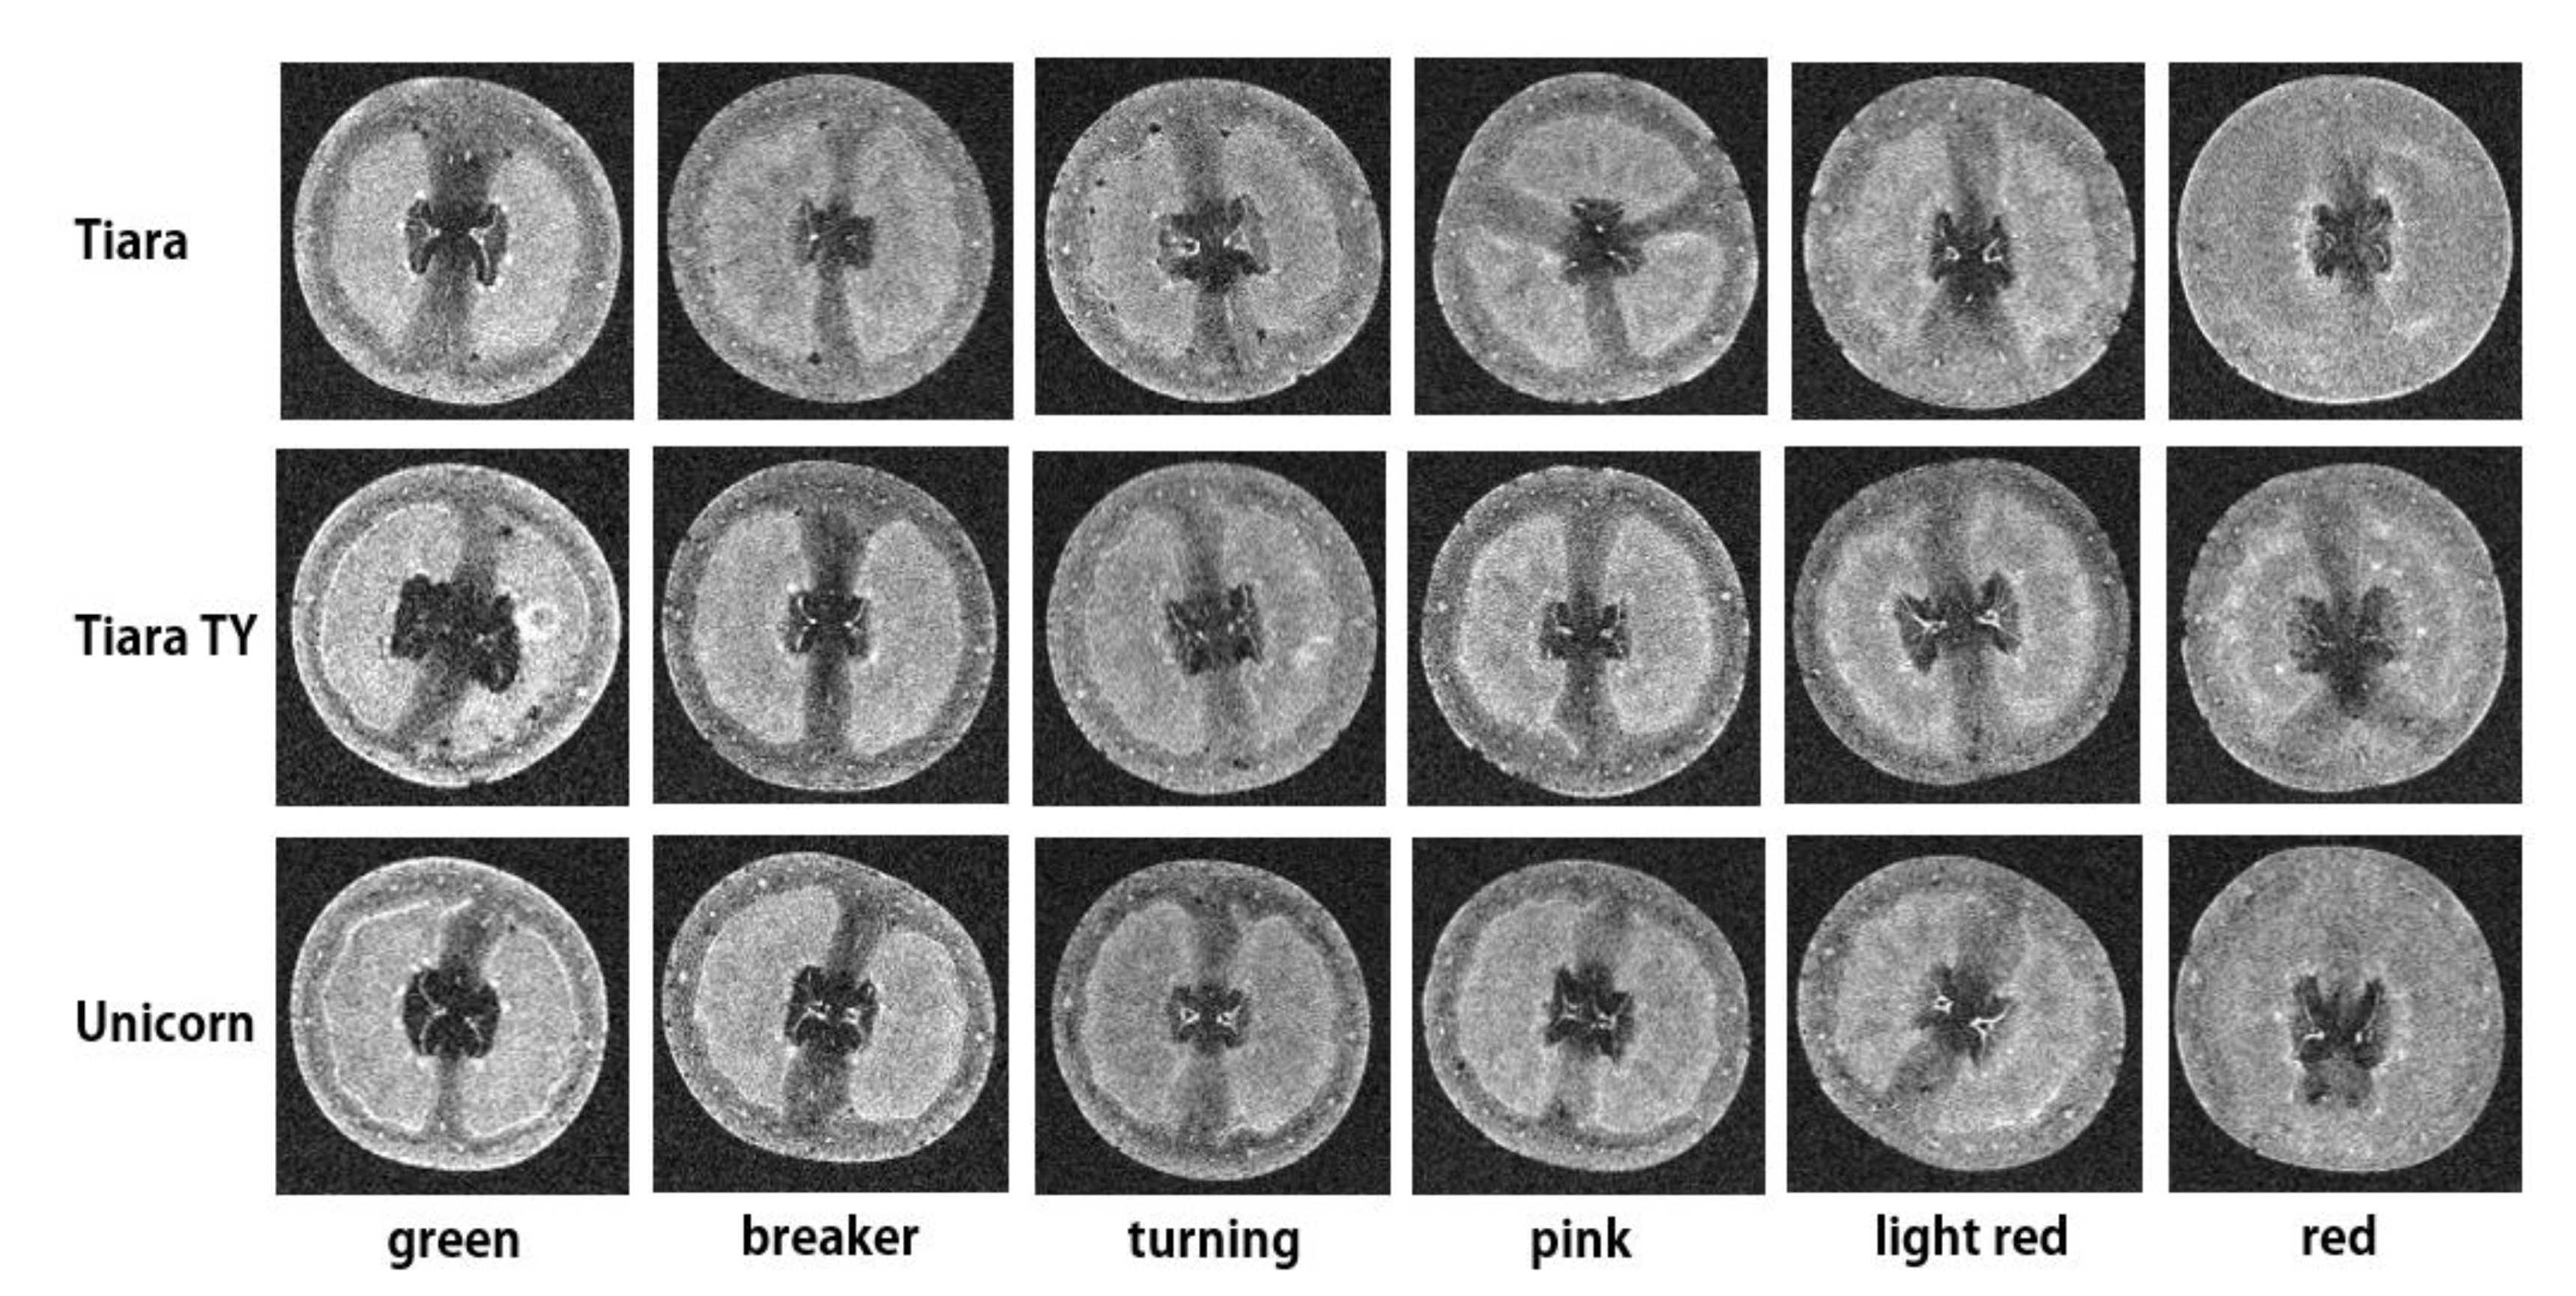
3.1. Qualitative MR Image Analysis

Qualitative image analysis of internal structure changes with different maturity stages were performed. Figure 5a,b shows a center slice image from a 3D MR image set of a cherry tomato at green and red maturity stages, respectively. Usually, the fruit consists of three main parts, including pericarp, locule, and placenta. Pericarp is the fruit wall including flesh and vascular bundles, locule surrounded by pericarp contains seeds and vascular bundles, and placenta is the fleshy part containing vascular bundles only. Additional investigation of the MR image signal intensity variations was done using a 1D image profile of the samples. Figure 5c shows a 1D signal intensity profile graph along a line in Figure 5a. Figure 5d shows a 1D signal intensity profile graph along a line in Figure 5b. Strong signal intensity from pericarp and locule regions was observed from the sample. However, the signal intensity from the placenta region is low compared to pericarp and locule regions, except intensity spikes due to vascular bundles within the placenta. Very strong signal intensity from vascular bundles was observed from the placenta region in cherry tomato. Also, signal intensity variations were observed from three different parts: pericarp, locule, and placenta, of the fruit. These three parts will be changed depending on fruit maturity stage.
Figure 6 is a center slice of representative MR images of Tiara TY cultivar cherry tomato at three maturity stages: green, pink, and red. At the green maturity stage, the inner (endocarp) and outer (exocarp) pericarp parts are separated visually. A stronger signal is generated from the exocarp region than from the endocarp region, and locule and pericarp parts are distinguished. The signal intensity difference between endocarp and exocarp is less at the pink maturity stage. Also, locule and pericarp parts are distinguished clearly at this stage. However, signal intensity difference between pericarp and locule is about the same at the red maturity stage. It means water distribution inside the tomato is even at the final maturity stage. Figure 7 shows representative MR images of three cherry tomato cultivars with different maturity stages. There is no clear difference on internal structure changes among the cultivars. Generally, pericarp and locule parts are clearly distinguished at all maturity stages, except the red maturity stage, regardless of cultivars.
The water distribution of cherry tomatoes appears even at the final maturity stage, regardless of cultivar. However, water content appears evenly distributed in the pericarp region from breaker to light red maturity stages. MR signal intensity changes when different maturity stages are observed. Especially, signal intensity variation between the pericarp and locule regions is observed. Therefore, quantitative analysis of MSI variations of three main parts (pericarp, locule, and placenta), oil reference, and the background noise is justified.

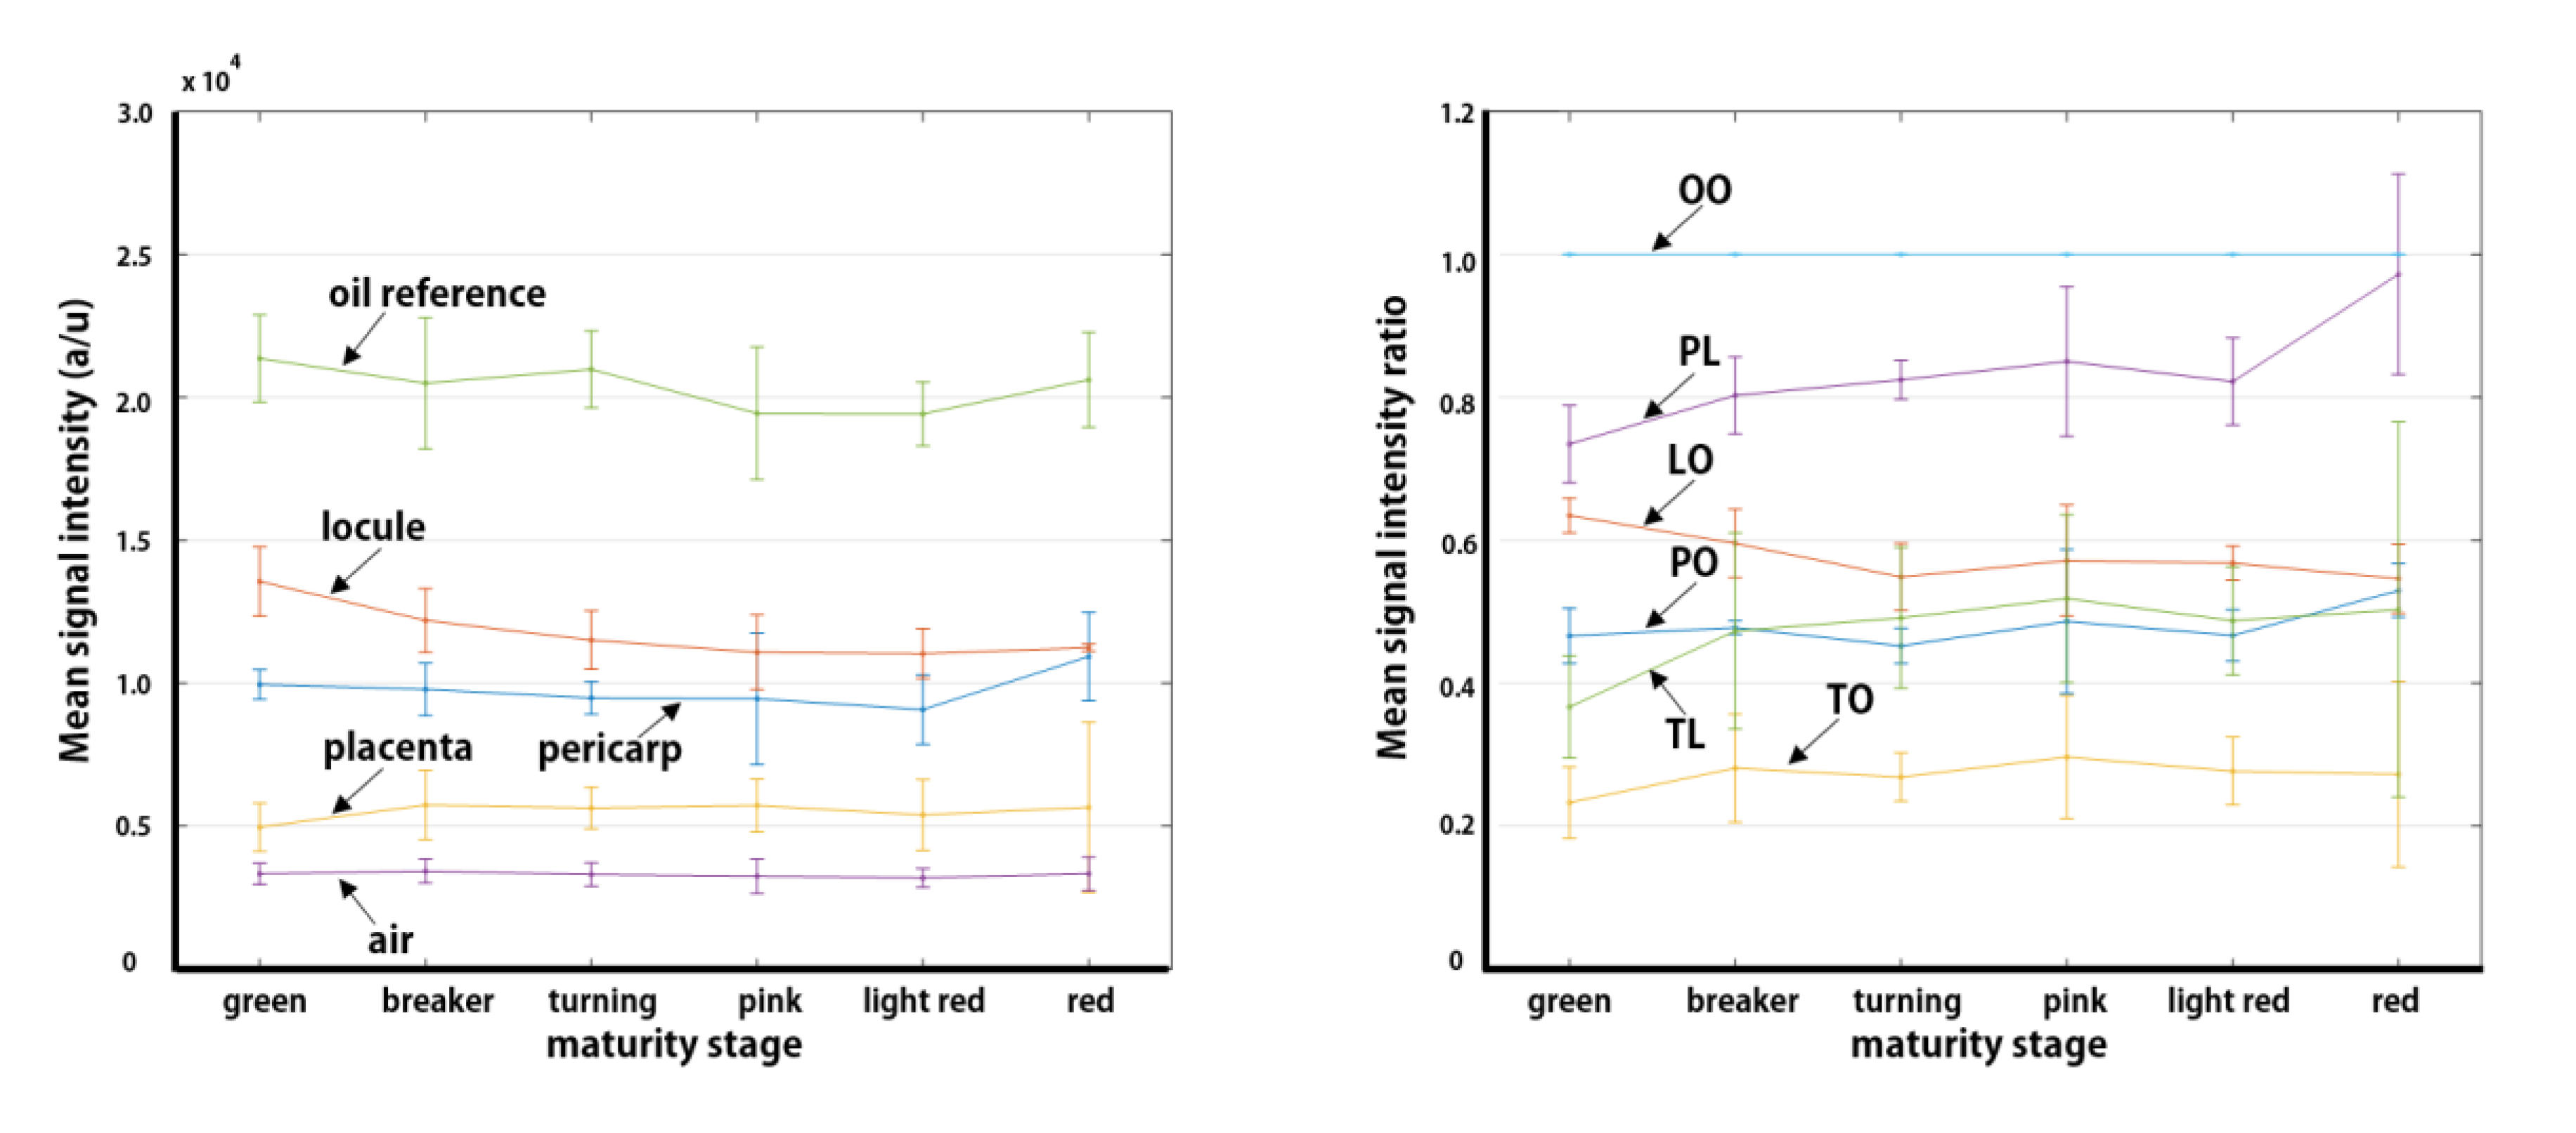
3.2. Quantitative MR Image Analysis

Based on qualitative investigation, quantitative analysis was performed with data acquired from 54 samples. Figure 8 shows MSI and MSI ratio variations of three cherry tomato cultivars with six different maturity stages. The ratio was calculated based on the MSI of the oil reference and the MSI of the locule region. The MSI of the oil reference changes throughout all stages without any trends due to optimization of imaging parameters, including field uniformity and receiver gain, and hence, it is used to standardize the signal intensity to yield signal variations from changes in tomato maturity only. The MSI of the three main parts of samples changes significantly throughout all maturity stages but does not show any typical trends. The MSI value of background noise from air surrounding the sample is even smaller than the placenta region. Four ratios based on the MSI of the oil reference and two ratios based on the MSI of the locule region were analyzed, as shown in Figure 8. The ratio of the MSI from the pericarp region based on the locule region shows an increasing trend with different maturity stages for all three cultivars (labeled PL in color purple on the right-side plots in Figure 8). This result indicates that cherry tomato maturity stage can be quantified nondestructively.

4. Conclusions

Cherry tomato samples with six different maturity stages from green to red were investigated using an MRI system. Changes in cherry tomato maturity were both qualitatively visible and quantifiable from signal analysis of magnetic resonance images. Variations in the signal intensity were observed as a function of maturity in all cultivars. Quantifying variations of signal intensity using a ratio of signal between two different regions (e.g., pericarp to locule) enables assignment of cherry tomato maturity. These results indicate that the use of magnetic resonance imaging for nondestructive measurement of agricultural produce maturity is feasible. Additionally, since MRI provides detailed internal structure information, characterization of internal defects (e.g., bruises, voids, impact damage) and other quality factors is possible.

Author Contributions

Conceptualization, S.M.K.; Data curation, S.B.; Methodology, J.G.L. and S.M.K.; Software, S.M.K.; Formal analysis, S.M.K. and J.L.; Resources, J.G.L.; Writing—original draft preparation, S.B.; Writing—review and editing, S.M.K., M.J.M. and J.L. All authors have read and agreed to the published version of the manuscript.

Funding

This research received no external funding.

Acknowledgments

This study was carried out by the support of research funds of Jeonbuk National University in 2017. Also, the authors thank to the Institute for Agricultural Machinery & ICT Convergence in Jeonbuk National University for the institutional support of instruments and systems.

Conflicts of Interest

The authors declare no conflict of interest.

References

  1. Ahmed, M.R.; Yasmin, J.; Lee, W.H.; Mo, C.; Cho, B.K. Imaging Technologies for Nondestructive Measurement of Internal Properties of Agricultural Products: A Review. J. Biosyst. Eng. 2017, 42, 199–216. [Google Scholar] [CrossRef]
  2. Lim, J.G.; Kim, C.S.; Lee, S.J.; Kim, S.M. Internal Quality Evaluation and Age Identification of Fresh Korean Ginseng using Magnetic Resonance Imaging. J. KSAM 2003, 28, 157–166. [Google Scholar]
  3. Magwaza, L.S.; Opara, U.L. Investigation non-destructive quantification and characterization of pomegranate fruit internal structure using X-ray computed tomography. Postharvest Biol. Technol. 2014, 95, 1–6. [Google Scholar] [CrossRef]
  4. Patel, K.K.; Khan, M.A.; Kar, A. Recent development in applications of MRI techniques for foods and agricultural produce-an overview. J. Food Sci. Technol. 2015, 52, 1–26. [Google Scholar] [CrossRef]
  5. Donis-González, I.R.; Guyer, D.E.; Pease, A. Postharvest noninvasive assessment of undesirable fibrous tissue in fresh processing carrots using computer tomography images. J. Food Eng. 2016, 190, 154–166. [Google Scholar] [CrossRef] [Green Version]
  6. Joyce, D.C.; Hockings, P.D.; Mazucco, R.A.; Shorter, A.J. 1H-Nuclear magnetic resonance imaging of ripening ‘Kensington Pride’ mango fruit. Funct. Plant Biol. 2002, 29, 873–879. [Google Scholar] [CrossRef] [PubMed]
  7. Kim, S.M.; Milczarek, R.; McCarthy, M.J. Fast Detection of Seeds and Freeze Damage of Mandarins using Magnetic Resonance Imaging. Mod. Phys. Lett. B 2008, 22, 941–946. [Google Scholar] [CrossRef]
  8. Taglienti, A.; Massantini, R.; Botondi, R.; Mencarelli, F.; Valentini, M. Postharvest structural changes of Hayward kiwifruit by means of magnetic resonance imaging spectroscopy. Food Chem. 2009, 114, 1583–1589. [Google Scholar] [CrossRef]
  9. Gautier, H.; Diakou-Verdin, V.; Bénard, C.; Reich, M.; Burnet, M.; Bourgaud, F.; Poëssel, J.L.; Caris-Veyrat, C.; Génard, M. How does tomato quality (sugar, acid, and nutritional quality) vary with ripening stage, temperature, and irradiance? J. Agric. Food Chem. 2008, 56, 1241–1250. [Google Scholar] [CrossRef] [PubMed]
  10. Musse, M.; Quellec, S.; Cambert, M.; Devaux, M.F.; Lahaye, M.; Mariette, F. Monitoring the postharvest ripening of tomato fruit using quantitative MRI and NMR Relaxometry. Postharvest Biol. Technol. 2009, 53, 22–35. [Google Scholar] [CrossRef]
  11. Ciampa, A.; Dell’Abate, M.T.; Masetti, O.; Valentini, M.; Sequi, P. Seasonal chemical-physical changes of PGI Pachino cherry tomatoes detected by magnetic resonance imaging. Food Chem. 2010, 122, 1253–1260. [Google Scholar] [CrossRef]
  12. Zhang, L.; McCarthy, M.J. Measurement and evaluation of tomato maturity using magnetic resonance imaging. Postharvest Biol. Technol. 2012, 67, 37–43. [Google Scholar] [CrossRef]
  13. Zhang, L.; Barrett, D.M.; McCarthy, M.J. Characterization of the Red Layer and Pericarp of Processing Tomato using Magnetic Resonance Imaging. J. Food Sci. 2013, 78, E50–E55. [Google Scholar] [CrossRef] [PubMed]
Figure 1. Cross-cut-section photos of all samples showing different maturity stages.
Applsci 10 05188 g001
Figure 2. Cherry tomato magnetic resonance images.
Applsci 10 05188 g002
Figure 3. A series of 20 magnetic resonance images of a cherry tomato at green maturity stage. From the 1st to the 20th slice (from stem end to blossom end).
Applsci 10 05188 g003
Figure 4. Signal calculation regions with rectangular box from an MR image.
Applsci 10 05188 g004
Figure 5. Center slice image of acquired MR images of Tiara cherry tomato. (a) Original gray scale MR image of cherry tomato at green maturity stage, including oil reference with a line along x imaging axis, (b) original gray scale MR image of cherry tomato at red maturity stage, including oil reference with a line along x imaging axis. (c) One-dimensional (1D) signal intensity profile graph along a line in (a), (d) 1D signal intensity profile graph along a line in (b).
Applsci 10 05188 g005aApplsci 10 05188 g005b
Figure 6. Representative MR images of Tiara TY cultivar cherry tomato only at three maturity stages: green, pink, and red.
Applsci 10 05188 g006
Figure 7. Representative MR images of three cherry tomato cultivars at different maturity stages. Row images represent cultivars, top row (Tiara), middle row (Tiara TY), and bottom row (Unicorn). Column images represent different maturity stages: green, breaker, turning, pink, light red, and red, from left to right, respectively.
Applsci 10 05188 g007
Figure 8. Mean signal intensity (left column) and mean signal intensity ratio (right column) variations of three cherry tomato cultivars with 6 different maturity stages (with standard error bar, 90% prediction interval). Rows represent cultivars, top row (Tiara), middle row (Tiara_TY), and bottom row (Unicorn). OO: ratio of oil reference against oil reference, PO: ratio of pericarp against oil reference, LO: ratio of locule against oil reference, TO: ratio of placenta against oil reference, PL: ratio of pericarp against locule, and TL: ratio of placenta against locule.
Applsci 10 05188 g008aApplsci 10 05188 g008b

