Article

Estimation Method for TBM Cutterhead Drive Design Based on Full-Scale Tunneling Tests for Application in Utility Tunnels

1
Next Generation Transmission & Substation Laboratory, KEPCO Research Institute, 105 Munji-Ro, Yuseong-Gu, Daejeon 34056, Korea
2
Department of Civil and Environmental Engineering, Hanyang University, Sangnok–gu, Ansan 15588, Korea
3
NUST Institute of Civil Engineering, National University of Science and Technology (NUST), Islamabad 44000, Pakistan
*
Authors to whom correspondence should be addressed.
Appl. Sci. 2020, 10(15), 5187; https://doi.org/10.3390/app10155187
Submission received: 6 July 2020 / Revised: 20 July 2020 / Accepted: 27 July 2020 / Published: 28 July 2020

Abstract

:
The utility tunnels used for electricity transmission are in high demand these days. The literature presents many limitations in the currently used cutterhead drive design procedure while using a shield tunnel boring machine (TBM) for the excavation of these relatively small diameter tunnels. In order to develop an appropriate design method specially for cutterhead drive, experimental data obtained through the operation of a 3560 mm diameter shield TBM were used in this research work. For experimental purpose, an earth pressure balance (EPB) shield TBM was manufactured and a facility was established for performing the full-scale tunneling tests. Numerous tests were performed through the variation of TBM operational parameters such as thrust force and the rotational speed of the cutterhead at four UCS (Uniaxial compressive strength) levels of artificial rock mass. The relationships between thrust force and torque were mainly established and the effects of UCS and rotational speed of cutterhead on these relationships are analyzed through a representative case of 100 MPa UCS. A novel torque estimation method is also presented in this study which can be conveniently used in the cutterhead drive design while using small diameter shield TBMs.

1. Introduction

The choice of excavation method in any tunnel construction project directly affects the project cost. The worldwide use of a shield tunnel boring machine (TBM) in tunnel excavation is continuously increasing not only for the construction of subway, railway, roadway and hydropower tunnels but also for utility tunnel construction (electricity power lines, sewage, gas pipelines etc.). Mostly, these utility tunnels have smaller diameters than the conventional tunnels. The trend of tunnel construction in urban and subsea areas for electricity transmission is increasing these days due to the expansion of underground power lines business. This trend is leading to an increasing need for tunnel extension, averaging around 10 km per year in South Korea. For the use of electricity transmission lines, tunnels are usually constructed with the help of shield TBMs which have the potential to create a section of about 7 m2 area (around 3 m diameter tunnels). The KEPCO (Korea Electric Power Corporation) research institute persistently investigates the performance of shield TBM in order to analyze the efficiency and safety of the utility tunnels construction for electricity transmission purposes. The performance of TBM is a key factor in determining the project duration and cost, which can be further subdivided in two parts. Firstly, the efficiency of excavation in the rock mass based on cutterhead design and the penetration of disc cutters in the rock mass caused by the thrust force need to be assessed. Secondly, the ability to rotate the cutterhead, already penetrated in rock, needs to be determined through the advance rate (excavation speed) of the machine. This study focuses in particular on the derivation of an estimation method of torque based on the performance of cutterhead drive.
Numerous empirical and theoretical estimation methods for the TBM performance were developed in the past few decades [1,2]. Among these methods, the NTNU (Norwegian University of Science and Technology) approach [3] and CSM (Colorado School of Mines) approach [4] are recognized worldwide and these models were modified afterwards by various researchers for developing more precise performance prediction models, owing to the immensely increasing trend of using TBMs in the tunnel construction industry. Besides these two models, empirical methods like QTBM [5,6], RME [7,8] and the computer aided approach [9,10] are also used which rely on well documented case histories. The literature reveals that the performance of the machine in TBM tunneling depends on (1) geological and geotechnical parameters in the excavation environment, (2) cutterhead design parameters and (3) machine operating parameters [11,12]. The first parameter includes rock strength, jointing conditions and drillability. The cutterhead parameters include diameter, spacing, number and geometry of the disc cutters (with or without scrapers). The main TBM operational parameters include rotational speed of the cutterhead, torque, thrust force and power supply. A previous research work indicates that the cutterhead penetration is a major function of torque, however, the rotational speed plays a minor role in the performance [13].
For the TBM performance estimation in all the aforementioned approaches, the three parameters were combined in different ways based on the experimental work and/or field observation. The intact rock strength plays a major role in the TBM performance along with joints (spacing and RQD) [14]. The TBM performance estimation approaches developed so far are mostly based on the field data [15]. However, these field-related geotechnical datasets are mostly based on the exploration results obtained from bore holes drilled along the tunnel route during the project design phase. Relying completely on the borehole data is mostly misleading, especially in cases where the spacing between the boreholes are significantly large. In such cases, the actual conditions at the excavation face deviates remarkably from those obtained from the borehole investigations. The TBM tunnel construction always presents difficulties in continuously developing the face mapping record and also in the collection of geotechnical data. Moreover, the CSM approach is based on a single disc cutter experimental data and the NTNU approach is based on different drillability indices. Both of these approaches are difficult to adopt in South Korea because the specific testing and uses of indices for TBM design with different rock mass properties using these approaches is not completely apprehended. Keeping these limitations in view, KEPCO research institute established a full-scale tunneling test facility for the purpose of designing the TBM cutterhead drive.
In order to develop a TBM performance estimation method for design and construction of utility tunnels, a shield TBM machine having a 3560 mm diameter cutterhead was manufactured using domestic technologies and a test facility having 2100 m2 area was developed for conducting full-scale tests. A total of 80 tests were performed according to the main operational parameters of the machine such as thrust force and rotational speed of the cutterhead in artificial rock masses having four strength levels. Consequently, a new torque estimation method was developed for use in the construction of small diameter utility tunnels considering rock mass strength and TBM operational parameters.

2. Full-Scale Tests for Tunnel Boring Machine (TBM) Tunneling
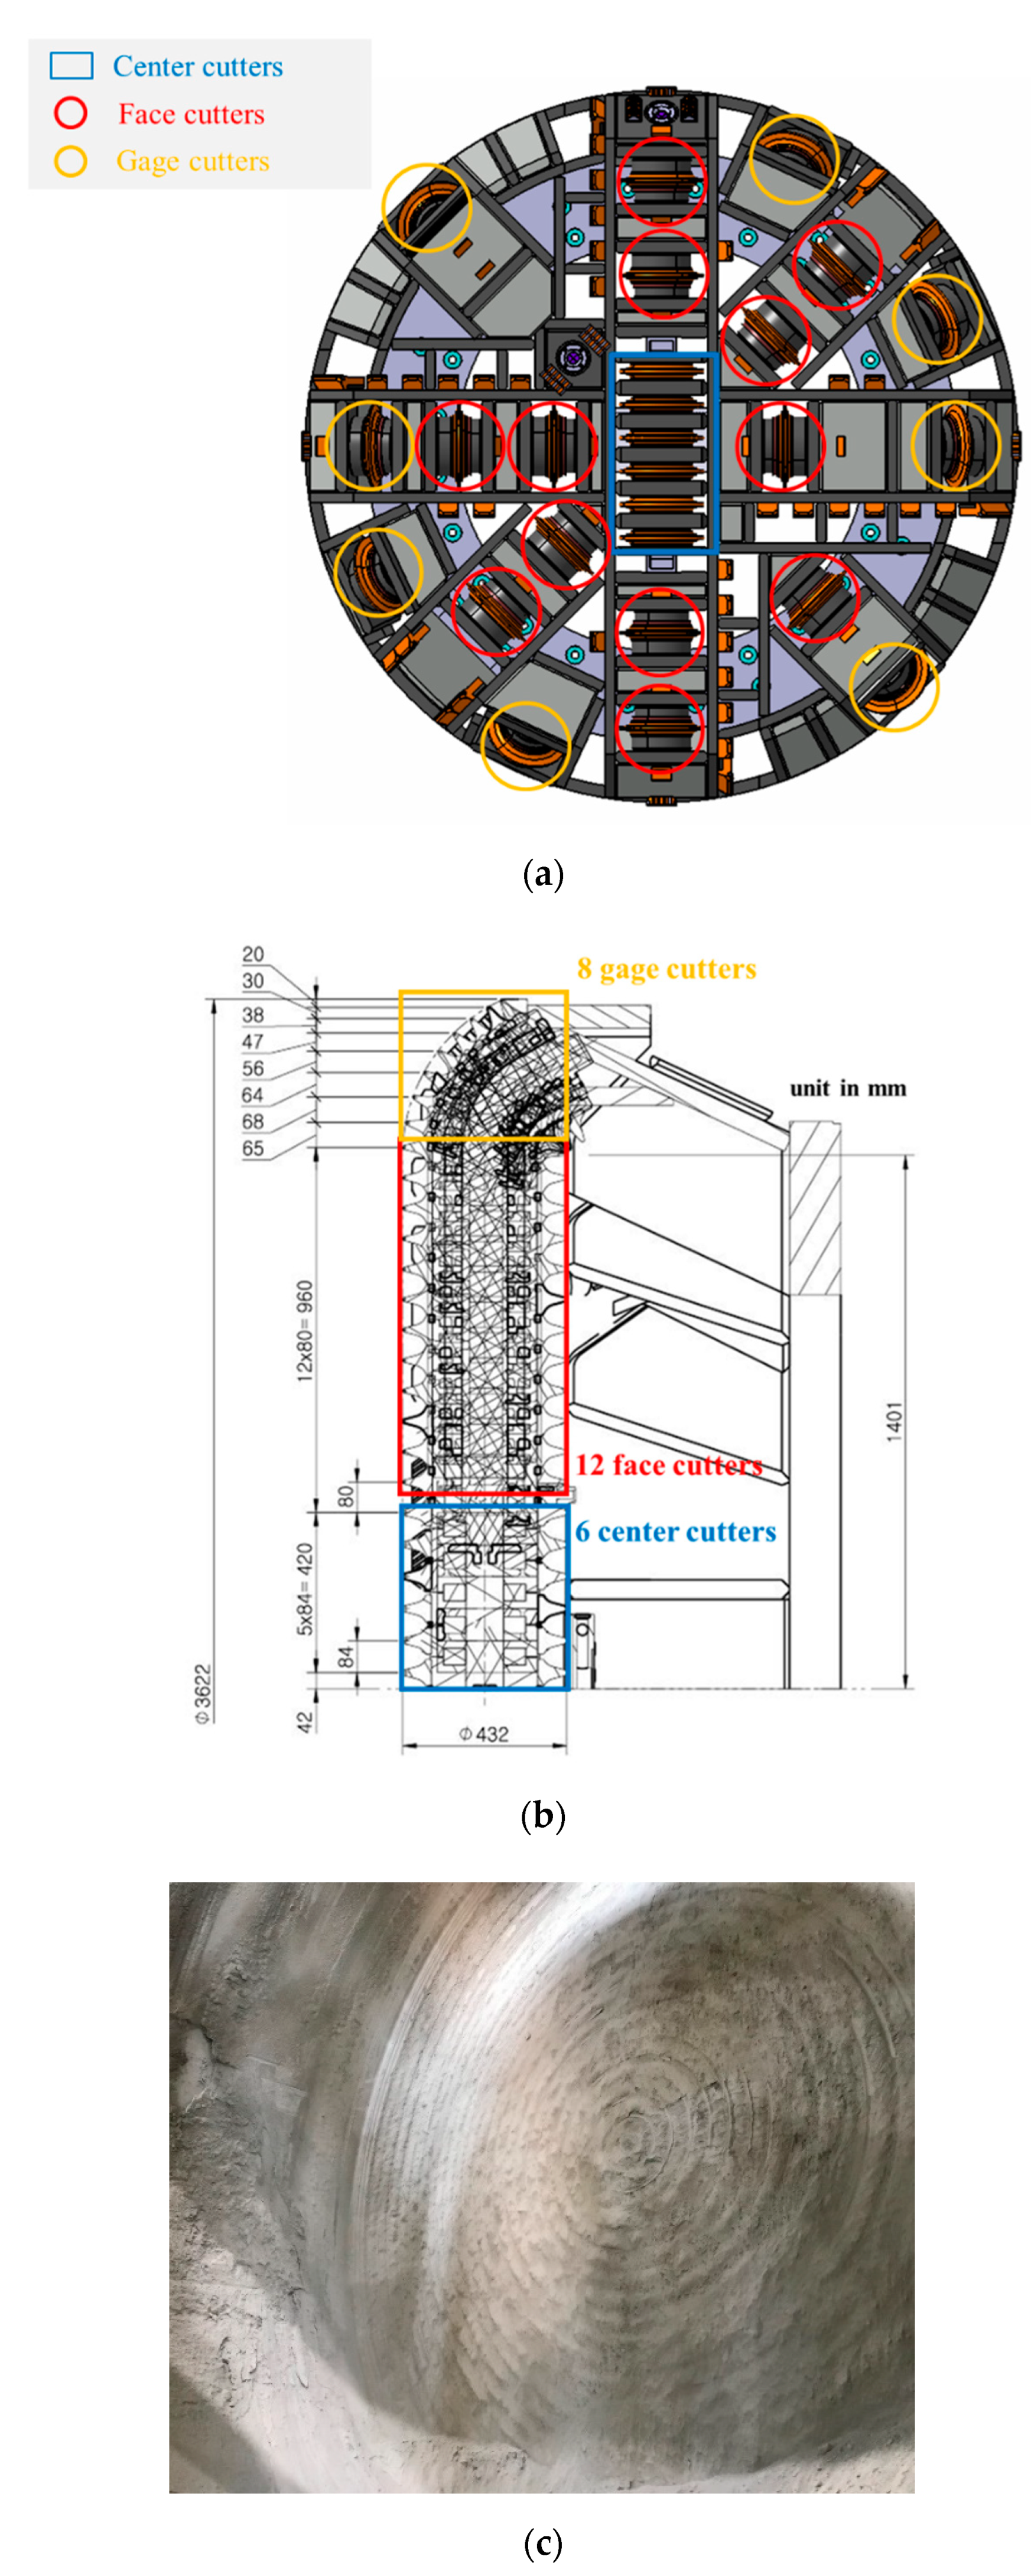
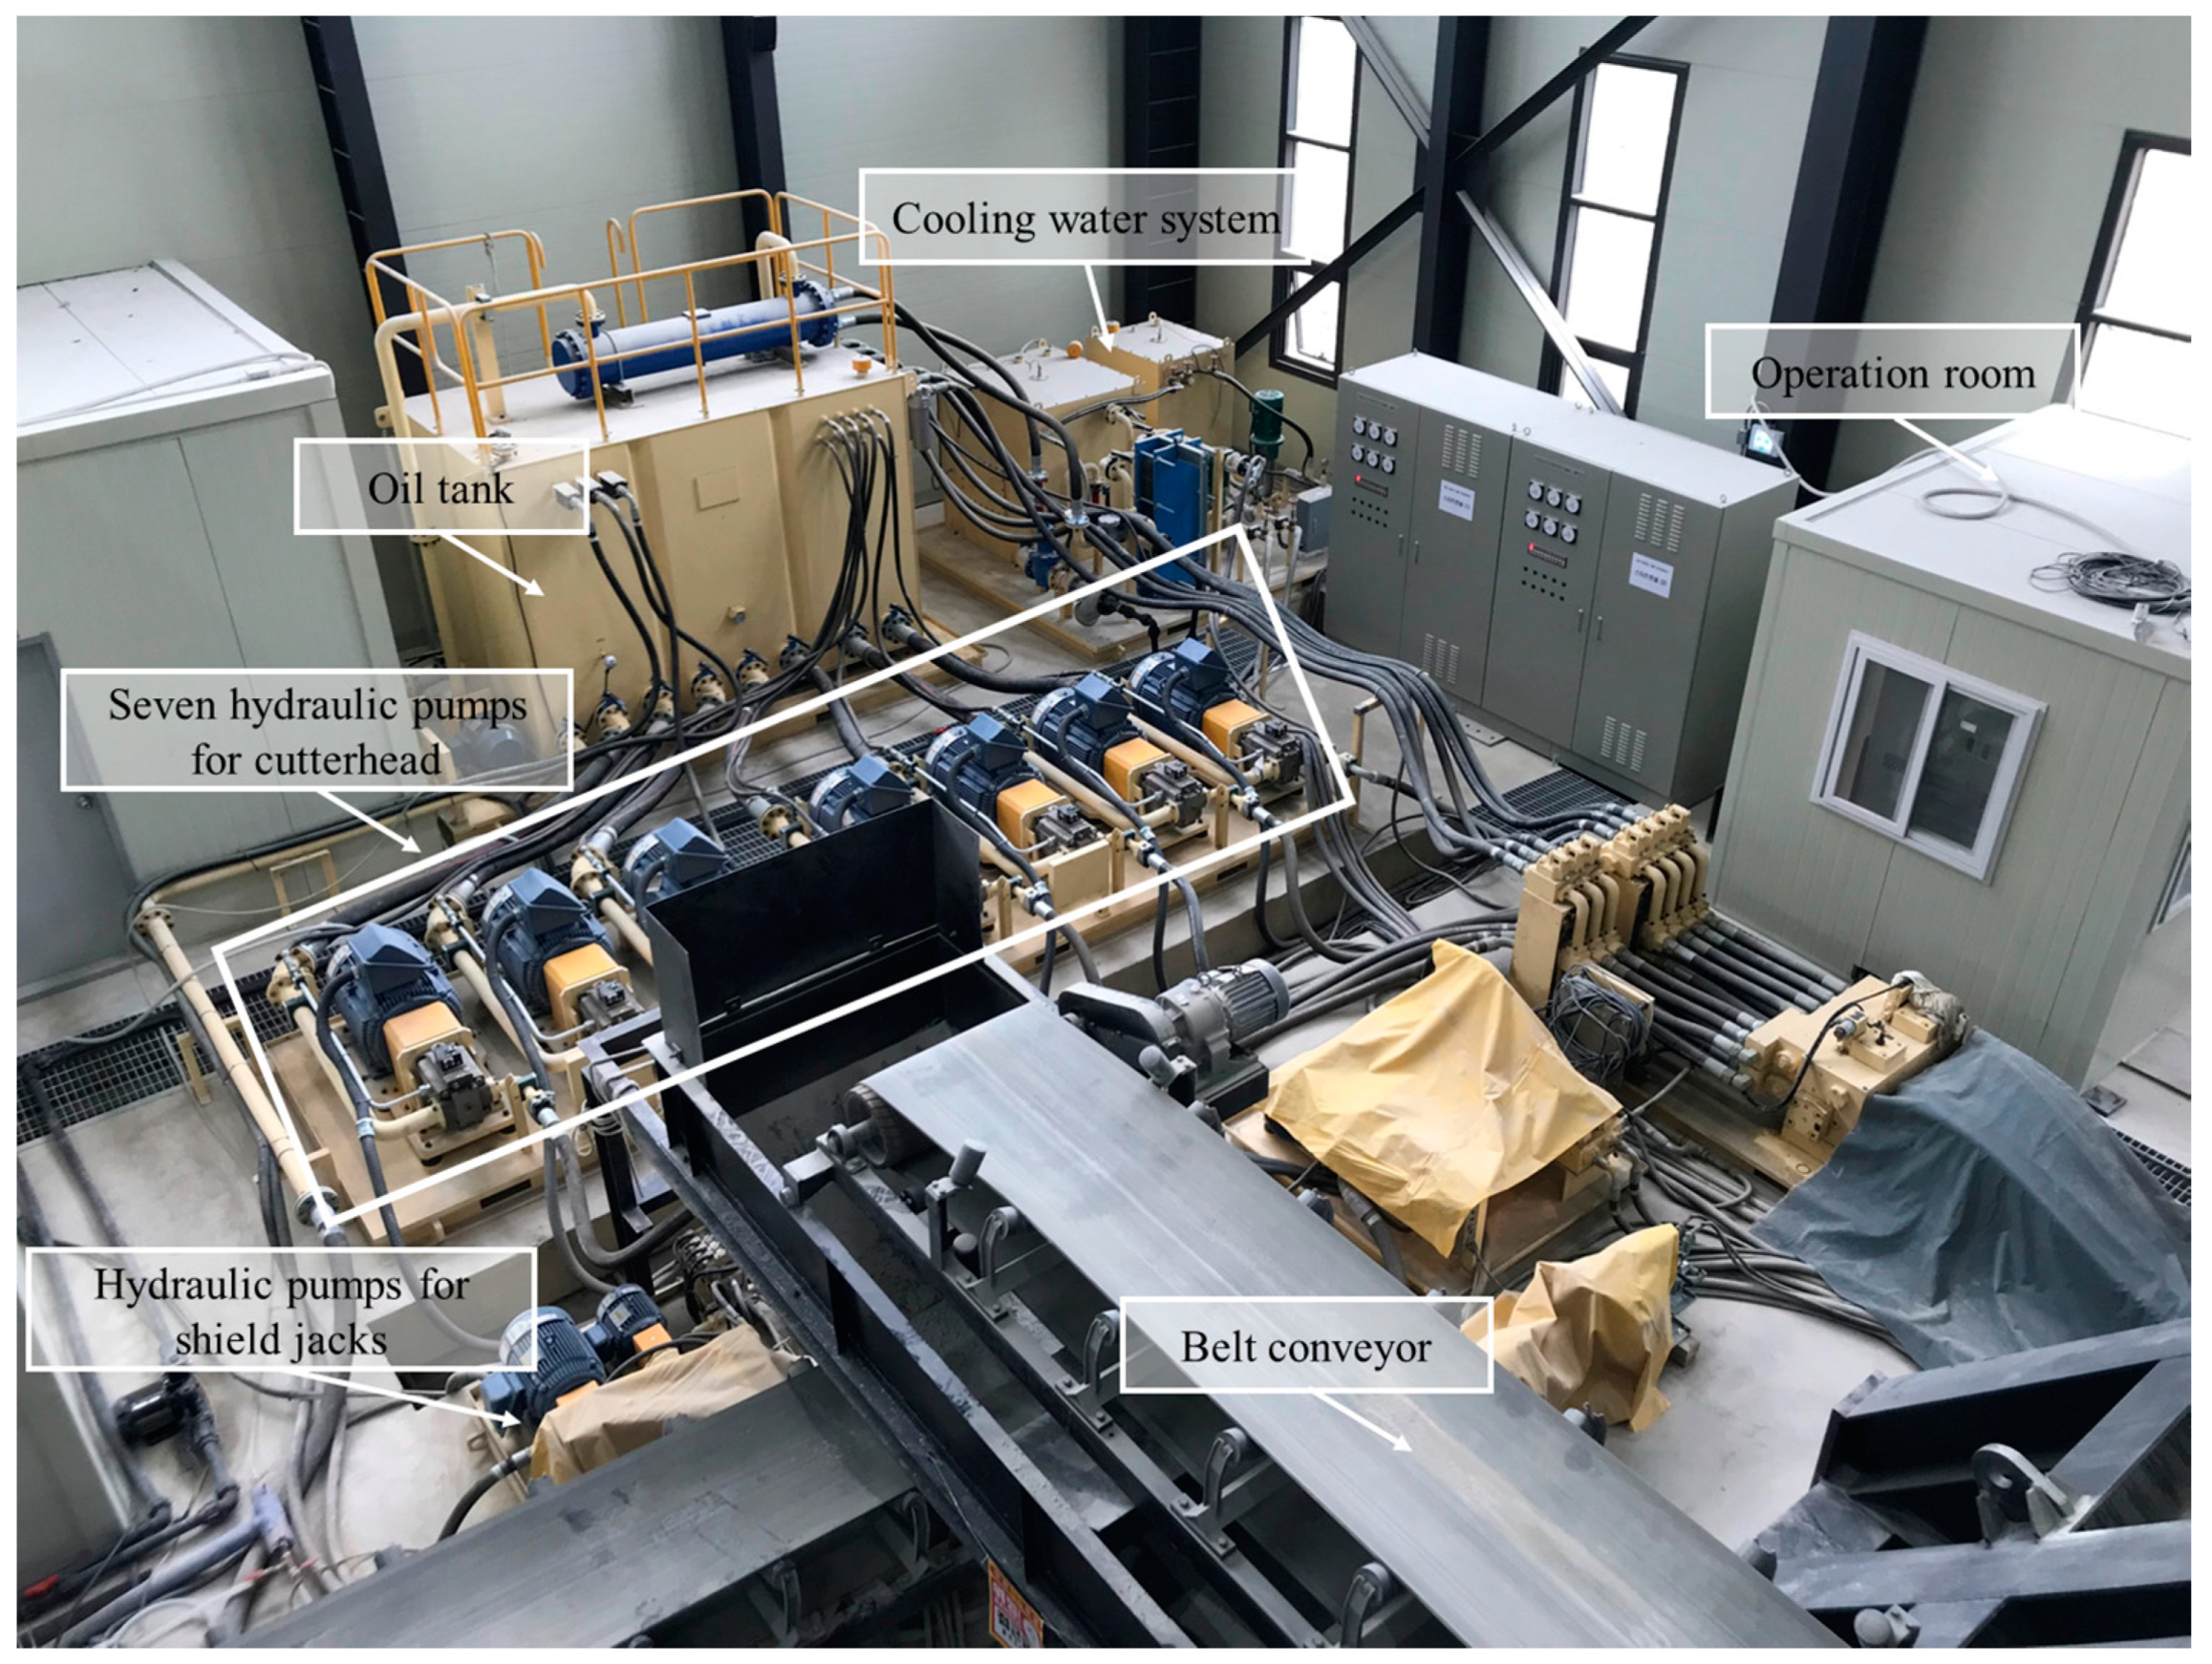
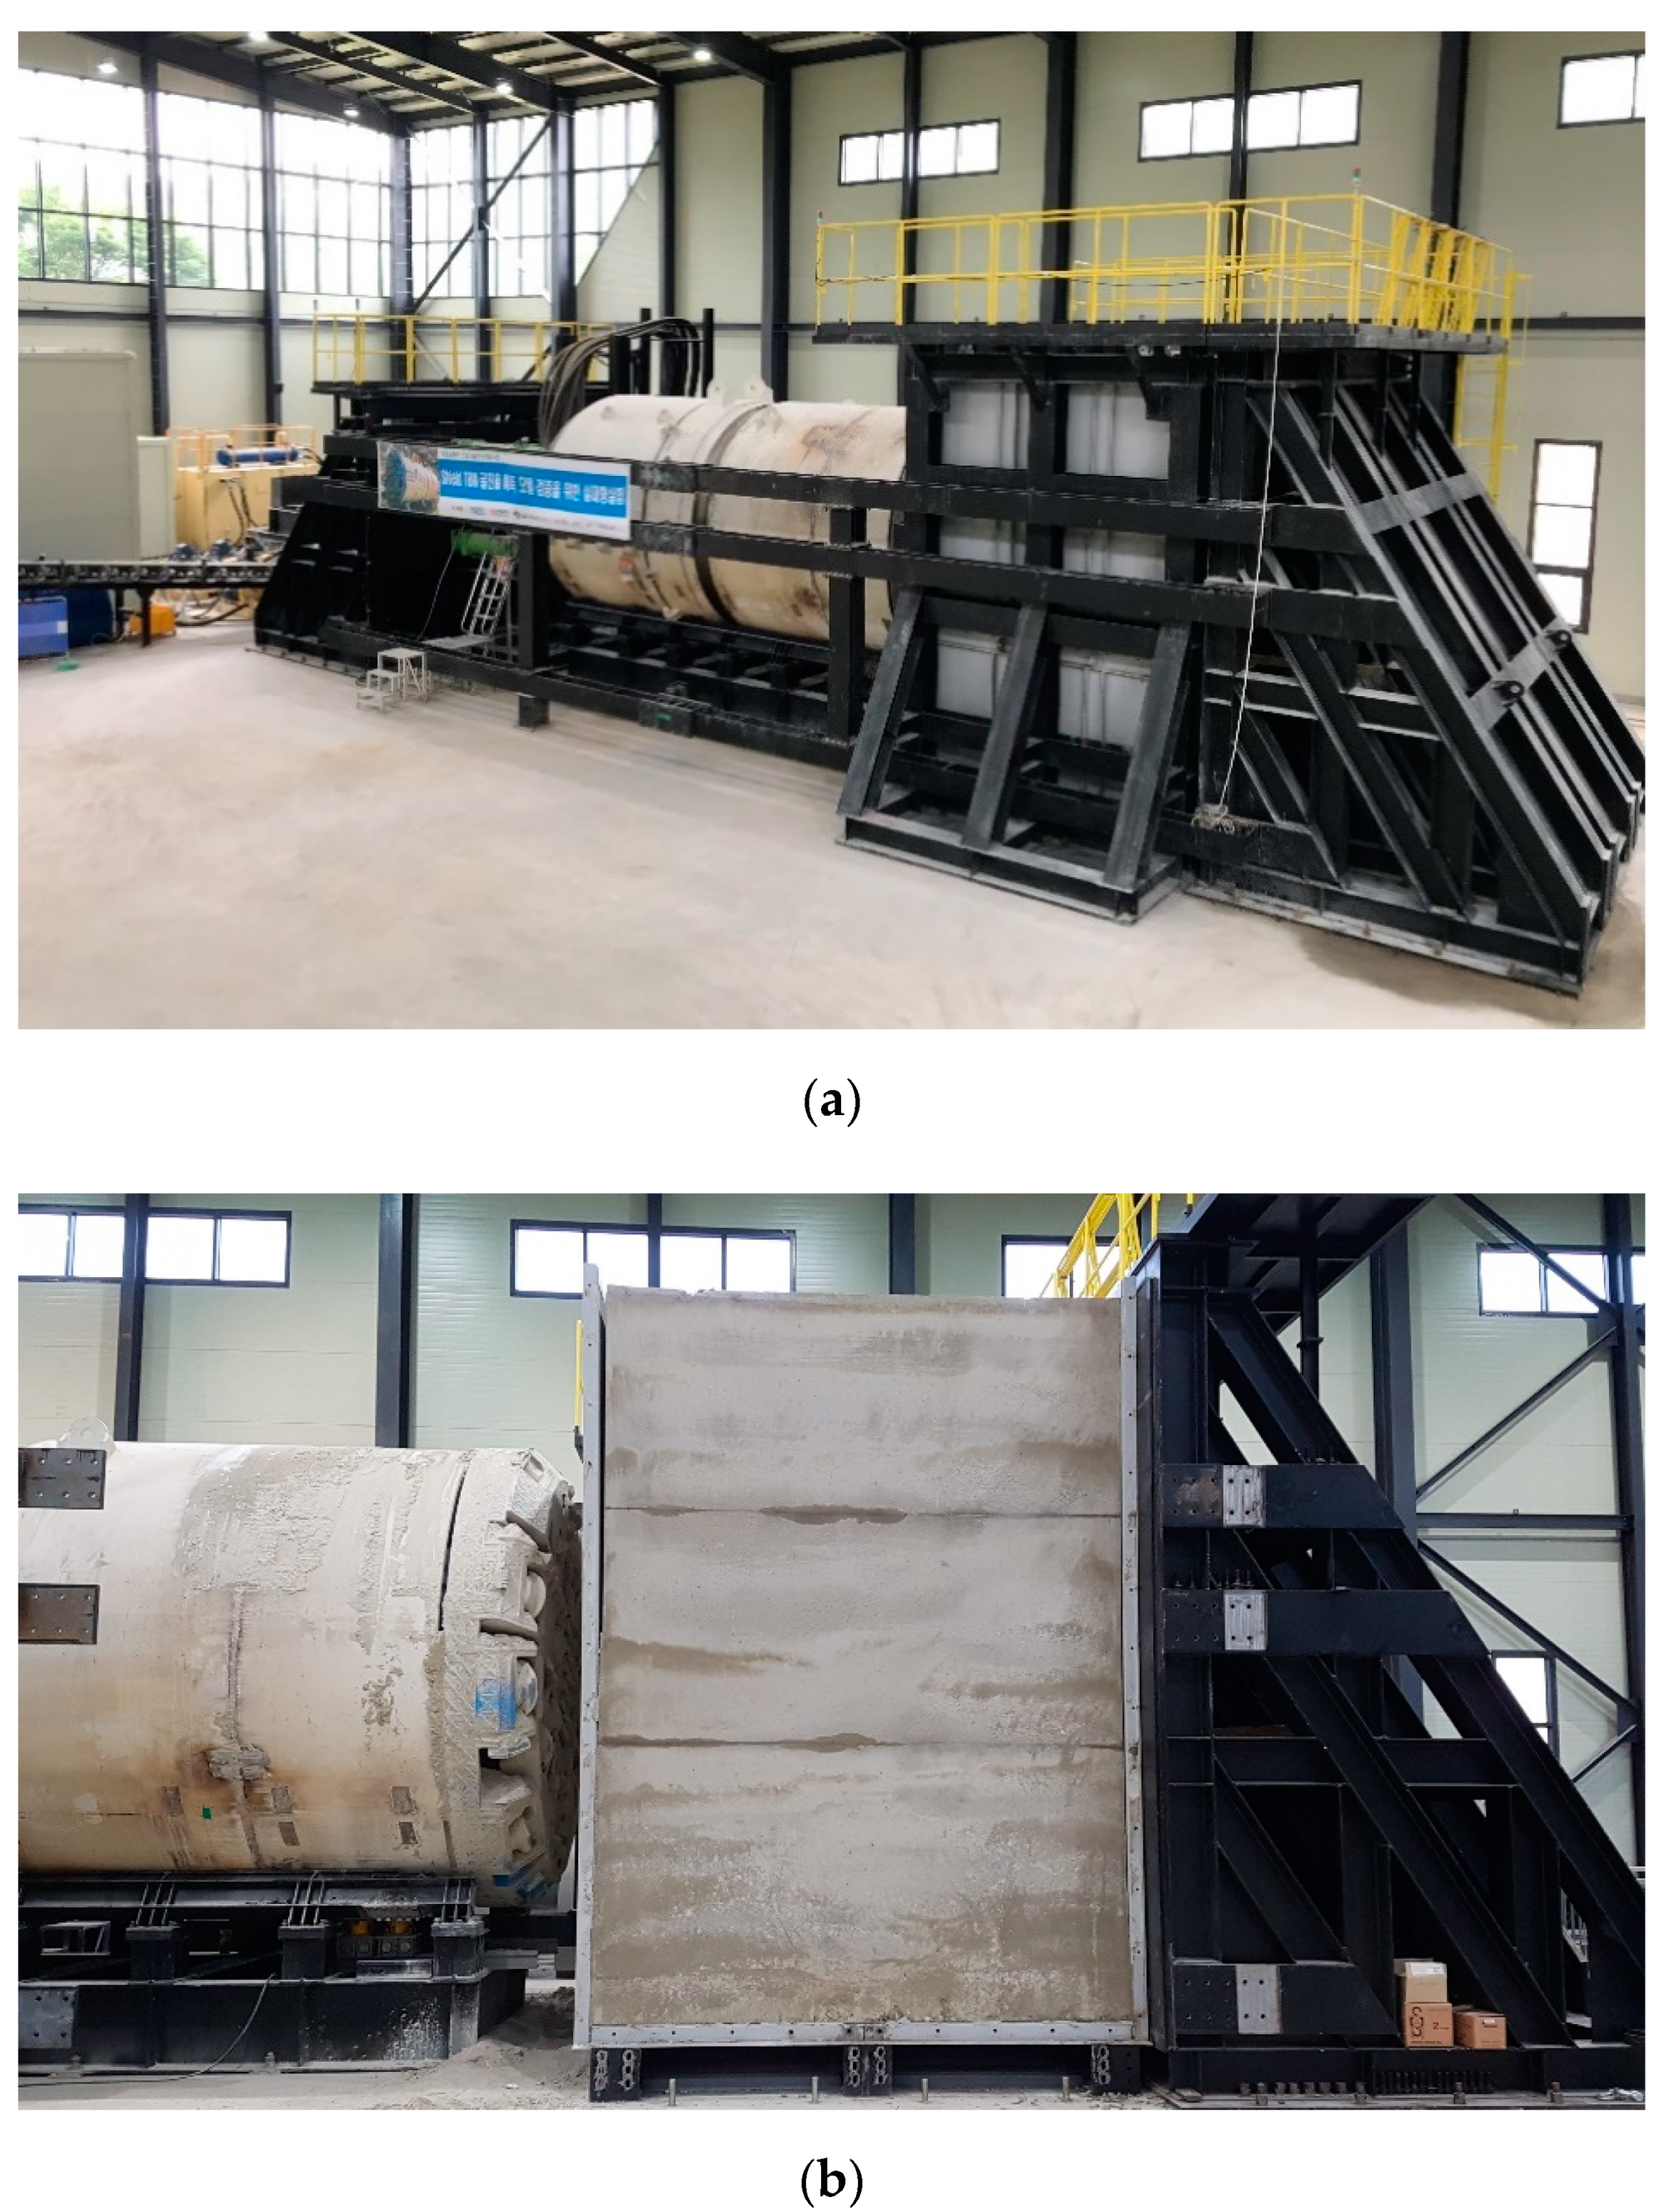
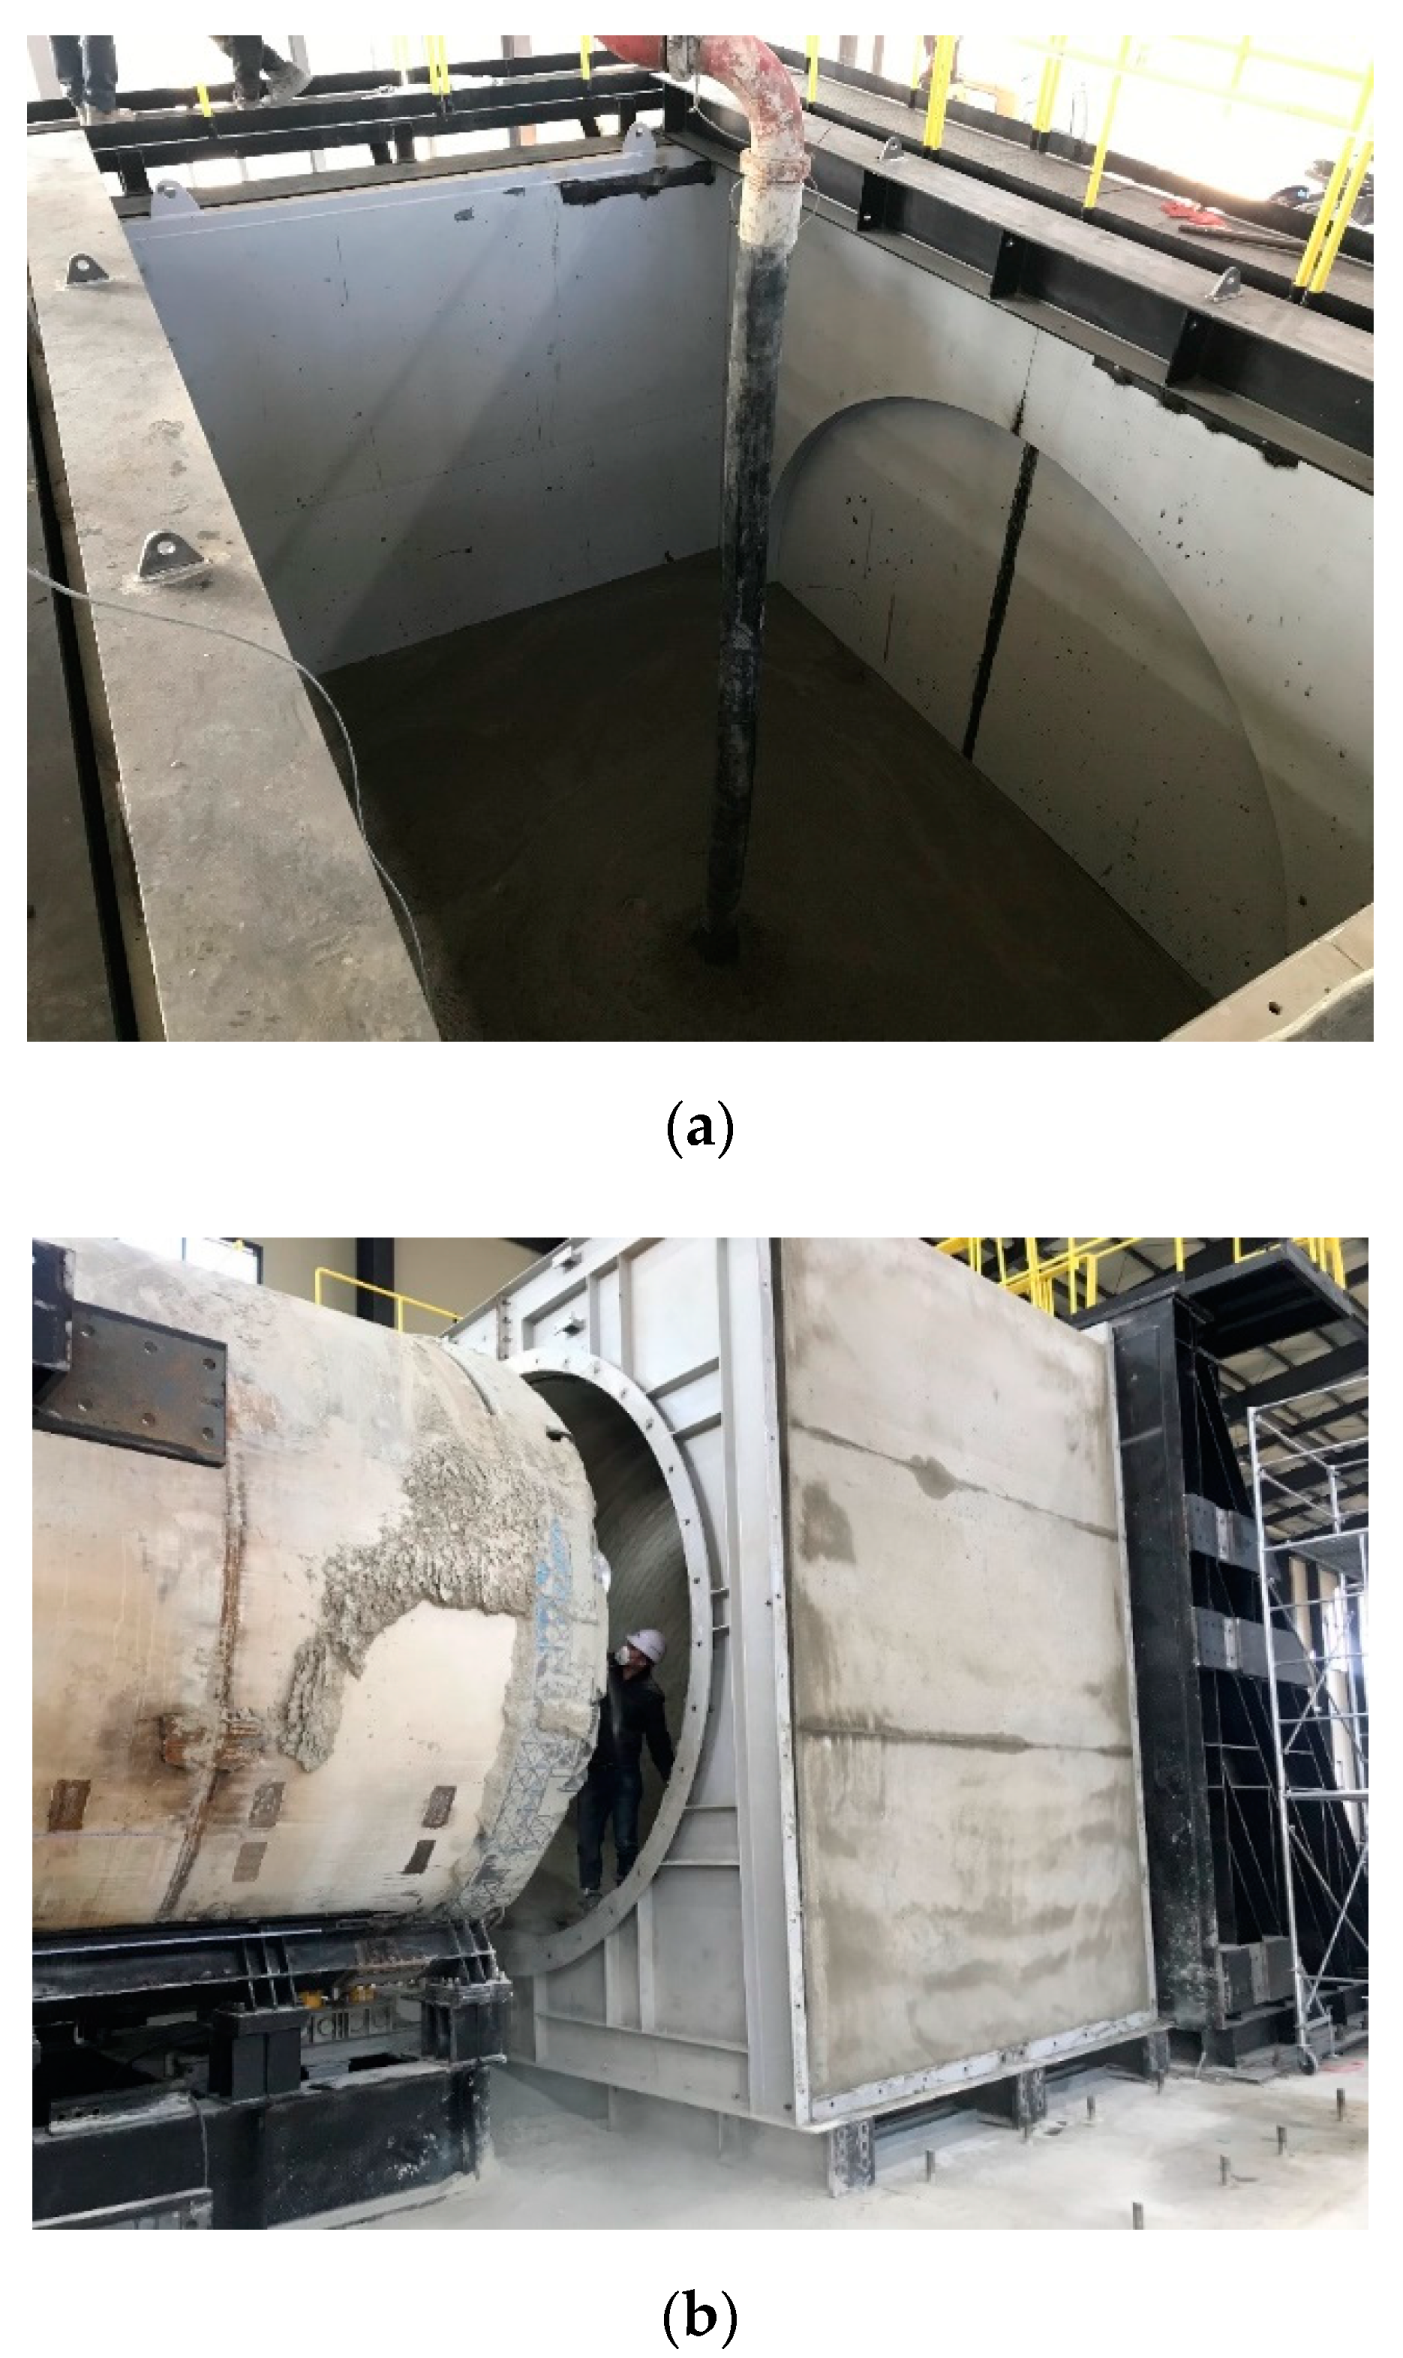
2.1. Test Facility

For this study, an earth pressure balance (EPB) shield TBM was manufactured and a facility was established for performing the full-scale tunneling tests, as shown in Figure 1. A shield TBM having a 3560 mm diameter cutterhead was designed to achieve an excavation of 3622 mm diameter in the artificial rock mass. A rock box with dimensions of 5 m height, 5 m width, and 3.5 m length was prepared, as shown in Figure 1b, for developing artificial rock mass without joints having 87.5 m3 volume. Accordingly, the maximum advance length in all of the test cases was kept to be less than 3.5 m. The driving force induced by an excavation through shield TBM was expected to reach a maximum value of 8000 kN. In order to withstand the expected driving force, structures consisting of H-beams and underground anchors were installed inside the test facility. Additionally, a screw conveyor and belt conveyor were also designed to efficiently remove the muck (rock chips) during the operation. While monitoring the pressure on the tunnel face, a mucking system was effectively operated in order to mitigate the effects of face pressure on test results.

2.2. Development of Earth Pressure Balance (EPB) Shield TBM

The KEPCO Research Institute and EMK companies manufactured the 3540 mm diameter EPB shield TBM machine comprising five hydraulic motors and seven hydraulic pumps which had the capacity to supply 630 kW power to the machine. Specifications of the developed TBM are provided in Table 1.
Cutterhead was manufactured by hard facing welding and the gage cutters in cutterhead were designed for properly achieving a steep curved sectional excavation up to R30 m. A 3622 mm diameter of cutting was achieved by the 3560 mm diameter cutterhead which was designed so that the 3000 mm diameter of segmental linings could possibly be installed afterwards. The disc cutters provided in the cutterhead were divided into six center cutters, 12 face cutters, and eight gage cutters as shown in Figure 2a. The spacing among different kinds of disc cutters provided in the cutterhead was, accordingly, designed as shown in Figure 2b. The tunnel face was excavated in accordance with the cutterhead design, as shown in Figure 2c. An assembly of scrappers as well as 26 pieces of 17 in. diameter disc cutters with average spacing of 68.5 mm between them was used to design the cutterhead. A constant spacing was provided among the individual center and face cutters. The spacing among the gage cutters was designed to be decreasing towards the periphery of the cutterhead ranging from the maximum spacing of 65 mm to a minimum spacing 20 mm spacing between gage cutters. The outer gage disc cutters were designed at a 25-degree angle from the vertical axis because the gage cutters are responsible for overcutting in order to achieve a smooth excavation and also to prevent jamming in the periphery of the cutterhead. The scrappers were provided in the cutterhead for achieving a flat tunnel face during excavation. They also facilitate in the collection of chips and debris into the chamber.
As mentioned previously, the cutterhead driving was achieved by a set of five hydraulic motors and seven hydraulic pumps which had the capacity of supplying 630 kW power to the machine. The assembly of hydraulic pumps, oil units and various components related to the machine is illustrated in Figure 3. The cutterhead could reach a maximum rotational speed of 10.5 RPM for a developed torque of up to 450 kN·m, and it could rotate up to 3 RPM at a maximum torque of 1309 kN·m. As shown in Figure 4, the cutterhead drive capacity can be expressed by the relationships between torque and rotational speed of the cutterhead, therefore, a single hydraulic pump was designed to rotate the cutterhead at maximum 1.5 RPM which could develop 25.82 kN·m of torque. So, by utilizing seven hydraulic pumps, the rotational speed of 10.5 RPM can develop 1309 kN·m torque by using 320 bar of oil pressure from the pumps. Figure 4 shows an example of the experimental results at different operational parameters within the cuttherhead drive capacity. The cutterhead drive capacity is a good tool for presenting the operational conditions of the TBM based on the relationships between torque and cutterhead rotational speed. For the purpose of developing a maximum of 12,000 kN thrust force, 12 shield jacks were designed whose length could be extended up to 1750 mm. In order to make the TBM machine continuously excavate the artificial rock mass, a subjack was also installed on the structure behind the machine for controlling the effect of the limited extension of shield jacks. Furthermore, steel segmental linings were used as a reaction wall which was being pushed backwards by the TBM machine to advance forward. In order to achieve constant pitching of machine, the movements of articulation jacks were also limited during the excavation. Even though there was no rock mass surrounding the periphery of TBM, but the provision of a transverse support for preventing the TBM derailment from the H-beam support controlled the rolling problem during TBM drive. The dispersion of 4000 kN and 5000 kN data points in Figure 4 is due to the instant change in oil pressure from the pumps which was needed to operate the machine at higher rotational speeds (specially at 6.0 and 7.5 RPM).

2.3. Artificial Rock Mass

Full-scale tests were performed through the preparation of artificial rock mass using concrete and mortar due to the problems of size, handling, and expenses in using the real rock mass block having a volume of 87.5 m3. A total of four tests cases were planned according to the UCS values of rock mass as shown in Table 2. These tests were carried out in the artificial rock mass having UCS ranging from 20 MPa to 100 MPa. Achieving 50 MPa strength of artificial rock mass in Test# 2 was planned in order to analyze the material characteristics of artificial rock mass affected by the performance of TBM using different materials, but it was deduced that there was no special difference between using concrete or mortar on the results. So, all the 50 MPa case results using concrete and mortar were combined afterwards for analysis. The measured UCS values after testing were slightly different than those planned for each case. Hence, all the four UCS cases can be summarized in the form of planned and measured values; (Test# 1) 20 MPa (measured 27 MPa) using mortar, (Test# 2) 50 MPa (measured average 57 MPa) using concrete and mortar, (Test# 3) 70 MPa (measured 70 MPa) using concrete, and (Test# 4) 100 MPa (measured 99 MPa) using mortar.
Artificial rock mass was designed using Portland cement by controlling the cement-water ratio as well as the percentage of fine aggregates and admixture. Quality of the rock mass was ensured by conducting the strength tests after 28 days of curing as well as through sampling from the rock mass after tests. A rock box made by steel structure with dimensions of 5 m height, 5 m width, and 3.5 m length was prepared, as shown in Figure 5, for making an assembly of artificial rock mass without joints having 87.5 m3 volume. An important part of this study was the focus on analyzing the effect of rock mass UCS on the performance of TBM in homogeneous and intact rock condition without having any joints.

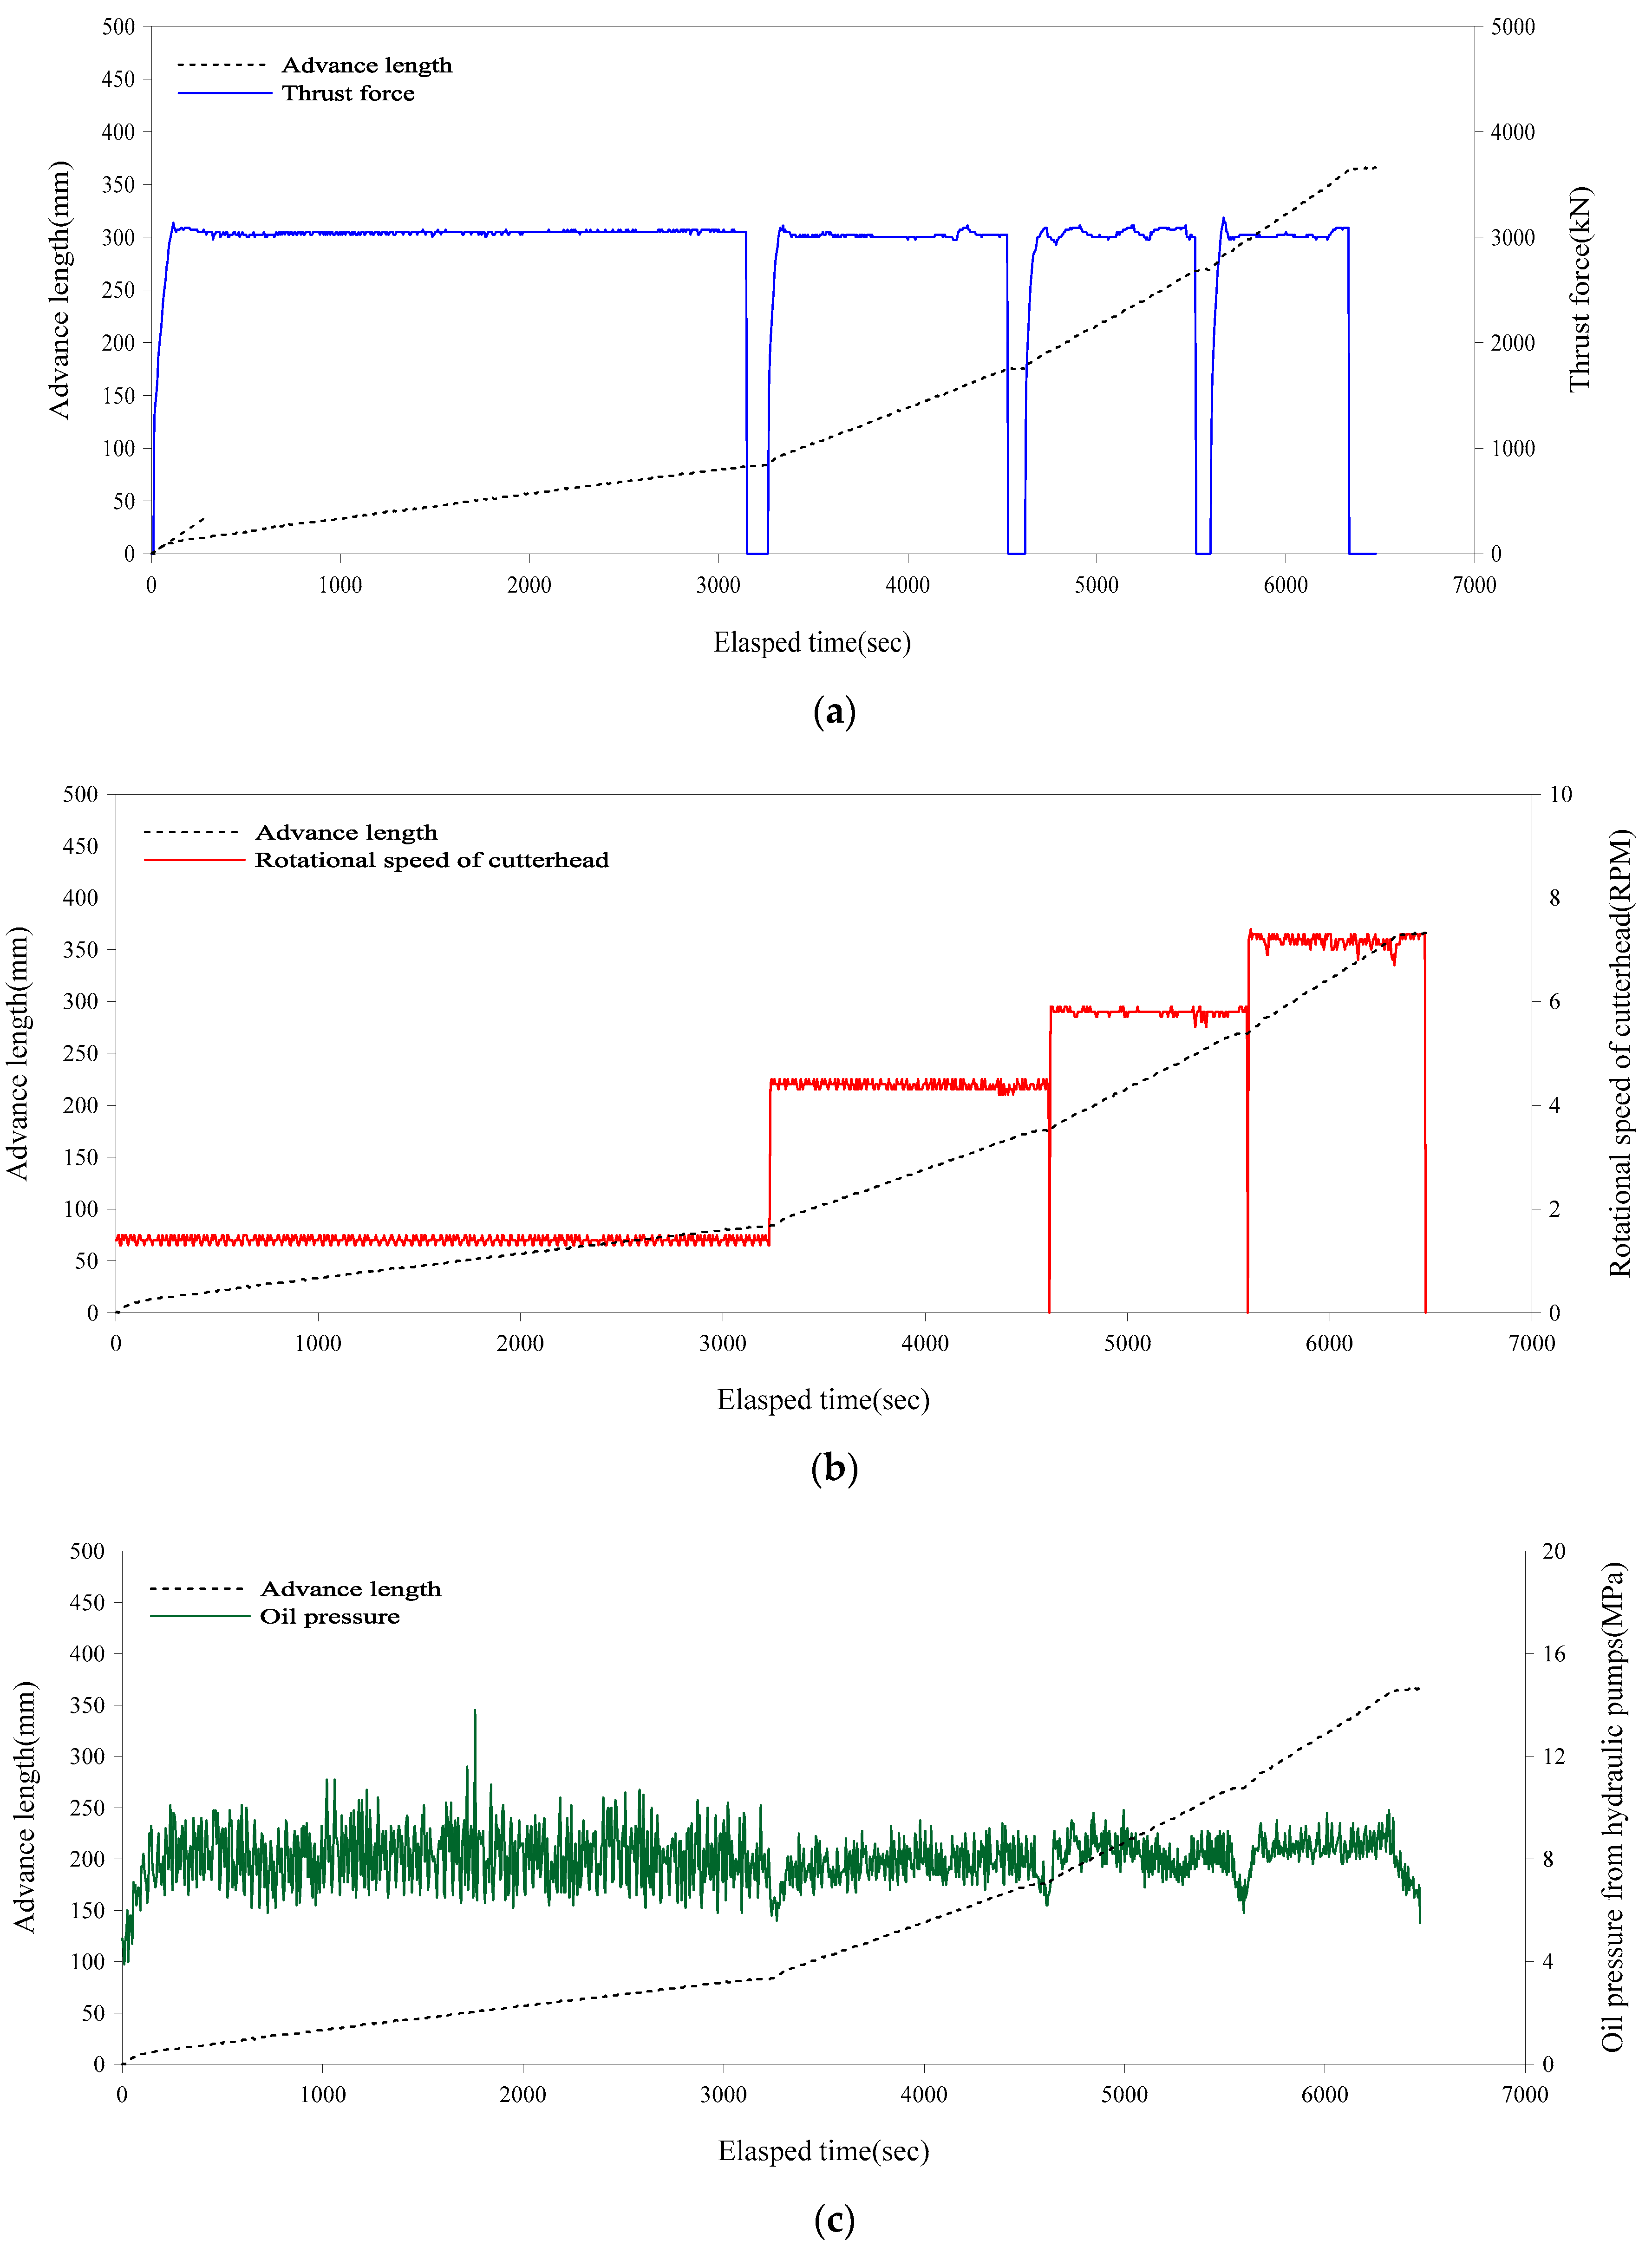
2.4. Stepwise Tunneling, Based on Operational Parameters of TBM

A variety of test cases were planned and executed by performing the TBM advance in around 80 cases achieved by the variation of four rock mass strength values and 20 TBM operational parameters. Thrust force and rotational speed of the cutterhead were selected as the main TBM operational parameters in this study. For each UCS case, extensive results were obtained by operating the shield TBM at five thrust force levels of 1000 kN, 2000 kN, 3000 kN, 4000 kN, and 5000 kN generated by the machine, as well as at four different cutterhead rotational speeds of 1.5 RPM, 4.5 RPM, 6.0 RPM, and 7.5 RPM. The TBM driving was performed stepwise so that 20 sets of operational conditions given in Table 3 could be developed. However, the application of operational parameters altogether sometimes presented certain limitations in specific situations such as the partial cutterhead drive capacity at low UCS of rock mass (due to higher torque development, as explained in Section 3.2) as well as the TBM rolling problem operated at lower rotational speeds of the cutterhead. This can be further understood by considering Test# 1 as an example, where the application of 4000 kN or 5000 kN thrust force resulted in high penetration depth and caused the development of high torque value. Therefore, it can be deduced that the development of high rotational speed of the cutterhead could not be possible sometimes, within 630 kW of power. Stepwise driving refers to the conditions in which thrust force and RPM were kept constant in each test case. For example, the constant conditions of 2000 kN thrust force and 6.0 RPM were kept in operation in order to achieve the excavation within a range of 70 mm to 100 mm. The shield jacks were paused for a short time after each set of tests, and the specific RPM for the next set of the test was adjusted by changing the number of hydraulic pumps being used. In order to satisfactorily achieve the target RPM levels, the selection of number of hydraulic pumps being used was decided by trial and error method according to different UCS values.

2.5. Data Acquisition

Flexible steel wire sensors installed on the top, right, and left sides of the shield jacks were used to measure the advance length. In addition to that, one laser sensor was also installed nearby the machine whose function was not only to measure the advance length but also to compare it with the advance length measured by the wire sensors. Important machine data such as thrust force, rotational speed of cutterhead, cumulated revolutions, and oil pressures from hydraulic pumps for the estimation of torque was also recorded in the black book every five seconds. The advance length, thrust force, rotational speed of cutterhead, and oil pressure were profiled according to the elapsed time, as shown in Figure 6, and each profile was developed by keeping a constant thrust force of 3000 kN in Test# 4. The identical profiles of advance length measured from all the sensors helps in deducing that the pitching and articulation of jacks were controlled well.

3. Suggesting Rolling Force on a Single Disc Cutter for the Design of Cutterhead Drive

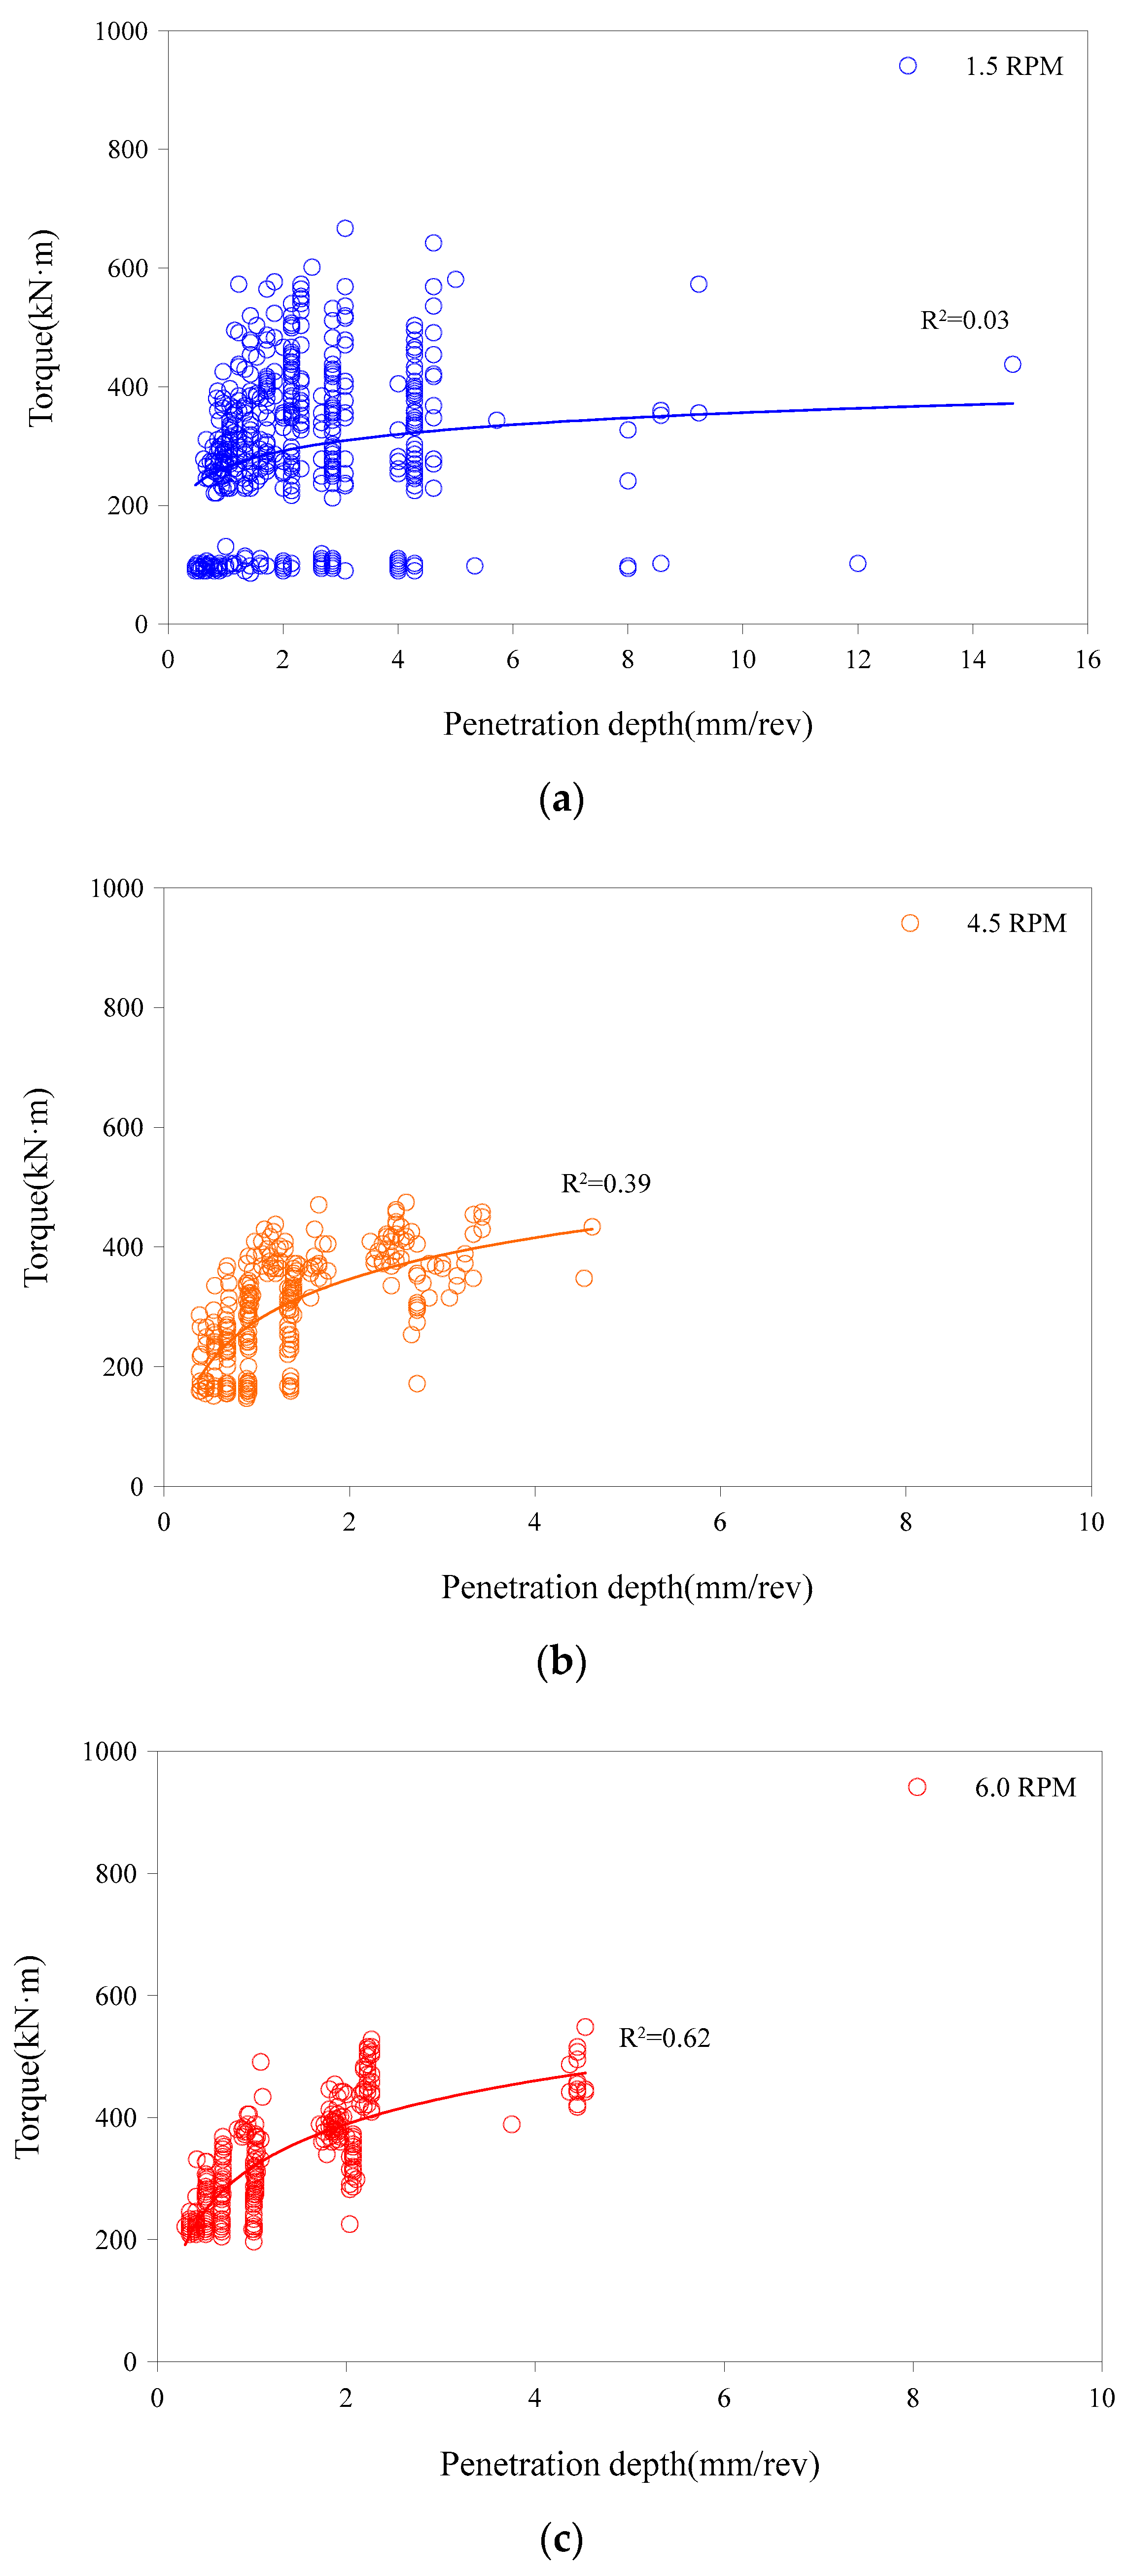
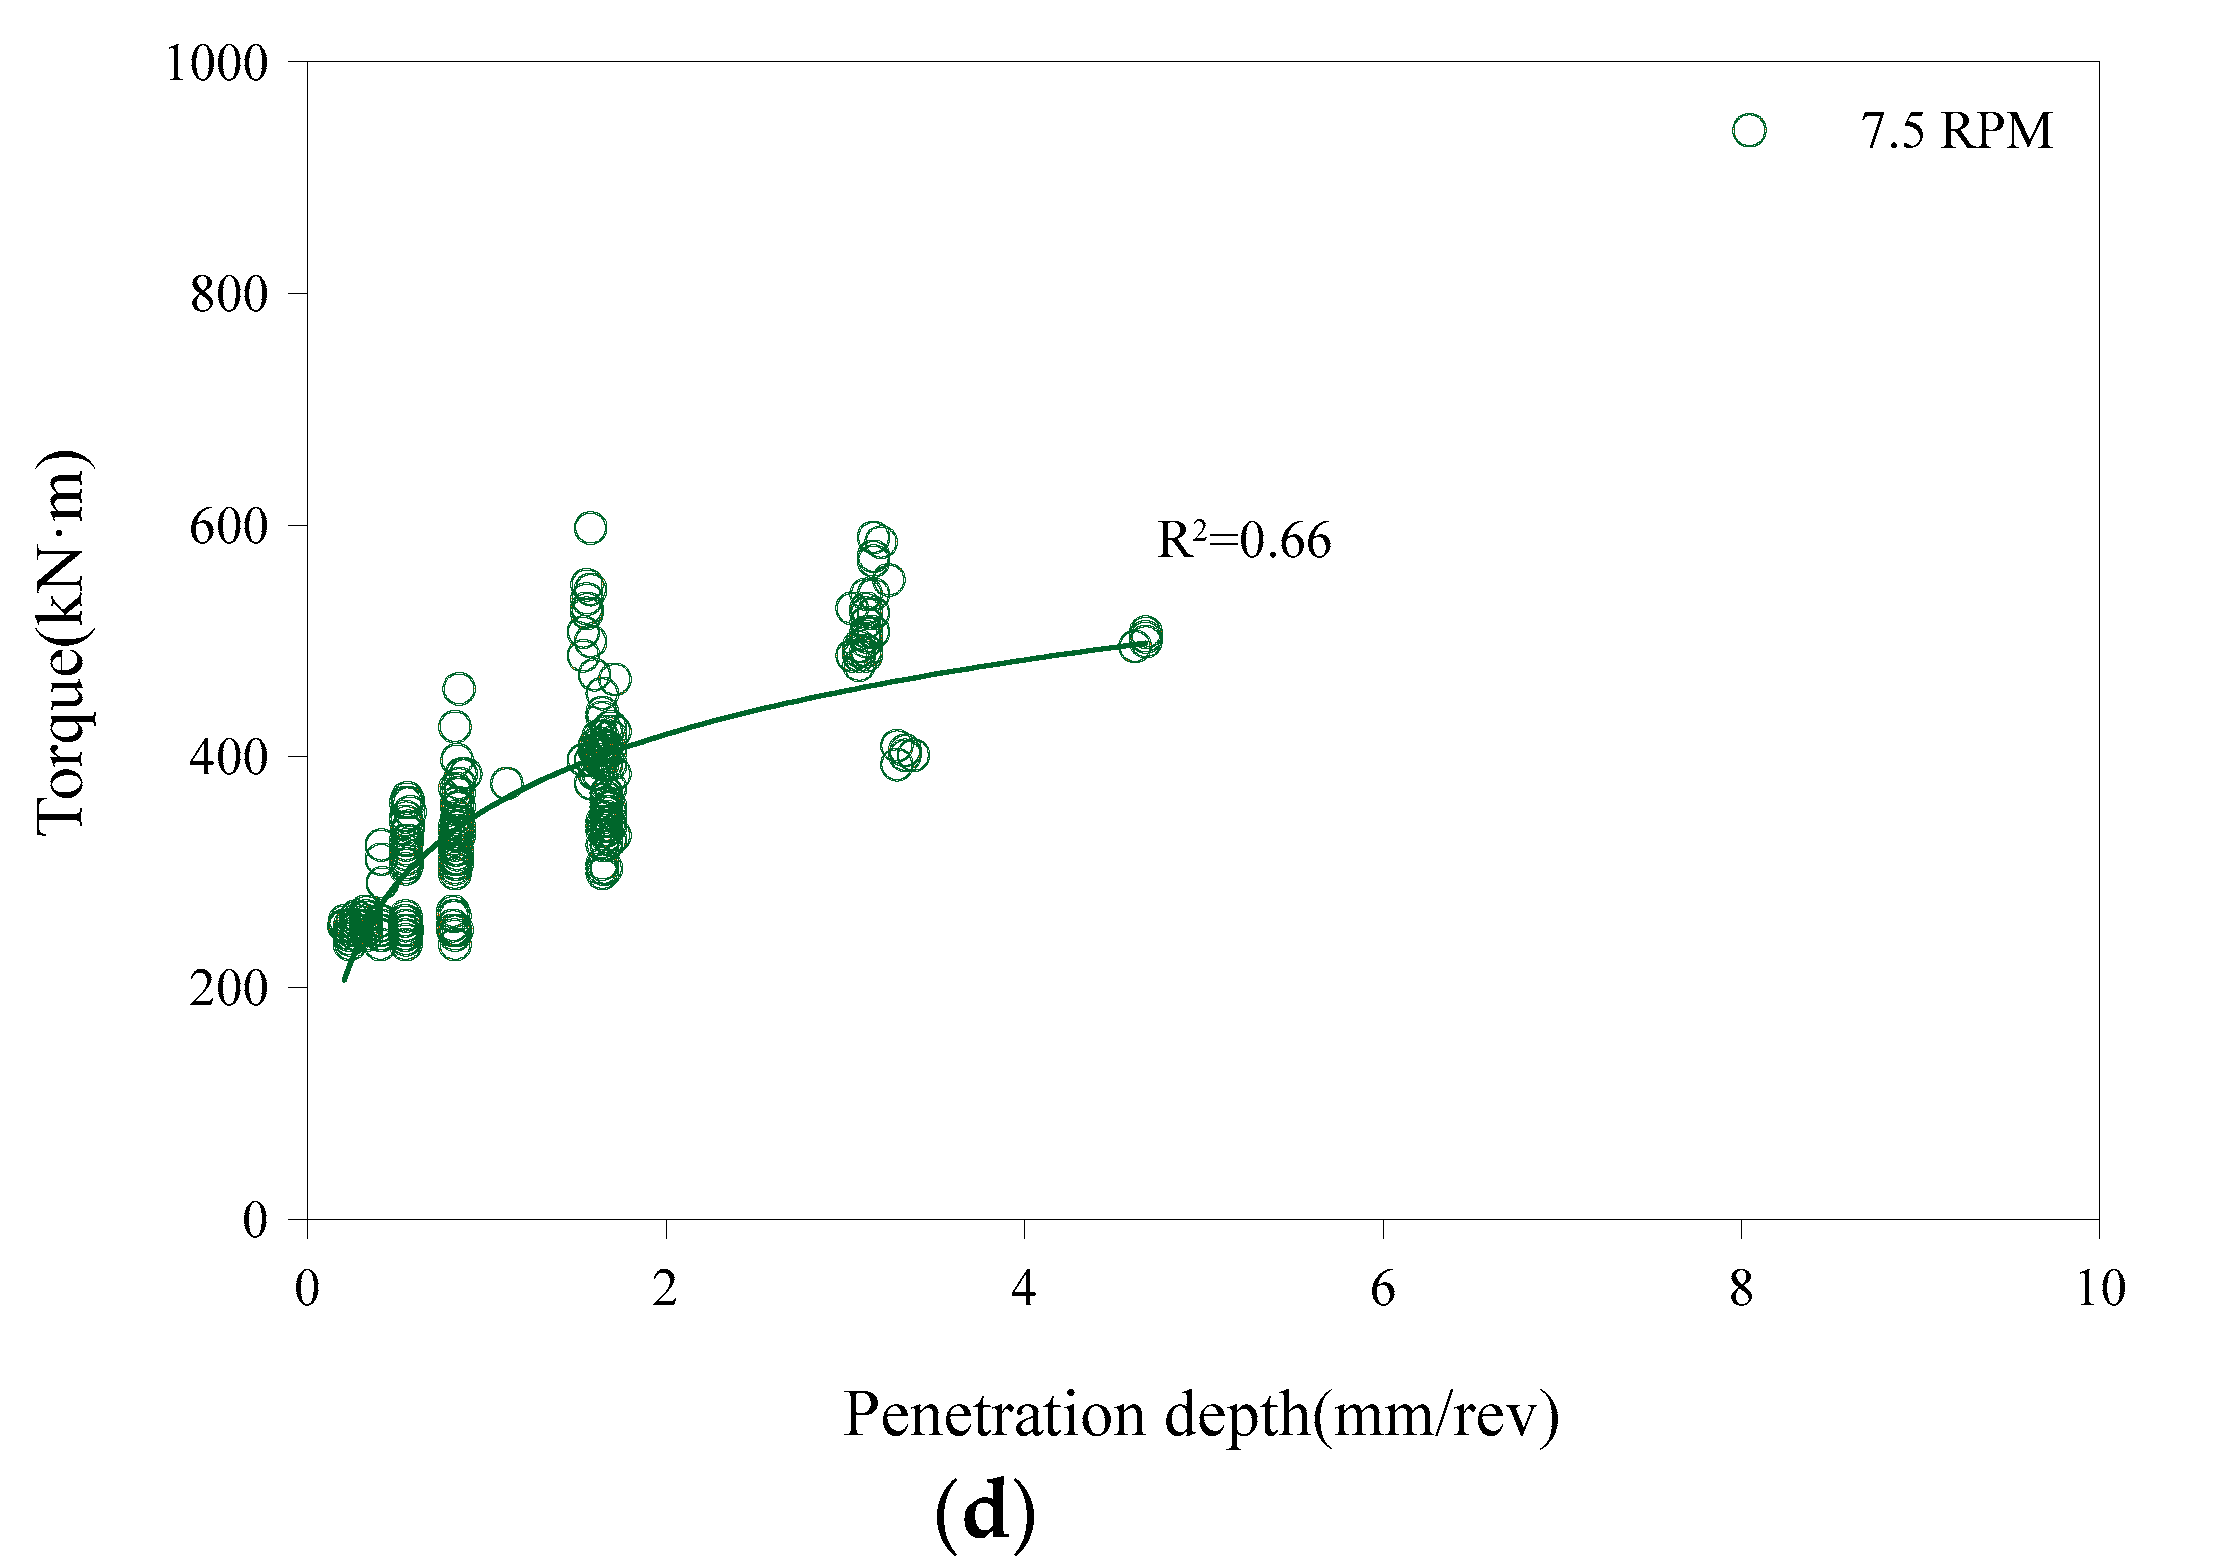
3.1. Analysis of Relationships between Penetration Depth and Torque

In TBM design, penetration depth was the most important design parameter and it was dependent on the interaction effect of rock mass properties and thrust force levels of TBM. Penetration depth is defined as that length of the disc cutter which penetrated into the rock mass or it can also be expressed by the excavation depth in the longitudinal direction during a single rotation of the cutterhead. Torque was one of representative results obtained by the variation in penetration depth when the cutterhead rotated. During the design stage, torque can be estimated by analyzing the effects of thrust force and penetration depth. The measurement of torque directly from the disc cutters is usually difficult, but it can be estimated using the oil pressure from the hydraulic pumps considering the design specification of the cutterhead drive. The main purpose of this study is to suggest the estimation of torque for its use in the design of cutterhead drive of shield TBM, therefore, the details of relationships between thrust force and penetration depth were not focused upon in this study. All the basic relationships were developed by considering the analysis of artificial rock mass having 100 MPa UCS (Test# 4) as the representative case. The relationships between the variation in torque values according to the increase in penetration depth were directly analyzed without showing the influence of thrust force effects, as shown in Figure 7. The analysis of these relationships were performed at four different rotational speed values of cutterhead drive; 1.5, 4.5, 6.0, and 7.5 RPM. In previous studies, various linear relationships between penetration depth and torque were established [13]. Also, when the increment in torque is decreased with the increase in penetration depth due to the reason that when the increase in excavation efficiency results in the thrust force exceeding the critical value, the occurrence of the development of chips was observed to be increasing [16]. According to the regression analysis of the data obtained in this study, the coefficient of determination of log functional relationships was found to have greater values as compared to those of the linear relationships. The R2 values were observed in the range of 0.03 and 0.66. Based on the relationships between these two parameters, similar regression lines for 4.5 RPM and above cases were derived accordingly. However, focusing on the results obtained at 1.5 RPM having the lowest R2 value, the degree of data scatter was observed to be the largest among all RPM cases due to two reasons. Firstly, the 90 kW of power used for the development of 1.5 RPM rotational speed of the cutterhead was small enough to overcome the developed penetration depth resulting in the development of large torque. The second reason of data scatter was that the sensors installed for the measurement of advance length had a minimum resolution of 1 mm which could not ensure continuous measurements at the lowest rotational speed. However, these relationships between penetration depth and torque could not be suggested in the design of cutterhead drive because penetration depth itself is a result of thrust force, so, the development of additional relationships between thrust force (analogous to normal force on single disc cutter) and torque is necessary for application in the design of cutterhead drive.

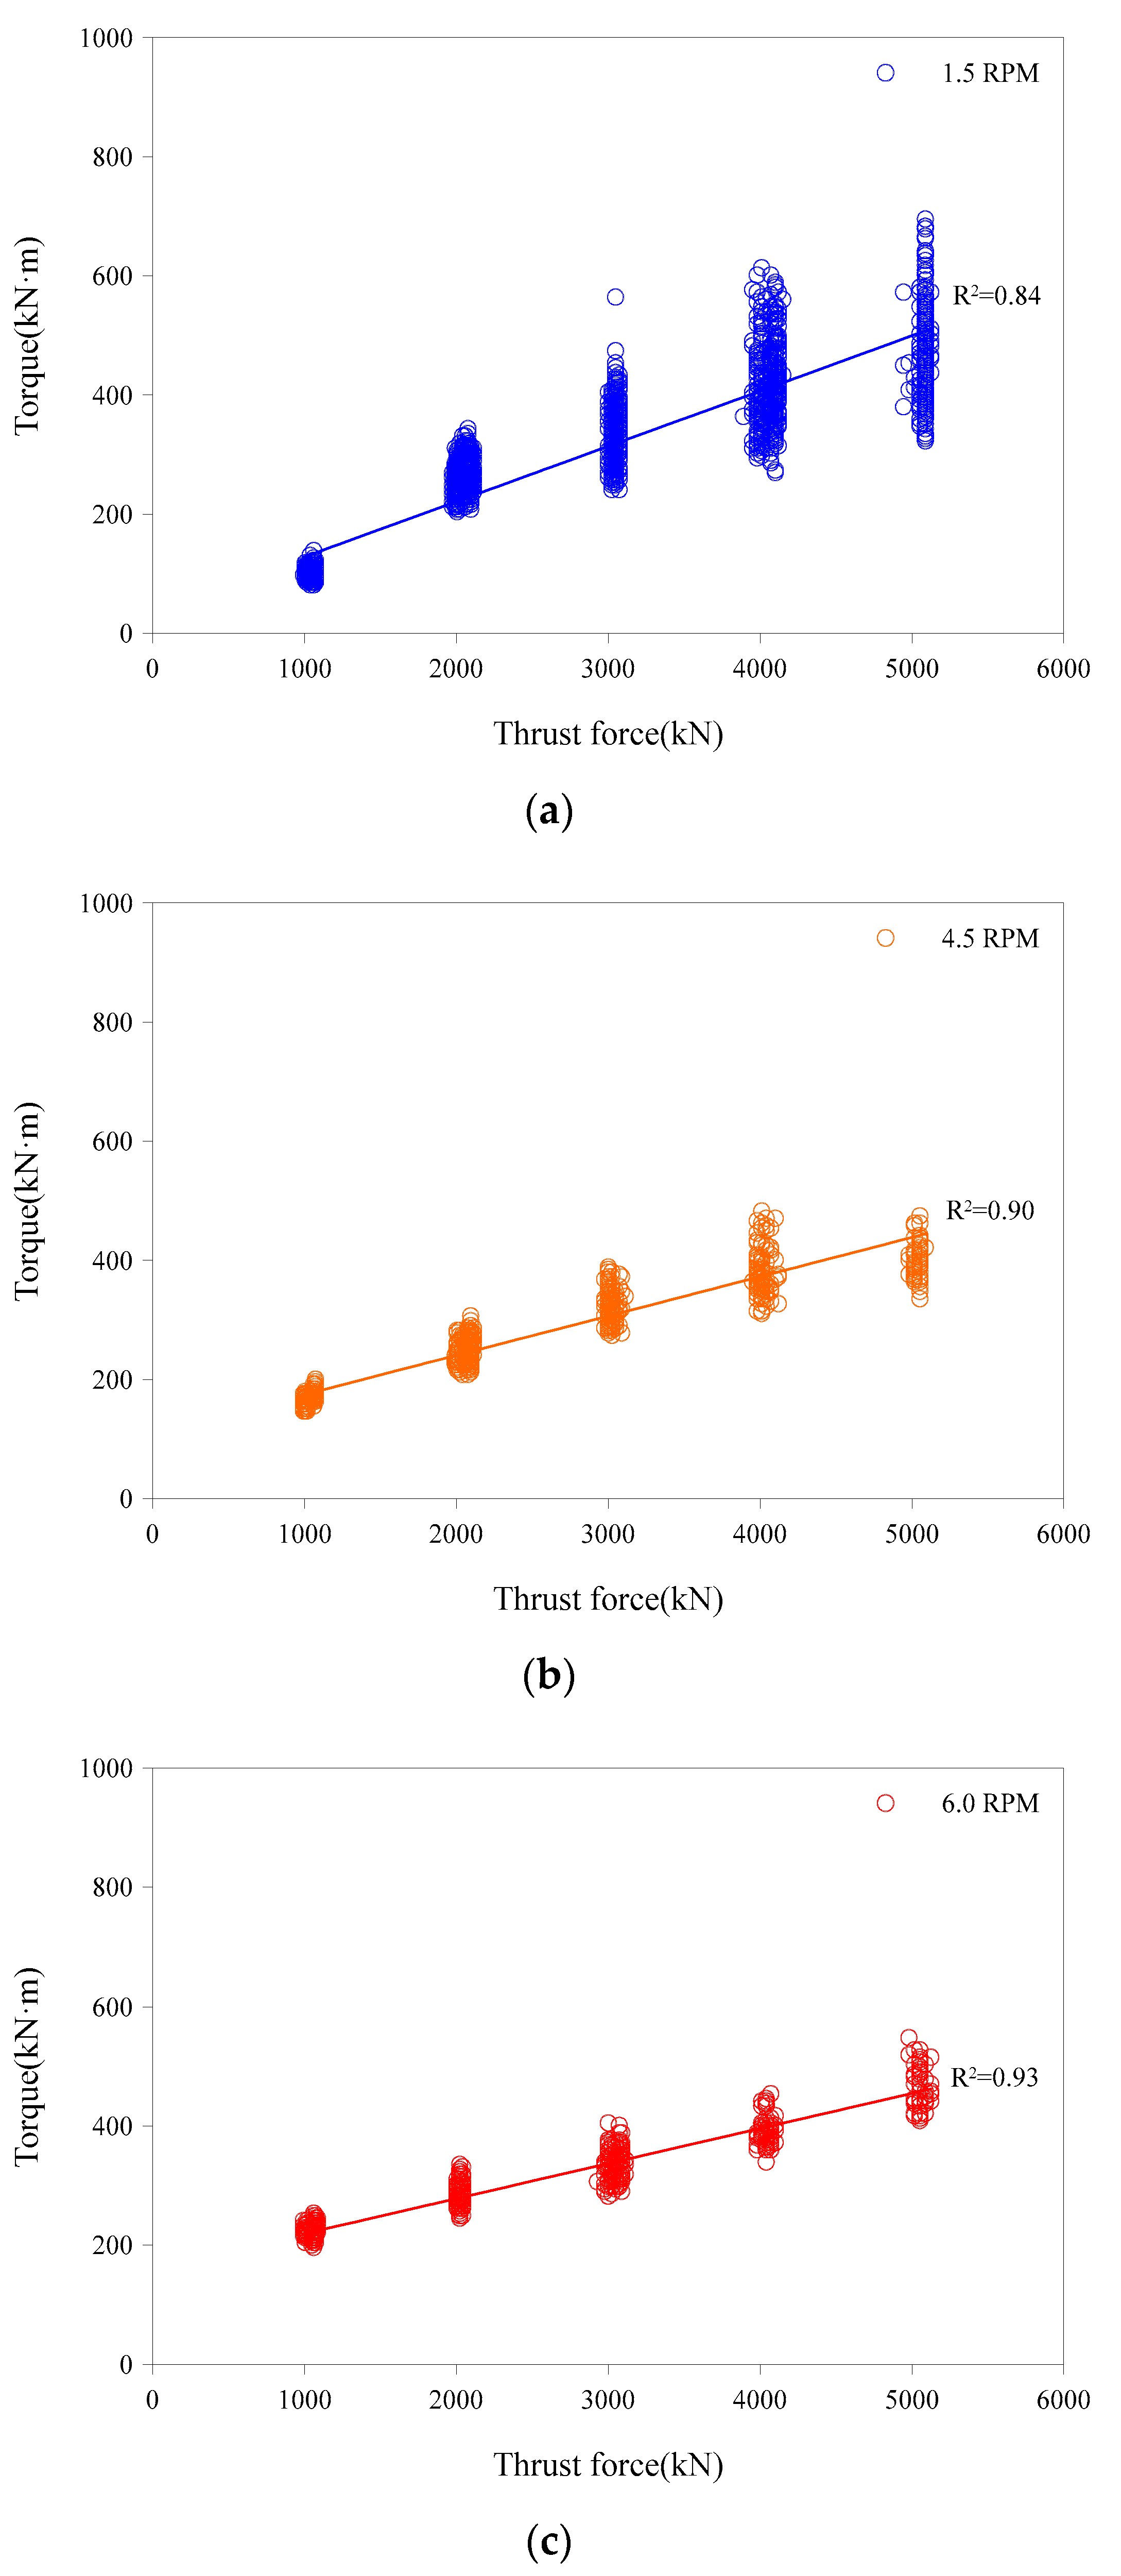
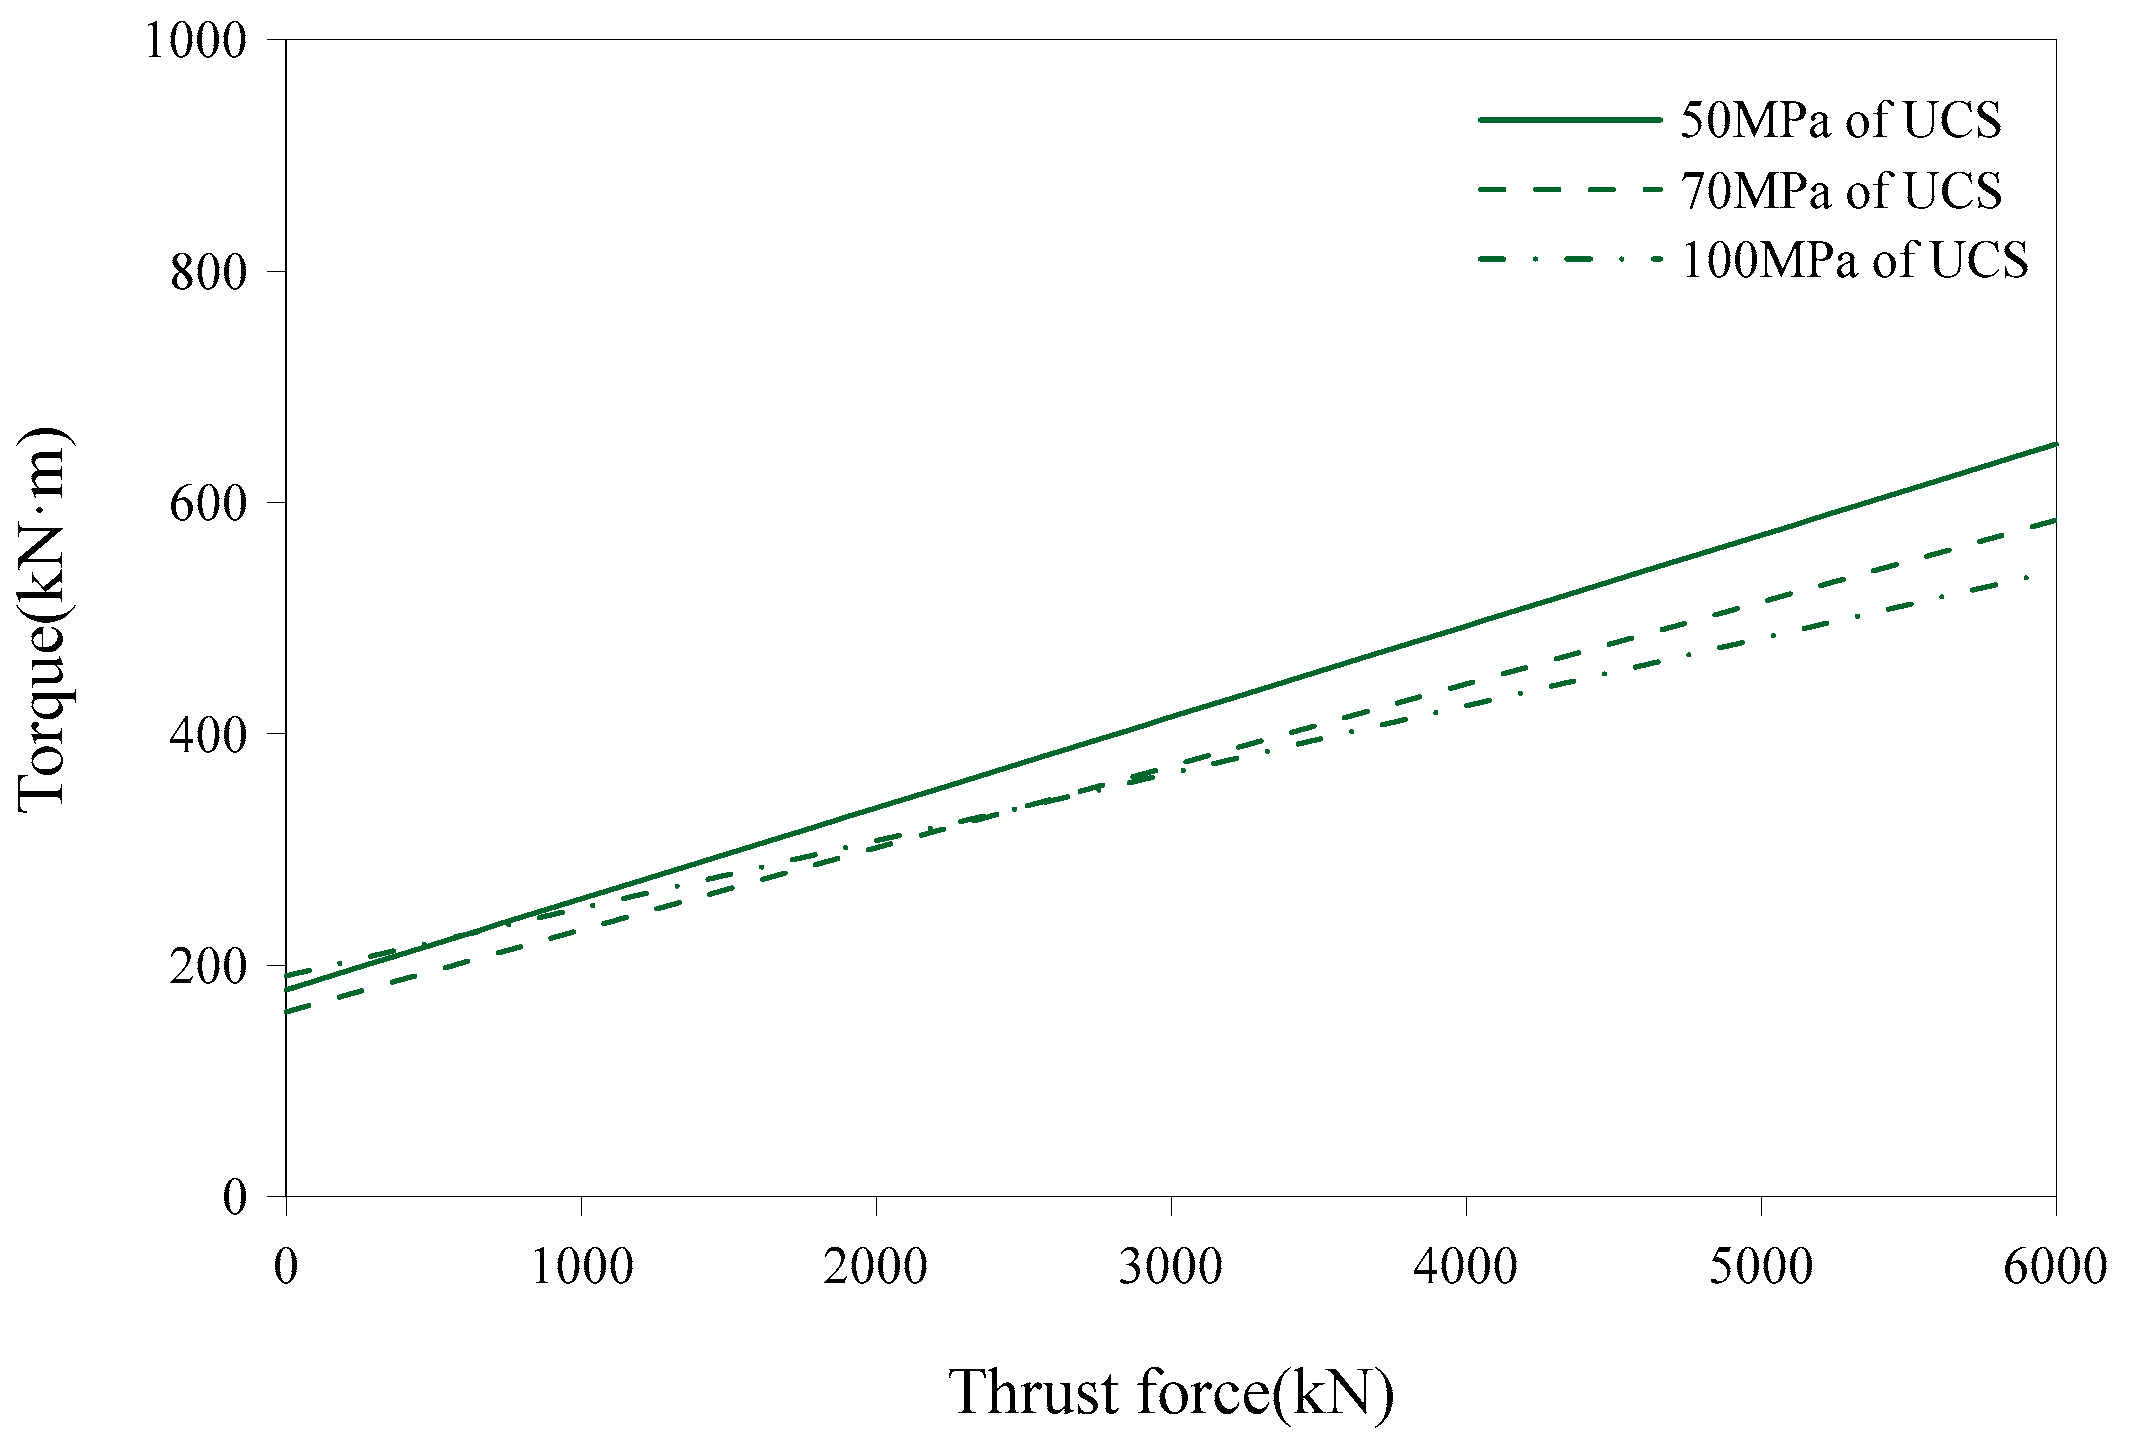
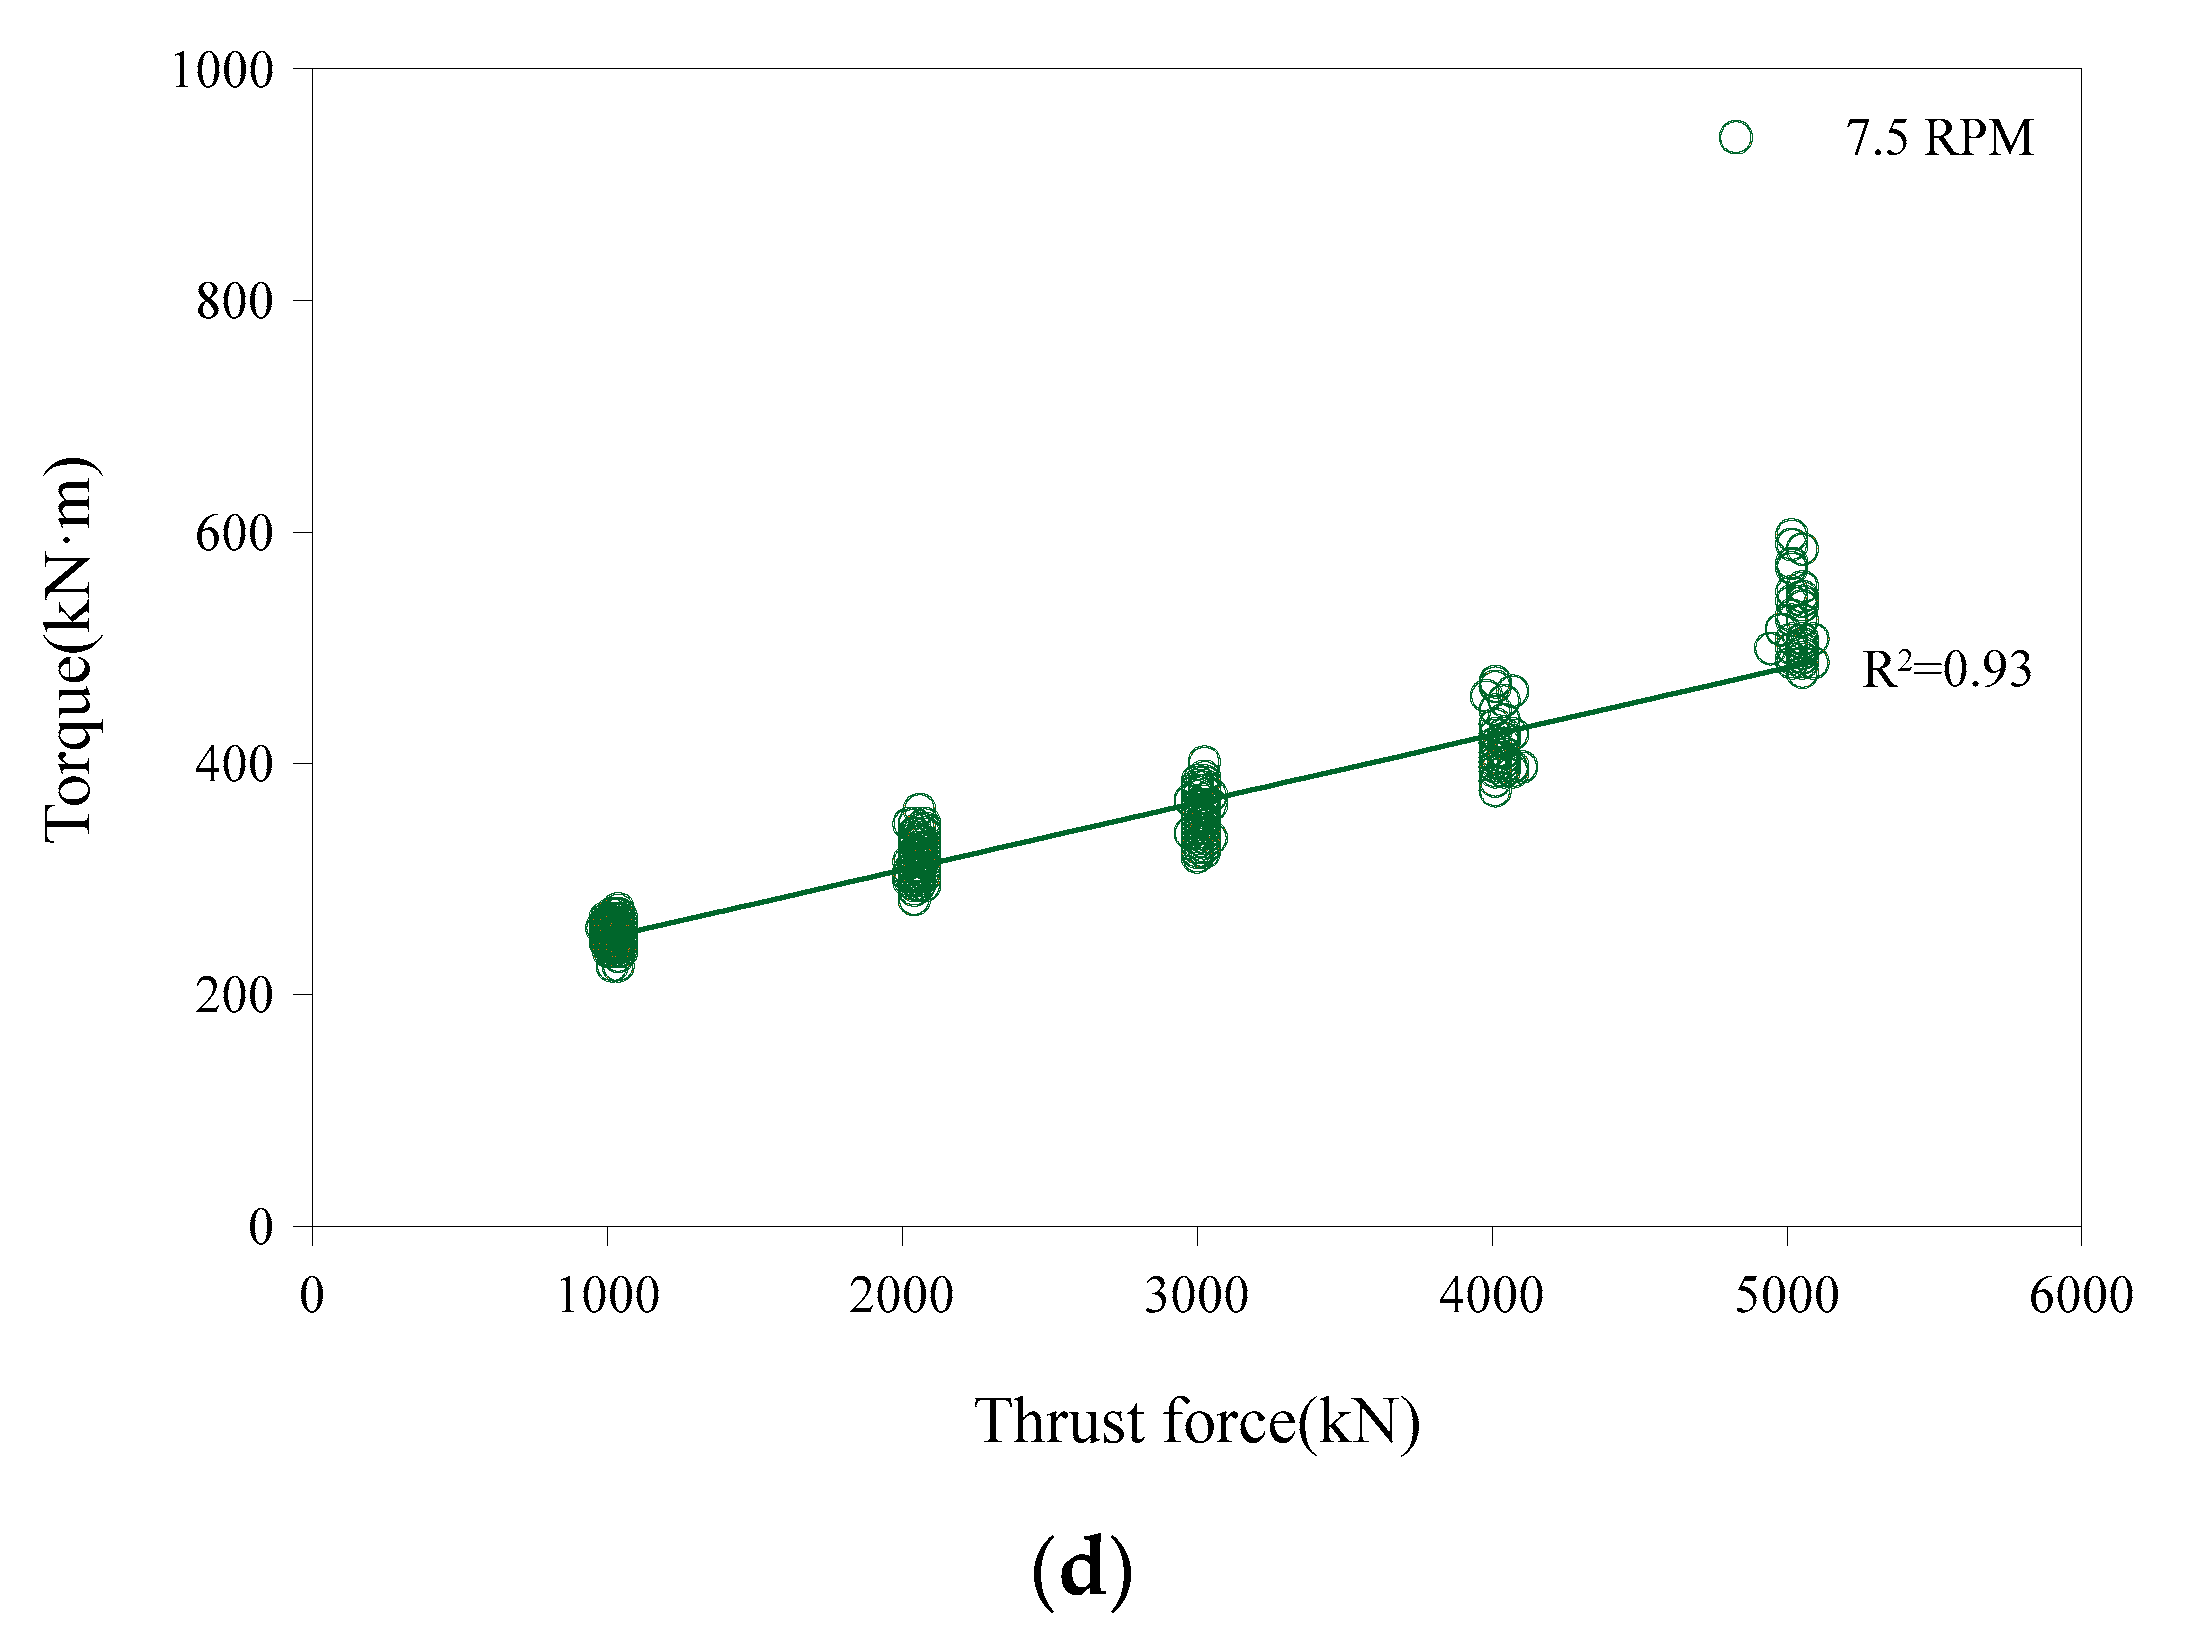
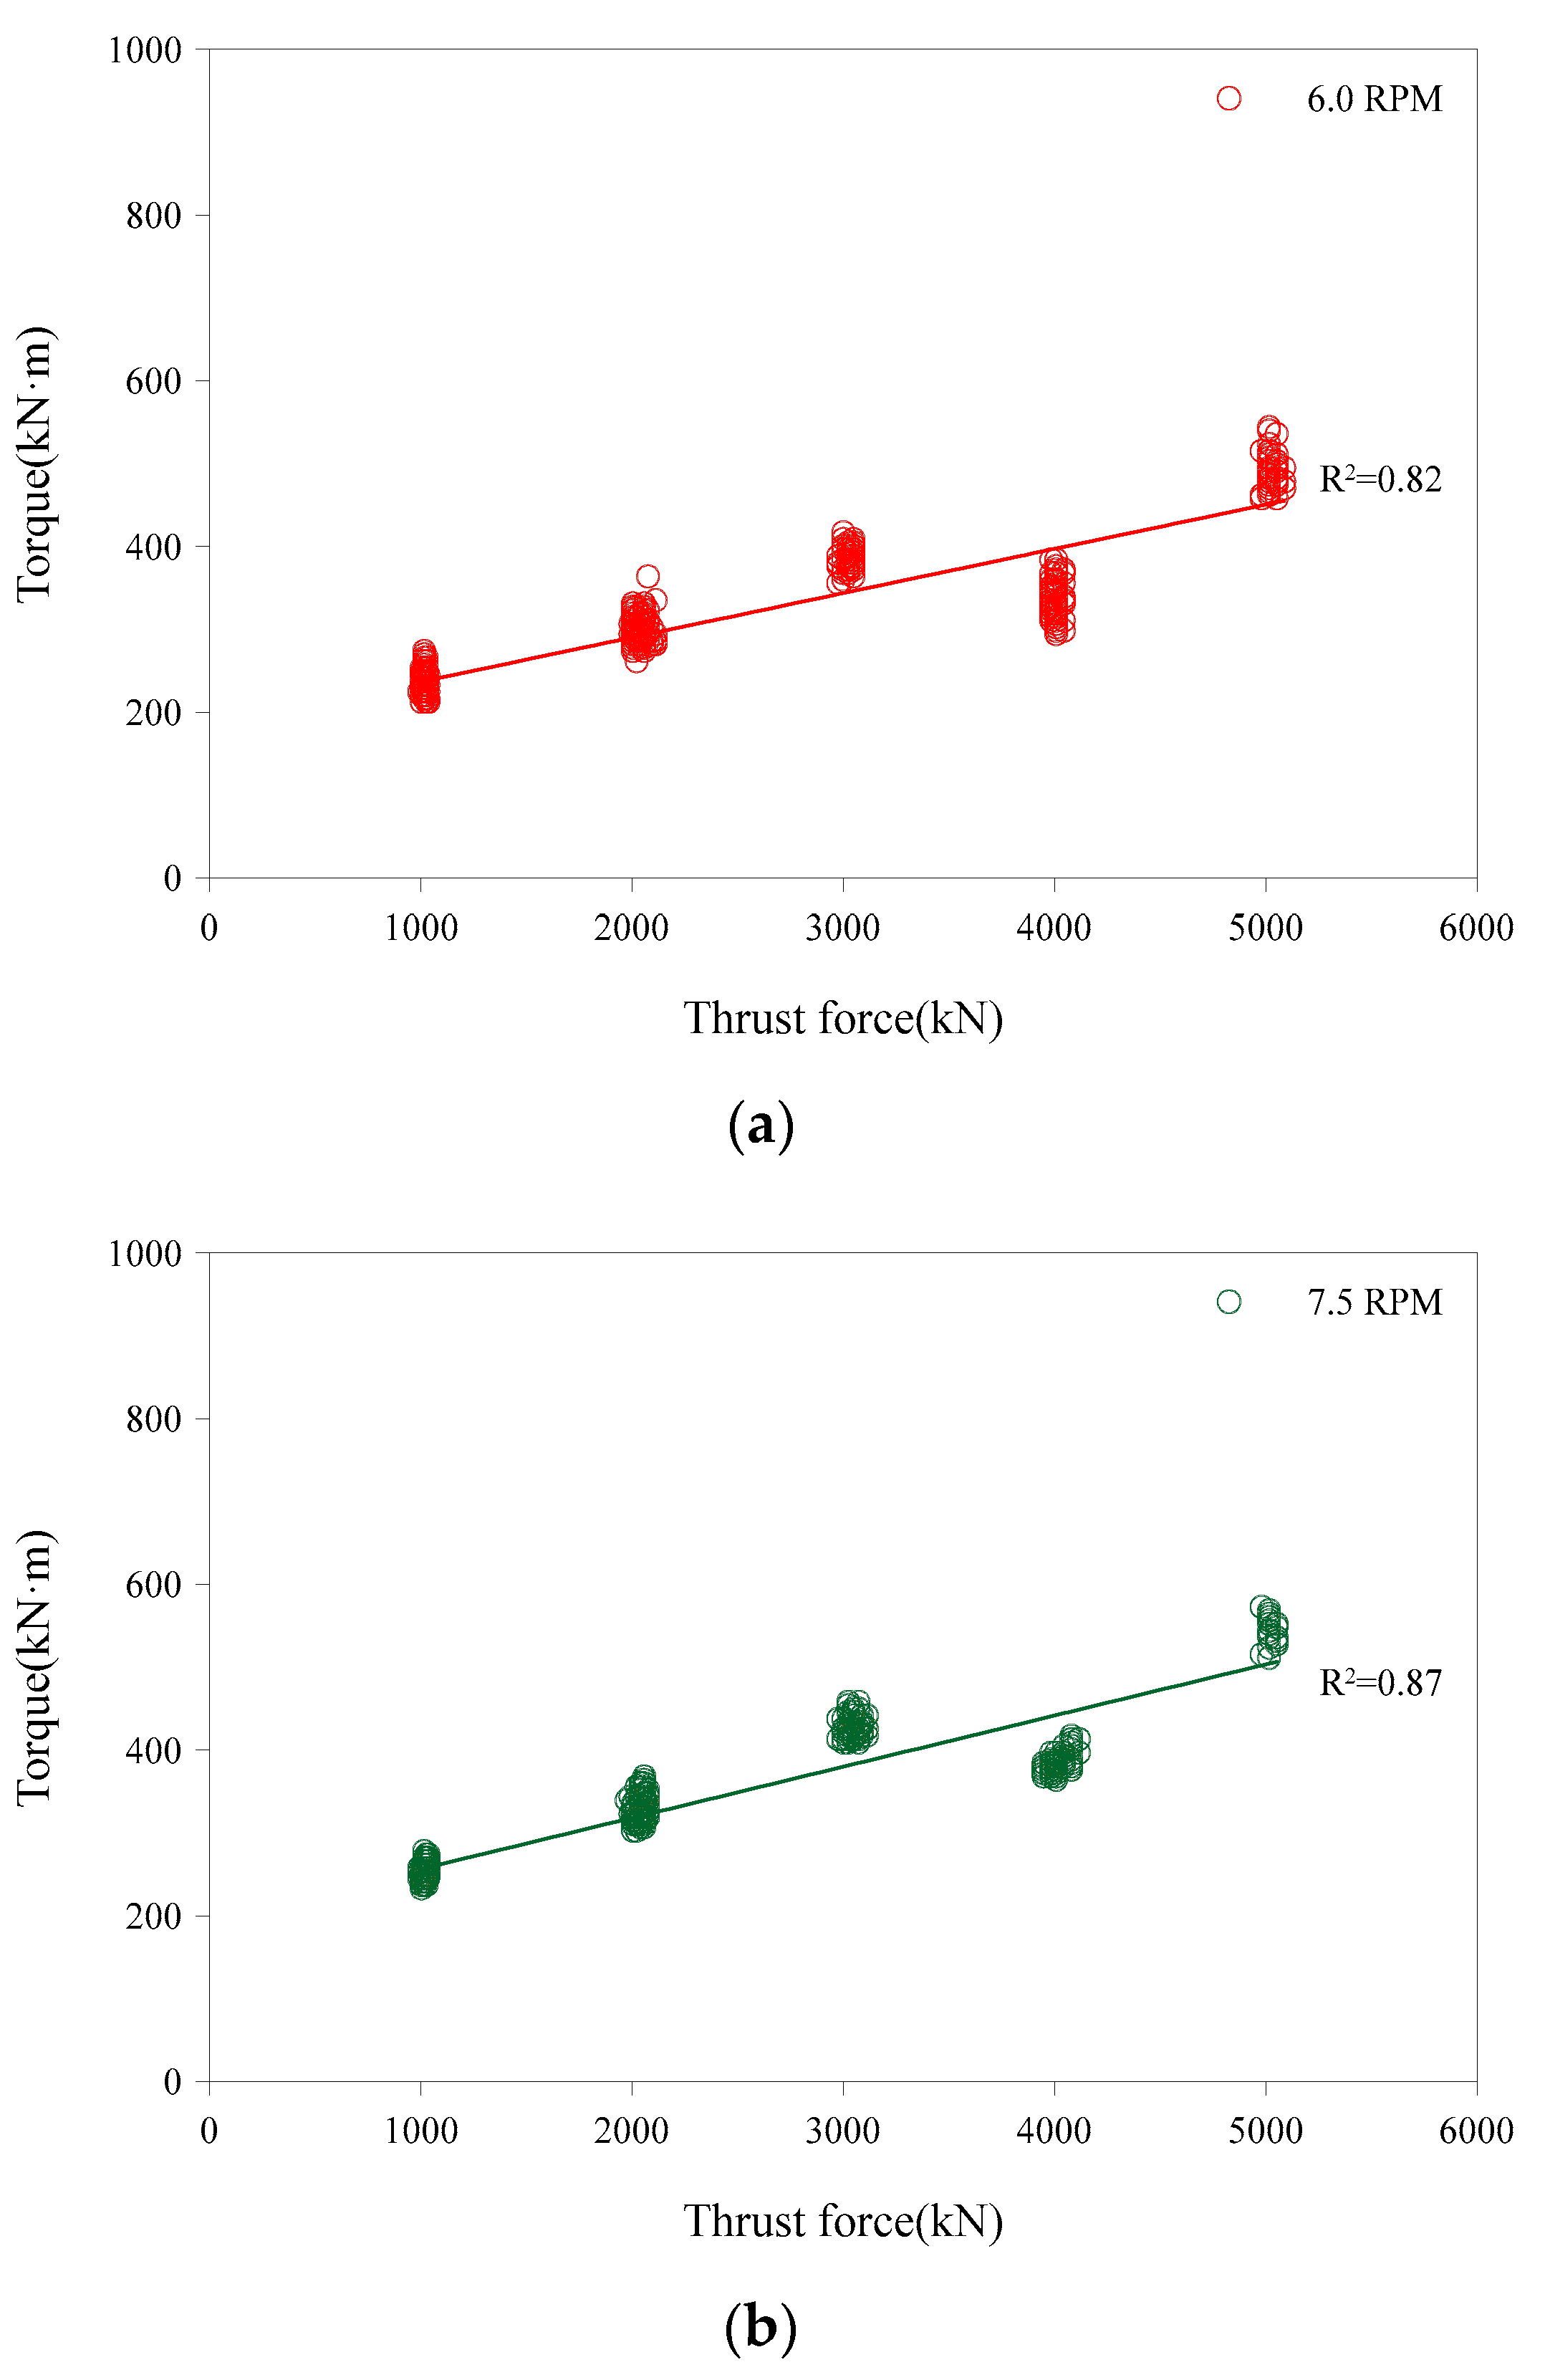
3.2. Analysis of Relationships between Thrust Force and Torque

In this study, the analysis of torque induced by thrust force of shield TBM was carried out according to the results obtained from full-scale tests performed with four different UCS cases in artificial rock mass. As mentioned in Table 3, the analysis of four different rotational speeds of cutterhead affecting the relationships between thrust force and torque was carried out as well as the levels of thrust force and UCS of rock mass affecting the torque were also analyzed. According to the results obtained from the 100 MPa UCS case (Test# 4), as shown in Figure 8, a basic analysis method is introduced here for the development of the required relationships. The interrelations between thrust force and torque were analyzed at the rotational speeds (RPM) of 1.5, 4.5, 6.0, and 7.5. The relationships showed similar trends for all rotational speeds except in the case of 1.5 RPM. The reason behind the difference observed at 1.5 RPM was same as discussed previously in Section 3.1. In all the test results, a linear increase in the torque was observed with the increase in the levels of thrust force. The R2 values were observed in the range of 0.84 and 0.93. Between all the RPM cases, an average torque value of 185 kN·m was observed to develop at the application of 1000 kN thrust force, whereas, it largely increased up to average 464 kN·m when the thrust force reached the level of 5000 kN.
Based on the test results, the regression lines obtained at 7.5 RPM level according to UCS of rock mass are shown in Figure 9. On the application of constant thrust force, greater penetration depth was observed at low UCS which resulted in higher torque development. It is thus deduced that the relationships between thrust force and torque are affected by UCS more significantly as compared to the rotational speed of the cutterhead.

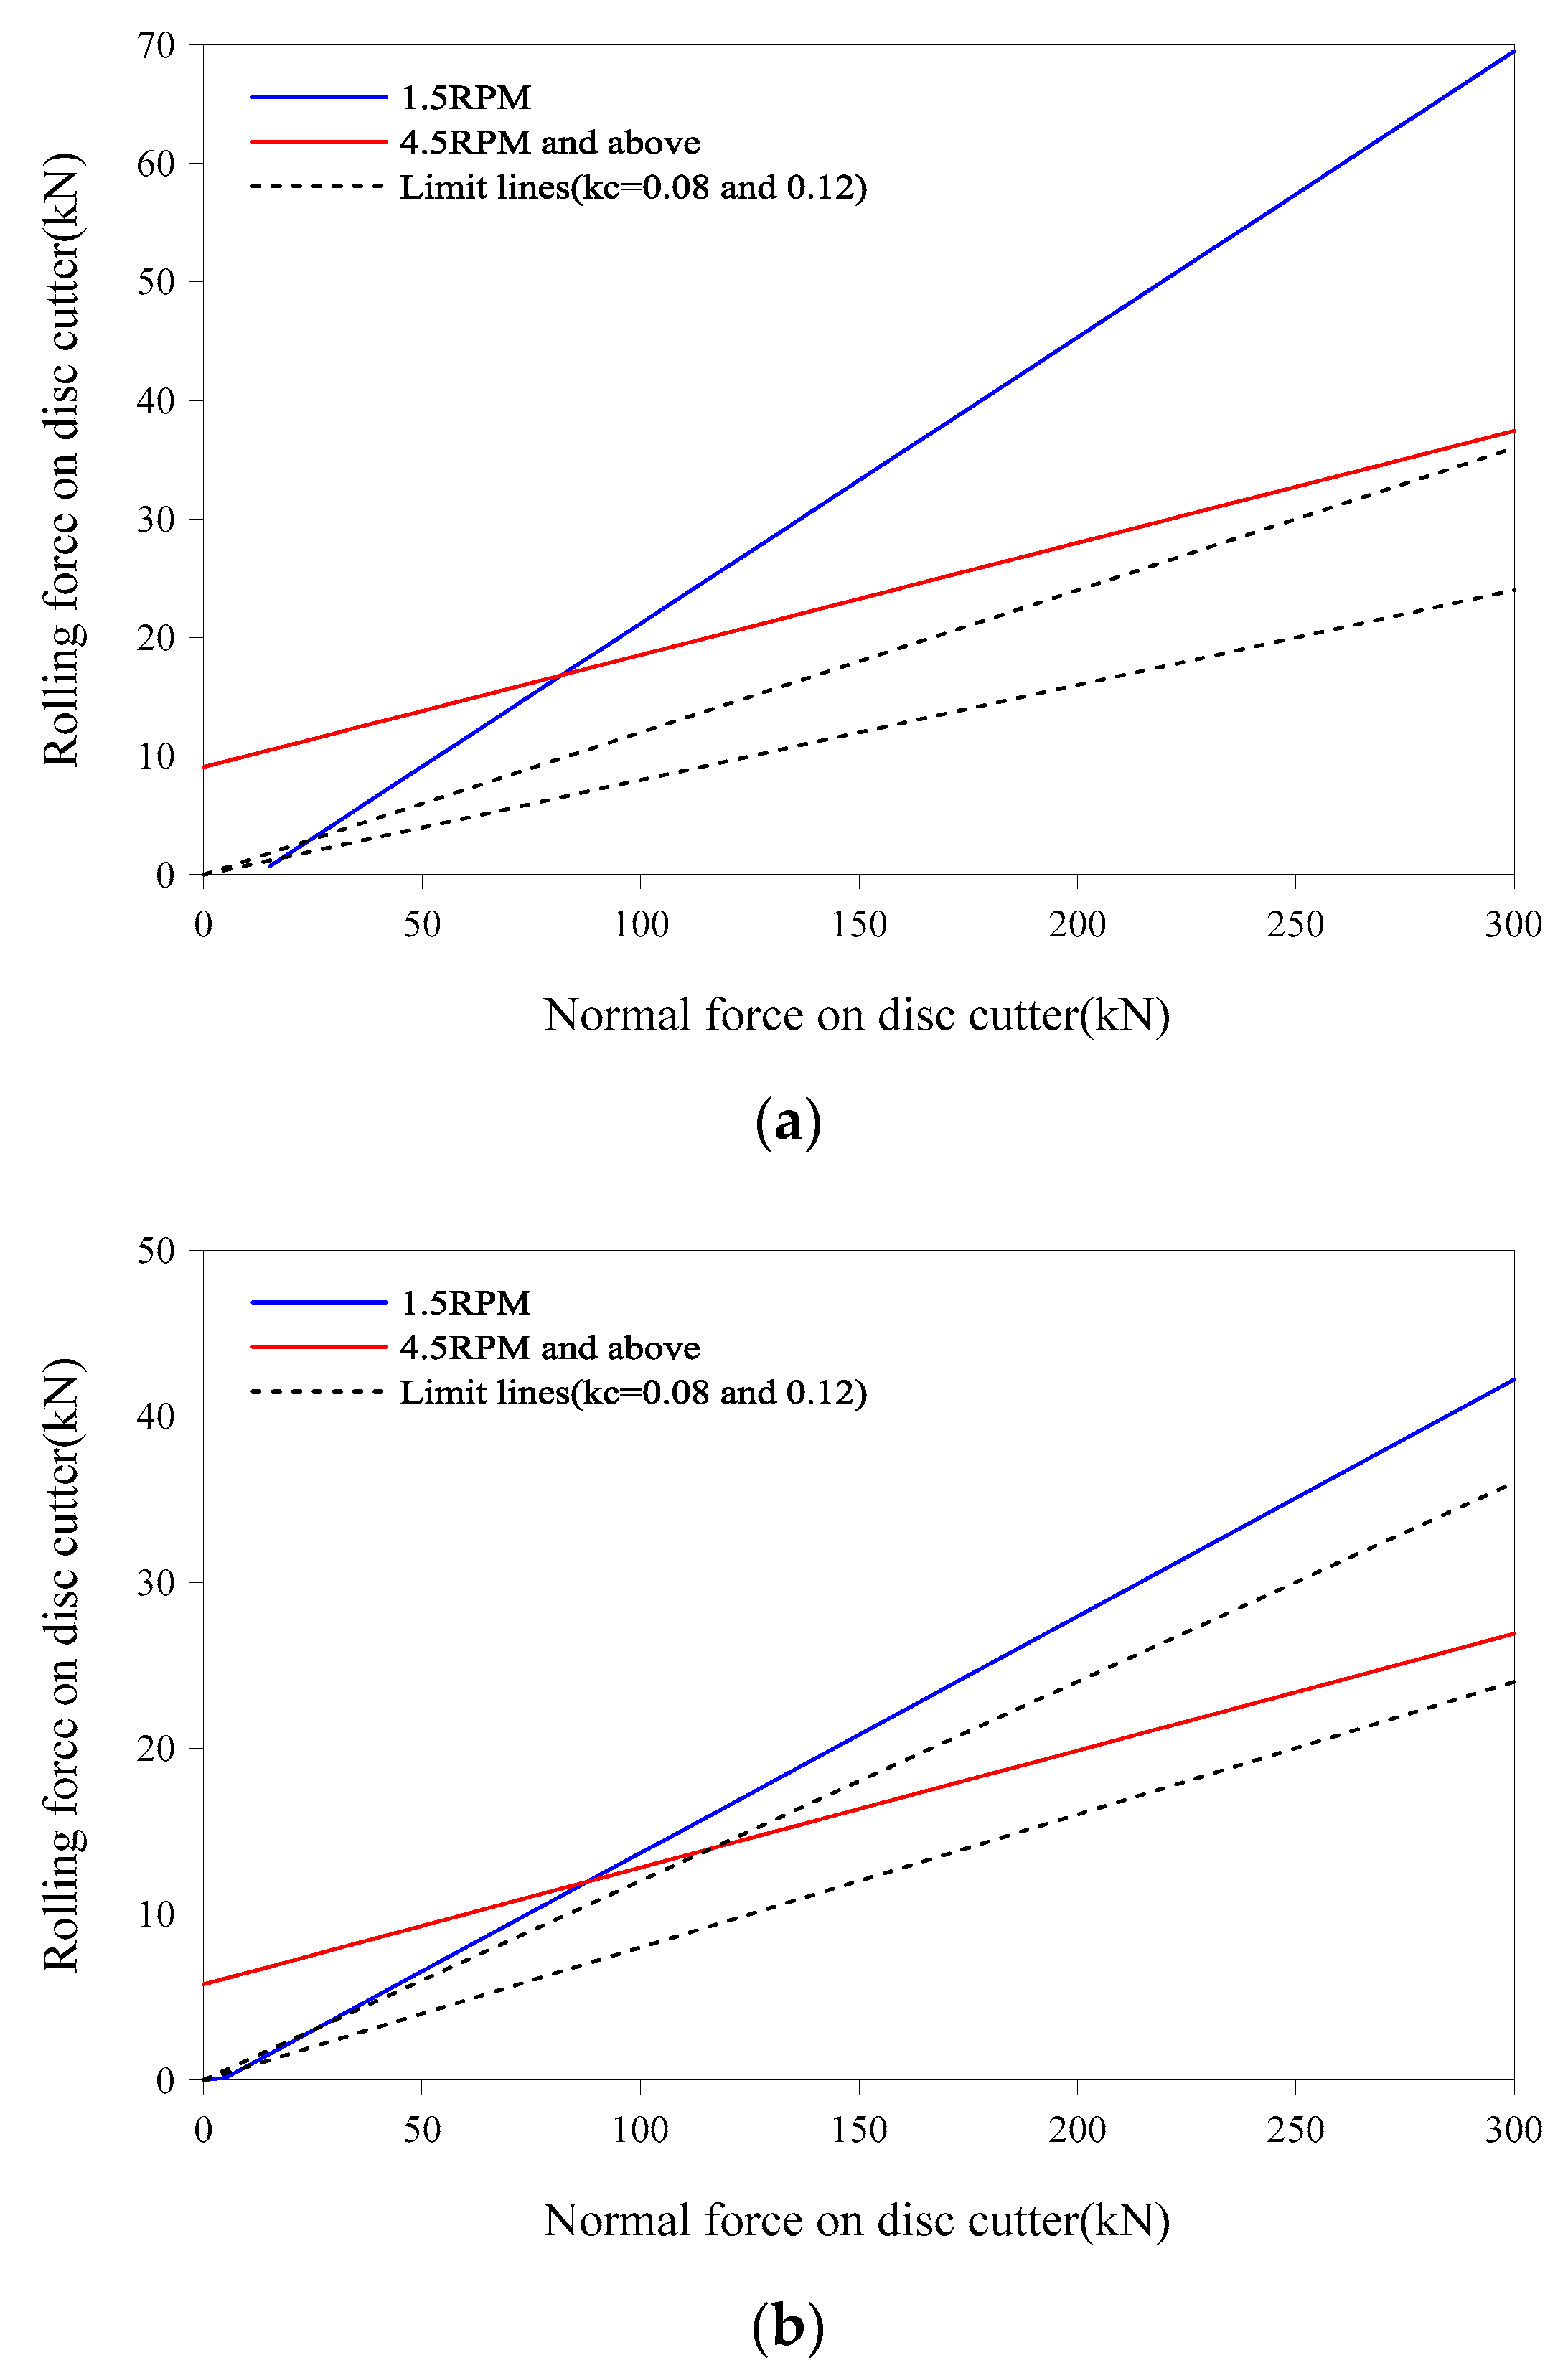
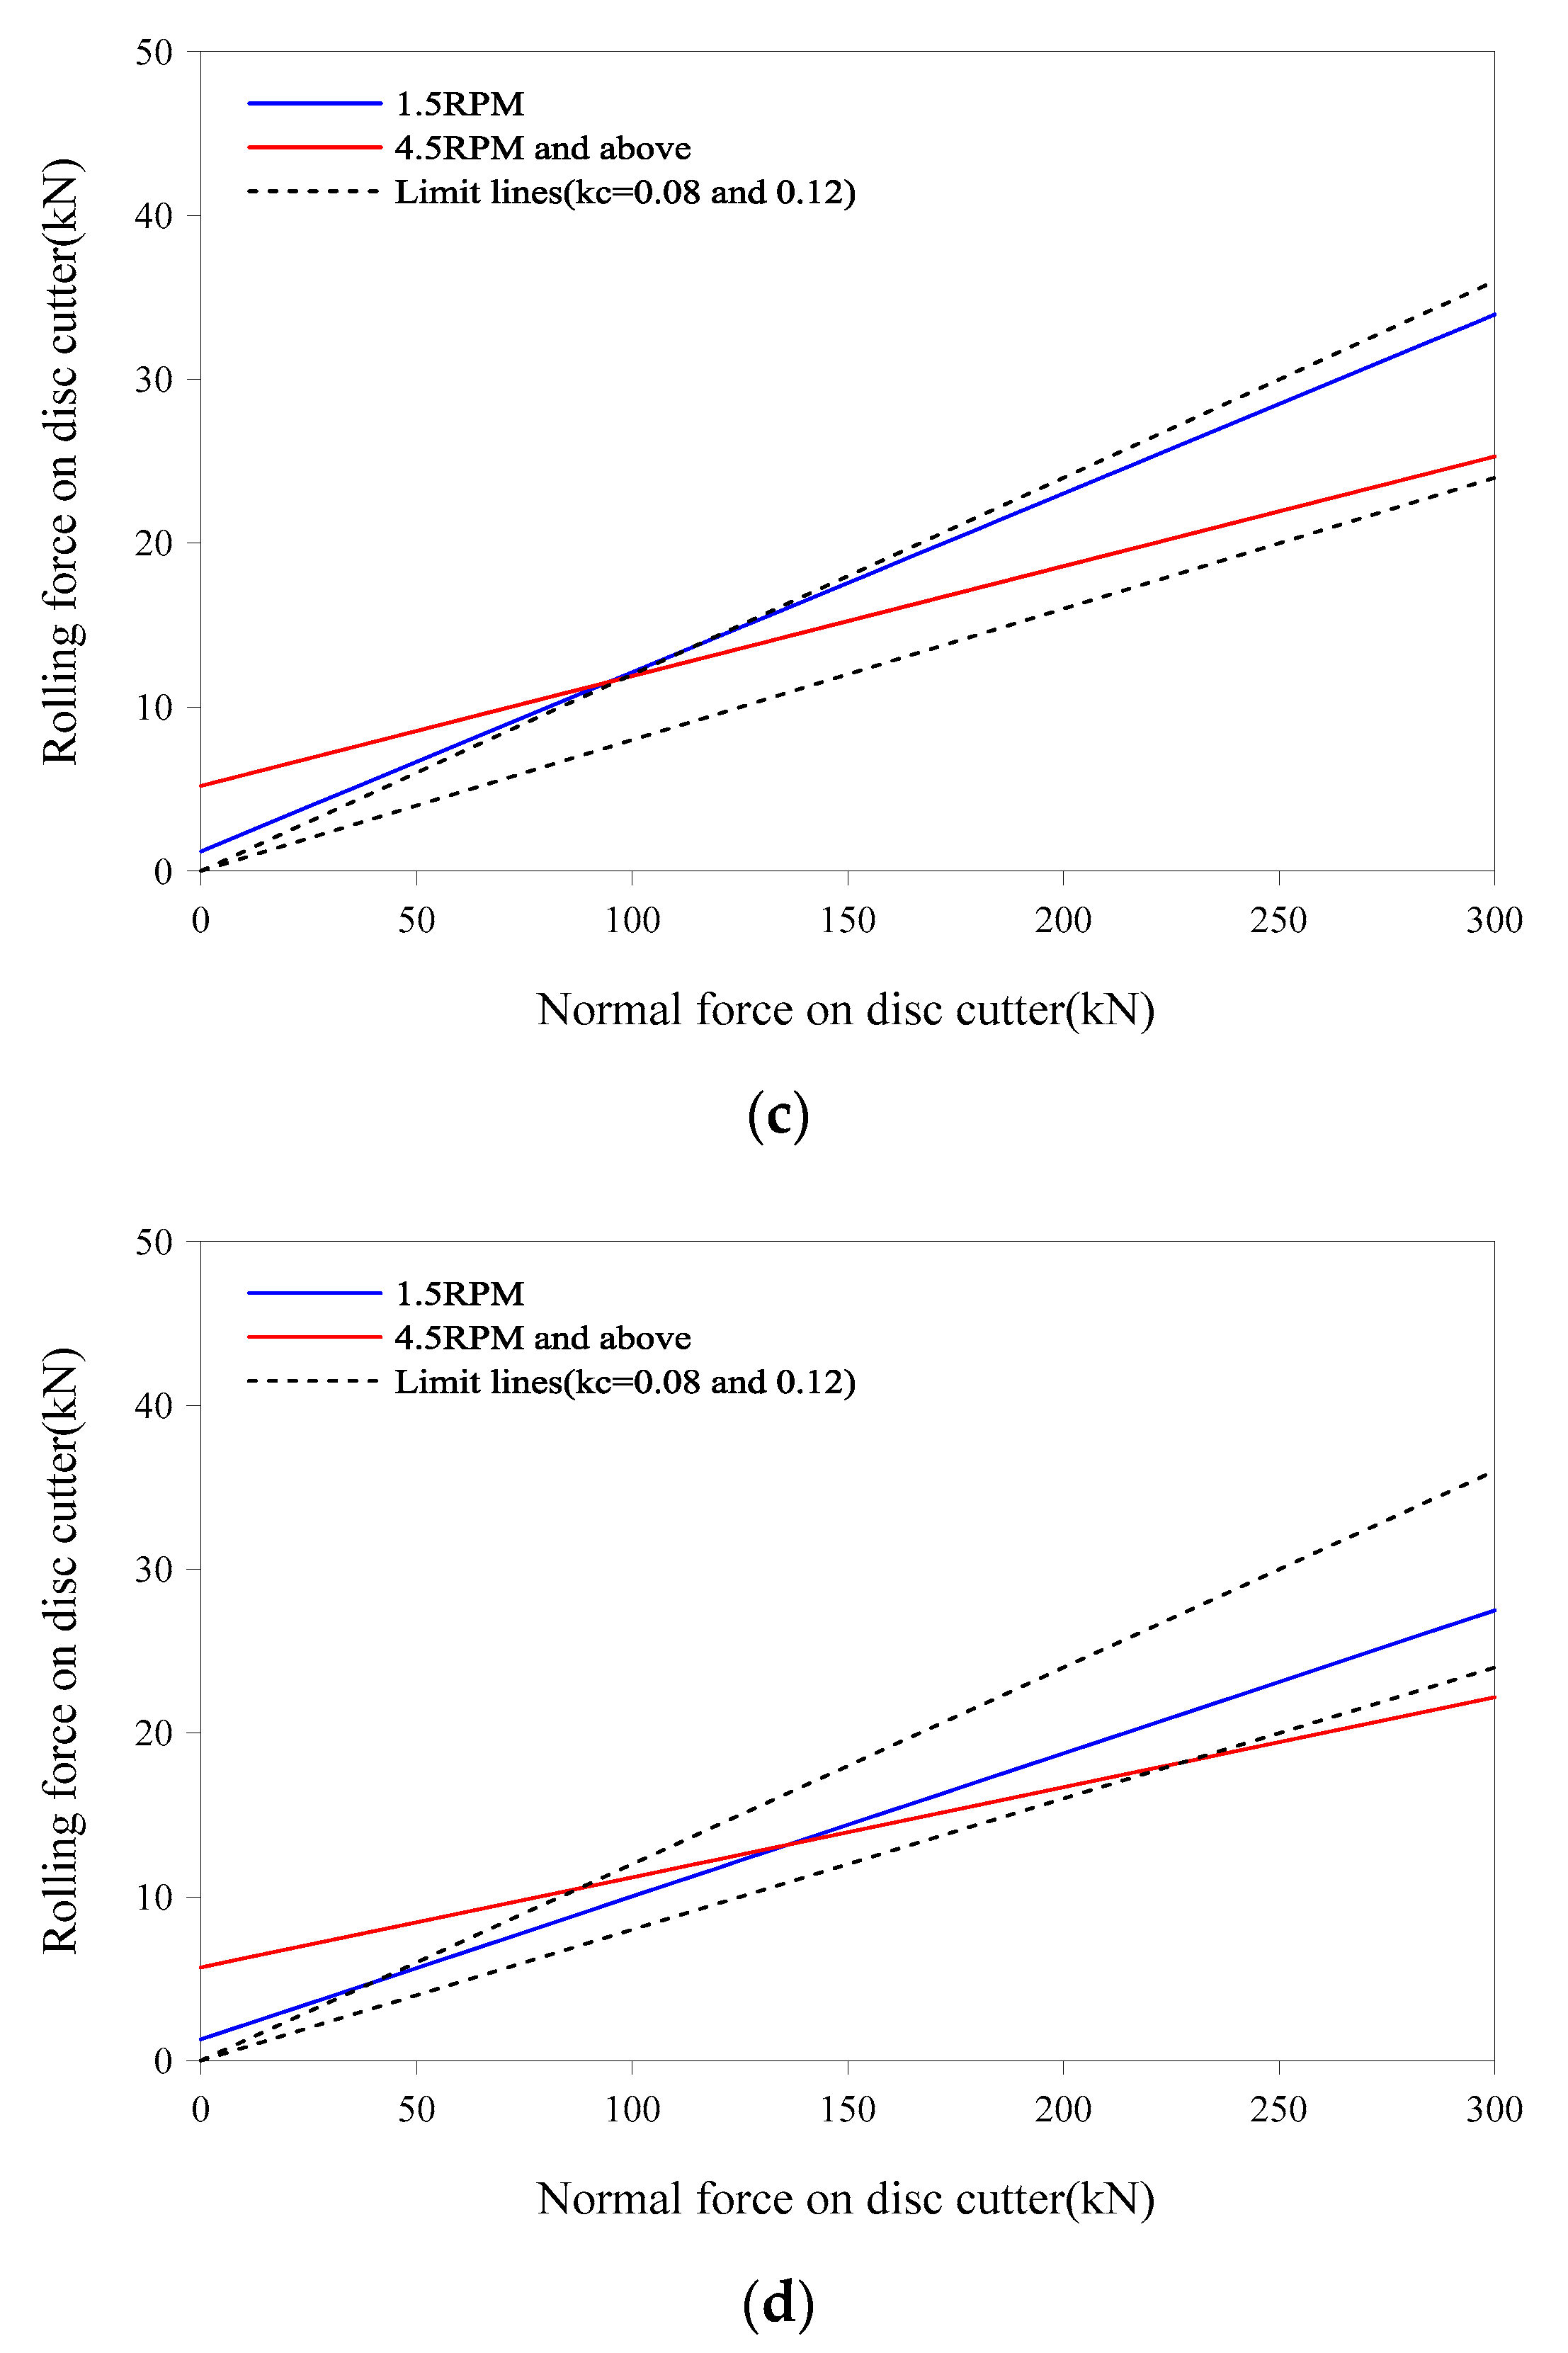
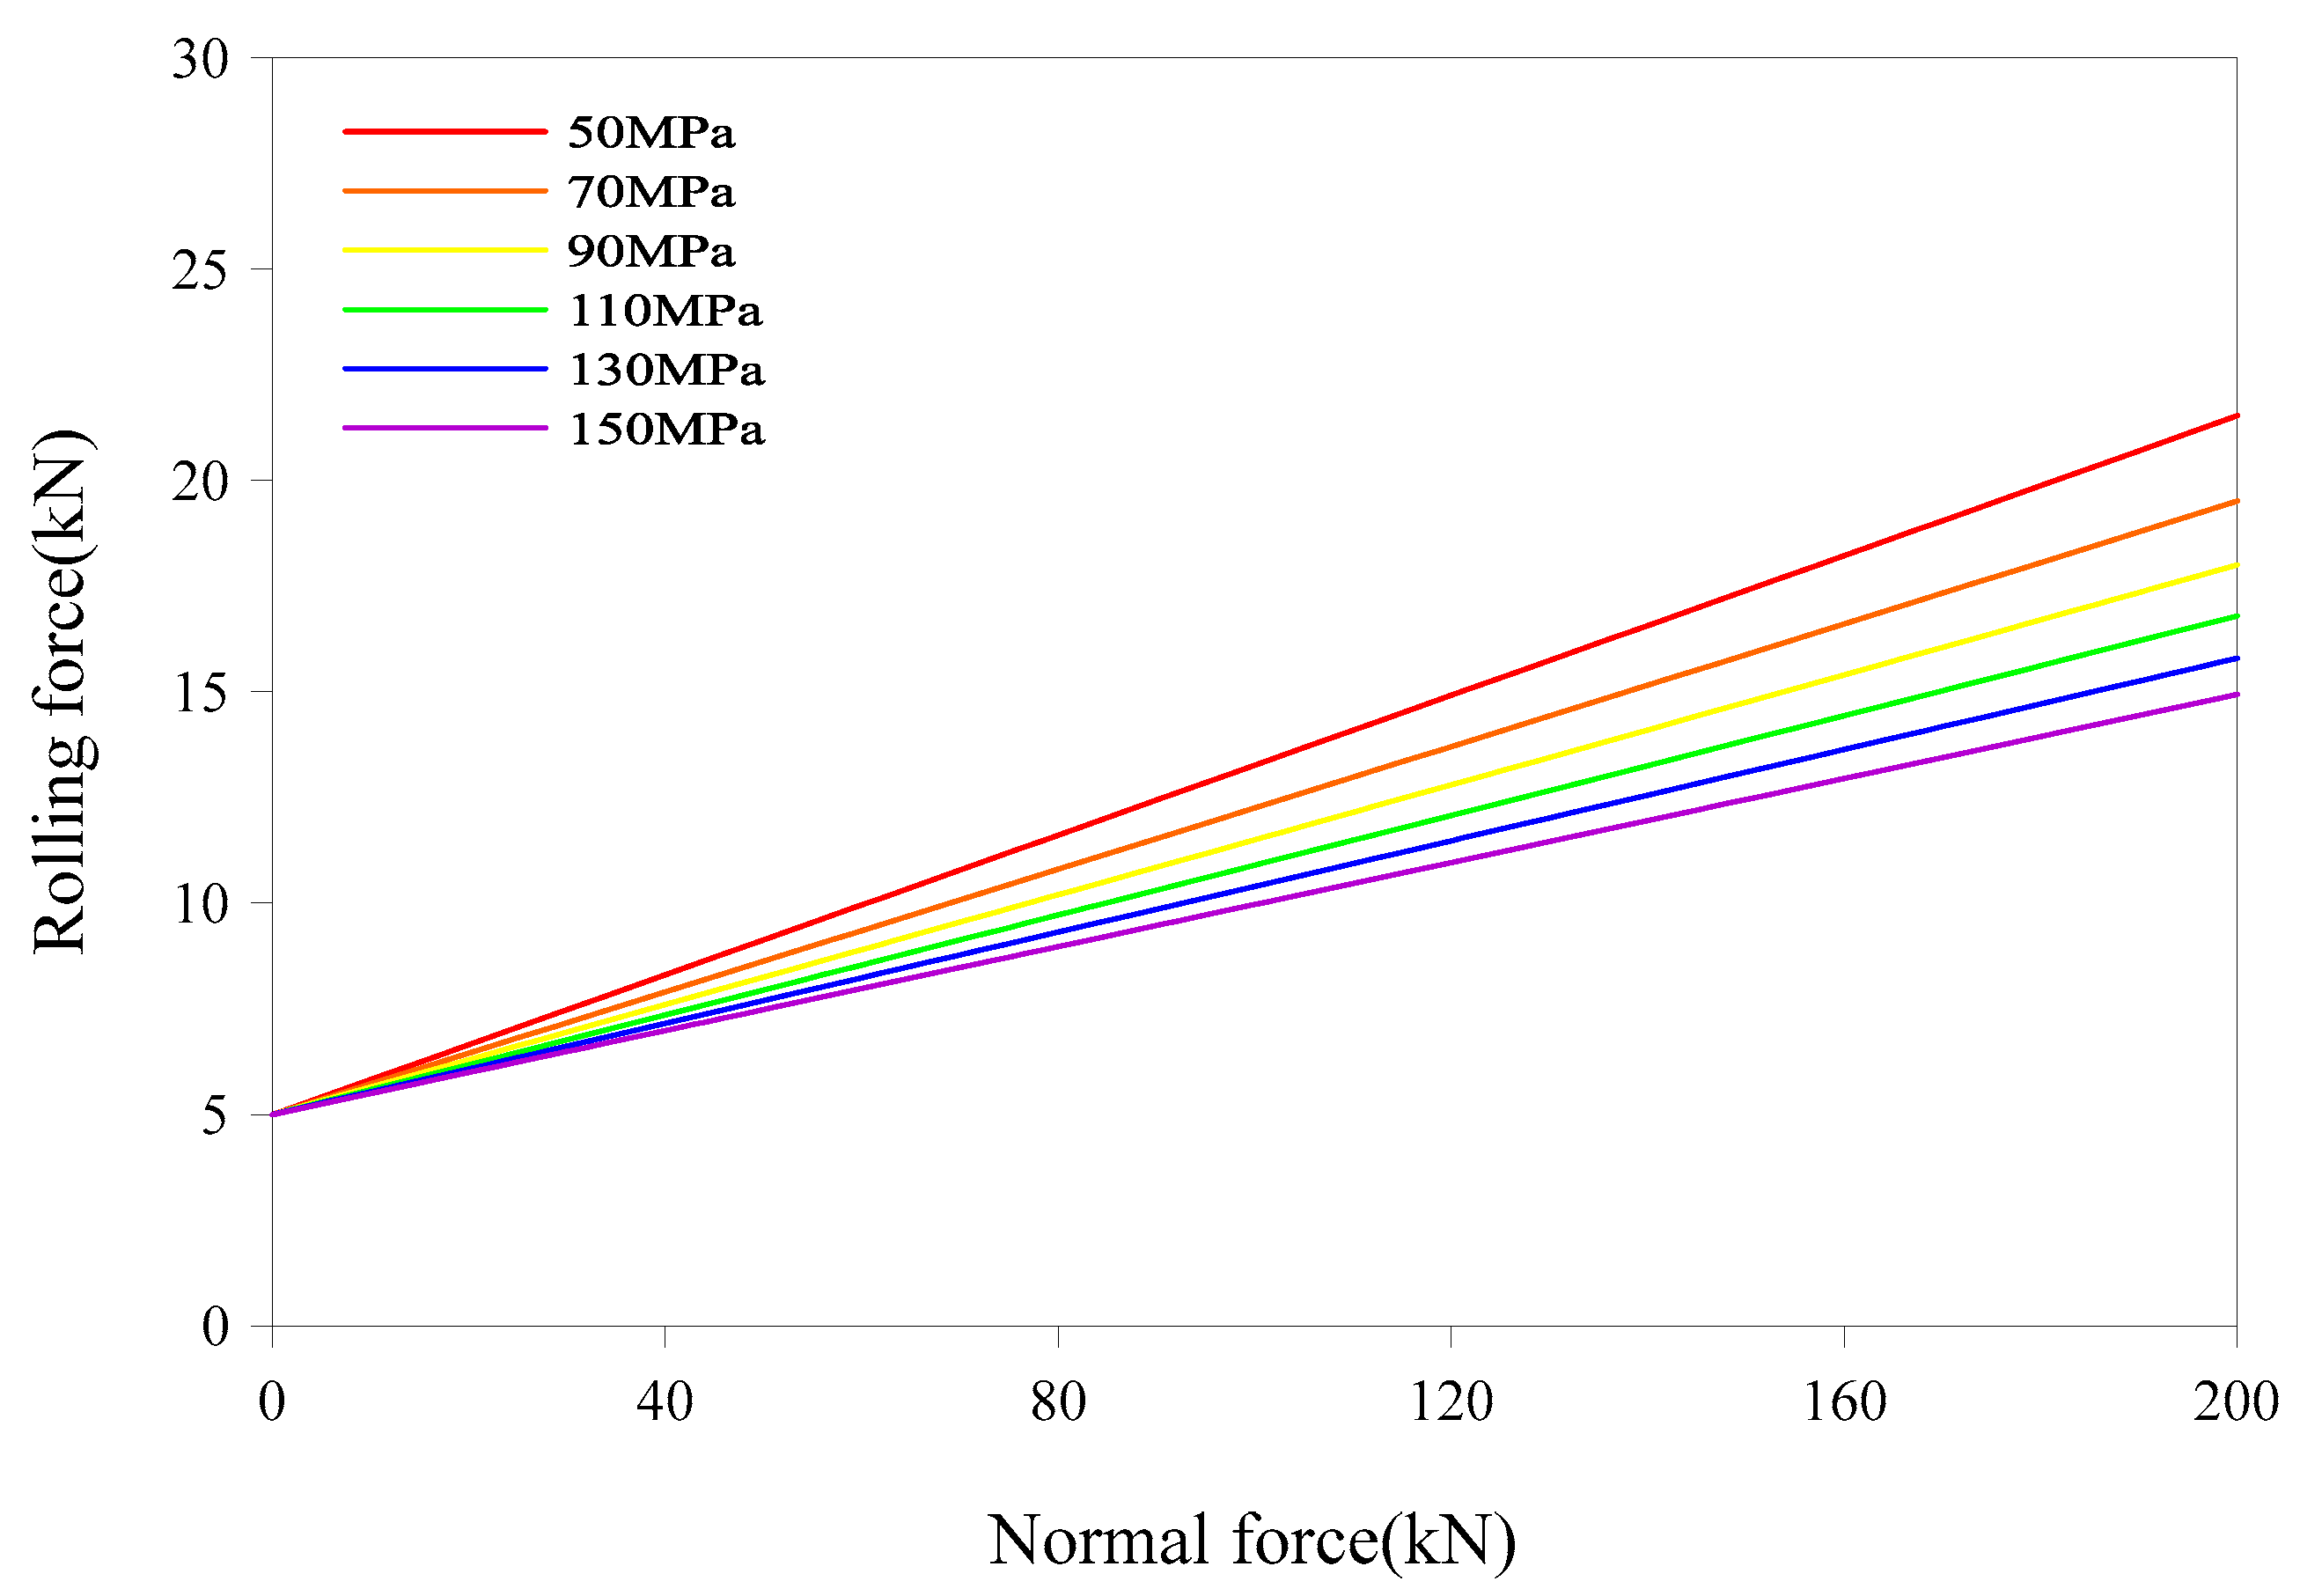
3.3. Suggestion of Relationships between Normal and Rolling Force Acting on a Single Disc Cutter

Taking the developed relationships between thrust force and torque into account, the relationships between normal and rolling force were acquired using equations developed in the NTNU model [3]. Normal force was calculated by dividing thrust force by number of disc cutters and rolling force was calculated based on torque, as shown in Equations (1)–(3), considering relative distance between disc cutters, diameter of cutter head, and number of disc cutters.
Fn = Tthrust/N
here, Fn is the normal force on disc cutter (kN), Tthrust is the thrust force (kN), and N is the number of disc cutters.
T = rmc × DTBM × N × (Fn × kc)/2
T = rmc × DTBM × N × Fr/2
here, T is the torque (kN.m), DTBM is diameter of cuttherhead (m), N is the number of disc cutters, Fr is the rolling force on the disc cutter (kN).
As mentioned before, the torque measured during these tests was calculated based on the oil pressure from the operating hydraulic pumps, because torque was not found to be acting on the disc cutters. Therefore, the calculated normal and rolling forces were taken as the average values acting on all the disc cutters in cutterhead. The relationships between thrust force and torque mainly for the conditions of 4.5 RPM and above were integrated into a single relationship because of the almost absolute similarity between them and the red line in Figure 10 shows the relationships between normal and rolling forces obtained from them according to four UCS values. In order to visualize a comparison between various cases and methods, the relationships obtained at 1.5 RPM and the two limit lines obtained by the NTNU model are presented in Figure 10. Bruland (2000) [3], at NTNU, suggested that the limit lines ranged between 0.12 to 0.08.
In this study, the regression lines obtained in case of 4.5 RPM and above have shown different trends as compared to those for 1.5 RPM and limit lines, but this difference tends to become smaller with the increase in UCS of rock mass. However, when the TBM machine is planned to be operated specially at slower rotational speed of the cutterhead when facing the fractured zone of rock mass, then this machine should be designed following the relationships at 1.5 RPM considering the development of higher torque values.
The trends of kc values, defined as the ratio of rolling force to normal force (slopes of regression lines in Figure 10), obtained according to the UCS of artificial rock mass are shown in Figure 11. The kc value obtained in 27 MPa (Test# 1) of artificial rock mass was about 0.10, which helps in deducing that the developed rolling force is about 10% of the normal force. The kc value obtained in 99 MPa (Test# 4) of artificial rock mass was 0.055 deducing the developed rolling force to be about 5.5% of the normal force, which is almost half as compared to that developed in the 27 MPa case. In this study, for the cutterhead rotational speed exceeding 4.5 RPM and above, the kc values are suggested to be lying between 0.10 and 0.04 according to the UCS ranging between 27 to 200 MPa, as shown in Figure 11.
kc = −0.03ln(UCS) + 0.2
here, kc is the ratio of rolling force to normal force.
Therefore, for the cutterhead rotational speed exceeding 4.5 RPM and above, an estimation method of rolling force is hereby suggested as the function of UCS of rock mass and normal force which is expressed by Equation (5) as well as Figure 12. According to Equation (5), 5 kN of rolling force can still be developed even when the normal force was not acting (Fn = 0 kN), and it transforms into about 136.5 kN·m of torque which was calculated by assuming the cutterhead diameter as 3560 mm and using 26 disc cutters in Equation (3). The reason behind the development of 5 kN rolling force transforming in to 136.5 kN·m of torque was the application of oil pressure to the oil units for providing force (about 200 kN of weight) to simply rotate the cutterhead without applying normal force.
Fr = [−0.03ln(UCS) + 0.2] × Fn + 5

4. Conclusions

In order to cater the increasing demand of utility tunnels for the purpose of electricity transmission, full-scale tunneling tests were performed for developing an indigenous design method using a 3560 mm diameter shield TBM. The main outcomes of this study are summarized as follows.
(1)
The results derived in this study are very important because precise effects of UCS and operational parameters of TBM on the performance of TBM were clearly established in this study. The reason was that the tests were performed in homogeneous artificial rock mass according to four UCS conditions.
(2)
Logarithmic functional relationships were observed between penetration depth and torque. With the increase in thrust force, the disc cutters penetrated deeper in to the rock mass resulting in an increase in excavation efficiency and in a decrease in torque increment.
(3)
Linear relationships between thrust force and torque were clearly established which were observed to be largely affected by UCS of the rock mass.
(4)
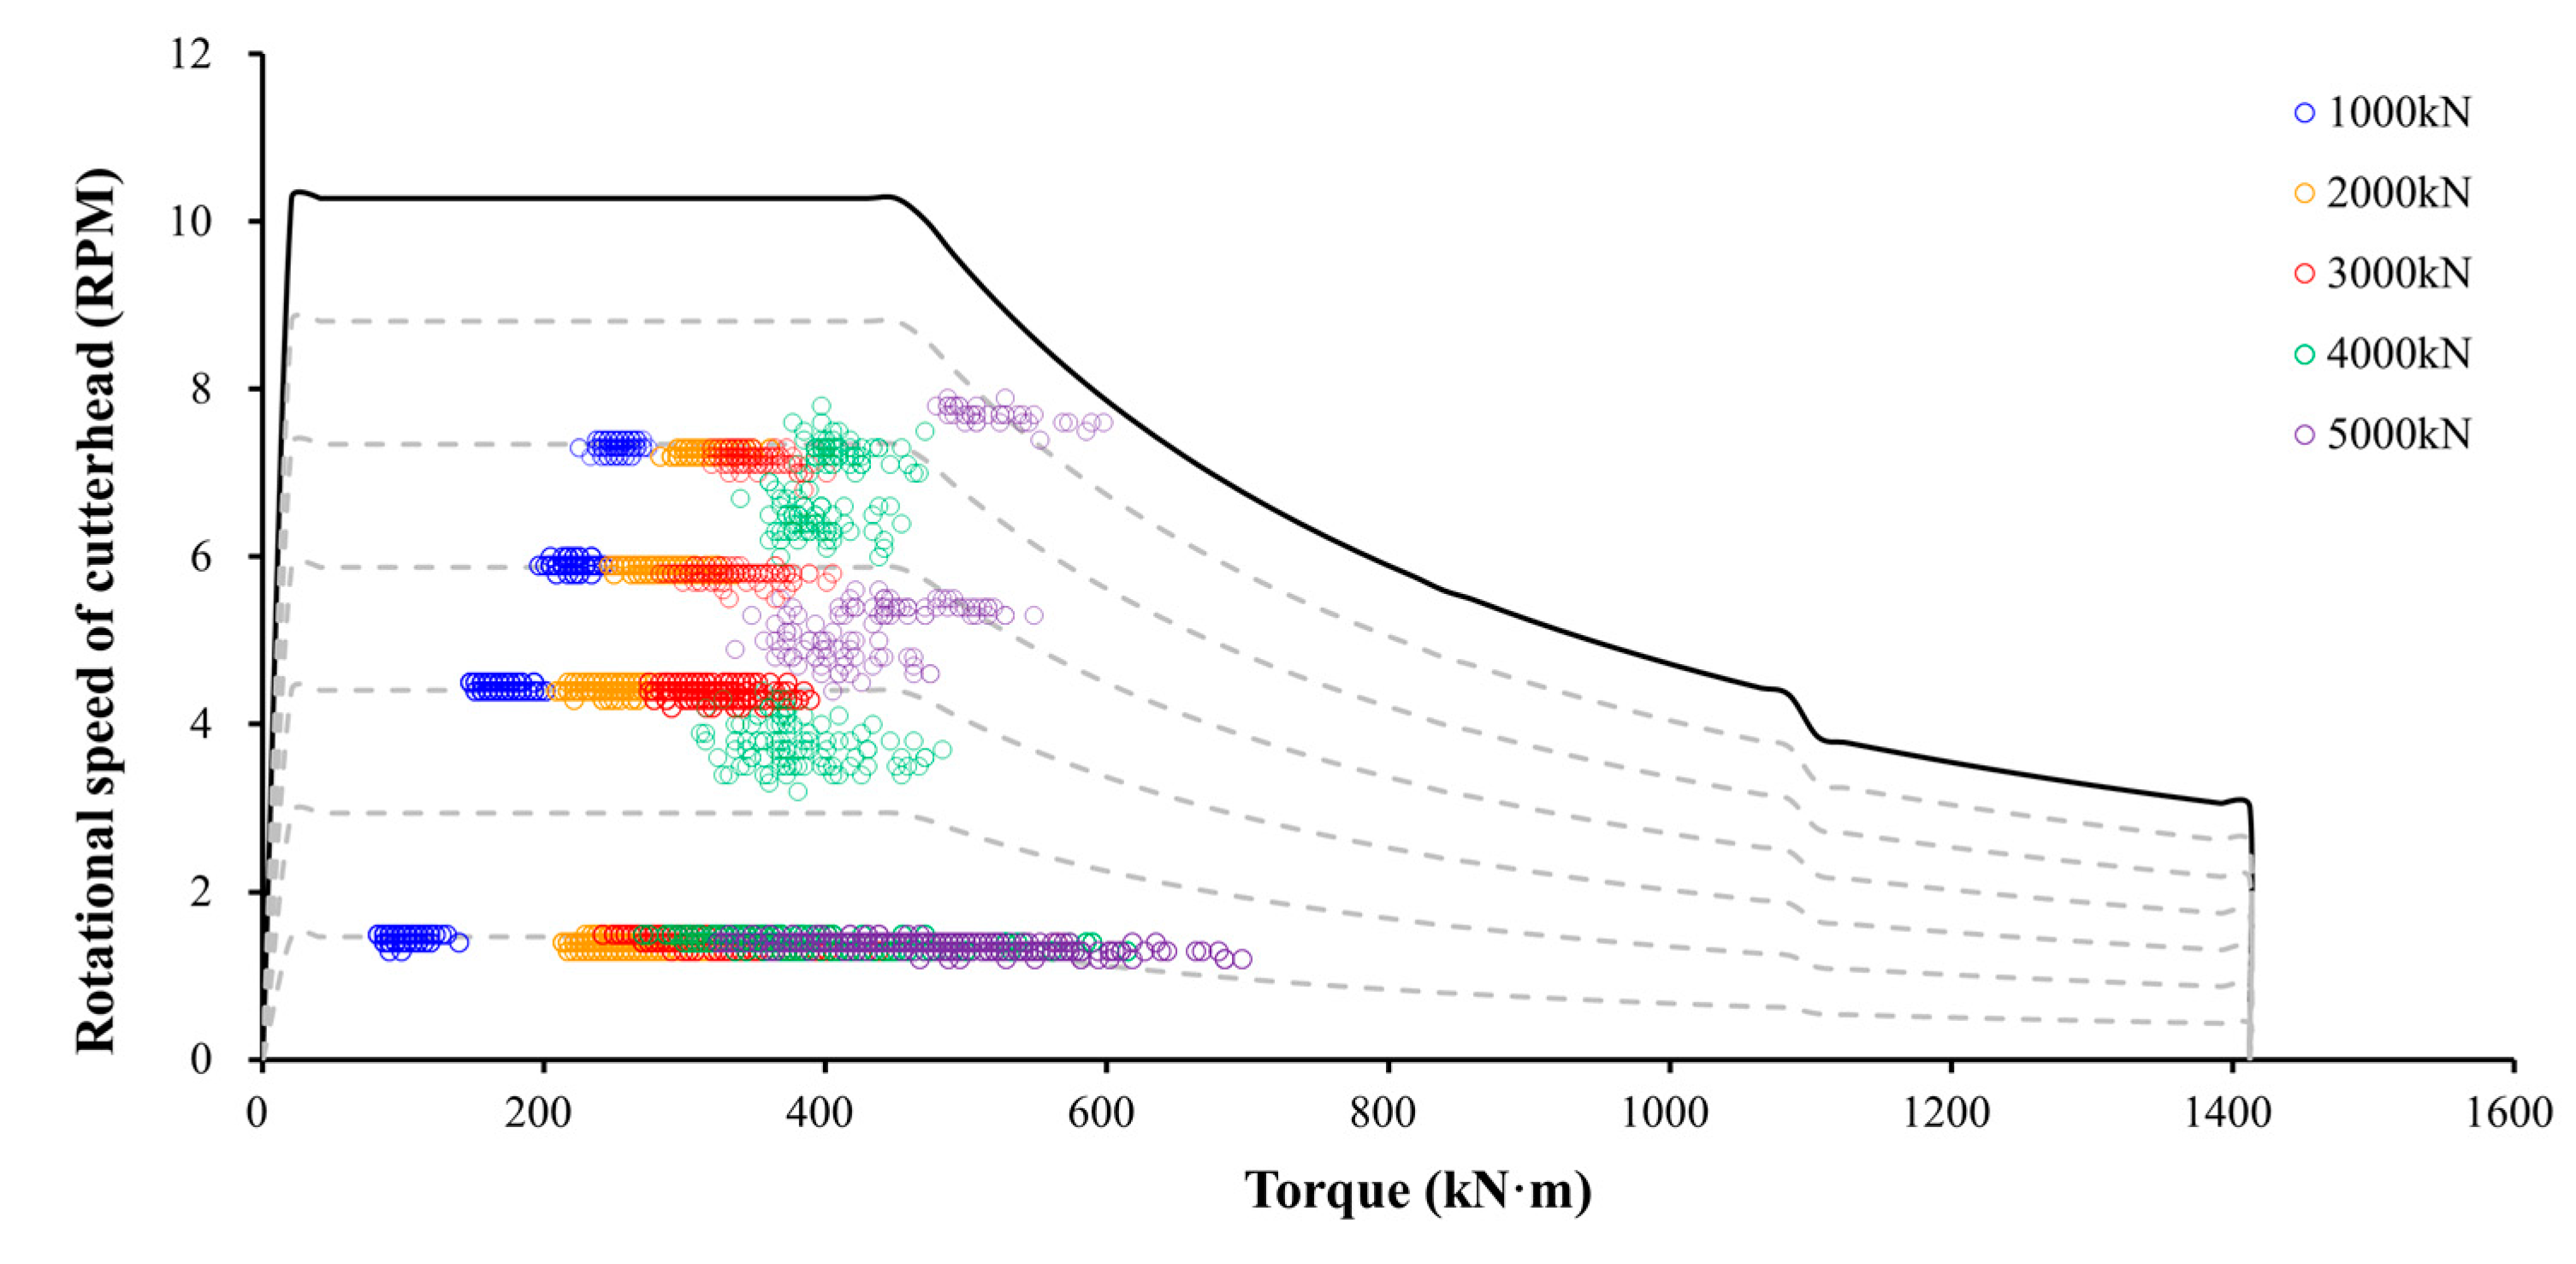
The rotational speed of the cutterhead had very little effect on the penetration depth and torque except at low RPM level, for instance, high torque development at 1.5 RPM due to an insufficient power supply is an exceptional case. Hence, when the TBM is made to advance slowly in the fractured zone, the effect of rotational speed of the cutterhead must be considered.
(5)
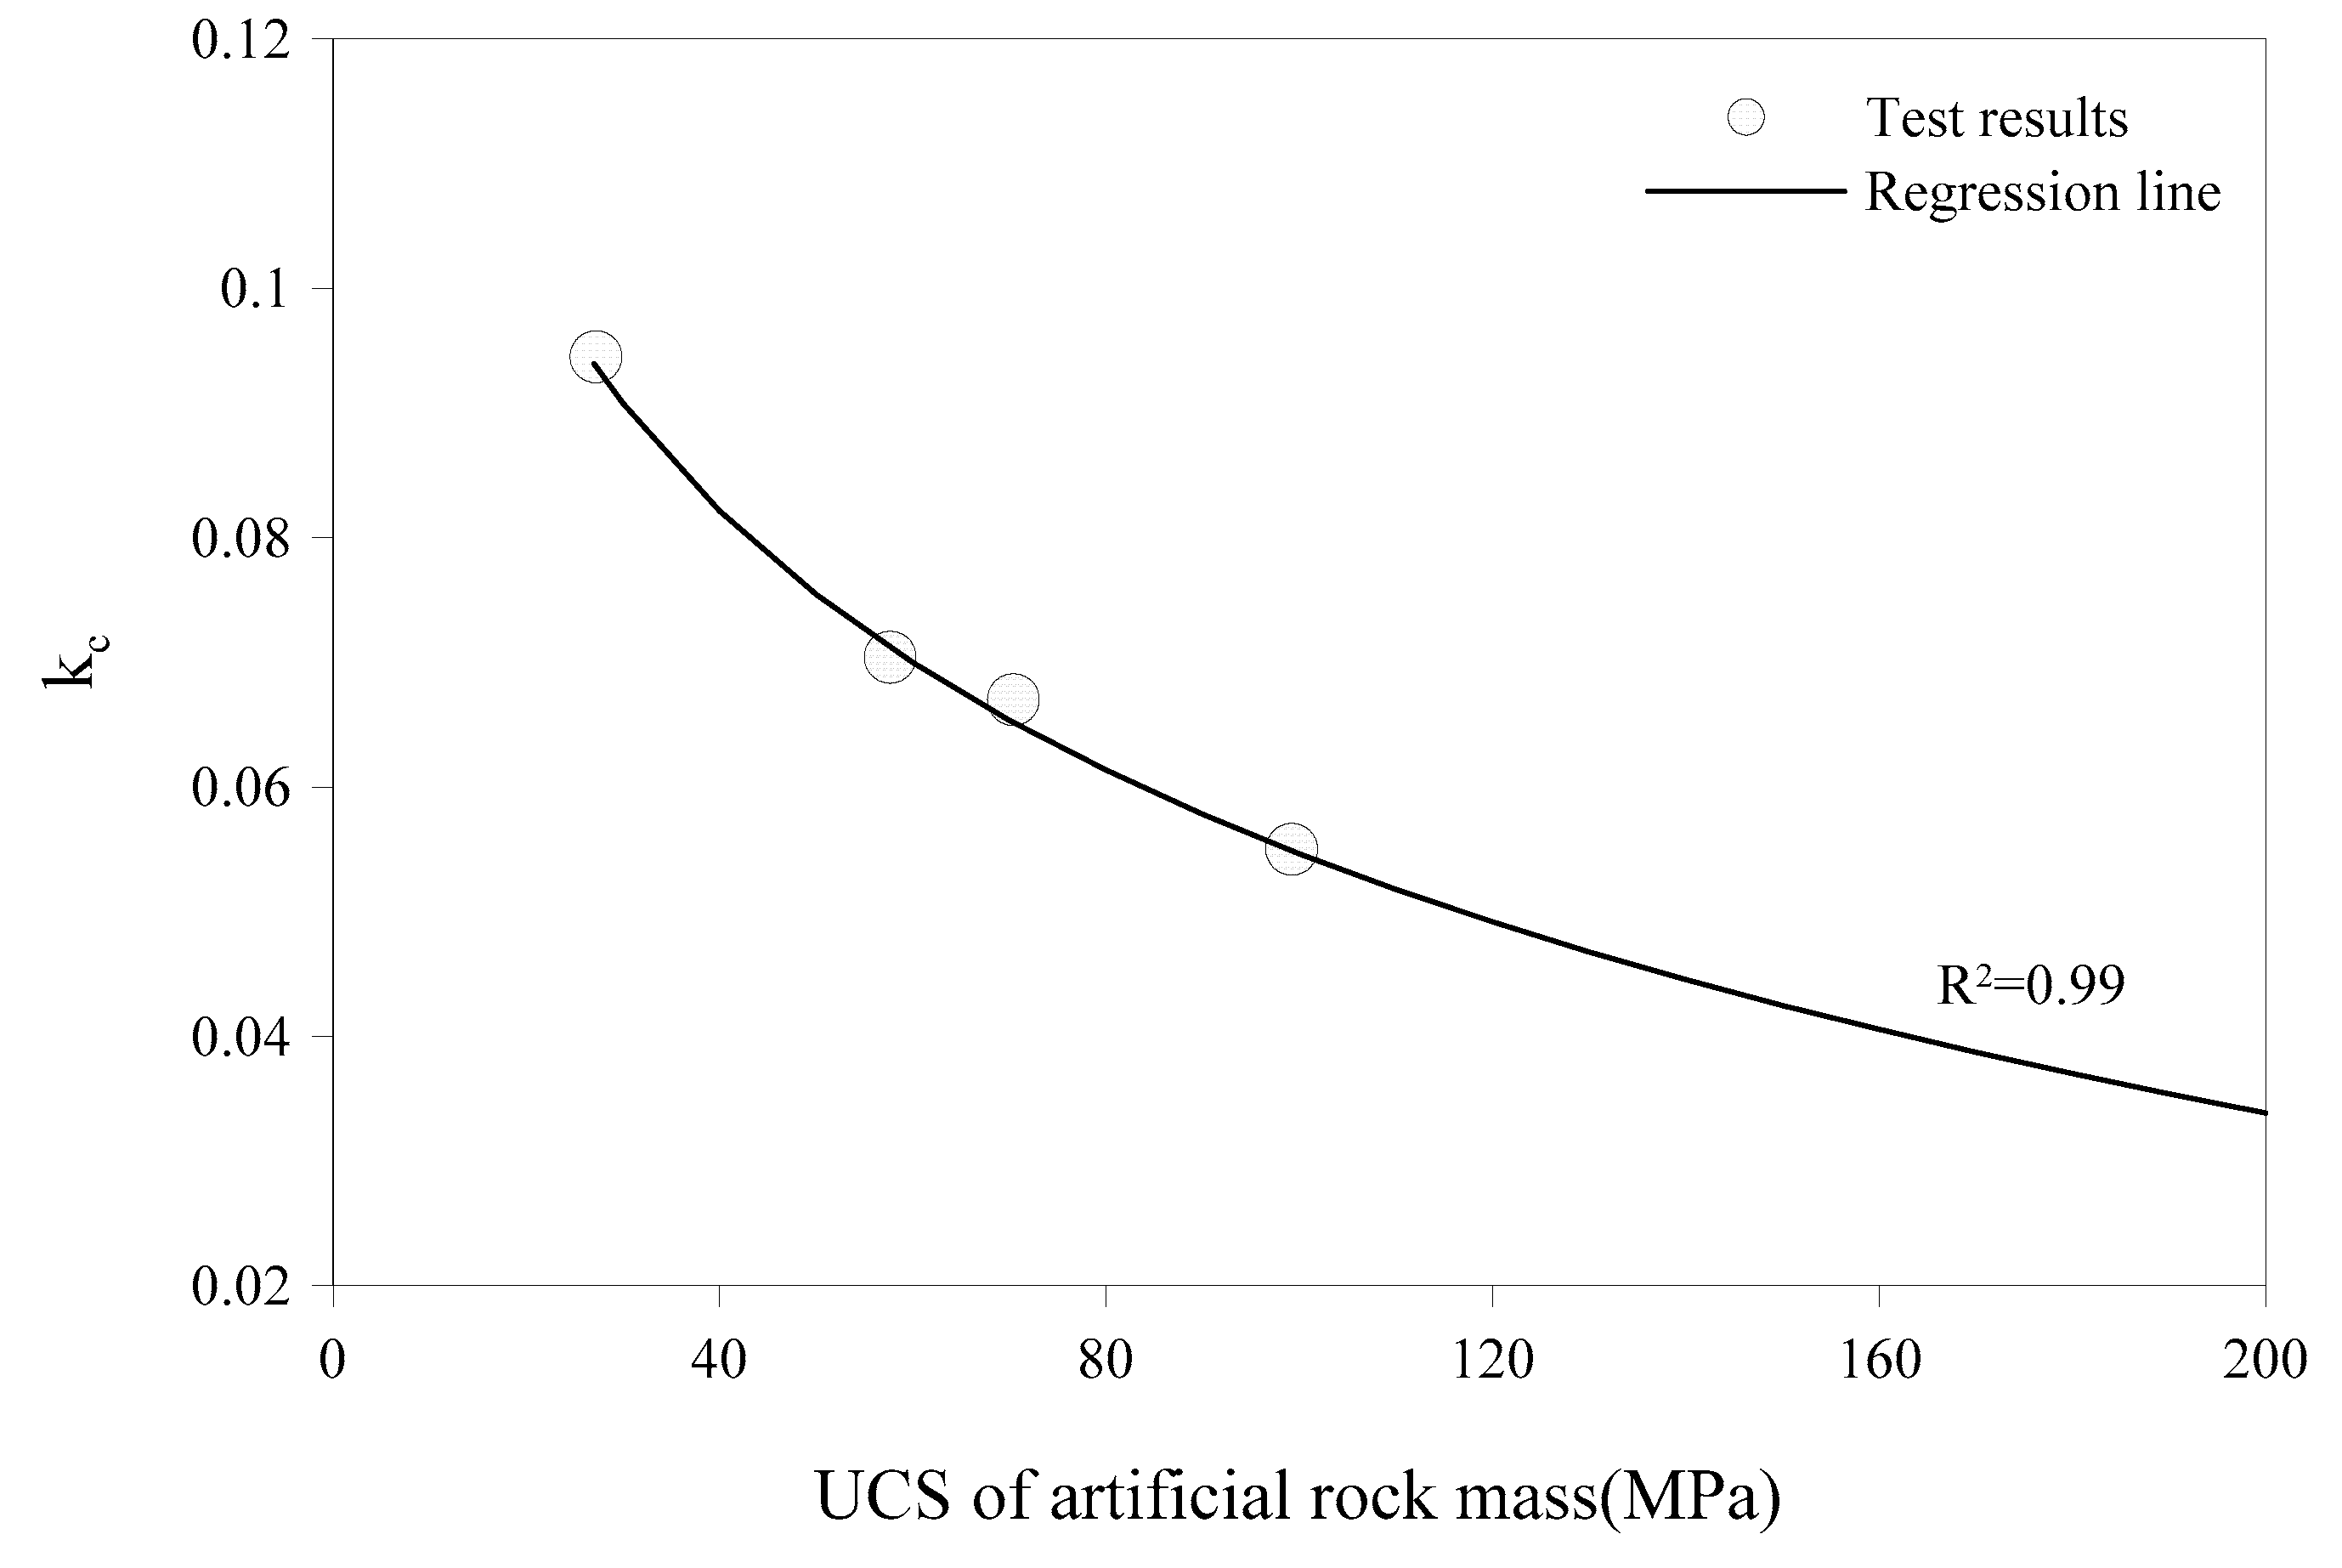
As the main outcome of this study, a torque estimation method for the cutterhead drive design is presented to be used in small diameter shield TBMs. In particular, the ratio of rolling force to normal force, kc, was newly suggested as a function of UCS of rock mass. The ratio kc can be largely varied according to UCS, and the capacity of cutterhead drive can be designed using the suggested method based on minimum UCS value because of the resulting high torque development.

Author Contributions

The main idea was conceptualized by K.K., whereas the methodology was defined by H.R. (Heehwan Ryu). Full-scale tests were conducted by H.R. (Heehwan Ryu), J.K. and the results were interpreted and analyzed by J.K. The original draft was prepared by H.R. (Hafeezur Rehman), S.H. and reviewed and edited by T.H.J. The overall work was carried out under the supervision of K.K. and H.Y. All authors have read and agreed to the published version of the manuscript.

Funding

This research work was funded by the Korea Electric Power Corporation, grant number R18SA04.

Acknowledgments

This study was made possible with the support of KAIST, EMKorea, YUJIN, and Asia cement.

Conflicts of Interest

The authors declare no conflict of interest.

Appendix A

In identical rock mass with the same UCS, the observed torque increased with the application of large thrust force due to the increase in penetration of disc cutters. However, in comparison with the results obtained at 3000 kN thrust force, some reverse trends related to the increasing rate of the torque were observed at 4000 kN of thrust force applied in 50 MPa of rock mass, as shown in Figure A1. The reason lay in the number of shield jacks pushing the rock mass. Among a total of 12 shield jacks, eight were used for the development of 3000 kN thrust force, whereas, all 12 shield jacks had to be used in case of 4000 kN thrust force. In order to control the rolling problems for conducting safe tests, the number of operational shield jacks had to be increased for increasing the thrust force levels. In order to achieve the advance rate of 1750 mm, it was necessary for the hydraulic pump to supply 49.6 L of oil to the shield jack cylinder having a cross-sectional area of 284.5 cm2. Given the identical oil supply, the extension speed of shield jacks varied according to the number of operational shield jacks. It is important to note that the extension speed of shield jacks is never the same for various advance rates, however, the effect of the number of operational shield jacks on the resulting penetration depth and the reverse trends of torque were not analyzed further. Later on, 10 shield jacks were operated to achieve 4000 kN of thrust force in order to prevent a reverse trend phenomenon. Consequentially, for all the thrust force cases, two operational shield jacks were increased with the increase of every 1000 kN in thrust force.
Figure A1. Effect of number of shield jacks being used on the relationships between torque and thrust force, (a) increasing rate of torque getting reversed at 4000 kN thrust force using 6.0 RPM; (b) Increasing rate of torque getting reversed at 4000 kN thrust force using 7.5 RPM.
Applsci 10 05187 g0a1

References

  1. Armaghani, D.J.; Mohamad, E.T.; Narayanasamy, M.S.; Narita, N.; Yagiz, S. Development of hybrid intelligent models for predicting tbm penetration rate in hard rock condition. Tunn. Undergr. Space Technol. 2017, 63, 29–43. [Google Scholar] [CrossRef]
  2. Farrokh, E. A study of various models used in the estimation of advance rates for hard rock tbms. Tunn. Undergr. Space Technol. 2020, 97, 103219. [Google Scholar] [CrossRef]
  3. Bruland, A. Hard Rock Tunnel Boring; Fakultet for Ingeniørvitenskap og Teknologi: Trondheim, Norway, 2000. [Google Scholar]
  4. Rostami, J. Development of a Force Estimation Model for Rock Fragmentation with Disc Cutters through Theoretical Modeling and Physical Measurement of Crushed Zone Pressure. Ph.D. Thesis, Colorado School of Mines Golden, Golden, CO, USA, 1997. [Google Scholar]
  5. Barton, N. TBM perfomance estimation in rock using QTBM. Tunn. Tunn. Int. 1999, 31, 30–34. [Google Scholar]
  6. Barton, N.R. Tbm Tunnelling in Jointed and Faulted Rock; CRC Press: Boca Raton, FL, USA, 2000. [Google Scholar]
  7. Bieniawski, Z.; Celada, B.; Galera, J.; Tardáguila, I. New Applications of the Excavability Index for Selection of Tbm Types and Predicting Their Performance; ITA World Tunneling Congress: Agra, India, 2008. [Google Scholar]
  8. Bieniawski, Z.; Grandori, R. Predicting tbm excavability-part ii. Tunn. Tunn. Int. 2007. [Google Scholar]
  9. Grima, M.A.; Bruines, P.; Verhoef, P. Modeling tunnel boring machine performance by neuro-fuzzy methods. Tunn. Undergr. Space Technol. 2000, 15, 259–269. [Google Scholar] [CrossRef]
  10. Grima, M.A.; Grima, M.A. Neuro-Fuzzy Modeling in Engineering Geology: Applications to Mechanical Rock Excavation, Rock Strength Estimation, and Geological Mapping; A.A. Balkema Rotterdam: Avereest, The Netherlands, 2000. [Google Scholar]
  11. Hassanpour, J.; Rostami, J.; Firouzei, Y.; Tavakoli, H. (Eds.) Optimizing tbm cutterhead design for application in very strong and abrasive rocks, case study of kerman water tunnel. In Tunnels and Underground Cities. Engineering and Innovation Meet Archaeology, Architecture and Art; CRC Press: Boca Raton, FL, USA, 2019; pp. 3803–3813. [Google Scholar]
  12. Zare, S.; Bruland, A. Applications of ntnu/sintef drillability indices in hard rock tunneling. Rock Mech. Rock Eng. 2013, 46, 179–187. [Google Scholar] [CrossRef]
  13. Jing, L.-J.; Li, J.-B.; Yang, C.; Chen, S.; Zhang, N.; Peng, X.-X. A case study of tbm performance prediction using field tunnelling tests in limestone strata. Tunn. Undergr. Space Technol. 2019, 83, 364–372. [Google Scholar] [CrossRef]
  14. Hassanpour, J.; Rostami, J.; Zhao, J. A new hard rock tbm performance prediction model for project planning. Tunn. Undergr. Space Technol. 2011, 26, 595–603. [Google Scholar] [CrossRef]
  15. Farrokh, E.; Rostami, J.; Laughton, C. Study of various models for estimation of penetration rate of hard rock tbms. Tunn. Undergr. Space Technol. 2012, 30, 110–123. [Google Scholar] [CrossRef]
  16. Gong, Q.; Zhao, J.; Jiang, Y. In situ tbm penetration tests and rock mass boreability analysis in hard rock tunnels. Tunn. Undergr. Space Technol. 2007, 22, 303–316. [Google Scholar] [CrossRef]
Figure 1. An earth pressure balance (EPB) shield TBM and test facilities for full-scale tunneling tests, (a) TBM assembly in the test facility; (b) Side view of the rock box having artificially developed rock mass.
Applsci 10 05187 g001
Figure 2. Cutterhead design and tunnel face, (a) Schematic view of cutterhead design; (b) sectional view depicting cutterhead spacing design; (c) Excavation front.
Applsci 10 05187 g002
Figure 3. Hydraulic pumps and related units for cutterhead drive.
Applsci 10 05187 g003
Figure 4. Cutterhead drive capacity expressed by relationships between torque and rotational speed of cutterhead.
Applsci 10 05187 g004
Figure 5. View of artificial rock mass and rock box at various stages, (a) during preparation of artificial rock mass in rock box; (b) view of the rock box after tests.
Applsci 10 05187 g005
Figure 6. Machine data profiles developed with respect to TBM advancement, (a) advance length and thrust force; (b) rotational speed of cutterhead; (c) oil pressure from the pumps.
Applsci 10 05187 g006
Figure 7. Relationships between penetration depth and torque, (a) At 1.5 RPM; (b) At 4.5 RPM; (c) At 6.0 RPM; (d) At 7.5 RPM.
Applsci 10 05187 g007aApplsci 10 05187 g007b
Figure 8. Relationships between thrust force and torque at different RPM levels of cutterhead, (a) At 1.5 RPM; (b) At 4.5 RPM; (c) At 6.0 RPM; (d) At 7.5 RPM.
Applsci 10 05187 g008aApplsci 10 05187 g008b
Figure 9. Regression lines of the relationships between thrust force and torque according to the UCS (Uniaxial compressive strength) of rock mass.
Applsci 10 05187 g009
Figure 10. Relationships between normal and rolling force on single disc cutter derived from regression analysis at different UCS levels of artificial rock mass, (a) In 20 MPa UCS; (b) In 50 MPa UCS; (c) In 70 MPa UCS; (d) In 100 MPa UCS.
Applsci 10 05187 g010aApplsci 10 05187 g010b
Figure 11. kc values according to UCS of artificial rock mass.
Applsci 10 05187 g011
Figure 12. Relationships between normal and rolling forces suggested in this study.
Applsci 10 05187 g012
Table 1. Specifications of the developed EPB shield TBM.
Design ParametersSpecifications
Disc cutter26 pieces each of 17 in. size
(6 center, 12 face, 8 gage)
68.5 mm average spacing
Shield body3540 mm (Shield diameter), 7240 mm (Length)
Cutterhead3622 mm (Cutting diameter), 3560 mm (Cutterhead diameter)
Maximum 1309 kN·m torque
Maximum 10.5 RPM (Revolutions per minute) rotation speed
19.3% open ratio
Up to 5 bar of seal protection
Shield jackMaximum 12,000 kN thrust force
1750 mm stroke
Articulation jackMaximum 10,000 kN thrust force
X Type
Table 2. Test cases having variation of UCS in this study.
Test CasesPlanned UCS(MPa)Measured UCS(MPa)Material
Test# 12027Mortar
Test# 25057 (average)Concrete
Mortar
Test# 37070Concrete
Test# 410099Mortar
Table 3. TBM operational parameters applied in various test cases.
Design ParametersCases
Thrust force(kN)1000, 2000, 3000, 4000, 5000
RPM (rev/min)
(It can be varied according to torque-RPM relationships)
1.5 (1 pump, 90 kW), 4.5 (3 pumps, 270 kW),
6.0 (4–5 pumps, 360–450 kW), 7.5 (5–7 pumps, 450–640 kW)

