Article

A Hybrid Weight Assignment Model for Urban Underground Space Resources Evaluation Integrated with the Weight of Time Dimension

1
School of Geosciences and Info-Physics, Central South University, Changsha 410083, China
2
Laboratory of GeoHazards Perception, Cognition and Prediction, Central South University, Changsha 410083, China
3
Nanjing Center, China Geological Survey, Nanjing 210016, China
4
Engineering Innovation Center for Urban Underground Space Exploration and Evaluation, Ministry of Natural Resources of the People’s Republic of China, Nanjing 210016, China
*
Author to whom correspondence should be addressed.
Appl. Sci. 2020, 10(15), 5152; https://doi.org/10.3390/app10155152
Submission received: 1 July 2020 / Revised: 24 July 2020 / Accepted: 24 July 2020 / Published: 27 July 2020
(This article belongs to the Section Civil Engineering)

Abstract

:
The utilization of urban underground space resources (UUSR) are important approaches to effectively save land resources, improve the living environment, expand the urban space, and achieve sustainable urban development. To obtain accurate UUSR evaluation results, the weight assignment of indicators plays an important role in the evaluation process and is an indispensable part of it. Reasonable weights of indicators can greatly improve the accuracy of the final UUSR evaluation results. Neither the basic characteristics of cross-section data and time series data of UUSR evaluation indicators are taken into consideration simultaneously, nor is the combination and cross application of different weighting methods in the previous weight assignment of UUSR evaluation indicators. Considering the influence of the time dimension, the weighting method of time dimension is introduced into the UUSR evaluation. Through integrating the classical entropy weight method, which is a frequently-used weighting method of indicator dimension with the weighting method of time dimension in two different approaches by time ordered weighted averaging (TOWA) operator, the hybrid weight assignment model named entropy and time weighting model (E-TW) for UUSR evaluation is proposed. The experimental calculation results show that the UUSR evaluation results using the E-TW model are significantly better than the results using the single classical entropy weight method, which means the hybrid weight assignment model is more suitable for UUSR evaluation than the single weighting method of indicator dimension.

1. Introduction

Urban underground space resources (UUSR) have the dual attributes of natural environment and natural resources. They are the foundation of urban survival and development, which are affected and restricted by conditions of geology, rock and soil, economy, society, construction, geographical location, and policy, etc. With the progress of urbanization, underground spaces gradually carry more and more urban functions (e.g., subways, underground pipe networks, underground corridors, underground storage, and underground commercial complexes). Meanwhile, urban development space is gradually extending from the ground and its upper space to the high-density underground space [1,2,3,4]. Countries and regions around the world uphold some advanced concepts, including urban three-dimensional planning, city-orientation, and comprehensive utilization of underground space to plan and develop urban underground space, such as the Netherlands [5], Hong Kong [6], Sweden [7], and La Coruna in Spain [8], etc. Studies have shown that scientific and rational planning and layout of underground space resources can adjust the existing land use structure, improve the land development utilization rate, achieve the urban land intensive use to a large extent, and reduce the development risk of underground space [9,10,11]. Finally, UUSR can solve many problems occurred in the process of urbanization, such as urban land growth, traffic congestion, environmental degradation, and urban microclimate change [12,13,14,15]. Therefore, scientific, orderly, and rational planning, development, and utilization of UUSR are important approaches to effectively save land resources, improve the living environment, expand the urban space, and achieve sustainable urban development. In brief, it is of great significance to promote the sustainable development of cities and the safe use of underground space resources [16,17,18,19].
UUSR play a very important role in the urbanization process and have received much attention in this era. Scholars have carried out exploratory researches and applied practice in UUSR evaluation from the perspectives of the connotation of elements, evaluation indicators, weight assignment models, mathematical models, scale effects, spatial modeling and visualization, practice models, and result expression [20,21,22]. Assigning reasonable weights to indicators is critical to UUSR evaluation and can greatly improve the accuracy of the final evaluation results. To address this issue, various mathematical methods have been designed from different perspectives to the weight assignment of UUSR evaluation indicators. According to the types of weighting methods, they were divided into: (1) subjective weighting methods (e.g., Delphi method and analytic hierarchy process (AHP) method), and (2) objective weighting methods (e.g., entropy weight method). For instance, the Delphi method was used for weight assignment of indicators [23], with the advantages of simplicity and easy-to-use features. The Delphi method, however, overemphasizes the subjective opinions of experts, and it is difficult to determine the differences between evaluation indicators. Thus, the accuracy and reliability of the weights calculated by Delphi method are poor. Because of these weaknesses, it is less used for calculating the weights of indicators but more applied for developing the indicators [24,25,26,27,28,29,30]. The AHP method was utilized to assign the weights through constructing the judgment matrix of evaluation indicators. To tackle this issue that the judgment matrix is challenging to obtain partly, the optimal transfer matrix was applied to optimize the traditional AHP method, so as to determine the weights of UUSR evaluation indicators more rationally [14,31,32,33]. Despite this effort, when the AHP method is used to calculate the weight, the construction of judgment matrix of evaluation indicators is still not easy. Especially for the multi-objective evaluation system, the more the number of evaluation indicators, the more difficult the construction of judgment matrix. It often needs to be modified many times, so as to reach the standard of consistency test [34,35,36,37,38]. By contrast to subjective weighting methods that rely on the experience of experts, the entropy weight method [39,40] depends on the data of evaluation indicators to calculate the weights used for UUSR quality evaluation, which can effectively reduce the subjectivity of the weight assignment and make the weight calculation result more objective.
On the basis of many applications of weight assignment models for UUSR evaluation indicators [14,23,31,32,33], we found that they still have many shortcomings and utilization limitations. No matter whether they are subjective or objective, weighting methods are simplistic and homogenized for UUSR evaluation. In detail, the Delphi, AHP, and the entropy weight methods are always used separately for UUSR evaluation, which means that it is less involved in the combination of different weighting methods and the cross application of weight assignment models of other disciplines. Additionally, the above weighting methods only carry out the UUSR evaluation on the level of indicator dimension, without taking the dynamic changes of the values of UUSR evaluation indicators into account, that is, the timing characteristics of time series data of evaluation indicators have not been considered. Moreover, the quality control methods for the weight assignment of indicators remain an unresolved problem. Therefore, for enriching the weighting methods of traditional indicator dimension, and adding the influence of the timing characteristics of indicators into the UUSR evaluation, the hybrid weight assignment model is proposed by integrating with the weight of time dimension in this research.

2. Data Characteristics of UUSR Evaluation Indicators

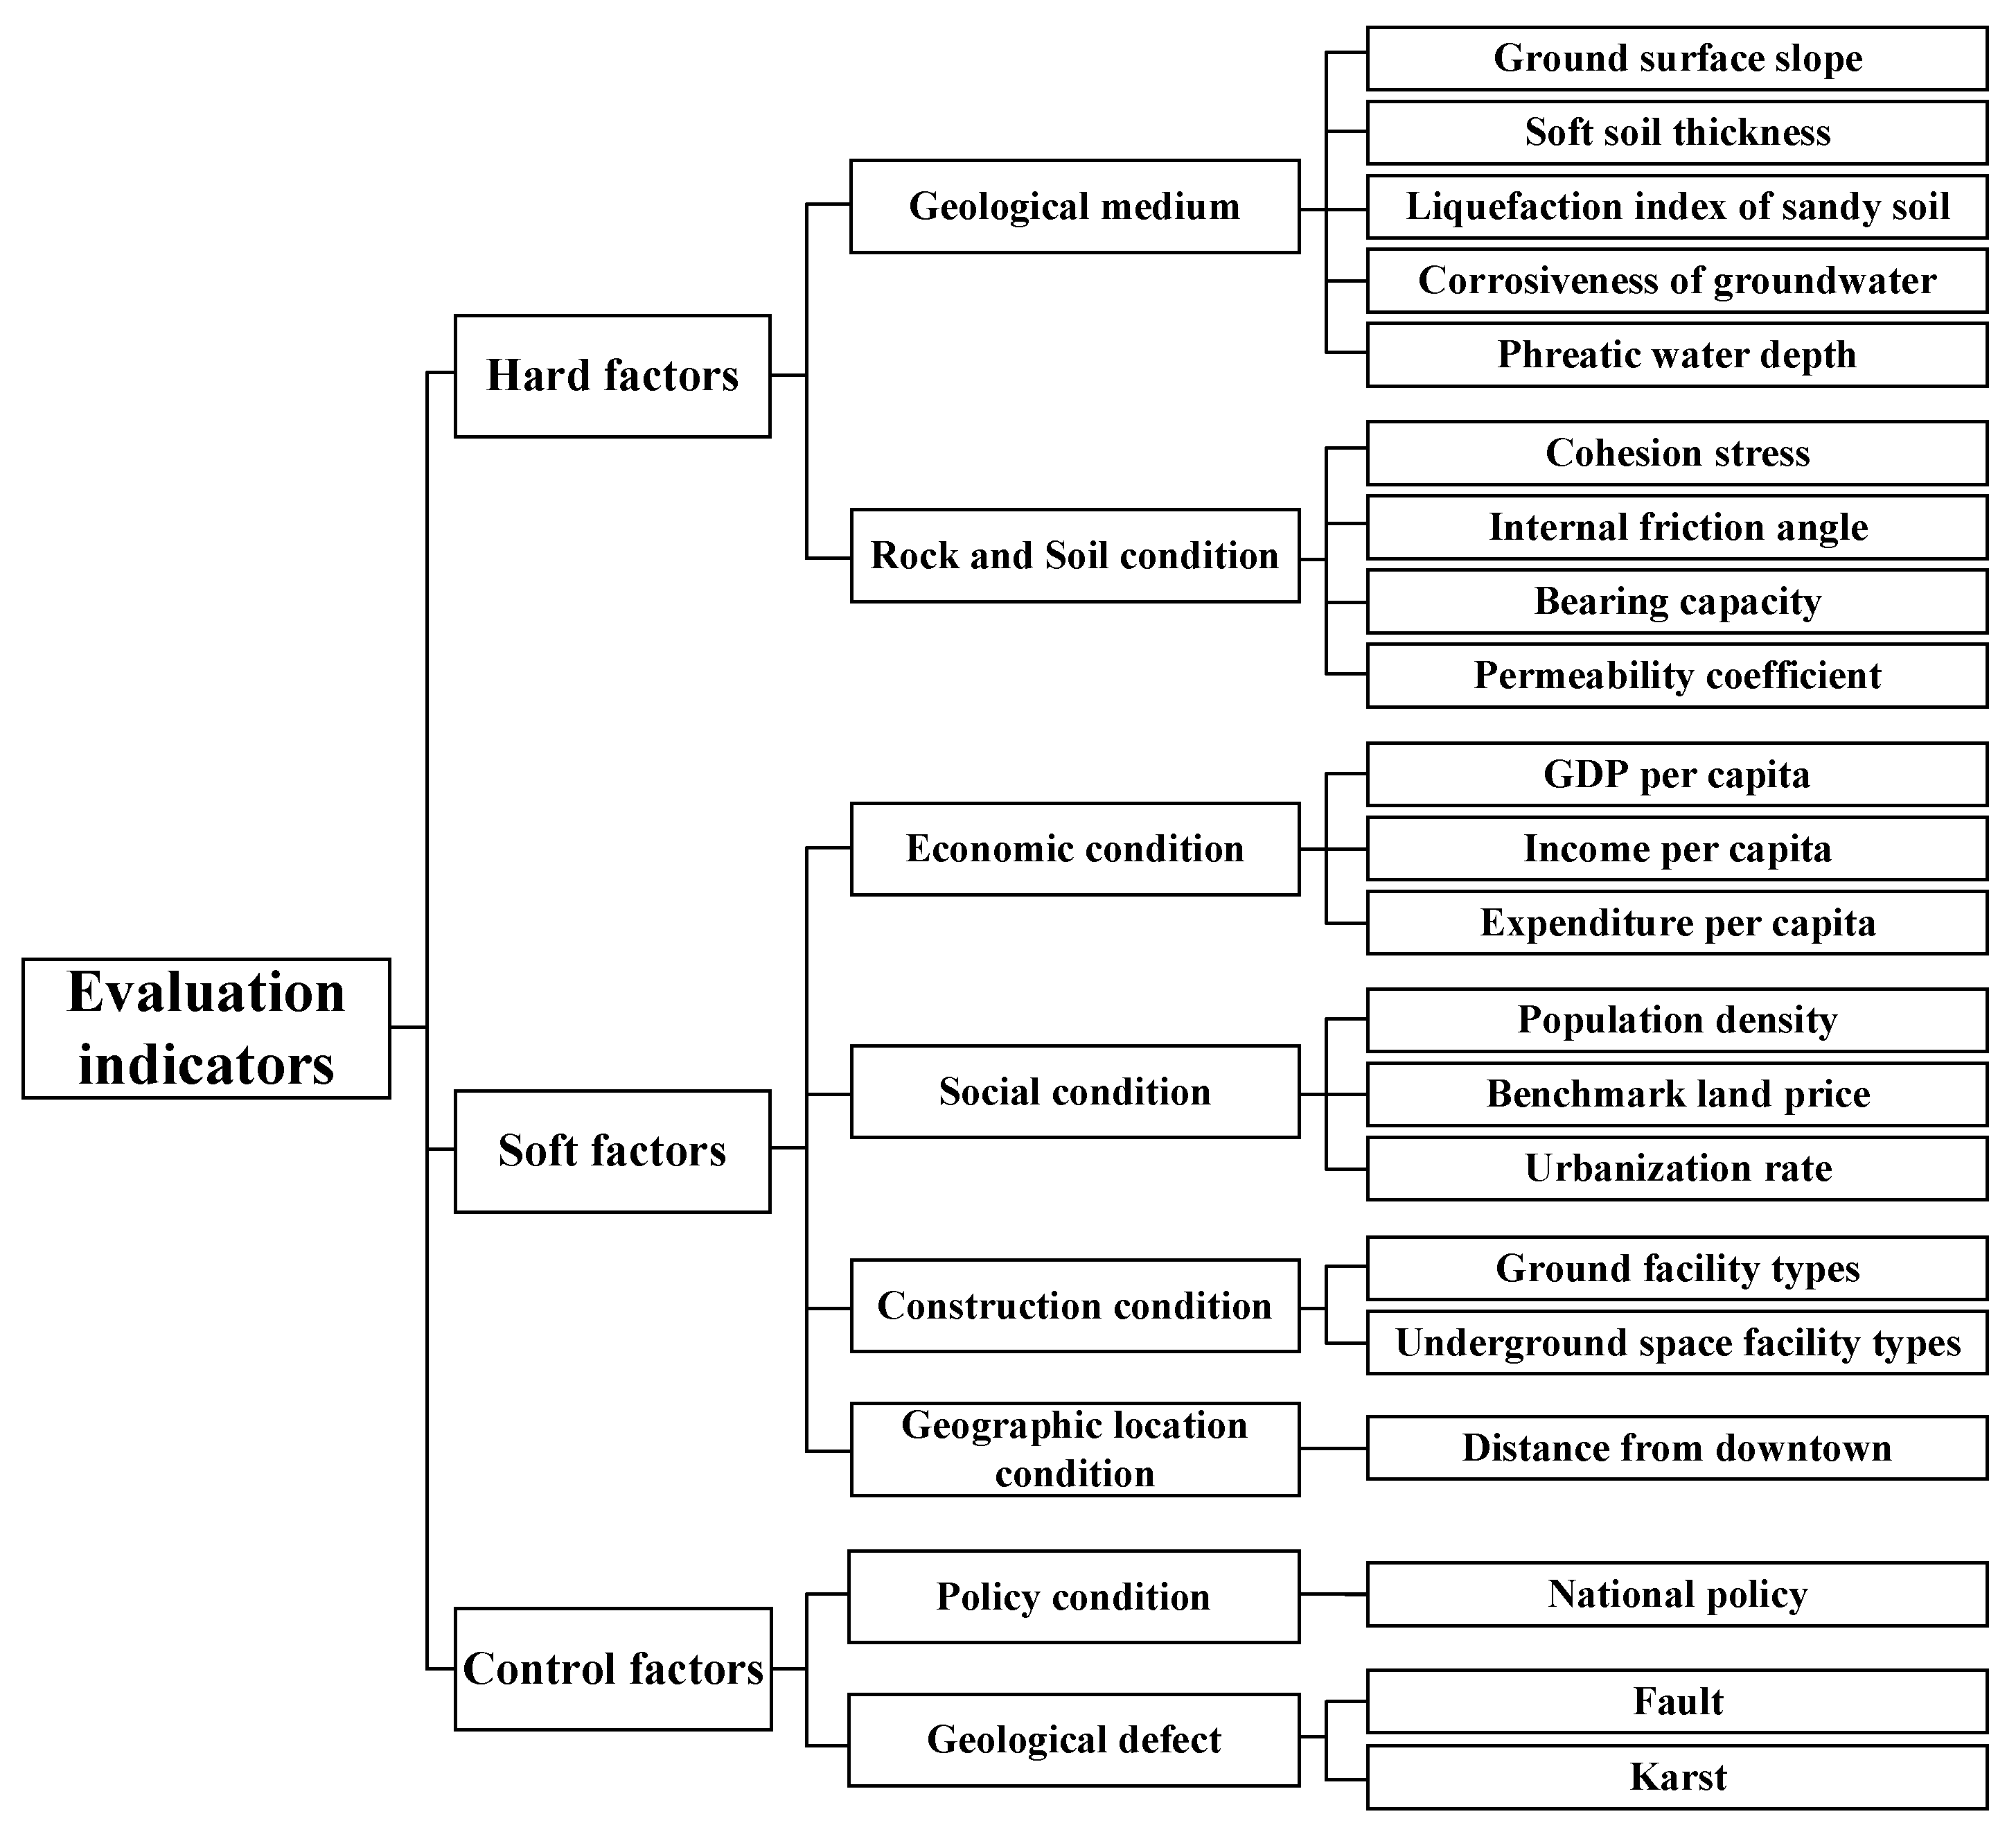
2.1. Evaluation Indicators

For analyzing the indicators utilized for UUSR evaluation, it needs to be considered from three aspects, including combining the extant indicators system for different objects; measuring the impact of urban geological types, the size of the evaluation scale, and the difficulty of data acquisition from the perspective of total factor evaluation; and integrating with the dynamic change characteristics of evaluation indicators. Following the principles of scientific nature, systemic nature, temporal nature, the nature of scale, and the nature of easy accessibility, evaluation indicators of UUSR comprehensive quality are determined, including hard factors, soft factors, and control factors, as seen in Figure 1. Among them, soft soil thickness, liquefaction index of sandy oil, and distance from downtown are negative indicators, and the others are positive indicators.

2.2. Data Characteristics

Generally, different indicators for UUSR evaluation have a static value at a fixed time point or section, that is, the data of these indicators are a kind of cross-section data. Meanwhile, the same evaluation indicator of UUSR has different values in the dynamic evolution process, which means the data of these indicators show the characteristics of time series data. For instance, the population density of a city is not immutable, that is, it has different static values on the time vector T = ( t 1 , t 2 , ,   t n ) , which form a time series data V = ( x t 1 , x t 2 , , x t n ) in this continuous period. Overall, the indicators data used in UUSR evaluation are often a data set obtained by multiple evaluation indicators at multiple time points in the time series, which means it has the characteristics of both cross-section data and time series data. In other words, the data set of these indicators is a type of panel data, as seen in Table 1, where x m n t s represents the original static value of the nth indicator of the evaluation object m at the sth moment. In order to reflect the static features and dynamic evolution characteristics of the data of UUSR evaluation indicators, the weighting method of time dimension should be introduced to improve the traditional weighting method of indicator dimension for UUSR evaluation, so as to carry out the UUSR evaluation more effectively.

3. Hybrid Weight Assignment Model

3.1. Entropy Weight Method

The entropy weight method is a mathematical method that calculates a comprehensive index ( W e = ( w 1 e , w 2 e , , w n e ) ) based on the amount of information transmitted to the decision maker by various factors [41]. As an objective weighting method, the entropy weight method could solve the problem of large information and difficult quantification of UUSR evaluation indicators, and express the amount of information contained in the indicators to the greatest extent. On the basis of the objectivity and data dependence of the entropy weight method, it has been used for the weight assignment of UUSR evaluation indicators in many cases.
The entropy weight method has nothing to do with personal experience, only the data value of indicators. As a matter of fact, the bigger the difference in values between the same indicator, the greater the weights. Combined with the characteristics of the panel data displayed by the data value of UUSR evaluation indicators, the entropy weight of indicator dimension ( w j e ) is determined by calculating the indicator entropy value ( H j ). The calculation steps are shown concretely below.
(1) The standardized value ( a i j ) of the original statistical value ( x i j ) of evaluation indicator can be obtained as:
a i j = x i j x m i n x m a x x m i n
a i j = x m a x x i j x m a x x m i n
where x i j is the statistical value of the jth indicator of object i ( i = 1 , 2 , , m ; j = 1 , 2 , , n ). Equations (1) and (2) are used for the positive indicators and negative indicators respectively.
(2) The entropy value ( H j ) can be calculated by the standardized value ( a i j ). Its expression is:
H j = 1 l n m i = 1 m a i j i = 1 m a i j l n a i j i = 1 m a i j
where H j is the entropy value of the jth evaluation indicator, and an assumption is made:
a i j i = 1 m a i j = 0 ,   a i j i = 1 m a i j l n a i j i = 1 m a i j = 0 .
(3) The entropy weight of indicator dimension ( w j e ) can be calculated as follows:
w j e = 1 H j j = 1 n ( 1 H j )
where w j e is the entropy weight of the jth evaluation indicator, and j = 1 n w j e = 1 .

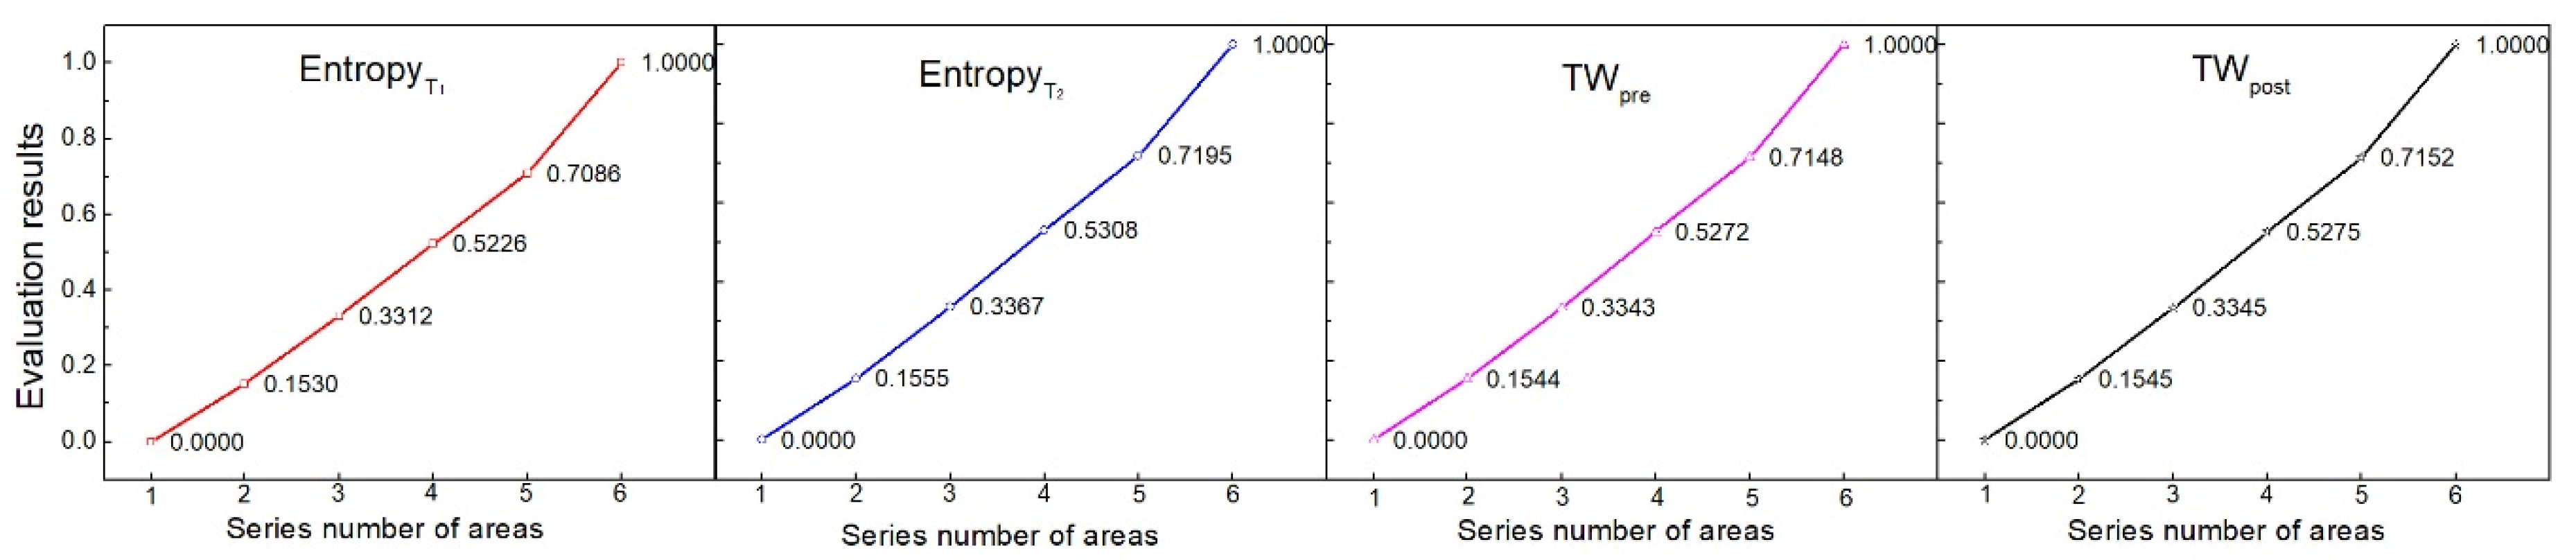
3.2. Weighting Method of Time Dimension

In general, the evaluation results are affected by the different data values of indicators at different time points or sections in the comprehensive evaluation process. Therefore, it is necessary to analyze the important influence of time for the evaluation indicators. In order to reflect the static features and dynamic evolution characteristics of the data of UUSR evaluation indicators, the weighting method of time dimension could be introduced into the UUSR evaluation. In the previous research, the weight of time dimension has been discussed based on the concepts of the entropy of the time weights (I) and the time degree (λ) [42].
The entropy of the time weights (I) is utilized to describe the degree of information contained in the weight of time dimension during the aggregation of data at different moments. Actually, the bigger the entropy of time weight vector, the smaller the difference between the weights of time dimension, the smaller the degree of dispersion, the smaller the uncertainty, the greater the amount of information, and vice versa. The mathematical calculation model is:
I = k = 1 s w k t l n w k t
where w k t is the weights of time dimension of the kth moment, and k = 1 s w k t = 1 .
The time degree (λ) is applied to describe the importance of time series at different moments in the data aggregation process. As a matter of fact, the smaller the time degree, the more attention is paid to the time data closer to the evaluation moment ( t p ), and vice versa. It can be determined by experts according to Table 2 [43], and the relationship between the time degree and the weights of time dimension is shown as follows:
λ = k = 1 s s k s 1 w k t
The time weighting vector W t = ( w 1 t , w 2 t , , w n t ) can be calculated by the following two principles. First, the time degree (λ) is subjectively determined by the literature and the opinions of experts. Second, the difference between the time weights can be ensured to be minimum under the premise of mining the amount of information of the data and the time difference of the data as much as possible, that is, the entropy of the time weights vector is guaranteed to be maximum. The mathematical calculation models are:
m a x I = k = 1 s w k l n w k t { λ = k = 1 s s k s 1 w k t k = 1 s w k t = 1 k = 1 , 2 , , s

3.3. Hybrid Model

In the UUSR multi-indicators dynamic comprehensive evaluation, the change range, and trend of the values of evaluation indicators over time will affect the weight assignment of indicators. Therefore, it is necessary to take the characteristics of dynamic change of the values of evaluation indicators under the influence of the time dimension into consideration on the basis of carrying out the UUSR evaluation utilized by the weights of indicators dimension only. As the UUSR evaluation indicators have strong complementarity in different periods, the hybrid weight assignment model named entropy and time weighting model (E-TW) is proposed by integrating the classical entropy weight method with the weighting method of time dimension in two different approaches by time ordered weighted averaging (TOWA) operator. The E-TW can be subdivided into the time weighted preposition method ( TW pre ) and time weighted postposition method ( TW post ) based on the different order of the time weights used in the weighting process.

3.3.1. Time Ordered Weighted Averaging Operator

In order to introduce the impact of the time dimension on the evaluation indicators, the time ordered weighted averaging (TOWA) operator [43] has been presented on the basis of the ordered weighted averaging (OWA) [42], the induced ordered weighted averaging (IOWA) [44], the ordered weighted geometric (OWG) [45], and the induced ordered weighted geometric averaging (IOWGA) [46]. The mathematical calculation model is:
F ( t 1 , a 1 , t 2 , a 2 , , t k , a k , , t s , a s ) = k = 1 s w k b k
where t k , a k is the basic pair of TOWA operator; t k is the time induced component and a k is the data component ( k = 1 , 2 , , s ); w k is the weight of the same element at the kth moment in the time induced component, w k [ 0 , 1 ] ; and k = 1 s w k = 1 ; b k is the data component of the TOWA pair corresponding to the kth moment in the time induced component of the same element; and F is the n dimensional TOWA operator.
The essence of the TOWA operator is to perform weighted summation of the data components ( a 1 , a 2 , , a s ) of the same element corresponding to the time induced components sorted in a certain time sequence.

3.3.2. Time Weighted Preposition Method

The time weighted preposition method ( TW pre ) is a weighting method that considers the influence of time dimension, firstly, and then reflects the influence of indicators dimension. The processing steps are shown concretely below.
(1) The weight of time dimension w k t is utilized to perform weighted average processing on the original panel data x i j ( t k ) of the UUSR evaluation objects at different moments based on the TOWA operator. Thus, the panel data are converted into static cross-section data x i j . They focus on the effect of time on the evaluation indicators in data processing. The mathematical calculation model is:
x i j = F ( t 1 , x i j ( t 1 ) , t 2 , x i j ( t 2 ) , , t k , x i j ( t k ) , , t s , x i j ( t s ) ) = k = 1 s w k t x i j ( t k )
where k = 1 , 2 , , s , i = 1 , 2 , , m , and j = 1 , 2 , , n .
(2) The standardized value a i j is obtained from the cross-section data x i j by extremal processing. Combined with the evaluation indicators and the traditional evaluation mathematical model G ( w , a ) (e.g., multi-objective linear weighting function G ( w , a ) = j = 1 n w j . a j ), the UUSR is evaluated using the weight of indicators dimension w j e to obtain the final evaluation result V i of the evaluation object i. The mathematical calculation model is:
V i = G ( w j e , a i j )

3.3.3. Time Weighted Postposition Method

The time weighted postposition method ( TW post ) is a weighting method that considers the influence of indicators dimension, firstly, and then reflects the influence of time dimension, just the opposite of the time weighted preposition method. The processing steps are shown concretely below.
(1) Combined with the evaluation indicators and the traditional evaluation mathematical model G ( w , a ) , the UUSR is evaluated using the original standardized data a i j ( t k ) and the weight of time dimension w j e to obtain the static evaluation results y i ( t k ) of the evaluation object i at different moments. It reflects the different data characteristics of the evaluation indicators at different moments. The mathematical calculation model is:
y i ( t k ) = G ( w j e , a i j ( t k ) )
where k = 1 , 2 , , s , i = 1 , 2 , , m , and j = 1 , 2 , , n .
(2) The weight of time dimension w k t is utilized to perform weighted average processing on the static evaluation results y i ( t k ) of the UUSR evaluation object i at different moments based on the TOWA operator. Thus, the final evaluation result V i of the evaluation object i can be obtained naturally. The mathematical calculation model is:
V i = F ( t 1 , y i ( t 1 ) , t 2 , y i ( t 2 ) , , t k , y i ( t k ) , , t s , y i ( t s ) ) = k = 1 s w k t y i ( t k )

4. Discussion

Combined with the 21 evaluation indicators of UUSR comprehensive quality given above, UUSR evaluation results using traditional entropy weight method and E-TW are carried out separately. It is necessary to verify the stability of the E-TW model and compare it with the entropy weight method for the accuracy of UUSR evaluation results. Therefore, the basic data sets of years T1 and T2 of the six urban areas of a city are virtually constructed for experimental calculation with uniform trends of change, and the data set of year T2 is assumed to be the recent data. Considering the slightly important situation of recent data, the time degree λ is selected as 0.4 based on the weighting method of time dimension. The time weighting vector calculated by Equation (7) is expressed as W t = ( w T 1 t , w T 2 t ) = ( 0.4 ,   0.6 ) . Furthermore, the UUSR evaluation results (Figure 2) are obtained respectively based on the multi-objective linear weighting mathematical model.
As shown in Figure 2, since the virtual construction data of area 1 to area 6 shows a monotonically increasing trend, the evaluation results of area 1 and area 6 are 0 and 1, respectively, because the data are standardized by using the extreme value method. Meanwhile, the evaluation results of areas 1, 2, 3, 4, 5, and 6 increase monotonically, and have strong consistency and nice calculation effects, when the UUSR evaluation is carried out by using the same weighting method, regardless of the entropy weight method or the E-TW model, which includes the time weighted preposition method and time weighted postposition method. The entropy weight method is a recognized method used in UUSR evaluation. In view of the similar consistency and calculation effect, it is reasonable for the E-TW model to be utilized in UUSR evaluation.
In addition, the degree of dispersion D i = 1 N 1 R i j is used to measure the advantages and disadvantages of the UUSR evaluation results from utilizing different weighting methods, where N is the total number of UUSR evaluation results using different weighting methods and R i j is the Euclidean distance between UUSR evaluation results, assuming R i j = 0 between the same type of results. Particularly, it indicates that the evaluation result is more reasonable than other results when the degree of dispersion is smaller.
As shown in Table 3, the degrees of dispersion have been calculated with very different results when using the entropy weight method and the E-TW model. In detail, the results are arranged in order from small to large: D TW post < D TW pre < D Entropy T 2 < D Entropy T 1 . As the different types of N-TW model, the degree of dispersion calculated by time weighted preposition method D TW post is approximately equal to 0.005157118, that is, almost the same as D TW pre which is equal to 0.005157122, approximately. Nevertheless, the degrees of dispersion of time weighted postposition method and time weighted preposition method are much smaller than those of the entropy weight method in different moments. Obviously, the hybrid weight assignment model, regardless of the time weighted preposition method or time weighted postposition method, is a suitable and reasonable weighting model for UUSR evaluation in this research.

5. Conclusions

To address the problem that the influence of the time dimension is not taken into consideration in the UUSR evaluation, a hybrid weight assignment model named entropy and time weighting model (E-TW) for UUSR evaluation is proposed by integrating the classic entropy weight method with the weight method of time dimension. This paper allows for several conclusions. First, the E-TW model can simultaneously reflect the impact of the indicator dimension and time dimension on the UUSR evaluation by combining the weighting methods of the two types of dimensions. Second, as the different order of the time weights used in the weighting process, the E-TW model is subdivided into two kinds of methods using the same TOWA operator, including the time weighted preposition method and the time weighted postposition method. Third, the evaluation results of the six areas increase monotonically and have strong consistency and nice calculation effects, when they are carried out by using the same weighting method, regardless of the classic entropy weight method or the E-TW model. Fourth, the hybrid weight assignment model, regardless of the time weighted preposition method or time weighted postposition method, is a suitable and reasonable weighting model for UUSR evaluation because of the degrees of dispersion are much smaller than those of the entropy weight method in different moments.
This study made an attempt to introduce a hybrid weight assignment model into the UUSR evaluation. However, the E-TW model contains two weight components of different dimensions, that is, the entropy weight of indicator dimension and the weight of time dimension. Due to their respective calculation principles, the utilization of the E-TW model has some limitations. In detail, for the entropy weight method, its weight calculation depends on the data of evaluation indicators, but the data may not be easy to obtain and collect completely. Besides, for the weight of time dimension, its weight calculation depends on the suitable time degree (λ), but the λ is often determined by the literature and the opinions of experts. Therefore, several aspects of this research need to be developed further, such as verifying the applicability and rationality of the E-TW model in the real case. In addition, the combination of different weighting methods using in UUSR evaluation and the cross application of weight assignment models of other disciplines need to be fully analyzed to improve the extant weighting methods based on future researches.

Author Contributions

Conceptualization, D.L. and L.W.; methodology, D.L.; software, D.L.; validation, D.L., L.W. and Y.Y.; formal analysis, D.L.; investigation, Y.Y.; resources, L.W.; data curation, Y.Y.; writing—original draft preparation, D.L.; writing—review and editing, L.W.; visualization, D.L.; supervision, L.W.; project administration, L.W.; funding acquisition, L.W. All authors have read and agreed to the published version of the manuscript.

Funding

This research was funded by the Central South University Innovation Leadership Talents Project under grant number 506030101, and Huxiang High-level Talents Aggregation Project Innovation Talents Project under grant number 2018RS3013.

Conflicts of Interest

The authors declare no conflict of interest.

References

  1. Parriaux, A.; Tacher, L.; Joliquin, P. The hidden side of cities—Towards three-dimensional land planning. Energy Build. 2004, 36, 335–341. [Google Scholar] [CrossRef]
  2. Bobylev, N. Mainstreaming sustainable development into a city’s Master plan: A case of Urban Underground Space use. Land Use Policy 2009, 26, 1128–1137. [Google Scholar] [CrossRef]
  3. Bobylev, N. Transitions to a high density urban underground space. Procedia Eng. 2016, 165, 184–192. [Google Scholar] [CrossRef]
  4. Bobylev, N. Underground space as an urban indicator: Measuring use of subsurface. Tunn. Undergr. Space Technol. 2016, 55, 40–51. [Google Scholar] [CrossRef] [Green Version]
  5. Edelenbos, J.; Monnikhof, R.; Haasnoot, J.; van der Hoeven, F.; Horvat, E.; van der Krogt, R. Strategic study on the utilization of underground space in the Netherlands. Tunn. Undergr. Space Technol. 1998, 13, 159–165. [Google Scholar] [CrossRef]
  6. Wallace, M.I.; Ng, K.C. Development and application of underground space use in Hong Kong. Tunn. Undergr. Space Technol. 2016, 55, 257–279. [Google Scholar] [CrossRef]
  7. Tengborg, P.; Sturk, R. Development of the use of underground space in Sweden. Tunn. Undergr. Space Technol. 2016, 55, 339–341. [Google Scholar] [CrossRef]
  8. González, R.C.L.; Ulloa, B.M.; Otón, M.P. The underground of European cities in planning documents: The case of A Coruña (Spain). Procedia Eng. 2017, 209, 42–48. [Google Scholar] [CrossRef]
  9. Han, Y.; Shin, E.; Eum, T.; Song, C. Inundation risk assessment of underground space using consequence-probability matrix. Appl. Sci. 2019, 9, 1196. [Google Scholar] [CrossRef] [Green Version]
  10. Ullah, I.; Fayaz, M.; Kim, D. Analytical modeling for underground risk assessment in smart cities. Appl. Sci. 2018, 8, 921. [Google Scholar] [CrossRef] [Green Version]
  11. Fayaz, M.; Ullah, I.; Park, D.; Kim, K.; Kim, D. An integrated risk index model based on hierarchical fuzzy logic for underground risk assessment. Appl. Sci. 2017, 7, 1037. [Google Scholar] [CrossRef] [Green Version]
  12. Zhou, Y.X.; Zhao, J. Assessment and planning of underground space use in Singapore. Tunn. Undergr. Space Technol. 2016, 55, 249–256. [Google Scholar] [CrossRef]
  13. Peng, J.; Peng, F.L. A GIS-based evaluation method of underground space resources for urban spatial planning: Part 2 application. Tunn. Undergr. Space Technol. 2018, 77, 142–165. [Google Scholar] [CrossRef]
  14. Peng, J.; Peng, F.L. A GIS-based evaluation method of underground space resources for urban spatial planning: Part 1 methodology. Tunn. Undergr. Space Technol. 2018, 74, 82–95. [Google Scholar] [CrossRef]
  15. Yang, X.B.; Chen, Z.L.; Cai, H.; Ma, L.J. A framework for assessment of the influence of China’s urban underground space developments on the urban microclimate. Sustainability 2014, 6, 8536–8566. [Google Scholar] [CrossRef] [Green Version]
  16. Gaspari, G.M.; Parisi, D.; Astore, G. The importance of a proper risk management plan for a safe use of the underground space in densely urbanised areas. Two case histories. Eng. Geol. Soc. Territ. 2015, 5, 1251–1255. [Google Scholar]
  17. Admiraal, H.; Cornaro, A. Engaging decision makers for an urban underground future. Tunn. Undergr. Space Technol. 2016, 55, 221–223. [Google Scholar] [CrossRef]
  18. Kim, Y. A study on underground space utilization plan for sustainable urban development. J. Korean Soc. Des. Cult. 2015, 21, 491–503. [Google Scholar]
  19. Peng, F.L.; Qiao, Y.K.; Zhao, J.W.; Liu, K.; Li, J.C. Planning and implementation of underground space in Chinese central business district (CBD): A case of Shanghai Hongqiao CBD. Tunn. Undergr. Space Technol. 2020, 95, 103176. [Google Scholar] [CrossRef]
  20. He, L.; Song, Y.; Dai, S.Z.; Durbak, K. Quantitative research on the capacity of urban underground space—The case of Shanghai, China. Tunn. Undergr. Space Technol. 2012, 32, 168–179. [Google Scholar] [CrossRef]
  21. Wang, X.; Zhen, F.; Huang, X.J.; Zhang, M.; Liu, Z.H. Factors influencing the development potential of urban underground space: Structural equation model approach. Tunn. Undergr. Space Technol. 2013, 38, 235–243. [Google Scholar] [CrossRef]
  22. Doyle, M.R. From hydro/geology to the streetscape: Evaluating urban underground resource potential. Tunn. Undergr. Space Technol. 2016, 55, 83–95. [Google Scholar] [CrossRef] [Green Version]
  23. Guan, P. Evaluation on development potential of urban underground space resource: Multi-level extension comprehensive evaluation method. AIP Conf. Proc. 2018, 1971, 030001. [Google Scholar]
  24. Robinson, J.B.L. Delphi methodology for economic impact assessment. J. Transp. Eng. 1991, 117, 335–349. [Google Scholar] [CrossRef]
  25. Powell, C. The Delphi technique: Myths and realities. J. Adv. Nurs. 2003, 41, 376–382. [Google Scholar] [CrossRef] [Green Version]
  26. Yeung, J.F.Y.; Chan, A.P.C.; Chan, D.W.M. Developing a performance index for relationship-based construction projects in Australia: Delphi study. J. Manag. Eng. 2009, 25, 59–68. [Google Scholar] [CrossRef]
  27. Sourani, A.; Sohail, M. The Delphi method: Review and use in construction management research. Int. J. Constr. Educ. Res. 2014, 11, 54–76. [Google Scholar] [CrossRef]
  28. Perveen, S.; Kamruzzaman, M.; Yigitcanlar, T. Developing policy scenarios for sustainable urban growth management: A Delphi approach. Sustainability 2017, 9, 1787. [Google Scholar] [CrossRef] [Green Version]
  29. Meijering, J.V.; Tobi, H.; Kern, K. Defining and measuring urban sustainability in Europe: A Delphi study on identifying its most relevant components. Ecol. Indic. 2018, 90, 38–46. [Google Scholar] [CrossRef]
  30. Chan, P.; Lee, M. Developing sustainable city indicators for Cambodia through Delphi processes of panel surveys. Sustainability 2019, 11, 3166. [Google Scholar] [CrossRef] [Green Version]
  31. Guo, J.M.; Zhu, W.J. Potential value evaluation of underground space resource based on AHP method. Chin. J. Undergr. Space Eng. 2005, 1, 655–659. [Google Scholar]
  32. Zhou, D.K.; Li, X.Z.; Wang, Q.; Wang, R.; Wang, T.D.; Gu, Q.; Xin, Y.X. GIS-based urban underground space resources evaluation toward three-dimensional land planning: A case study in Nantong, China. Tunn. Undergr. Space Technol. 2019, 84, 1–10. [Google Scholar] [CrossRef]
  33. Zhang, X.B.; Wang, C.S.; Fan, J.; Wang, H.J.; Li, H.L. Optimizing the analytic hierarchy process through a suitability evaluation of underground space development in Tonghu district, Huizhou city. Energies 2020, 13, 742. [Google Scholar] [CrossRef] [Green Version]
  34. Martin-Fernandez, S.; Gomez-Serrano, A.; Martinez-Falero, E.; Pascual, C. Comparison of AHP and a utility-based theory method for selected vertical and horizontal forest structure indicators in the sustainability assessment of forest management in the Sierra De Guadarrama National Park, Madrid Region. Sustainability 2018, 10, 4101. [Google Scholar] [CrossRef] [Green Version]
  35. Martín, C.J.; Carnero, M.C. Evaluation of sustainable development in European Union countries. Appl. Sci. 2019, 9, 4880. [Google Scholar] [CrossRef] [Green Version]
  36. Thi, T.N.N.; Liu, C.C. A new approach using AHP to generate landslide susceptibility maps in the Chen-Yu-Lan Watershed, Taiwan. Sensors 2019, 19, 505. [Google Scholar]
  37. Lee, H.; Park, E. Developing a landscape sustainability assessment model using an analytic hierarchy process in Korea. Sustainability 2020, 12, 301. [Google Scholar] [CrossRef] [Green Version]
  38. Guo, Y.N.; Chen, G.Q.; Mo, R.G.; Wang, M.; Bao, Y.Y. Benefit evaluation of water and soil conservation measures in Shendong based on particle swarm optimization and the analytic hierarchy process. Water 2020, 12, 1955. [Google Scholar] [CrossRef]
  39. Jiang, Y.; Wu, L.X.; Che, D.F. Integrated entropy weight and variable fuzzy sets evaluation approach for underground space resource quality problem. J. China Univ. Min. Technol. 2009, 38, 872–877. [Google Scholar]
  40. Hou, W.S.; Yang, L.; Deng, D.C.; Ye, J.; Clarke, K.; Yang, Z.J.; Zhuang, W.M.; Liu, J.X.; Huang, J.C. Assessing quality of urban underground spaces by coupling 3D geological models: The case study of Foshan city, South China. Comput. Geosci. 2016, 89, 1–11. [Google Scholar] [CrossRef]
  41. Shannon, C.E. A mathematical theory of communication. Bell Syst. Tech. J. 1948, 27, 319–423. [Google Scholar] [CrossRef] [Green Version]
  42. Yager, R.R. On ordered weighted averaging aggregation operators in multicriteria decisionmaking. IEEE Trans. Syst. Man Cybern. 1988, 18, 183–190. [Google Scholar] [CrossRef]
  43. Guo, Y.J.; Yao, Y.; Yi, P.T. A method and application of dynamic comprehensive evaluation. Syst. Eng. Theory Pract. 2007, 27, 154–158. [Google Scholar] [CrossRef]
  44. Yager, R.R.; Filev, D.P. Induced ordered weighted averaging operators. IEEE Trans. Syst. Man Cybern. 1999, 29, 141–150. [Google Scholar] [CrossRef]
  45. Chiclana, F.; Herrera, F.; Herrera-Viedma, E. Integrating multiplicative preference relations in a multipurpose decision-makingmodel based on fuzzy preference relations. Fuzzy Sets Syst. 2001, 122, 277–291. [Google Scholar] [CrossRef]
  46. Chen, H.Y.; Sheng, Z.H. A kind of new combination forecasting method based on induced ordered weighted geometric averaging (IOWGA) operator. J. Ind. Eng. Eng. Manag. 2005, 19, 36–39. [Google Scholar]
Figure 1. Evaluation indicators of urban underground space resources (UUSR) comprehensive quality.
Applsci 10 05152 g001
Figure 2. The UUSR evaluation results using different weighting methods.
Applsci 10 05152 g002
Table 1. The data sets of urban underground space resources.
Data t 1 t 2 t s
x 1 x 2 x n x 1 x 2 x n x 1 x 2 x n
O 1 x 11 t 1 x 12 t 1 x 1 n t 1 x 11 t 2 x 12 t 2 x 1 n t 2 x 11 t s x 12 t s x 1 n t s
O 2 x 21 t 1 x 22 t 1 x 2 n t 1 x 21 t 2 x 22 t 2 x 2 n t 2 x 21 t s x 22 t s x 2 n t s
O m x m 1 t 1 x m 2 t 1 x m n t 1 x m 1 t 2 x m 2 t 2 x m n t 2 x m 1 t s x m 2 t s x m n t s
Table 2. Reference values of the time degree (λ).
Reference ValuesExplanation
0.1Pay greatest attention to recent data
0.3Pay more attention to recent data
0.5Pay equal attention to all period data
0.7Pay more attention to forward data
0.9Pay greatest attention to forward data
0.2, 0.4, 0.6, 0.8Intermediate situation of the above adjacent cases
Table 3. The degree of dispersion of different weighting methods.
R i j Entropy T 1 Entropy T 2 TW pre TW post D i
Entropy T 1 00.01490.00840.00900.0108
Entropy T 2 0.014900.00650.00600.0091
TW pre 0.00840.006500.00050.0052
TW post 0.00900.00600.000500.0052

