1. Introduction
Wood plastic composite (WPC) is an engineered panel or lumber product manufactured from recycled plastic and fine wood particles or fibers. In the wood-based composite industry, WPC is a relatively new product as compared to traditional composites, such as particleboard and fiberboard. Wood plastic composites are extensively used for many applications, including exterior furniture, decking, playground equipment, fencing, and roofing [
1,
2,
3,
4]. The wood plastic composite market in the US and Canada reached approximately USD 1.0 billion in sales in 2006 [
5,
6,
7]. It is expected that the global wood plastic composite market will grow by around 13.2 % over the next decade, reaching approximately USD 9.7 billion by 2025 [
8].
Pressure treated wood, specifically chromated copper arsenate (CCA), has been banned in the USA as of 2002 regarding its use where there is a direct human contact. Chemically treated wood products, such as decking material, have been losing market share due to health concerns, as well as due to environmental pollution. Such parameters force the exterior composite industry to develop new engineering products, including WPCs, within the perspective of sustainability.
A typical WPC unit can be manufactured in a two-step process. The combination of wood material and thermoplastic, such as high-density polyethylene (HDPE), low-density polyethylene (LDPE), or polyvinyl chloride (PVC), is mixed together, resulting in compounding, which is a dough-like consistency [
3,
4,
5]. At a commercial scale, a continuous production process is preferred due to its efficiency as compared to that of a batch process [
8,
9,
10,
11]. Wood particles with sizes ranging from 20 mesh to 60 mesh are a typical raw material, in addition to foaming, coupling agents, and dyes added into the mixture to enhance the overall properties of the final product [
5,
12,
13]. The majority of WPCs are produced by an extrusion process which employs single or double screws to form the final shape of the product [
14].
Eastern redcedar (
Juniperus virginiana L.) is one of the invasive species in Oklahoma, USA, creating a significant ecological problem with a substantial financial burden to the economy [
15,
16]. In one study, it was found that 3.5 million and 6 million acres were invaded by eastern redcedar in Oklahoma in 1985 and 1994, respectively [
16]. The magnitude of the eastern redcedar invasion in Oklahoma reached 12.6 million acres in 2013, which is 28% of the Oklahoma landscape area [
17,
18]. It is also estimated by the Natural Resources Conservation Service (NRCS) that the eastern redcedar invasion has been increasing at a rate of around 425 hectares per day, covering over 150,000 hectares within a year and causing a cost of approximately USD47 million to the state [
17,
19]. Unfortunately, the majority of the trees are not suitable for high quality lumber manufacturing, as prescribed fire in the field is one of the approaches to control the redcedar invasion [
20].
In several previous studies, experimental particleboard and strand-type panels were manufactured in different configurations, namely single-layer and three-layer panels [
18,
20]. Both the physical and mechanical properties of such products were found to be comparable to those of other wood species. In a previous study, WPCs using eastern redcedar particles and recycled plastic were also manufactured and their mechanical properties were evaluated [
21]. In the same study, the distribution and interaction between wood particles and added clay was investigated and it was found that the penetration of clay into wood was validated by vibrational spectroscopy [
21]. It is a fact that the majority of WPCs are used under environmental conditions exposing them to rain, snow, and overall harsh conditions. As is known, wood is a hygroscopic material, absorbing and desorbing moisture from its surrounding environment, resulting in dimensional instability. Having different types of adhesives and hydrophobic chemicals in the manufacture of wood-based composites creates a barrier against moisture and this is more enhanced in the case of WPCs. It is expected that WPCs should have an excellent resistance against moisture exposure, which keeps the surface quality and dimensional stability in the initial condition. However, having almost 50% wood in a typical WPC could still create a certain level of hygroscopicity. Any kind of moisture absorption could easily cause problems in the form of deterioration of the surface of the unit, resulting in irregularities. Such roughness will not only reduce the quality of the appearance of the material, but the restoration and maintenance of the surface will also be more difficult and costly. Therefore, if the surface quality of WPCs is numerically quantified as a function of moisture content or outdoor exposure, any product made from WPC can be used more efficiently by extending its service life.
The quantification of the surface quality of wood-based panels has been studied for many years but there is still no well-accepted method [
22]. The stylus method is relatively accurate, practical, and easy compared to other approaches, such as pneumatic, light sectioning, and laser line methods [
22,
23]. The stylus method was employed to determine the surface quality of different wood-based panels.
In one of those studies, it was found that the stylus method can distinguish any irregularities on flooring material manufactured from high-density fiberboard as a function of water exposure [
24]. The surface roughness of both commercially and experimentally manufactured particleboard and medium-density fiberboard were evaluated using the stylus technique [
25]. Additionally, the surface roughness of overlaid particleboard samples exposed to relative humidity cycles was investigated [
22]. Overall, it was found that stylus-type equipment, resulting in the accepted standard roughness parameters, namely average roughness (R
a) and mean peak-to-valley (R
z), can be employed to determine any irregularities on the surface of such products.
Although the mechanical properties of WPCs manufactured from eastern redcedar have been studied, there is a very little information on the surface quality of such experimental samples as a function of water exposure. Therefore, the objective of this work was to quantify the surface roughness of WPC samples made from eastern redcedar as a function of water exposure by employing a stylus method as a quality control tool. The data found in this work could be beneficial for WPC manufacturers to understand better the overall hygroscopic behavior of WPCs.
2. Materials and Methods
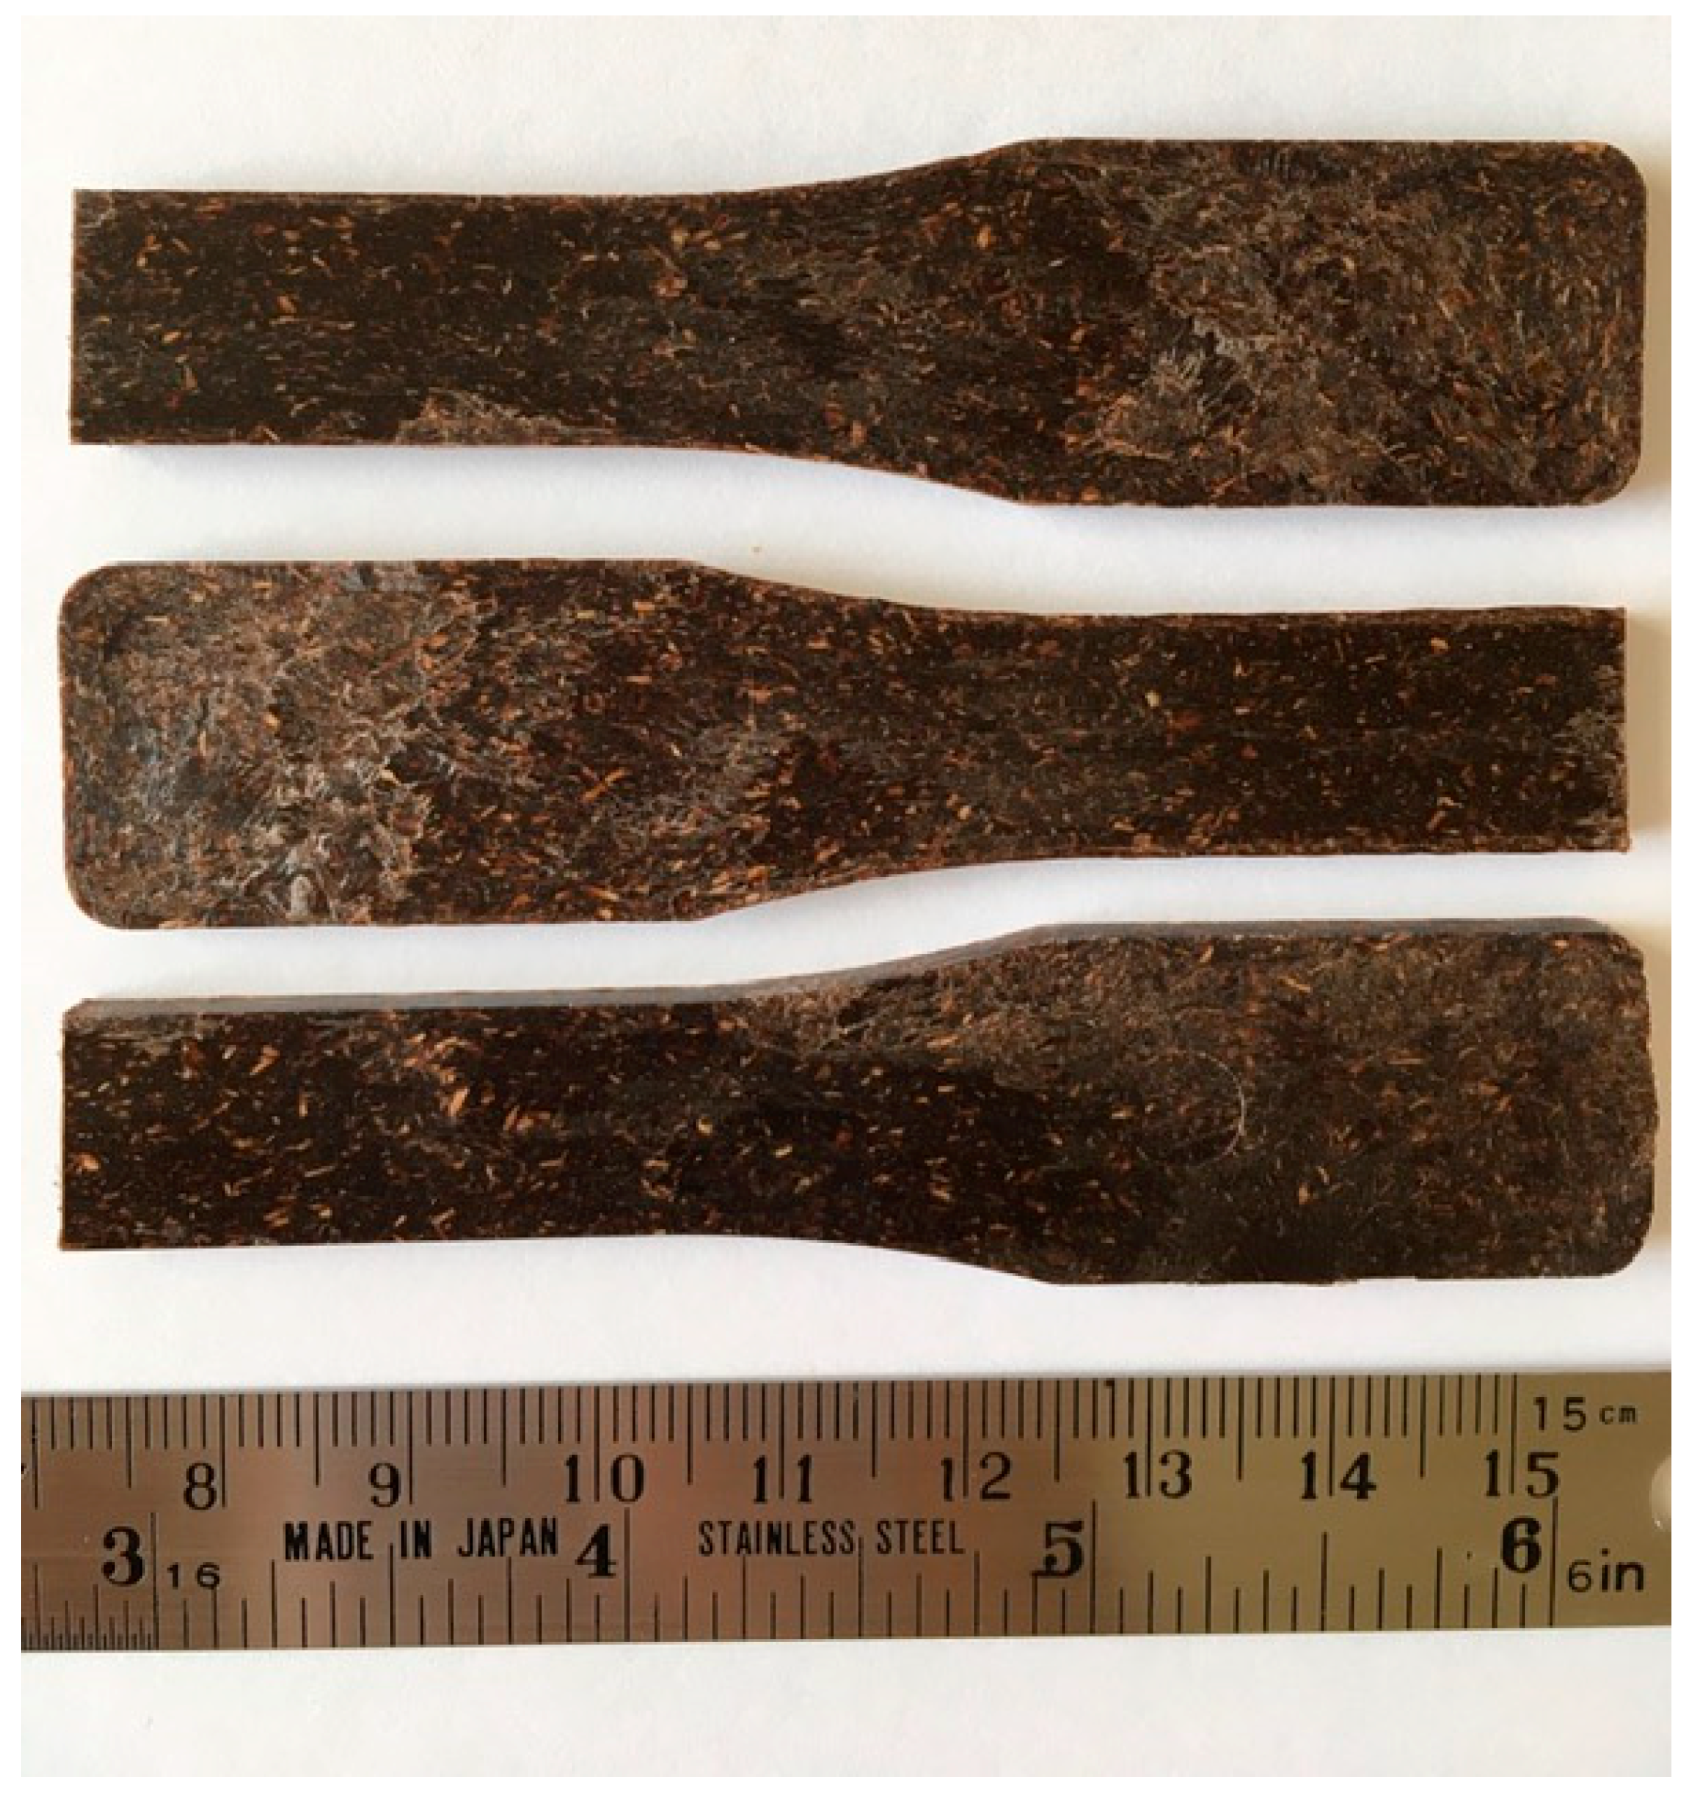
Two small eastern redcedar trees with a diameter at breast height of 15 cm were shredded into large chips as whole trees. The chips were further reduced into particles using a hammermill before they were screened with 40-mesh fine material. In the next step, the raw material was dried to a moisture content of 4% in a laboratory-type oven. Commercially produced high-density polyethylene (HDPE), maleic anhydride, and 3% and 6% nano-clay based on the oven-dried weight of the particles were homogenously mixed in a blender. Specimens were also prepared with no nano-clay as control samples. The mixture was fed into a conical counter-rotating twin-screw extruder to produce mixed chips. Initially, they were kept in a refrigerator for 30 min to cool off and then used in an injection molder as raw material. The injection molder produced small WPC samples with dimensions of 150 mm by 10 mm by 3 mm, as illustrated in
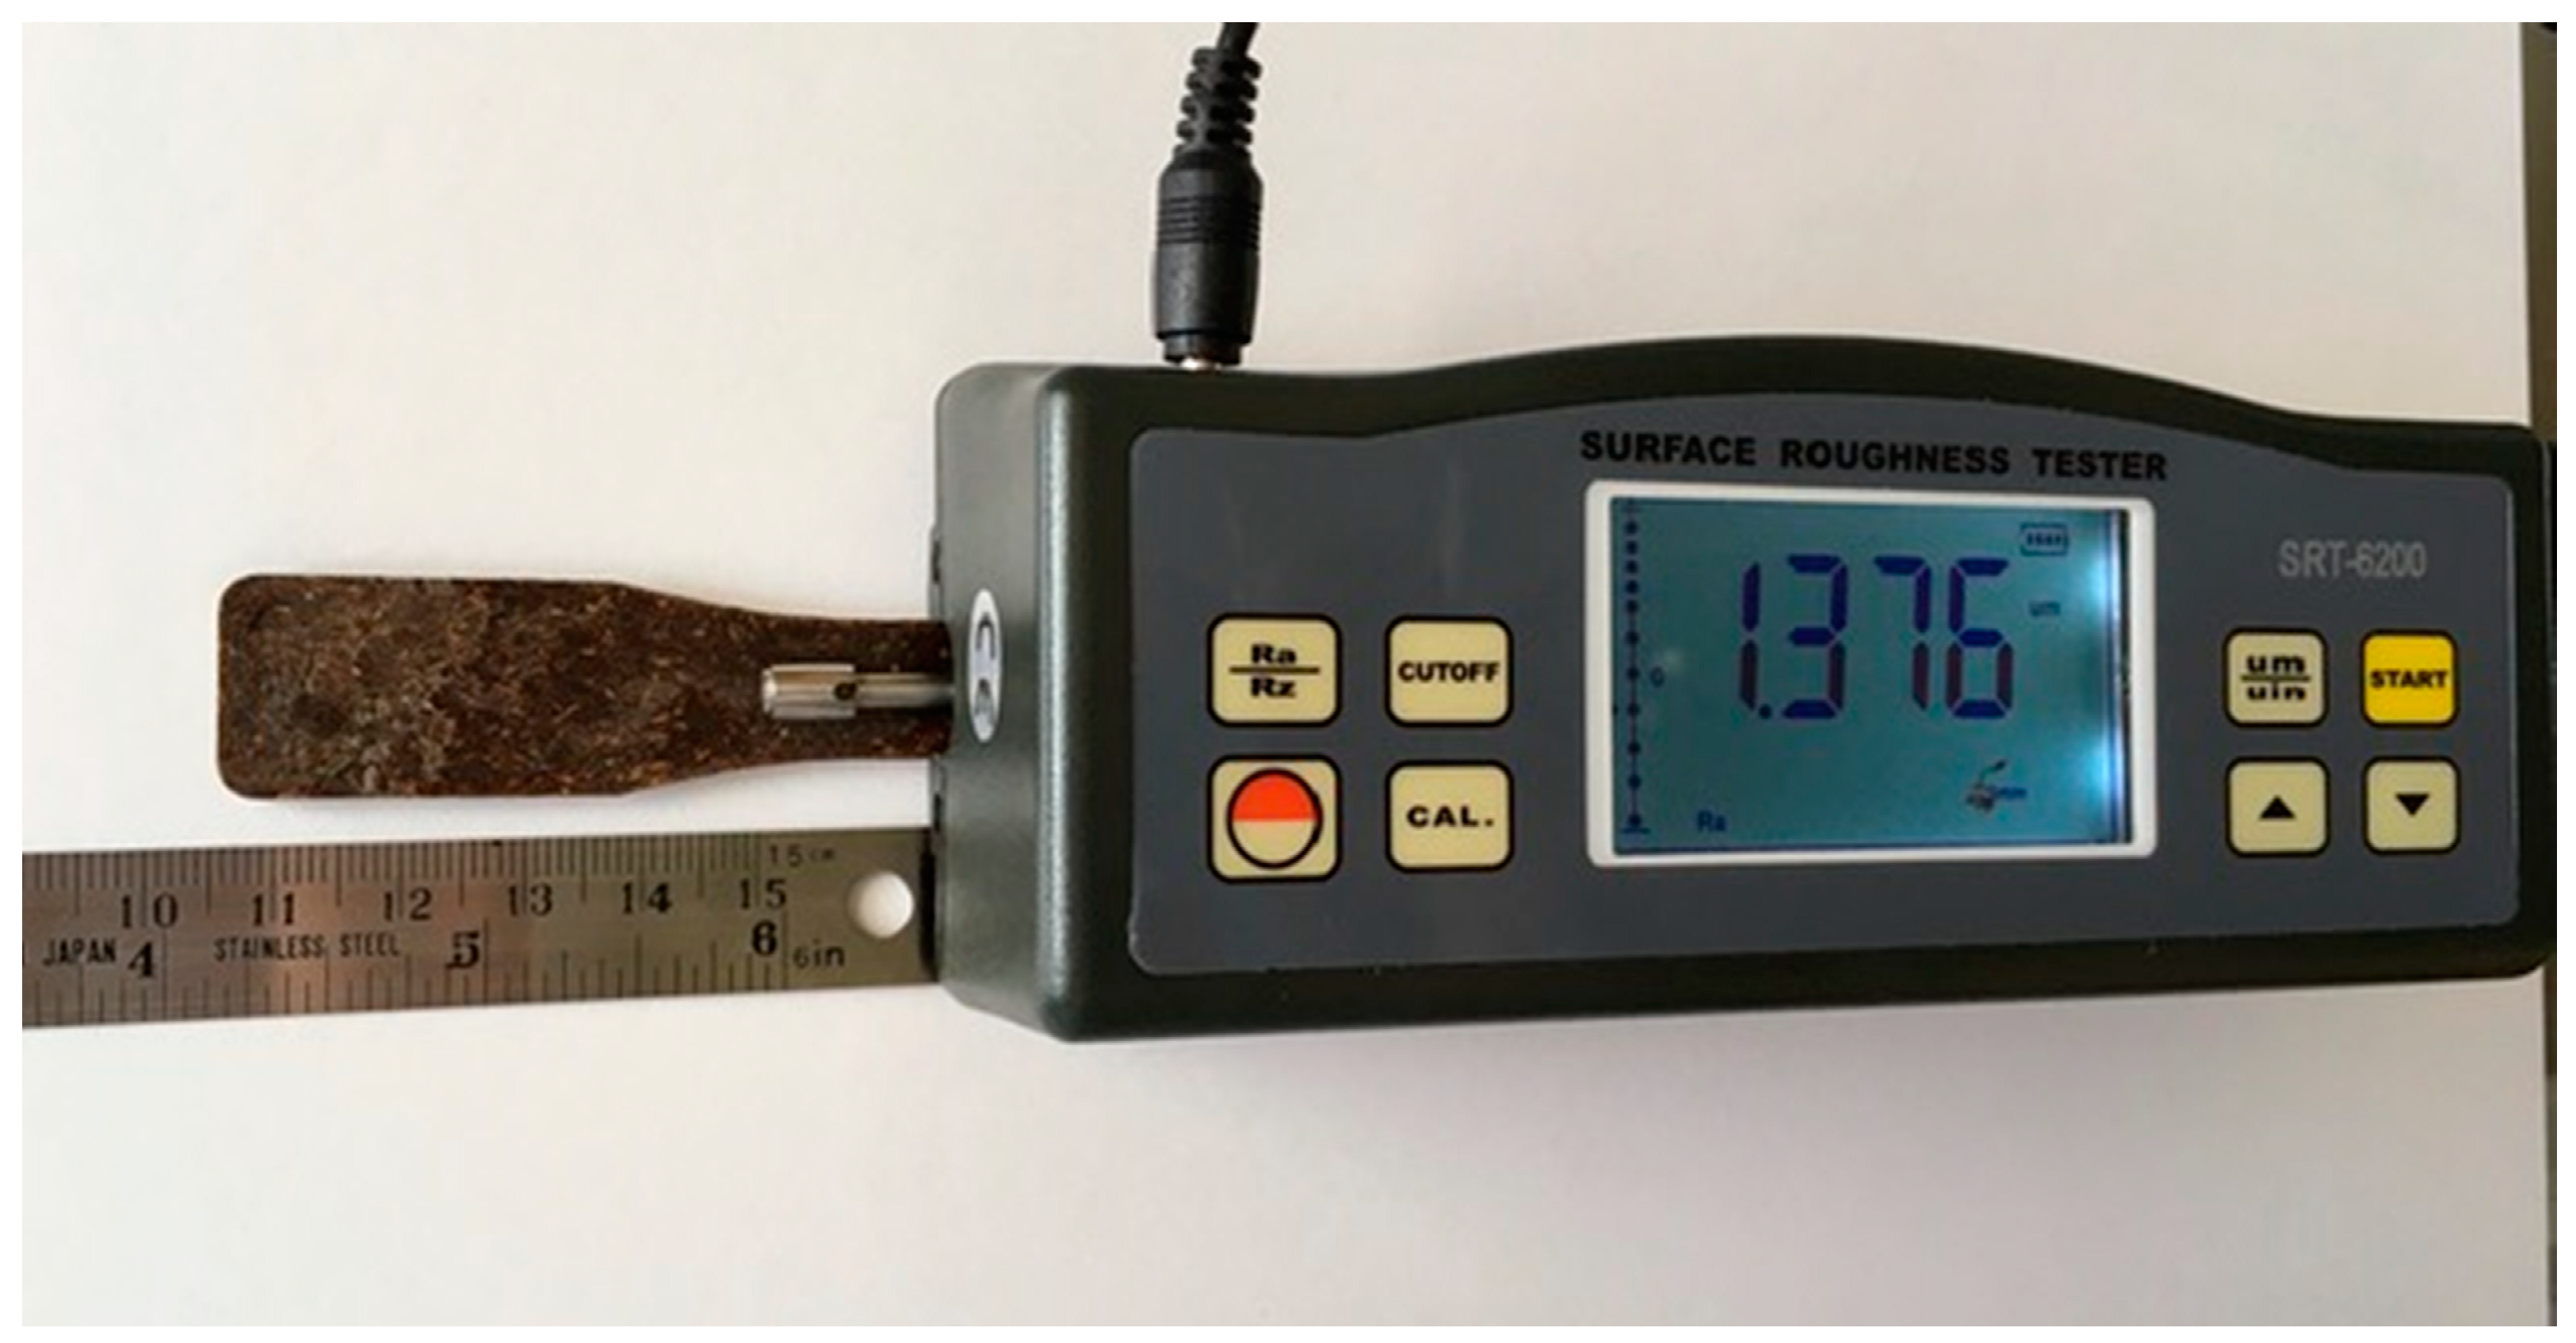
Figure 1. A total of sixty samples were considered for the tests. Twenty samples from each type, namely Type A, samples with no nano-clay, and Types B and C, with 3% and 6% nano-clay, respectively, were soaked in a water tank for one to four weeks. At the end of each week, the specimens were taken out from the water tank, rinsed, and weighed at an accuracy level of 0.01g. A stylus-type equipment SRT-6200 unit was employed for roughness measurements. The equipment consisted of a main unit and a pick-up with a skid-type diamond stylus with a 5 µm tip radius and a 90
o tip angle was used for the surface roughness test. Two roughness parameters, average roughness (R
a) and mean peak-to-valley height (R
z), were used to quantify the roughness of the samples. A total of six random surface measurements, three on each side of the specimens, were taken in the initial dry condition and at the end of each week during the water soaking process. Tracing length was 15 mm for the roughness test.
Figure 1 and
Figure 2 depict the WPC samples and stylus-type equipment, respectively.
3. Results and Discussion
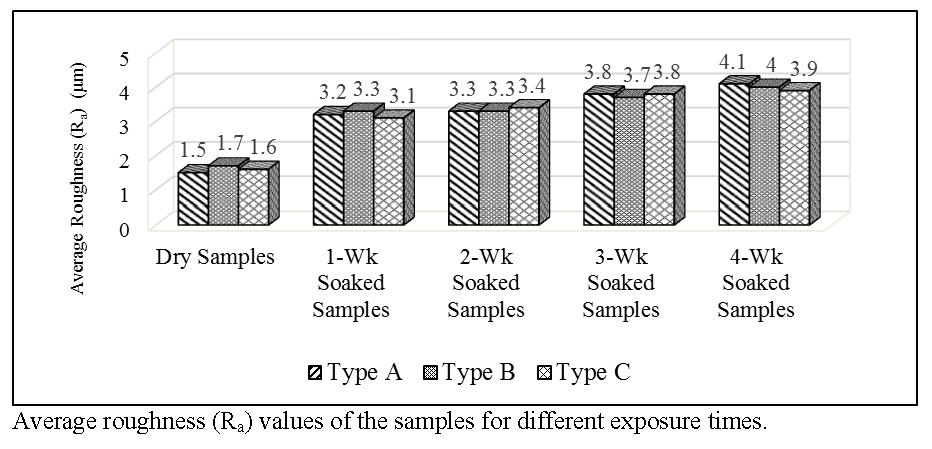
Figure 3 illustrates the average roughness values of dry and water-exposed samples. An R
a value of 1.5 µm was found for the control samples with no clay content. Control specimens manufactured with 3% and 6% clay did not show any significant difference in their R
a values as compared to those made with no clay, as can also be seen in
Table 1. It seems that a one-week water soaking adversely influenced the overall surface quality of all samples to a noticeable level. As can be observed in
Table 1, the R
a values of sample Types A, B, and C were found to be 3.2 µm, 3.3 µm and 3.1 µm, respectively. As it is well known that wood is a hygroscopic material that is sensitive to moisture, the deterioration of the roughness of the samples soaked in water, even for one week, could easily be related to having 50% eastern redcedar particles in the polymer compound. Once the samples were exposed to water for an extended time, sequentially 3 and 4 weeks, the magnitude of the surface deterioration of the samples gradually decreased. For example, sample Type C with 6% clay had an R
a value of 3.8 µm as a result of the 3-week water soaking and this value increased by only 2.56% when it were kept in water for one more week. It appears that having clay in the samples created some kind of barrier so that water diffusion in the polymer matrix was reduced [
26,
27]. In a previous study, the surface roughness of pressed WPC samples was evaluated and the R
a and R
z values of the specimens ranged from 1.98 µm to 4.48 µm and 16 µm to 33 µm, respectively [
28]. Based on the findings in this work, no significant difference was detected between the average roughness (R
a) values of the samples with two different clay contents. The mean peak-to-valley height (R
z) results of the samples followed the trend of the R
a values for all types of specimens. It appears that a long period of water soaking for the samples reduced their surface quality insignificantly, suggesting that possibly a coating or certain type of treatment can be applied to the surface of WPC panels so that their service life can be extended with better utilization.
The water absorption of the specimens with 6% clay was the lowest, ranging from 0.95% to 1.34% as a function of the 1- and 4-week water soaking test. The control samples had 13.63% higher water absorption values than that of sample Type C with 6% clay, as can be seen in
Table 2. The influence of having clay in the samples was more pronounced for those exposed to water for a longer period of time. Once again, it seems that clay acted as a barrier between the hygroscopic nature of the wood particles and the water by creating a matrix, which was also determined at a microscopic scale in a previous work [
26,
28]. The water absorption of WPCs with 50% wood particles was determined to be within a range of 0.3% to 2.3% in a past study investigated the physical properties of WPCs [
21]. In the same study, it was also found that samples with 50% wood particles are comparable to high-pressure laminate (HPL) regarding their dimensional stability. Another study determined that the water absorption of WPC samples soaked in water for 24 h was 0.9% and concluded that their water absorption was better than that of HPL [
29]. Based on the findings in this work, it can be suggested that the water absorption of WPCs made from eastern redcedar has a similar dimensional stability as found in other investigations.
When the control samples were kept in water for a month, they had 1.41 % water absorption. The corresponding values for these specimens with clay were 1.32 and 1.34%, as displayed in
Table 2.
The above findings were also statistically checked through two-way ANOVA analysis and Tukey’s post hoc tests, conducted on the average surface roughness (R
a) values of the WPC samples. A two-way ANOVA was conducted that examined the effect of Water Exposure Time and WPC Type on the Surface Roughness of the WPC samples. As can be observed in
Table 3, there was a statistically significant interaction, with a
p-value of <0.0001 between the effects of Water Exposure Time and WPC Type on the Surface Roughness of the WPC samples at the alpha level of 0.05. As shown in the same table, a simple main effect analysis showed that there was a significant difference among different levels of both Exposure Time and WPC Type, with the same
p-value of <0.0001. The two-way ANOVA test results also indicated that a constructed model involving variables of Water Exposure Time, WPC Type, and their interaction term was able to explain 99.3% of the variance in the dependent variable of Surface Roughness (R
a). When the partial eta-squared values for WPC Type and Water Exposure Time variables are seen, it can be interpreted that the relative impact of Water Exposure Time was more than nine times as strong as WPC Type.
Multiple comparisons of the group means for the WPC Type variable revealed that the difference between Type A and Type B WPC samples was statistically significant, with a
p-value of <0.0001 at the alpha level of 0.05. However, no statistically significant difference was observed between the means of Type A and Type C WPC samples (
p-value = 0.747). The average surface roughness (R
a) values of Type A WPC samples were 0.0475 µm smaller than those of Type B WPC samples. The difference between the average surface roughness values of Type A and Type C samples was 0.0072 µm, where the surfaces of Type A samples were rougher. Furthermore, when the difference between Type B and Type C WPC samples was investigated, a 0.0547 µm difference was observed, as can be seen in
Table S1. It may be interpreted that increased levels of nano-clay acted as a successful water repellent and ensured a better surface quality under water exposure.
As stated above, Water Exposure Time was a more influential factor on surface roughness than WPC Type. Multiple comparison results for 0–4 weeks of exposure yielded statistically significant results at the alpha level of 0.05 for all comparison pairs.
The mean R
a differences of samples soaked in water for 4 weeks were 2.3797 µm, 0.7877 µm, 0.6376 µm, and 0.2026 µm larger than those of samples soaked in water for 0 weeks, 1 week, 2 weeks, and 3 weeks, respectively. One week of water soaking created a difference of 1.5920 µm with a
p-value of <0.0001 when compared to the control group, which was not exposed to water. A 0.2026 µm difference was observed between means of samples soaked in water for 3 weeks and for 4 weeks. This difference was also statistically significant at the same alpha level, with a
p-value of <0.0001, as can be seen in
Table S2.
The main effects plot given in
Figure 4 also supports the findings discussed above. Increasing water exposure time resulted in rougher surfaces for all WPC types, with an exception for Type C WPC samples since the surface roughness of those samples did not change much as a function of 1 week of soaking, compared to aprolonged exposure (3 weeks to 4 weeks), as can be observed in
Figure 4. This finding was also in conjunction with the idea that increased levels of nano-clay may be considered as a successful water repellent.


