Next Article in Journal
Understanding Indigenous Farming Systems in Response to Climate Change: An Investigation into Soil Erosion in the Mountainous Regions of Central Vietnam
Previous Article in Journal
Probabilistic Resilience Analysis of the Icelandic Power System under Extreme Weather
 
 
Comment published on 21 January 2022, see Appl. Sci. 2022, 12(3), 1123.
Article

A User-Friendly Tool to Characterize the Moisture Transfer in Porous Building Materials: FLoW1D

Department of Civil Engineering and Construction, Institute of Technology, Universidad de Castilla-La Mancha, Campus Universitario s/n, 16071 Cuenca, Spain
*
Authors to whom correspondence should be addressed.
Appl. Sci. 2020, 10(15), 5090; https://doi.org/10.3390/app10155090
Submission received: 15 June 2020 / Revised: 21 July 2020 / Accepted: 23 July 2020 / Published: 24 July 2020
(This article belongs to the Section Materials Science and Engineering)

Abstract

:

Featured Application

FLoW1D (One-Dimensional Water Flow) is a numerical tool that is designed as a support for the analysis of the conventional experimental tests for the hygric characterization of porous building materials. The authors have made the FLoW1D tool available to the scientific community as open-source code to encourage its use and improvement according to the needs of each characterization or research project.

Abstract

This paper presents a user-friendly tool—FLoW1D (One-Dimensional Water Flow)—for the estimation of parameters that characterize the unsaturated moisture transfer in porous building materials. FLoW1D has been developed in Visual Basic for Applications and implemented as a function of the well-known Microsoft Excel© spreadsheet application. The aim of our work is to provide a simple and useful tool to improve the analysis and interpretation of conventional tests for the characterization of the hygric behavior of porous building materials. FLoW1D embraces the conceptual model described in EN 15026 for moisture transfer in building elements, and its implementation has been verified and validated correctly. In order to show the scope of the code, an example of an application has been presented. The hygric characterization of the limestone that is mostly employed in the Cathedral of Santa Maria and San Julian in Cuenca (Spain) was conducted based on an analysis of the conventional water absorption by capillarity tests (EN 15801).

1. Introduction

The conservation of architectural heritage is a social and economic responsibility, both for its cultural value and its value as a source of wealth for society [1]. The conservation of architectural heritage mainly focuses on the maintenance and rehabilitation of the materials used in the construction of these heritage elements—generally, porous building materials (PBMs). The degradation of these materials is usually caused by the transport of moisture through their pores in many environments [2,3]. Among others, different pathologies associated with water transport can be highlighted, such as the appearance of saline efflorescences and the development of alveolarization processes, as well as the fragmentation of the stone material due to the generation of stress associated with freezing processes or volume changes [4].
For this reason, it is necessary to determine the hygric properties of PBMs before conducting any action aimed at their conservation [5], as shown in standard UNE 41810 [6]. This standard shows the criteria and methodologies of intervention for stone materials and is focused on the conservation of cultural heritage; this is mainly defined as those activities framed within the processes of the stabilization of pathologies and preventive conservation strategies. At the European level, the EN 16515 [7] standard regulates the guidelines for the characterization of natural stone used in cultural heritage. The characterization of these materials is an essential stage in the correct definition of a conservation strategy that includes the definition of possible interventions, whether repairing or even replacing damaged stones. The standard EN 16515 [7] includes methodologies to conduct mineralogical, chemical, physical and mechanical characterization. The execution and interpretation of the tests proposed by EN 16515 [7] to specifically define the hygric behavior of PBMs is not easy; the use of numerical tools that are capable of simulating the moisture transfer in unsaturated porous media has become necessary for a satisfactory interpretation of the experimental tests.
A wide range of numerical tools is currently available to simulate the hygrothermal behavior of porous materials. Revisions by Delgado et al. [8] and Hens [9] or the multiphysics models developed in recent years [4,10,11,12] highlight this fact. These tools adopt a well-structured conceptual framework that is described, for example, in EN 15026 [13], which incorporates the conceptual model of the main physical processes that condition the moisture and energy transfer in building elements. However, regardless of the conceptual level of the model, its practical scope is usually conditioned by the material parameters (the parameters of the state functions used in the modeling of the transfer of moisture and energy). It is therefore of the utmost importance to have a solid experimental basis for its estimation. In the current state-of-the-art approaches, the standard experimental tests focused on obtaining the hygric properties of the porous building materials used in architectural heritage are not aimed at triggering processes characterized by a single material parameter; in contrast, they are generally tests in which several physical processes are coupled together. This is the case, for example, for the water absorption by capillarity (WAC) test, described in EN 15801 [14], in which the coupled flow of both liquid water and vapor is present. In addition, the magnitudes that the international standards indicate as parameters for estimation (in the case of the WAC test, the water absorption by capillarity coefficient) are not usually material parameters but behavioral indices of these materials.
However, it does not seem reasonable to redefine a experimental framework that is deeply rooted in the technical community. It seems more logical to obtain the experimental data and to propose new strategies in order to estimate the parameters of the state functions considered in standard EN 15026.
There is extensive experience in the field of inverse problems and parameter estimation. The works of Carmeliet and Roels [15], Roels et al. [16], Gómez et al. [17], Galván et al. [18], Amirkhanov [19] and Rouchier et al. [20] are examples of parameter estimation from laboratory tests. One of these approaches could be adopted together with the freeware codes included in the review by Delgado et al. [8], or any other numerical solver, for the solution of the direct problem (simulation). However, a numerical tool should be as friendly as possible for the technicians in charge of the characterization of the PBM or even other partially saturated porous materials such as concrete, mortar, rammed earth or soils. For this reason, the program FLoW1D (One-Dimensional Water Flow) has been developed in the environment of the well-known Microsoft Excel© worksheet application using the Visual Basic for Applications (VBA) language. This allows users to modify the code according to their needs. However, if they do not wish to do so, the developed program can be used with the same simplicity as a worksheet function. In this way, the developed code can be used in conjunction with one of the many available optimization modules in Microsoft Excel© (such as Solver), facilitating the parameter estimation process.
In this work, the fundamentals of the conceptual model adopted for the analysis of isothermal tests are described. Additionally, we have also defined the numerical implementation in VBA and the interface in the Microsoft Excel© environment. The tool has been completely checked with three verification exercises. In order to illustrate the scope of the code, an example of an application has been included; the proposed case features an estimating of the unsaturated moisture transfer parameters (intrinsic permeability and water retention curve) of limestone used in the construction of the Cathedral of Santa María and San Julián in Cuenca, Spain.
Finally, it is important to note that the numerical tool has been made freely available to the scientific and technical community (Supplementary Material). It can be used in its current state or, if desired, it can be modified to suit other needs such as different sample sizes, discretization schemes or even for the application of alternative boundary conditions (as described below in Section 3.2).

2. Experimental Test

The WAC test has been selected for the parameter estimation exercises, as other authors have done for cement–lime mortars containing phase change materials [21]. In this well-known test, there are processes of the coupled transport of water in both the liquid phase and vapor in a partially saturated porous medium. The test consists of placing a sample of the selected PBM on a saturated permeable bed so that the water rises by capillarity. The increments of the water mass absorbed in each sampling time interval are measured, and the WAC coefficient—a performance index of the tested material—is calculated. However, the same data can be used to estimate the material parameters that characterize the unsaturated moisture transfer (intrinsic permeability and the water retention curve parameters) by the analysis of the inverse problem.

3. Conceptual Model and Numerical Implementation

3.1. Conceptual Model

The formulation used for balance equations, field equations and the structure of state functions is based on the conceptual model described in EN 15026. For the simulation of WAC tests, an isothermal and one-dimensional flow has been assumed. In addition, the PBM is considered non-deformable.
The water mass balance, without considering water sources or sinks in the domain, is defined by the expression
w t + g = 0
where w is the water content per total volume unit (kg m−3), g is the water flow rate (kg m−2 s−1) and · is the divergence differential operator. The matric suction (defined as the difference between gas pressure and liquid pressure, s = P G P L ) has been selected as the state variable. In the water content term, the contributions of the liquid, w w , and vapor, w v , phases have been considered according to
w = w w + w v = ϕ   S r   ρ w + ϕ   ( 1 S r ) ρ v = θ   ρ w + ( θ sat θ )   ρ v
where ϕ is the porosity (m3 m−3), S r is the degree of saturation (m3 m−3),   θ is the volumetric water content (m3 m−3),   θ sat is the volumetric water content in saturated conditions (m3 m−3), ρ w is the liquid water density (kg m−3) and ρ v is the water vapor density (kg m−3), estimated by the psychrometric equation (Equation (A2)). The water flow rate, g , is obtained from the contributions of the liquid, g w , and vapor, g v , phases:
g = g w + g v
The liquid and vapor fluxes were defined by adopting the approaches from Cabrera et al. [22]. The term corresponding to the liquid phase is defined as
g w = k   s
where k is the hydraulic conductivity (s) and s is the suction gradient (Pa m−1). The hydraulic conductivity has been calculated as
k =   κ   K sat   γ w ρ w
where γ w is the specific weight of the water (N m−3), κ is the relative permeability (dimensionless) and K sat is the saturated conductivity (m s−1), defined as
K sat = K μ w γ w
where K is the intrinsic permeability (m2). The relative permeability has been determined by the van Genuchten–Mualem [23] approach:
κ = S r 1 2 [ 1 ( 1 S r 1 m ) m ] 2
where m (dimensionless) is a fitting parameter used in the van Genuchten [24] water retention curve:
S r = ( 1 + ( α   s ) n ) m
where α (Pa−1) and n (dimensionless) are also van Genuchten model parameters.
The water vapor flow rate is calculated as
g v = δ p P v
where δ p is the vapor permeability (kg Pa−1 m−1 s−1) and P v is the water vapor pressure gradient (Pa m−1). The vapor permeability is calculated by
δ p = δ 0 μ
where δ 0 (kg Pa−1 m−1 s−1) is the vapor permeability of the still air and μ (dimensionless) is the diffusional resistance factor. The vapor permeability of the still air, δ 0 , is calculated by the expression
δ 0 = D v   M M w R   T
where M M w is the molar mass of the water (kg mol−1), R is the universal gas constant (Pa m3 mol−1 K−1), T is the absolute temperature (K) and D v is the binary diffusion coefficient of the water vapor (m2 s−1), which is calculated as in [25]
D v = 5.9   ×   10 6 T 2.3 P G
where P G is the gas pressure (Pa), which is assumed to be constant and equal to the atmospheric pressure. The diffusional resistance factor, μ , can be calculated as in [25]
μ = 1 τ v   ϕ   ( 1 S r ) = 1 τ v ( θ sat θ )
where τ v (dimensionless) is the tortuosity.

3.2. Numerical Model and System Abstraction

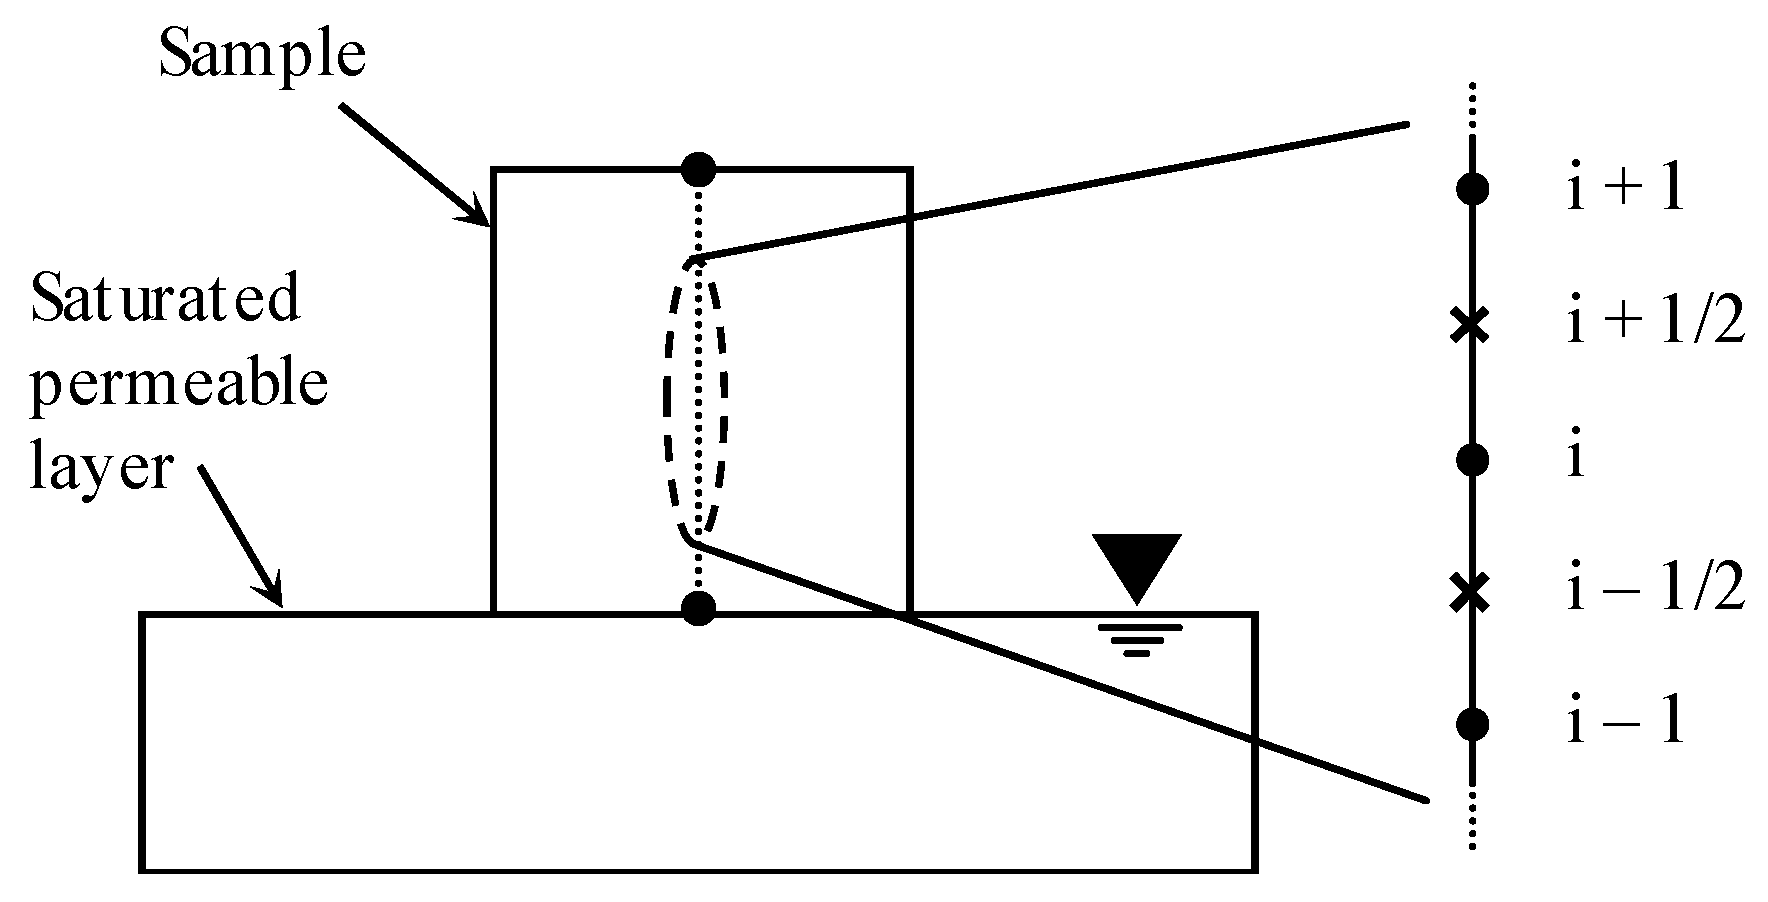
To solve the boundary value problem, an explicit finite difference scheme has been used. A detailed description of the spatial and temporal discretization applied is included in Appendix C, but Figure 1 provides a scheme of the discretization of the domain used. The lower grid point (i = 1) corresponds to the base of the sample in contact with the saturated permeable layer. Consequently, a Dirichlet condition of suction equal to 0 Pa has been applied in this boundary. The boundary condition applied to the upper grid point (i = n) is estimated using the formulation described in EN 15026 for moisture transport across the interfaces between the material and environment.
In the WAC tests, the specimens are kept in a desiccator with a controlled relative humidity (RH) of 32% before being tested. Therefore, the initial condition set is the suction corresponding to this RH, which is calculated using the psychrometric law (Equation (A2)).
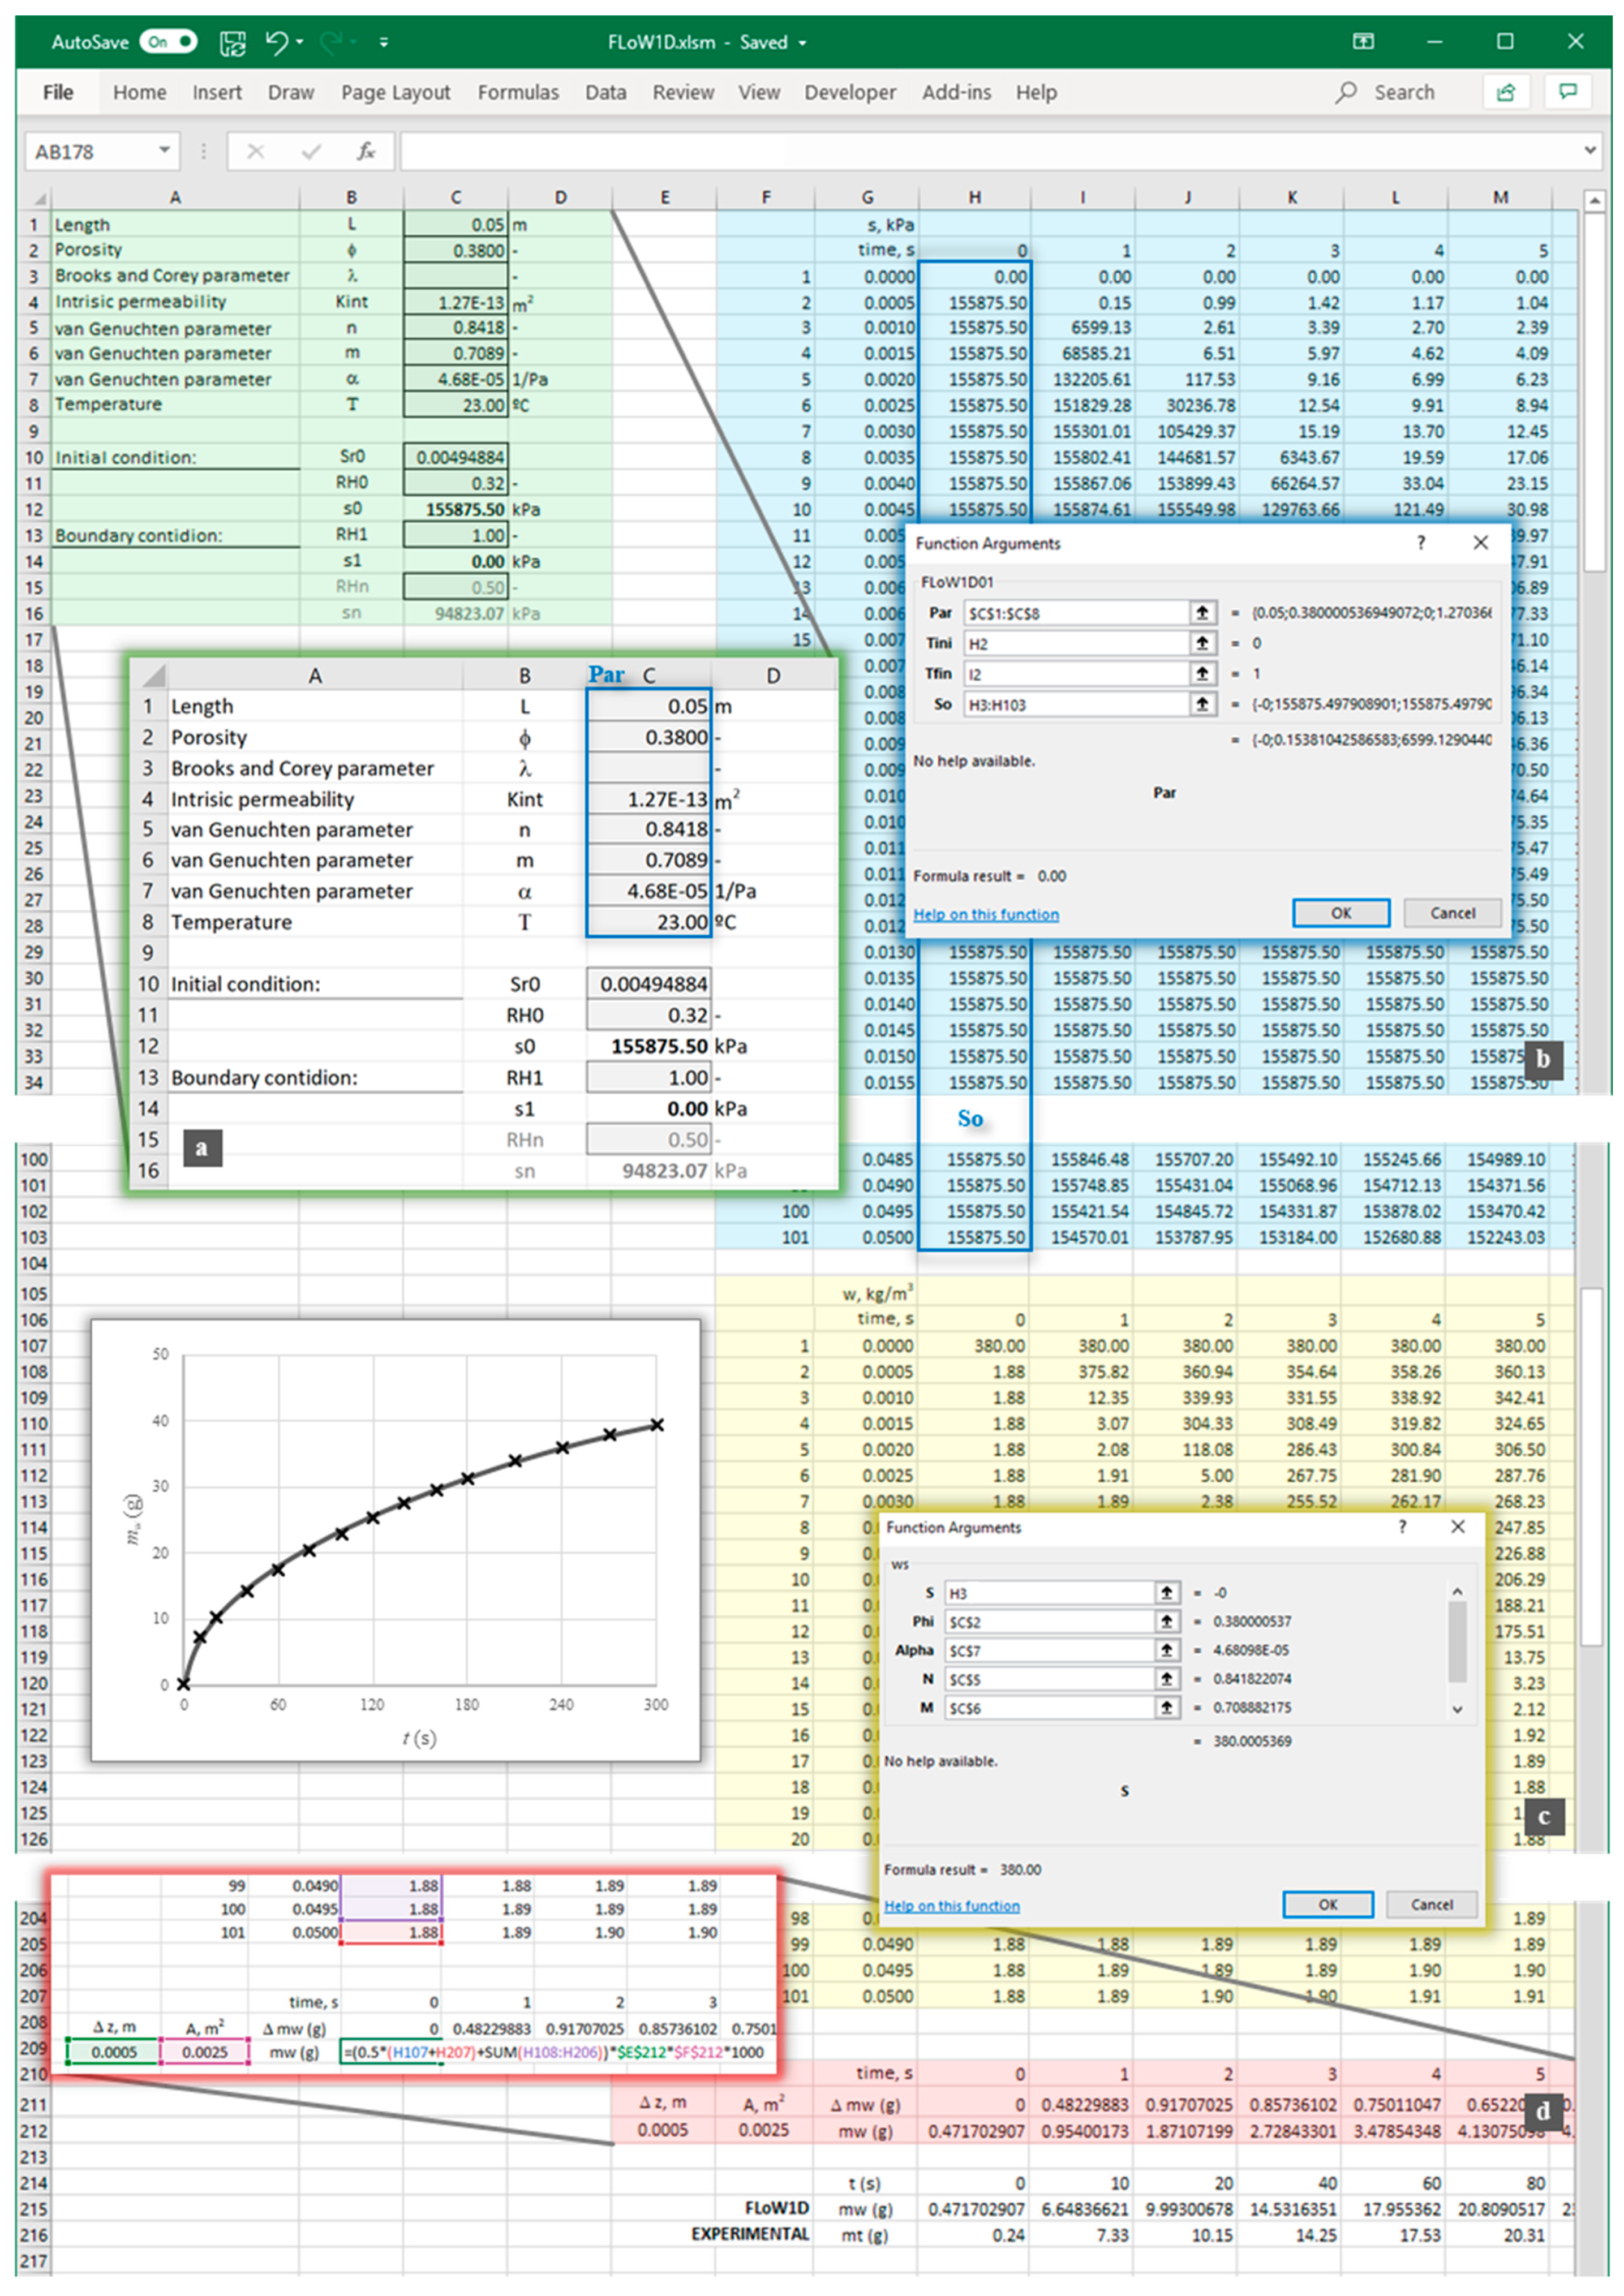
The numerical scheme described in Appendix C has been programmed using the Visual Basic for Application (VBA) language and implemented as a Microsoft Excel© function called FLoW1D. Figure 2 shows a snapshot of the tool interface. The code offers the possibility of calculating the relative permeability by means of the van Genuchten [24] or the Brooks and Corey [26] approaches. The van Genuchten model is the default option. If the user wants to use the Brooks and Corey model, the value of λ (empirical parameter of the model) must be included in the input of variables (cell C3 in Figure 2a).
The arguments of FLoW1D (Par, Tini, Tfin, So) are entered in the same way as in a predefined Excel function, as shown in Figure 2b. The Par argument is the vector (vectors are identified by using bold font throughout the paper) of material parameters and geometric dimensions (cells C1 to C8 in Figure 2a). The “Tini” and “Tfin” arguments correspond to the initial and final time of the time increment modeled. The So argument is the vector corresponding to the suction at the “Tini” time. Given that a match is made between the spreadsheet cells and the grid points of the discretization, the first value for all components of So (the initial condition of the boundary value problem) must be defined in cells H3 to H103 in Figure 2b (if the domain is discretized in 101 grid points). By default, the value computed in cell C12, obtained from the initial RH after applying the psychrometric law (Equation (A2)), is assumed as the first value of So. For the following computational times (defined in cells I2, J2, K2 and so on), So is the result of the previous time step. The boundary conditions are defined as indicated in Figure 1. For all computational times, a Dirichlet boundary condition is assumed at the bottom grid point. Therefore, cells H3, J3, K3 and so on are equal to the value “s1” defined in cell C14 (Figure 2a). If the psychrometric law (Equation (A2)) is applied, s1 is a function of the RH value consigned in cell C13 and consequently is sufficient to change that value to modify the suction value at grid point 1 throughout the computational process. Although a Dirichlet condition has been assumed by default in grid point 1, FLoW1D has the option to activate a von Neumann boundary condition, such as that indicated for the grid point n in Figure 1. If the user activates this option—and since the term corresponding to the liquid phase is assumed to equal to zero—the flow g B 0 applied to grid point 1 is given, according to the EN 15026 standard, by the expression
g B 0 = δ 0 s d , 0 ( P v , 0 P v , 1 )
where s d , 0 is the equivalent vapor diffusion thickness of bottom interfaces, P v , 0 is the vapor pressure obtained by the relative humidity at the environment in the bottom interface and P v , 1 is the vapor pressure obtained by the psychrometric law (Equation (A2)) at grid point 1. By default, at the top of the domain (grid point n in Figure 1), the von Neumann-type condition applies. In this case, s d , n , P v , n and P v , an are used instead of s d , 0 , P v , 0 and P v , 1 , respectively. FLoW1D has also been prepared to change this top boundary condition, and it is able to shift to a Dirichlet condition. To do this, cells H103, I103, J103 and so on must be equal to “sn” (cell C16), as a function of the RH value consigned in cell C15.
Therefore, in the default option (bottom, Dirichlet condition; top, von Neumann condition), FLoW1D will be activated for the cell range 3 to 103. According to the initial calculation proposal, 101 grid points have been adopted for the spatial discretization. The user can easily increase or reduce this number. The activation of FLoW1D for a column of cells, as an “array formula” (or “CSE formula”), requires the selection of the whole range of solution vectors and for the user to simultaneously press the keys Control, Shift and Enter [27]. Thus, the results of the FLoW1D function are the suction in each of the grid points in which the sample has been discretized for the desired computational times (see Figure 2b).
Although the state variable used is suction, the magnitude measured directly in the WAC test is the water content. To obtain the value of w associated with the value of s in each grid point, the function ws was implemented. In this function, besides s, the arguments are porosity ϕ (cell C2), the van Genuchten parameters n, m and α (cells C5, C6 and C7, respectively), and the temperature T ^ (cell C8). The results of this function are shown in Figure 2c. Finally, it should be noted that the total mass of water contained in the sample is wtot,cal; this variable represents the variation of the accumulated water mass (g) in the tested material specimen, mw (Figure 2d). This calculated variable is compared with the experimentally obtained value of wtot,obs. In summary, the main equation of FloW1D is Equation (1), which represents the water mass balance in the material. The state variable of this balance is w (water content per total volume unit). From the values of w at each grid point, it is possible to obtain the total mass of water accumulated in the tested sample (mw) considering the total volume of the sample and the observation times.

3.3. Verification Process

A comprehensive verification of the tool has been carried out; here, we present only three of the performed exercises. In Table 1, the parameters and initial and boundary conditions adopted in each exercise are shown.
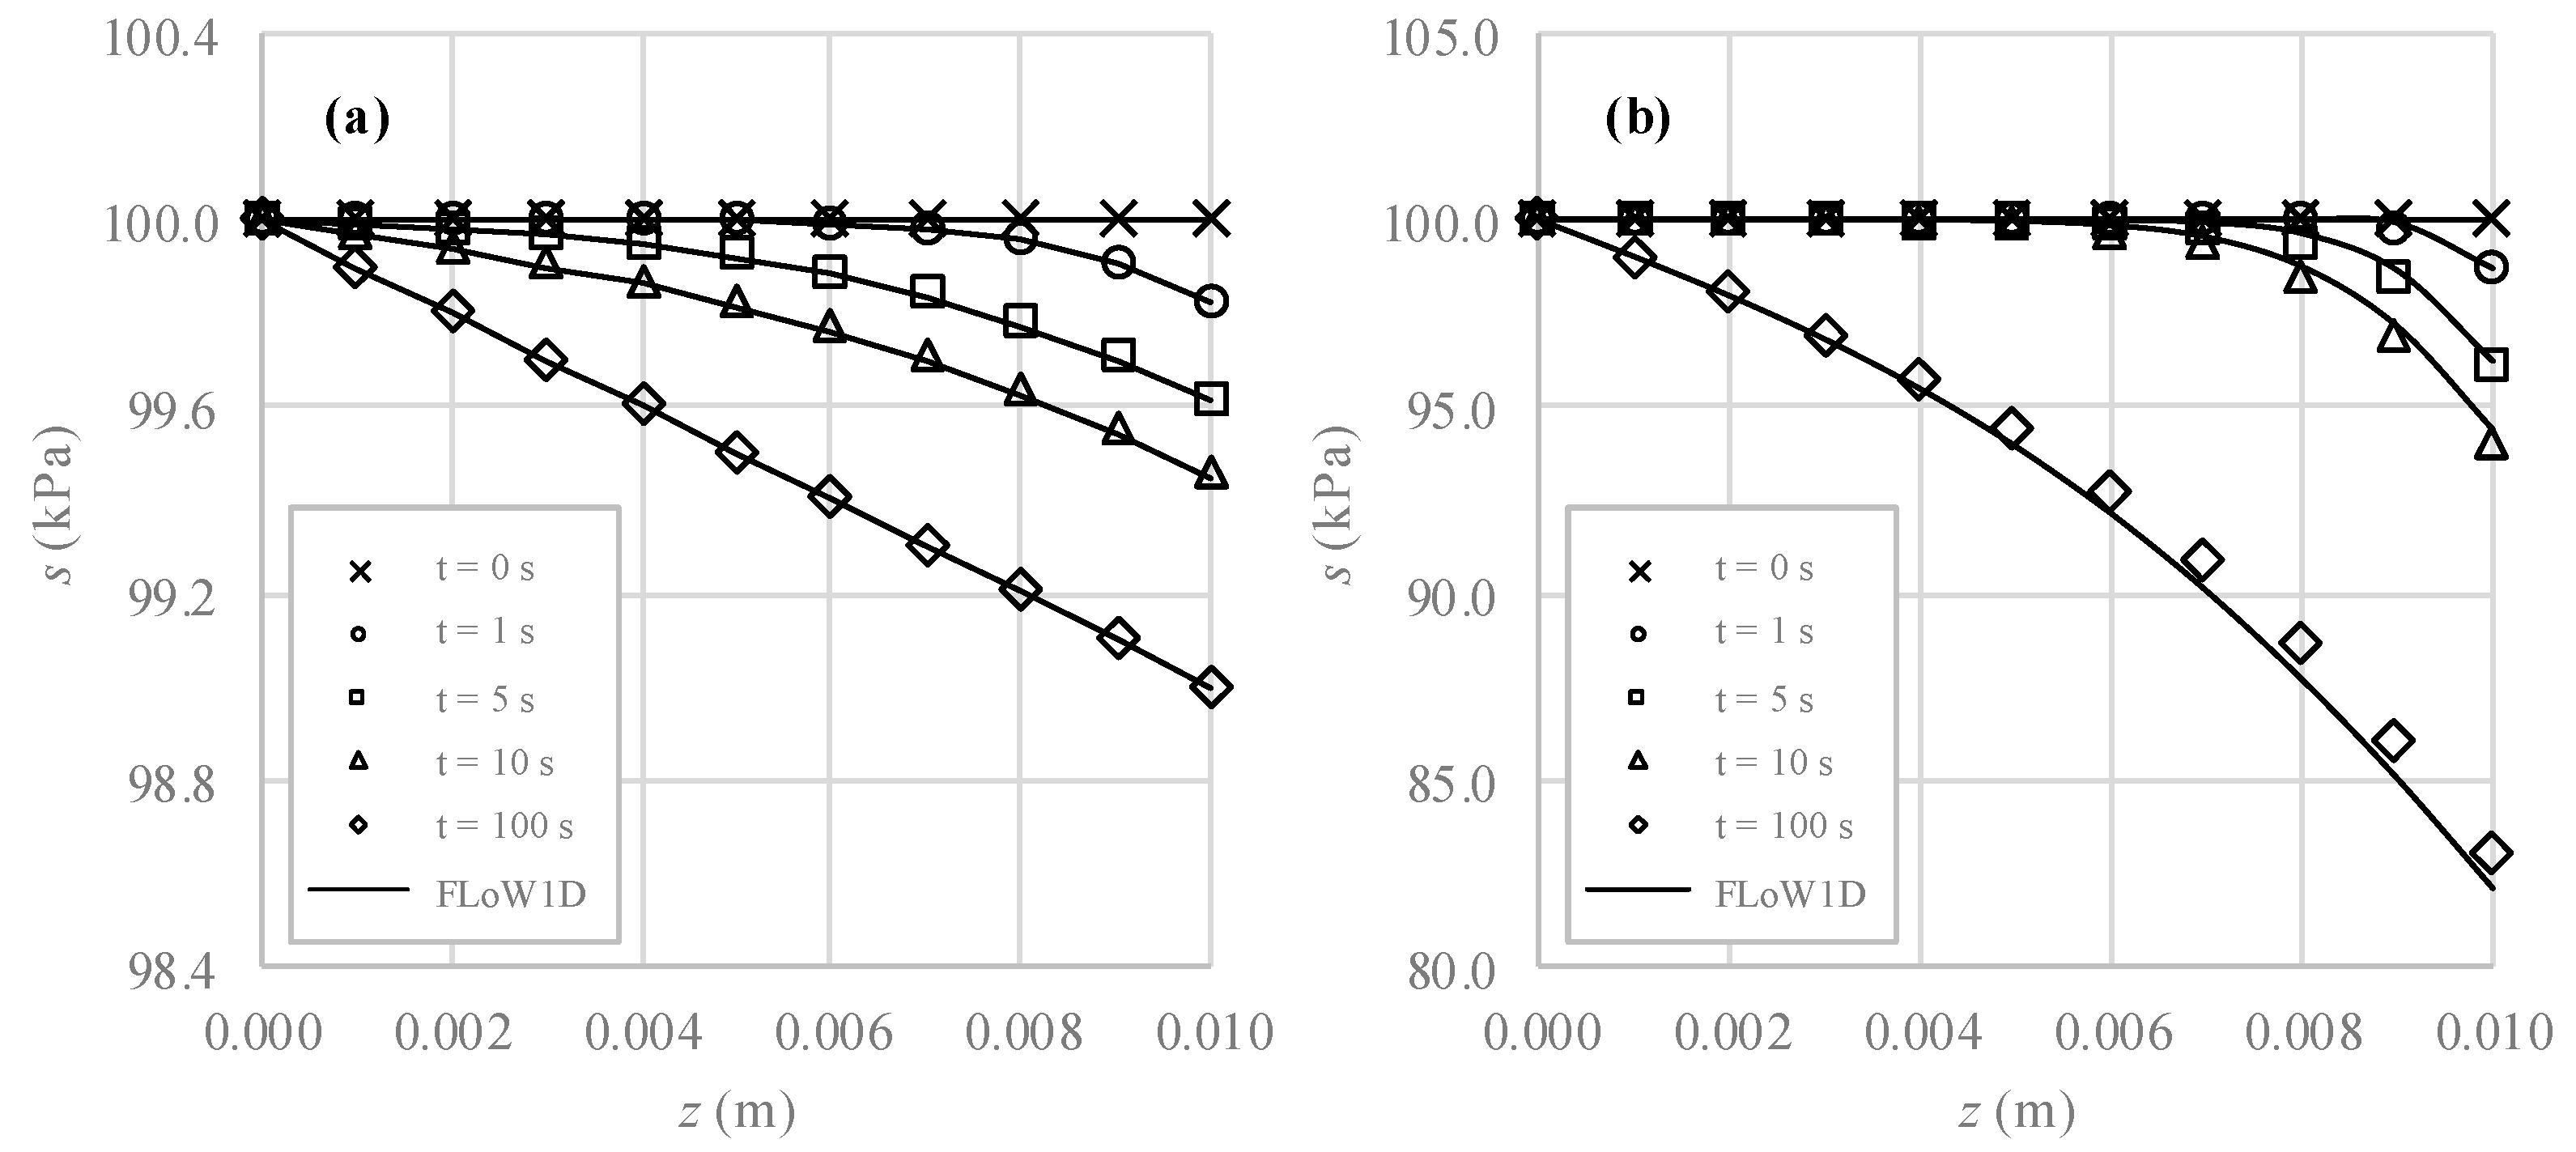
In the first two verification exercises (QE1 and QE2), a flux was imposed at the top of the domain, maintaining perfect drainage at the bottom. In the first case, a linear retention curve and constant hydraulic conductivity were assumed. These simplifications allowed the use of an analytical solution [28]. Figure 3a shows the satisfactory fit obtained with FLoW1D (with a mean absolute relative error (MARE) of 0.004%). For the second example presented, the same physical problem has been simulated, but the van Genuchten water retention curve and the non-constant hydraulic conductivity model defined in Table 1 were adopted. As a reference, this physical problem has been simulated using the well-known software SEEP/W-Geoslope® [29]. Figure 3b shows the good fit obtained (MARE = 0.22%).
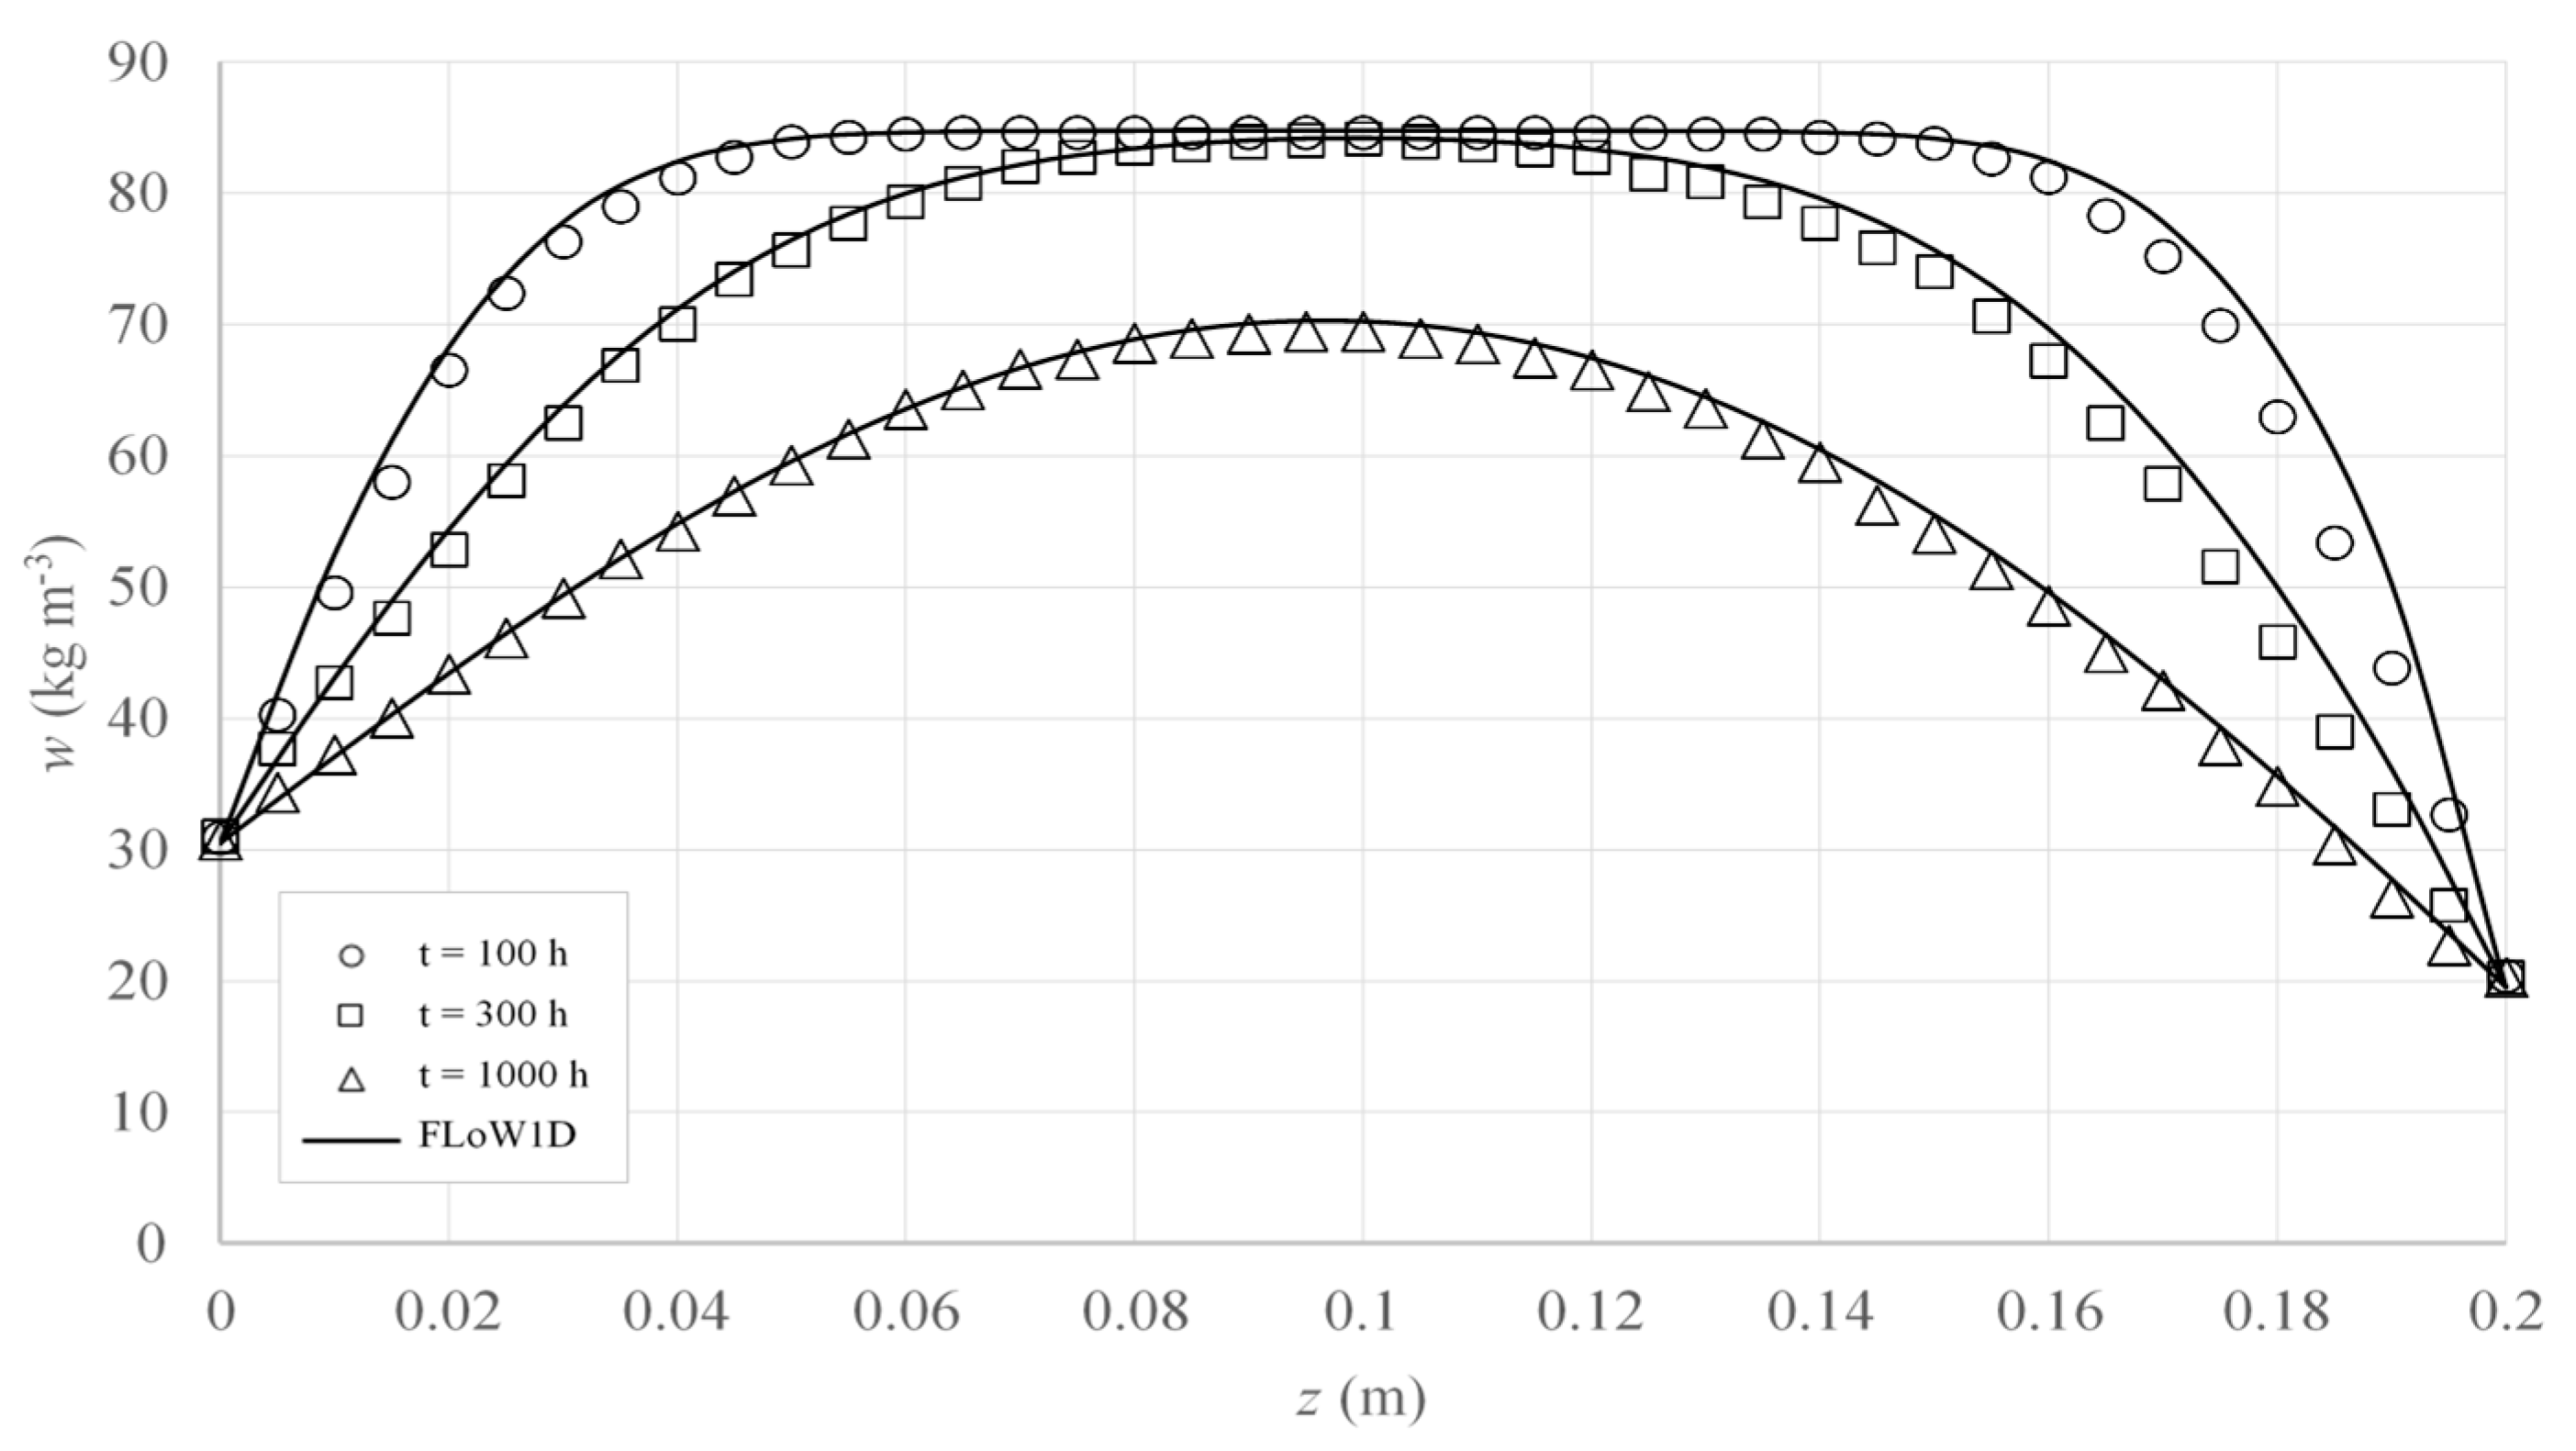
In addition to the liquid flow, the implementation of vapor transport has also been verified. Thus, among other exercises, benchmark 2 [30] defined in the benchmark report generated in the international project HAMSTAD [31] (a project focused on the standardization of formulation of heat, air and moisture transfer models) has been simulated. This benchmark—named exercise QE3 in Table 1—studies the 1D isothermal water flow in a reference material caused by a sudden change of the environmental RH. The results in Figure 4 show the good fit obtained (MARE = 1.77%), giving confidence regarding the use of FLoW1D to characterize the water transport in porous building materials.

4. Model Application

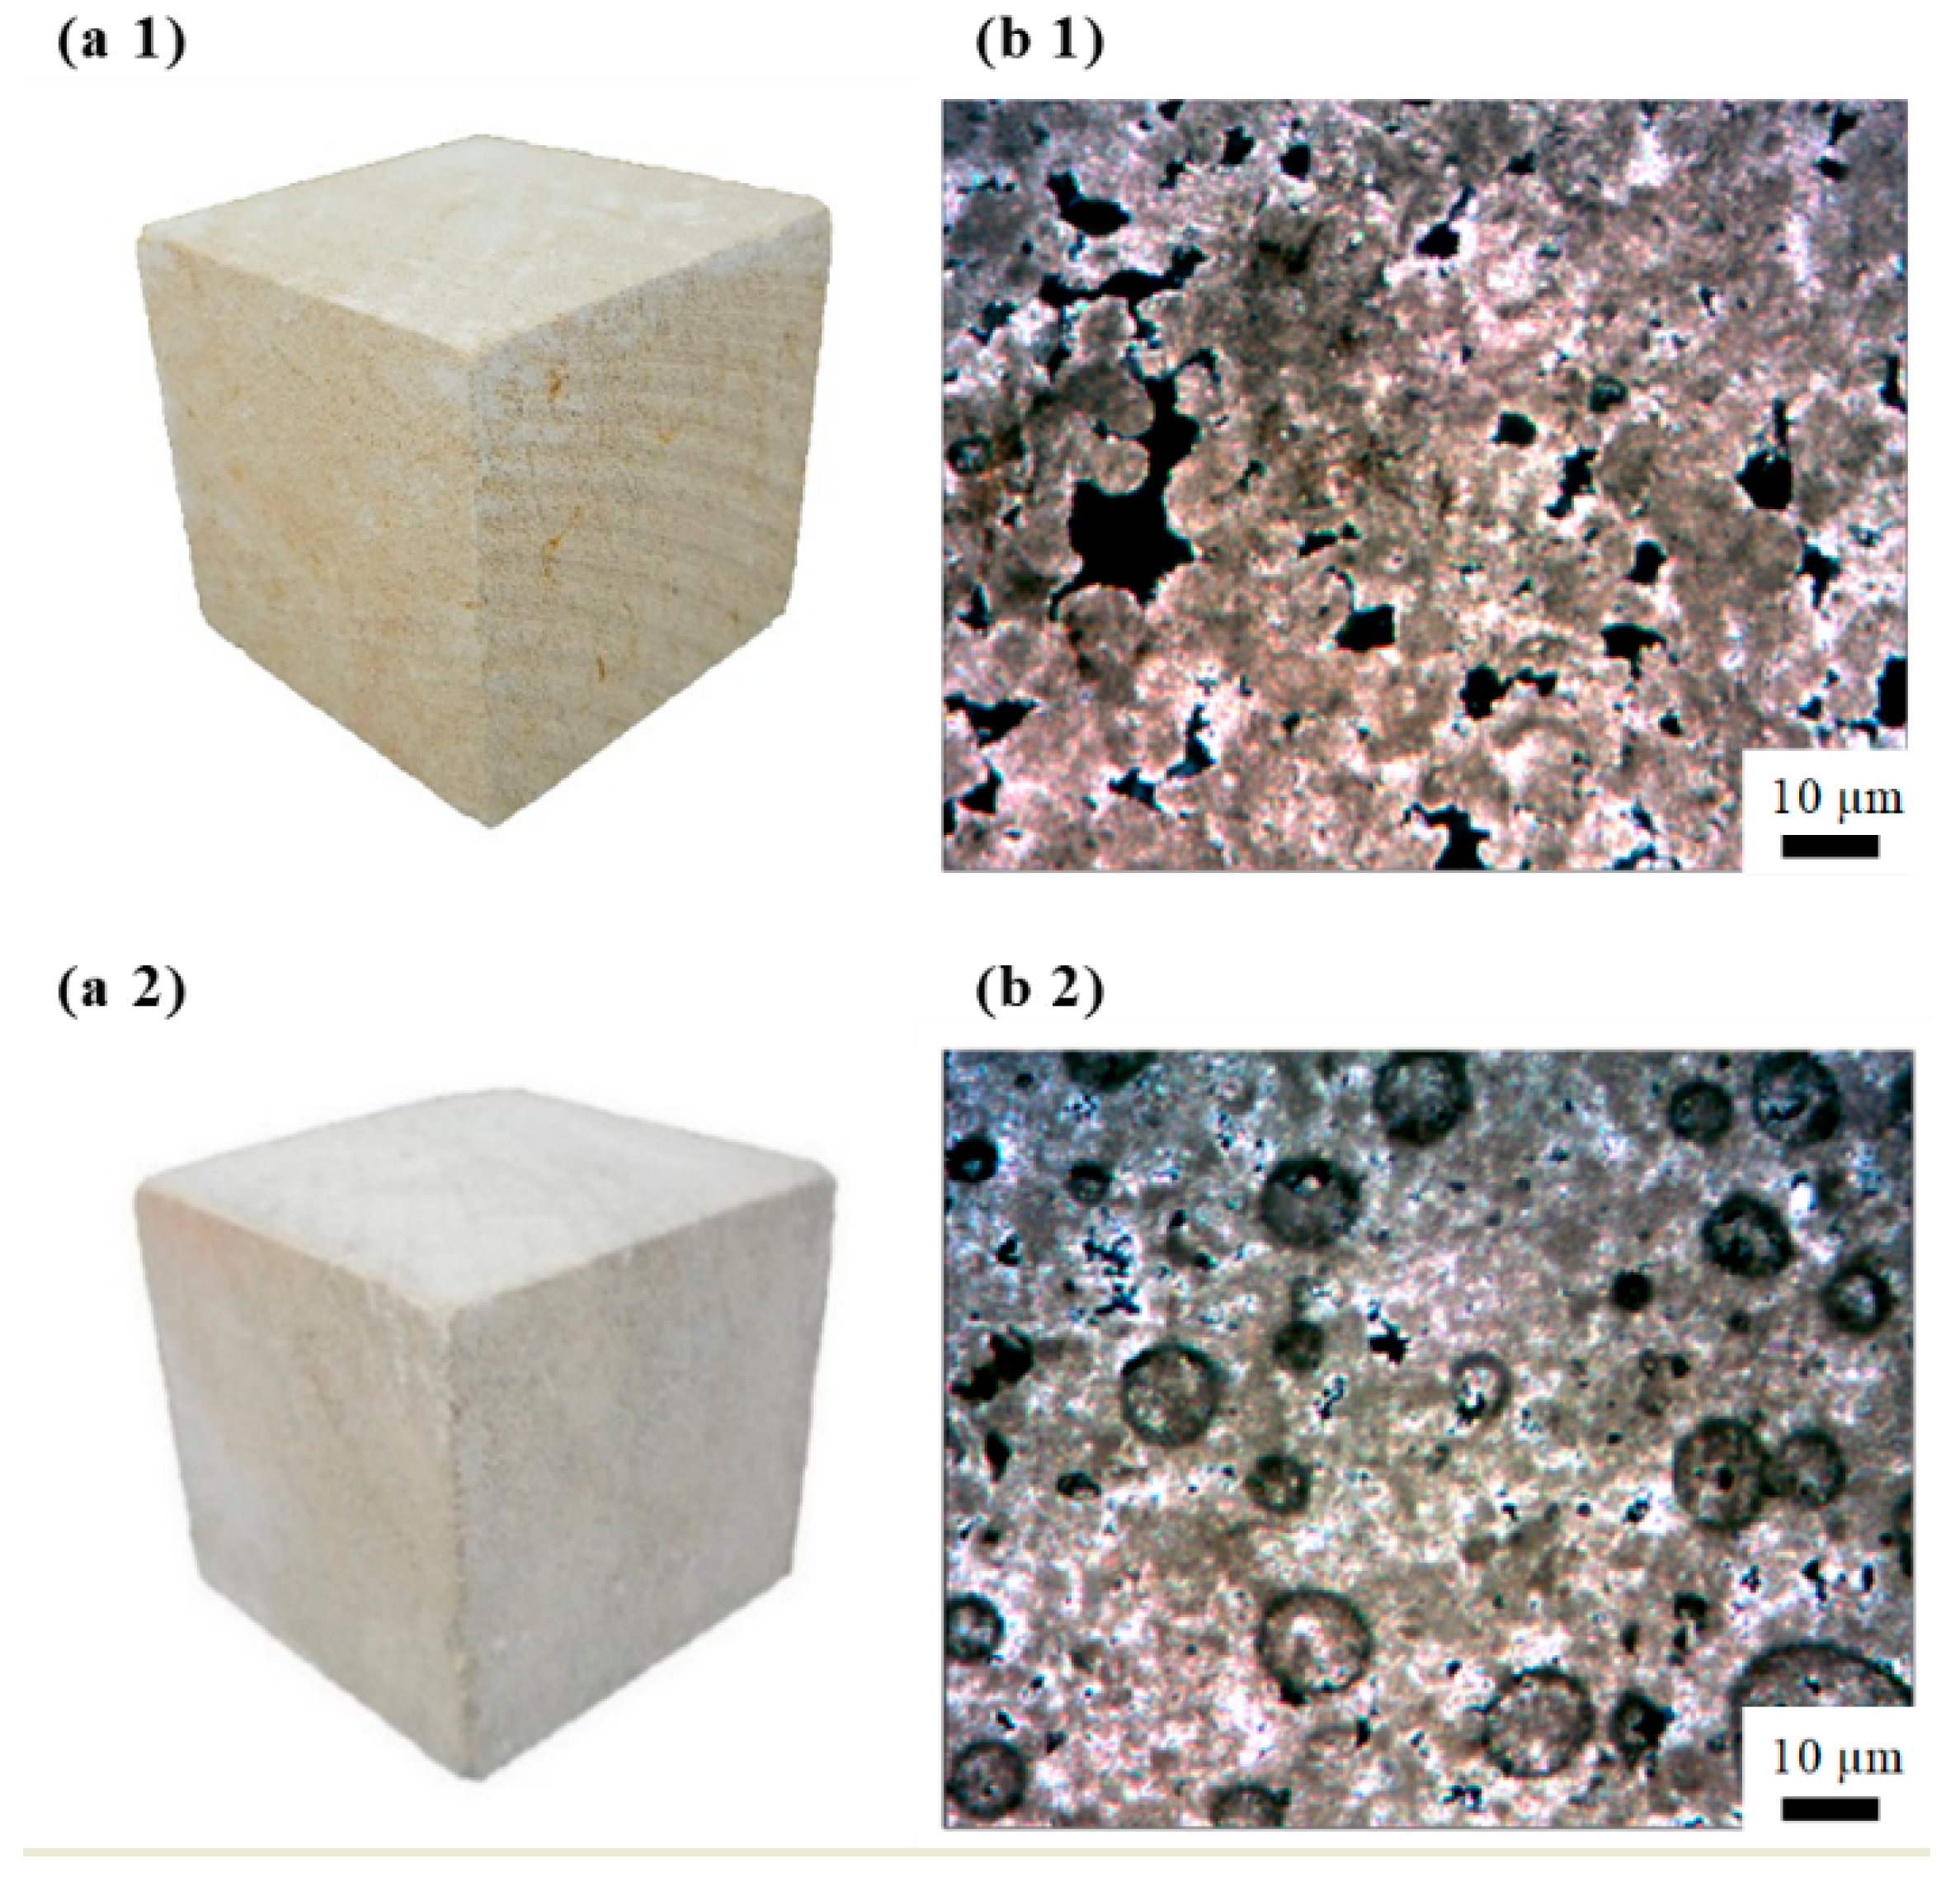
In order to illustrate the coupled use of FLoW1D with optimization modules in the Microsoft Excel© environment, WAC tests of the limestone used in the construction of the Cathedral of Santa María and San Julián in Cuenca, Spain were analyzed. Two different lithotypes of this limestone have been identified: the first lithotype is used in ornamental elements and named ornamental porous stone (OPS), and the second lithotype is a stone used in structural elements, denominated as structural porous stone (SPS). The chemical analysis (see Table S1) performed by X-ray diffraction (see Figure S1) shows that calcite is the major material in both lithotypes, along with a significant fraction of quartz (Q peak in Figure S1b) in SPS. The real and apparent densities [32] are 2746 and 1498 kg m−3, respectively, for OPS. In the case of SPS, these densities are 2623 and 1886 kg m−3, respectively. Figure 5(a1,a2) shows samples of the two tested materials. In the image of the optical microscope (Figure 5(b2)), ooliths of an approximate size of 10 μm are observed with a rounded shape and low crystallinity index, with small regular calcite envelopes whose nuclei are usually formed by quartz clasts, characterizing SPS. Furthermore, the distribution of pore sizes (Figure S2) obtained in the Mercury Intrusion Porosimetry (MIP) test shows that the mean pore size ranges between 1 and 20 μm for OPS and 0.1 and 10 μm for SPS [33]. Finally, regarding experimental characterization, Table 2 includes the WAC coefficients obtained according to EN 15801 [14].
In order to carry out the parameter estimation, FLoW1D was used with the predefined complement Solver of Microsoft Excel©. The Generalized Reduced Gradient (GRG) was the selected optimization option of Solver. This algorithm, developed by Abadie and Carpentier [34], is an extension of the Fank and Wolfe [35] reduced gradient method. Its mathematical structure has undergone continuous development [36,37,38,39], but the GRG2 version of this algorithm is the one implemented in Solver [40,41].
A least squares objective function was adopted. The intrinsic permeability, K, and the parameters of the van Genuchten retention curve, n and m, were the estimated material parameters. The porosity of the two samples tested was determined by ISO 17892-1 [42], obtaining results of 0.38 and 0.23 for OPS and SPS, respectively. A tortuosity value equal to 1 was assumed, in agreement with the work of Philip and de Vries [43].
The parameter α of the van Genuchten retention curve can be obtained by the relationship
α = 1 s o [ ( 1 S r o ) 1 m 1 ] 1 n
where the s o is the initial suction and S r o is the degree of saturation at the beginning of the WAC test obtained from the water mass in Equation (2):
S r o = w o ϕ   ρ v ϕ   ( ρ w ρ v )
where w o is the water content at the begging of the WAC test.
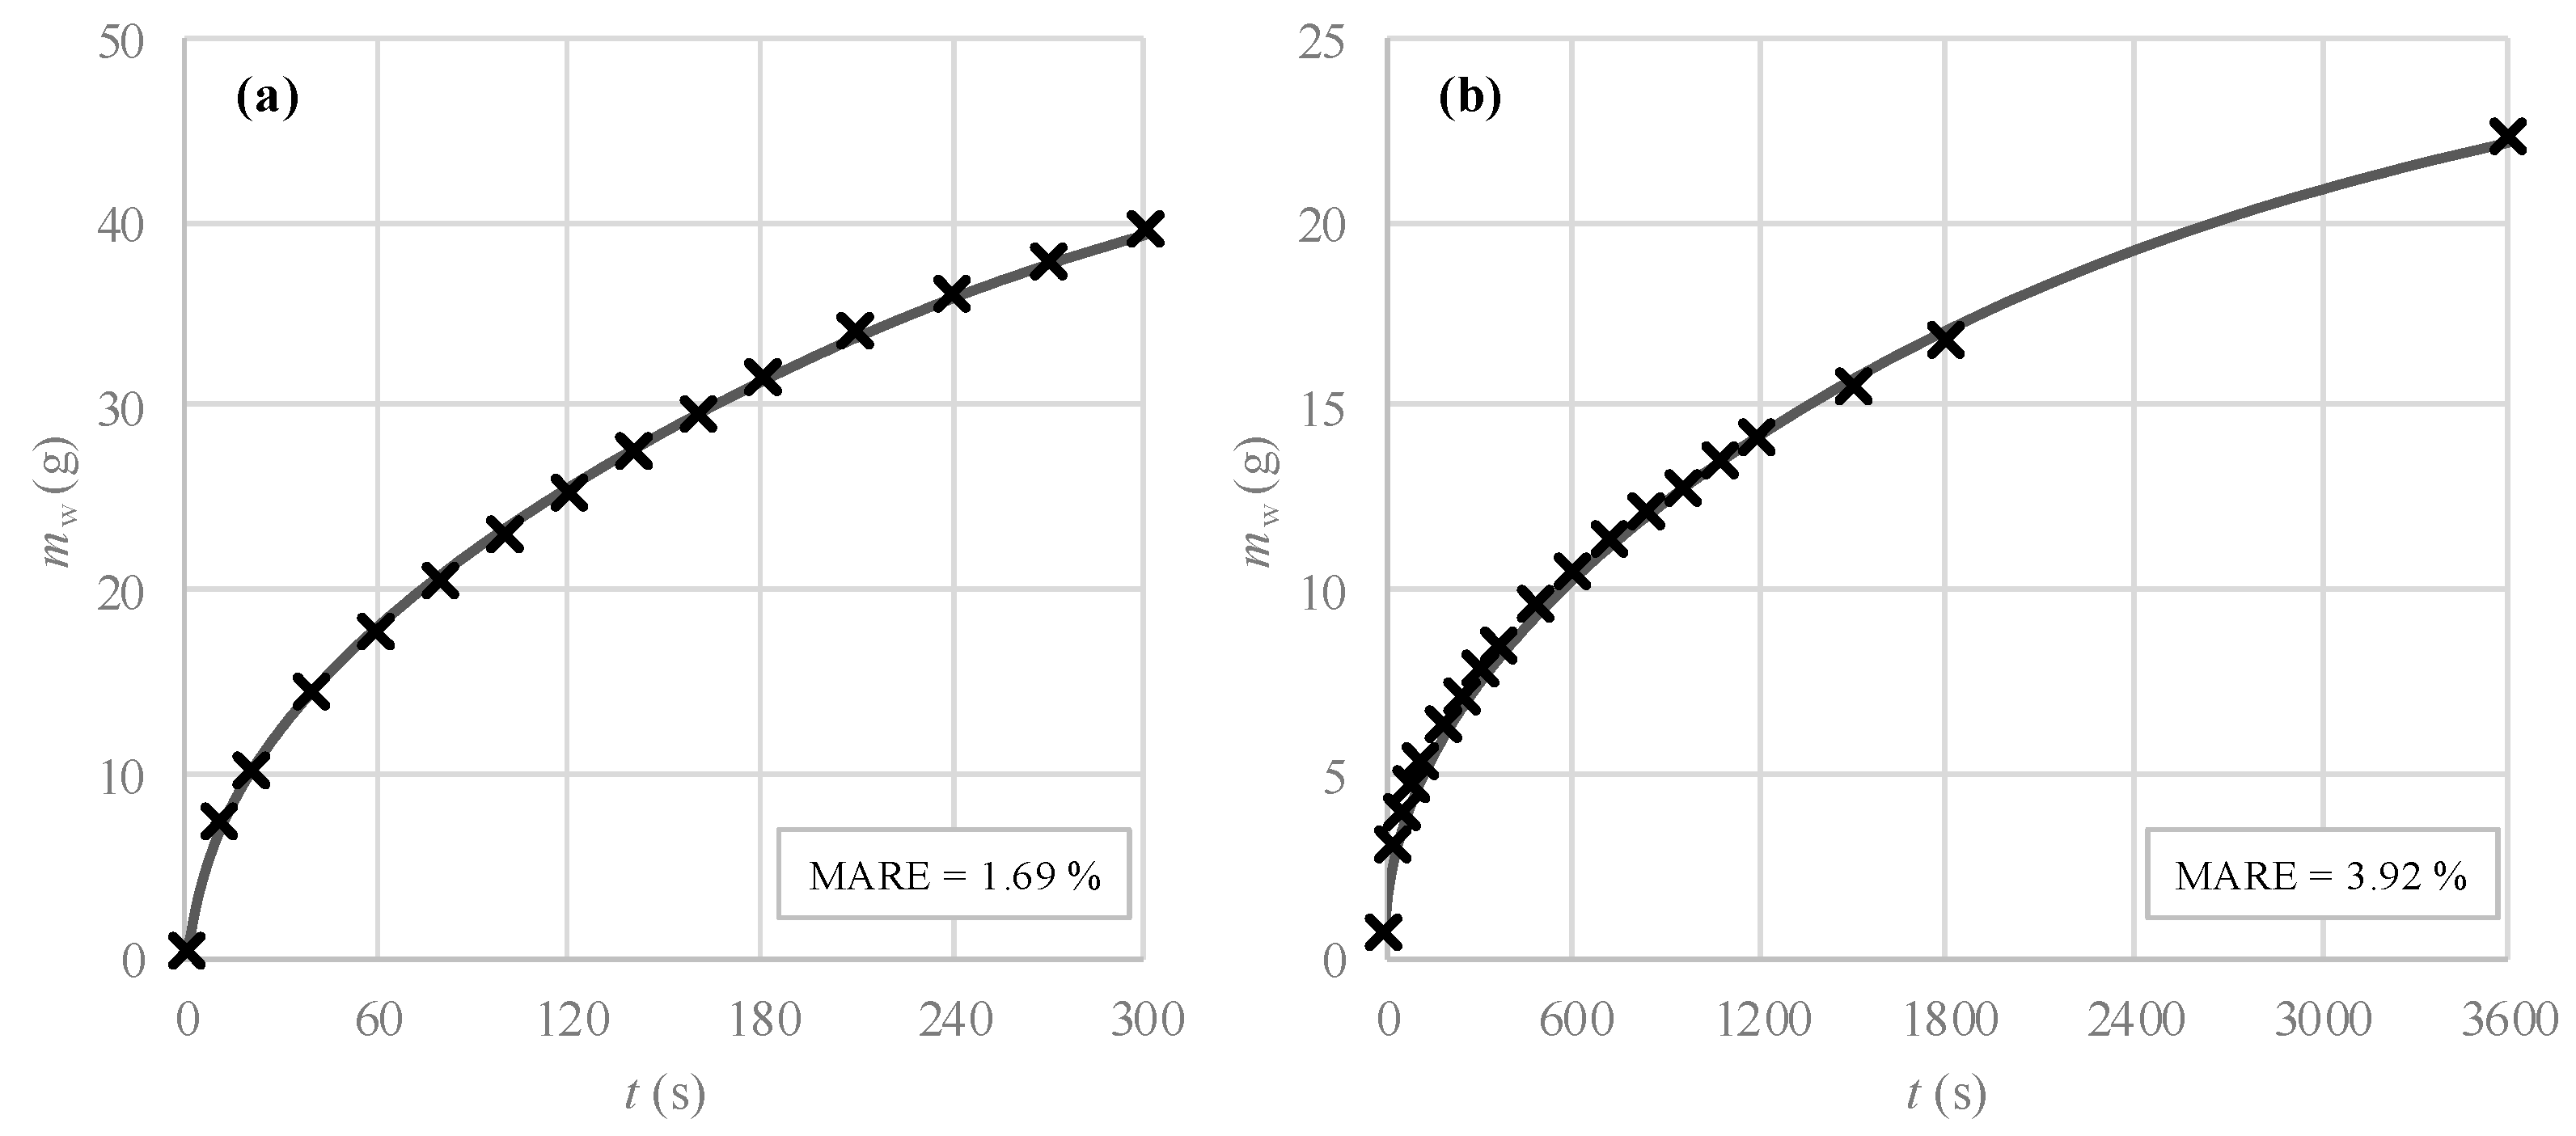
Figure 6 shows the results of two WAC tests carried out with OPS and SPS, respectively, and the simulation developed with the tool FLoW1D.
As can be observed in Figure 6, a satisfactory fit was obtained for both tests. The estimated values of K, n and m, are indicated in Table 3. This table also presents the parameter α, which is calculated using Equation (15) using estimated values of n and m.

5. Conclusions

This work presents FLoW1D, a numerical tool designed as a support for the analysis of the conventional experimental tests for the hygric characterization of porous building materials. The code simulates the one-dimensional moisture transfer in a partially saturated porous media. It has been verified against other widely used commercial codes and contrasting benchmarks, using other porous materials as a reference.
To increase its usability, FLoW1D has been developed as a function in the environment of the well-known Microsoft Excel© spreadsheet application using the Visual Basic for Applications language. This aspect provides flexibility to the numerical tool, which could be modified easily for the analysis of the hygric characterization of other partially saturated porous materials whose hygric behavior can be reproduced by the implemented state functions. Additionally, the computational method used is relatively simple (an explicit finite difference scheme has been used); therefore, no in-depth knowledge is required to make changes to the FLoW1D code. Finally, it is important to highlight the fact that FLoW1D is presented as an application developed in an Microsoft Office platform, providing greater accessibility to the scientific and technical community as the Microsoft Excel© spreadsheet application is a very common working environment used in laboratories.
The results presented in this work show that FLoW1D allows both the simulation of two WAC tests and the estimation of hygric parameters (the intrinsic permeability and associated parameters of the water retention curve) with robustness and ease when it is used in conjunction with the well-known Microsoft Excel© complement Solver. Therefore, FloW1D allows test analysis and parameter estimation to be performed in the same environment.

Supplementary Materials

The following are available online at https://www.mdpi.com/2076-3417/10/15/5090/s1, Figure S1: X-ray diffraction. (a) OPS and (b) SPS, Figure S2. MIP test. (a) OPS and (b) SPS, Table S1: Chemical composition of the PBM.

Author Contributions

V.C.: writing—original draft, methodology, software; R.L.-V.: writing—original draft, methodology, software; Á.Y.: writing—review & editing, conceptualization, methodology; M.Á.R.: data curation, investigation, resources; E.T.: data curation, investigation, resources; V.N.: funding acquisition, writing—review & editing, supervision. All authors have read and agreed to the published version of the manuscript.

Funding

The research contract of Virginia Cabrera was funded by Ministerio de Economía, Industria y Competitividad from the Spanish Government and the European Union under the grant [BIA2017-89287-R (AEI/FEDER, UE)]. The research contract of Rubén López-Vizcaíno was funded by the Ministerio de Ciencia, Innovación y Universidades from the Spanish Government through a Postdoctoral Grant [IJC-2018-035212]. The APC was funded the by Department of Civil Engineering and Construction of the Universidad de Castilla-La Mancha, Spain.

Conflicts of Interest

The authors declare no conflict of interest.

Appendix A. List of Symbols

a s Linear water retention curve parameter
b s Linear water retention curve parameter
D v Binary diffusion coefficient of water vapor
D w Liquid water diffusivity
g Water flow rate
g v Water vapor flow rate
g w Liquid water flow rate
kLiquid conductivity
KIntrinsic permeability
KsatSaturated conductivity
LLength of the sample
M M w Relative mass of water
mParameter of the van Genuchten’s water retention curve
nParameter of the van Genuchten’s water retention curve
P G Gas pressure
P L Liquid water pressure
P v Water vapor pressure
P v ,   sat Water vapor pressure at vapor saturated conditions
P v , 0 Environmental water vapor pressure (bottom interface)
P v , 1 Water vapor pressure at grid point 1
P v , n Water vapor pressure at grid point n
P v , an Environmental water vapor pressure (top interface)
R Ideal gas constant
RHRelative humidity
s Matric suction
s o Suction at the beginning of WAC test
s d , 0 Equivalent vapor diffusion thickness of the bottom interfaces
s d , n Equivalent vapor diffusion thickness of the top interfaces
S r Degree of saturation
S r o Degree of saturation at the beginning of WAC test
tTime
TAbsolute temperature
T ^ Temperature in Celsius
w Water content
w w Liquid water content
w v Water vapor content
w o Water content at the beginning of WAC test
X v Mass fraction of the vapor
zSpatial coordinate
αParameter of the van Genuchten’s water retention curve
γ w Specific weight of water
δ 0 Vapor permeability of still air
δ p Vapor permeability
θ Volumetric water content
  θ sat Volumetric water content in saturated conditions
κ Relative permeability
λ Empiric parameter of the Brooks and Corey model
μ Diffusion resistance factor
μ w Dynamic viscosity of the liquid water
ρ G Gas density
ρ v Water vapor density
ρ v , sat Water vapor density in saturated conditions
ρ w Liquid water density
τ v Tortuosity
ϕ Porosity

Appendix B. Water Properties

The density of water vapor, ρ v , is calculated by the law of ideal gases:
ρ v = M M w R   T P v
where M M w is the relative mass of water (kg mol−1), R is the ideal gas constant (Pa m3 mol−1 K−1), T is the absolute temperature (K) and P v is the water vapor pressure (Pa), obtained from the psychrometric equation [44] as a function of suction, s.
P v = P v , sat   exp ( M M w   s ρ w   R   T )
where, if the vapor is an ideal gas, the vapor pressure in saturated conditions is calculated as
P v , sat =   R   T M M w ρ v , sat
where ρ v , sat is the density of water vapor under saturated conditions. It is obtained by the expression [45]
ρ v , sat = exp ( 0.06374   T ^   0.1634 × 10 3 T ^ 2 ) 194.4
where T ^ is the temperature (°C). Finally, the dynamic viscosity of the water (N s m−2) is defined as [45]
μ w = 0.6612   ( T 229 ) 1.562
where T is the absolute temperature (K).

Appendix C. Numerical Model

To solve the boundary value problem, an explicit centered finite difference scheme has been developed. The time derivative of the water content is expressed as
w t = w s s t =   ( θ ρ w + ( θ s a t θ ) ρ v ) s   s t = [ ( ρ w ρ v ) θ s + ( θ sat θ ) ρ v s ] s t
Approximating the derivatives by increments,
s t Δ s Δ t = s i j s i j 1 Δ t
where s i j refers to the suction in the ith grid point at jth time step. Consequently, the increase of the moisture content in each time step is calculated by
Δ w Δ t = [ ( ρ w ρ v ) θ s + ( θ sat θ ) ρ v s ] i j 1 Δ s Δ t
On the other hand, the water flow rate (a scalar magnitude in this 1D model) can be written as
g = g w + g v = [ κ   K μ   ρ w τ v   ( θ sat θ )   D v ρ v s ] s z
The water flow rate is calculated at the center of two consecutive grid points; i.e., in i + 1 2 and i 1 2 (see Figure A1). Therefore, it can be assumed that
g i + 1 2 j 1 = [ κ   K μ   ρ w τ v   ( θ sat θ )   D v ρ v s ] i + 1 2 j 1   s i + 1 j 1 s i j 1 Δ z
g i 1 2 j 1 = [ κ   K μ ρ w τ v   ( θ sat θ )   D v ρ v s ] i 1 2 j 1   s i j 1 s i 1 j 1 Δ z
Therefore, the divergence of the water flow density can be approximated by
g z = Δ g Δ z | i j 1 g i + 1 2 j 1 g i 1 2 j 1 Δ z
Considering this approximation, the suction of the ith grid point at time step j − 1 ( s i j 1 ) is updated to s i j as
s i j = s i j 1 Δ g Δ z | i j 1 [ ( ρ w ρ v ) θ s + ( θ sat θ ) ρ v s ] i j 1     Δ t
The described formulation constitutes a forward-time central-space (FTCS) scheme (with an evaluation of the spatial differences at the midpoints of the grid for a better evaluation of the non-linear storage term).
The computational time interval is defined by the initial and final time; i.e., “Tini” and “Tfin”. The time step of the interval, Δ t , was defined in the code, which was an arbitrarily chosen value and remained constant throughout the calculation process. The time was updated after each time step until the final value of the interval (“Tfin”) was reached, when the calculation process ended.
Figure A1. Definition of the points at which the water flow rate was calculated.
Applsci 10 05090 g0a1

References

  1. Fierascu, R.C.; Doni, M.; Fierascu, I. Selected aspects regarding the restoration/conservation of traditional wood and masonry building materials: A short overview of the last decade findings. Appl. Sci. 2020, 10, 1164. [Google Scholar] [CrossRef] [Green Version]
  2. Kis, Z.; Sciarretta, F.; Szentmiklósi, L. Water uptake experiments of historic construction materials from Venice by neutron imaging and PGAI methods. Mater. Struct. Mater. Constr. 2017, 50. [Google Scholar] [CrossRef]
  3. Grazzini, A.; Fasana, S.; Zerbinatti, M.; Lacidogna, G. Non-destructive tests for damage evaluation of stone columns: The case study of sacro monte in ghiffa (Italy). Appl. Sci. 2020, 10, 2673. [Google Scholar] [CrossRef]
  4. Portal, N.W.; van Schijndel, A.W.M.; Kalagasidis, A.S. The multiphysics modeling of heat and moisture induced stress and strain of historic building materials and artefacts. Build. Simul. 2014, 7, 217–227. [Google Scholar] [CrossRef] [Green Version]
  5. Moropoulou, A.; Avdelidis, N.P.; Karoglou, M.; Delegou, E.T.; Alexakis, E.; Keramidas, V. Multispectral applications of infrared thermography in the diagnosis and protection of built cultural heritage. Appl. Sci. 2018, 8, 284. [Google Scholar] [CrossRef]
  6. AENOR. UNE 41810:2017. Conservación del patrimonio cultural. In Criterios de Intervención en Materiales Pétreos; Asociación Española de Normalización: Madrid, Spain, 2017. [Google Scholar]
  7. CEN. UNE-EN 16515:2015. Conservation of Cultural Heritage—Guidelines to Characterize Natural Stone Used in Cultural Heritage; European Committee for Standardization: Brussels, Belgium, 2015. [Google Scholar]
  8. Delgado, J.M.P.Q.; Ramos, N.M.M.; Barreira, E.; De Freitas, V.P. A critical review of hygrothermal models used in porous building materials. J. Porous Media 2010, 13, 221–234. [Google Scholar] [CrossRef]
  9. Hens, H.L.S.C. Combined heat, air, moisture modelling: A look back, how, of help? Build. Environ. 2015, 91, 138–151. [Google Scholar] [CrossRef]
  10. Van Schijndel, A.W.M. Multiphysics modeling of building physical constructions. Build. Simul. 2011, 4, 49–60. [Google Scholar] [CrossRef]
  11. Gasparin, S.; Berger, J.; Dutykh, D.; Mendes, N. Stable explicit schemes for simulation of nonlinear moisture transfer in porous materials. J. Build. Perform. Simul. 2018, 11, 129–144. [Google Scholar] [CrossRef]
  12. Qin, Y.; Hiller, J.E. Simulating moisture distribution within concrete pavement slabs: Model development and sensitivity study. Mater. Struct. Mater. Constr. 2014, 47, 351–365. [Google Scholar] [CrossRef]
  13. CEN. EN 15026:2007. Hygrothermal Performance of Building Components and Building Elements—Assessment of Moisture Transfer by Numerical Simulation; European Committee for Standardization: Brussels, Belgium, 2007. [Google Scholar]
  14. CEN. EN 15801:2009. Conservation of Cultural Property-Test Methods-Determination of Water Absorption by Capillarity; European Committee for Standardization: Brussels, Belgium, 2009. [Google Scholar]
  15. Carmeliet, J.; Roels, S. Determination of the Isothermal Moisture Transport Properties of Porous Building Materials. J. Therm. Envel. Build. Sci. 2001, 24, 183–210. [Google Scholar] [CrossRef]
  16. Roels, S.; Carmeliet, J.; Hens, H.; Adan, O.; Brocken, H.; Cerny, R.; Pavlik, Z.; Ellis, A.T.; Hall, C.; Kumaran, K.; et al. A Comparison of Different Techniques to Quantify Moisture Content Profiles in Porous Building Materials. J. Therm. Envel. Build. Sci. 2004, 27, 261–276. [Google Scholar] [CrossRef]
  17. Gomez, I.; Sala, J.M.; Millan, J.A. Characterization of moisture transport properties for lightened clay brick—Comparison between two manufacturers. J. Build. Phys. 2007, 31, 179–194. [Google Scholar] [CrossRef]
  18. Galvan, S.; Pla, C.; Cueto, N.; Martínez-Martínez, J.; García-del-Cura, M.A.; Benavente, D. A comparison of experimental methods for measuring water permeability of porous building rocks. Mater. Constr. 2014, 64. [Google Scholar] [CrossRef] [Green Version]
  19. Amirkhanov, I.V.; Pavlušová, E.; Pavluš, M.; Puzynina, T.P.; Puzynin, I.V.; Sarhadov, I. Numerical solution of an inverse diffusion problem for the moisture transfer coefficient in a porous material. Mater. Struct. Mater. Constr. 2008, 41, 335–344. [Google Scholar] [CrossRef]
  20. Rouchier, S.; Woloszyn, M.; Kedowide, Y.; Béjat, T. Identification of the hygrothermal properties of a building envelope material by the covariance matrix adaptation evolution strategy. J. Build. Perform. Simul. 2016, 9, 101–114. [Google Scholar] [CrossRef] [Green Version]
  21. Guardia, C.; Schicchi, D.S.; Caggiano, A.; Barluenga, G.; Koenders, E. On the capillary water absorption of cement-lime mortars containing phase change materials: Experiments and simulations. Build. Simul. 2019. [Google Scholar] [CrossRef]
  22. Cabrera, V.; López-Vizcaíno, R.; Yustres, Á.; Ruiz, M.Á.; Torrero, E.; Navarro, V. A functional structure for state functions of moisture transfer in heritage building elements. J. Build. Eng. 2020, 29, 101201. [Google Scholar] [CrossRef]
  23. Van Genuchten, M.T. A closed-form equation for predicting the hydraulic conductivity of unsaturated soils. Soil Sci. Soc. Am. J. 1980, 44, 892–898. [Google Scholar] [CrossRef] [Green Version]
  24. Mualem, Y. A new model for predicting the hydraulic conductivity of unsaturated porous media. Water Resour. Res. 1976, 12, 513–522. [Google Scholar] [CrossRef] [Green Version]
  25. Pollock, D.W. Simulation of fluid-flow and energy transport processes associated with high-level radioactive-waste disposal in unsaturated alluvium. Water Resour. Res. 1986, 22, 765–775. [Google Scholar] [CrossRef]
  26. Brooks, R.H.; Corey, A.T. Hydraulic Properties of Porous Media; Colorado State University: Fort Collins, CO, USA, 1964. [Google Scholar]
  27. Microsoft Office. Guidelines and Examples of Array Formulas. Available online: https://support.microsoft.com/en-us/office/guidelines-and-examples-of-array-formulas-7d94a64e-3ff3-4686-9372-ecfd5caa57c7 (accessed on 15 June 2020).
  28. Carslaw, H.S.; Jaeger, J.C. Conduction of Heat in Solids, 2nd ed.; Clarendon Press: Oxford, UK, 1959; p. 510. [Google Scholar] [CrossRef]
  29. GEO-SLOPE. Seepage Modeling with SEEP/W. In An Engineering Methodology; GeoStudio: Calgary, AB, Canada, 2012. [Google Scholar]
  30. Hagentoft, C.E.; Kalagasidis, A.S.; Adl-Zarrabi, B.; Roels, S.; Carmeliet, J.; Hens, H.; Grunewald, J.; Funk, M.; Becker, R.; Shamir, D.; et al. Assessment Method of Numerical Prediction Models for Combined Heat, Air and Moisture Transfer in Building Components: Benchmarks for One-dimensional Cases. J. Build. Phys. 2004, 27, 327–352. [Google Scholar] [CrossRef]
  31. Adan, O.; Brocken, H.; Carmeliet, J.; Hens, H.; Roels, S.; Hagentoft, C.E. Determination of Liquid Water Transfer Properties of Porous Building Materials and Development of Numerical Assessment Methods: Introduction to the EC HAMSTAD Project. J. Build. Phys. 2004, 27, 253–260. [Google Scholar] [CrossRef]
  32. CEN. EN 1936:2006. Natural Stone Test Methods—Determination of Real Density and Apparent Density, and of Total and Open Porosity; European Committee for Standardization: Brussels, Belgium, 2006. [Google Scholar]
  33. Torrero, E.; Sanz, D.; Navarro, V. Porosity and Pore Size Distribution of the Dimension Stone in the Historic City of Cuenca. In Construction and Building Research; Llinares-Millán, C., Fernández-Plazaola, I., Hidalgo-Delgado, F., Martínez-Valenzuela, M.M., Medina-Ramón, F.J., Oliver-Faubel, I., Rodríguez-Abad, I., Salandin, A., Sánchez-Grandia, R., Tort-Ausina, I., Eds.; Springer: Dordrecht, The Netherlands, 2014; pp. 523–529. [Google Scholar] [CrossRef]
  34. Abadie, J.; Carpentier, J. Generalization of the Wolfe reduced gradient method to the case of nonlinear constraints. In Optimization; Fletcher, R., Ed.; Academic Press: New York, NY, USA, 1969. [Google Scholar]
  35. Frank, M.; Wolfe, P. An Algorithm for Quadratic Programming. Nav. Res. Logist. Q. 1956, 3, 95–110. [Google Scholar] [CrossRef]
  36. Lasdon, L.S.; Waren, A.D.; Jain, A.; Ratner, M. Design and Testing of a Generalized Reduced Gradient Code for Nonlinear Constrained Programming. ACM Trans. Math. Softw. 1978, 4, 34–50. [Google Scholar] [CrossRef]
  37. Lasdon, L.S.; Waren, A.D. Generalized Reduced Gradient Software for Linearly and Nonlinearly Constrained Problems; Sijthoff and Noordhoff: Amsterdam, The Netherlands, 1978; pp. 363–397. [Google Scholar]
  38. Abadie, J. The GRG Method for Nonlinear Programmin; Sijthoff and Noordhoof: Amsterdam, The Netherlands, 1978; pp. 335–363. [Google Scholar]
  39. Wolfe, P. Methods of Nonlinear Programming; John Wiley: New York, NY, USA, 1976. [Google Scholar]
  40. Lasdon, L.S.; Waren, A.D. GRG2: An all FORTRAN general purpose nonlinear optimizer. SIGMAP Bull. 1981, 10–11. [Google Scholar] [CrossRef]
  41. Fylstra, D.; Lasdon, L.S.; Watson, J.; Waren, A.D. Design and use of the Microsoft Excel Solver. Interfaces 1998, 28, 29–55. [Google Scholar] [CrossRef] [Green Version]
  42. ISO. ISO 17892-1:2014. Geotechnical Investigation and Testing—Laboratory Testing of Soil—Part 1: Determination of Water Content; International Organization for Standardization: Geneva, Switzerland, 2014. [Google Scholar]
  43. Philip, J.R.; De Vries, D.A. Moisture movement in porous materials under temperature gradients. Eos Trans. Am. Geophys. Union 1957, 38, 222–232. [Google Scholar] [CrossRef]
  44. Edlefsen, N.E.; Anderson, A.B.C. Thermodynamics of soil moisture. Hilgardia 1943, 15, 31–298. [Google Scholar] [CrossRef] [Green Version]
  45. Ewen, J.; Thomas, H.R. HEATING UNSATURATED MEDIUM SAND. Geotechnique 1989, 39, 455–470. [Google Scholar] [CrossRef]
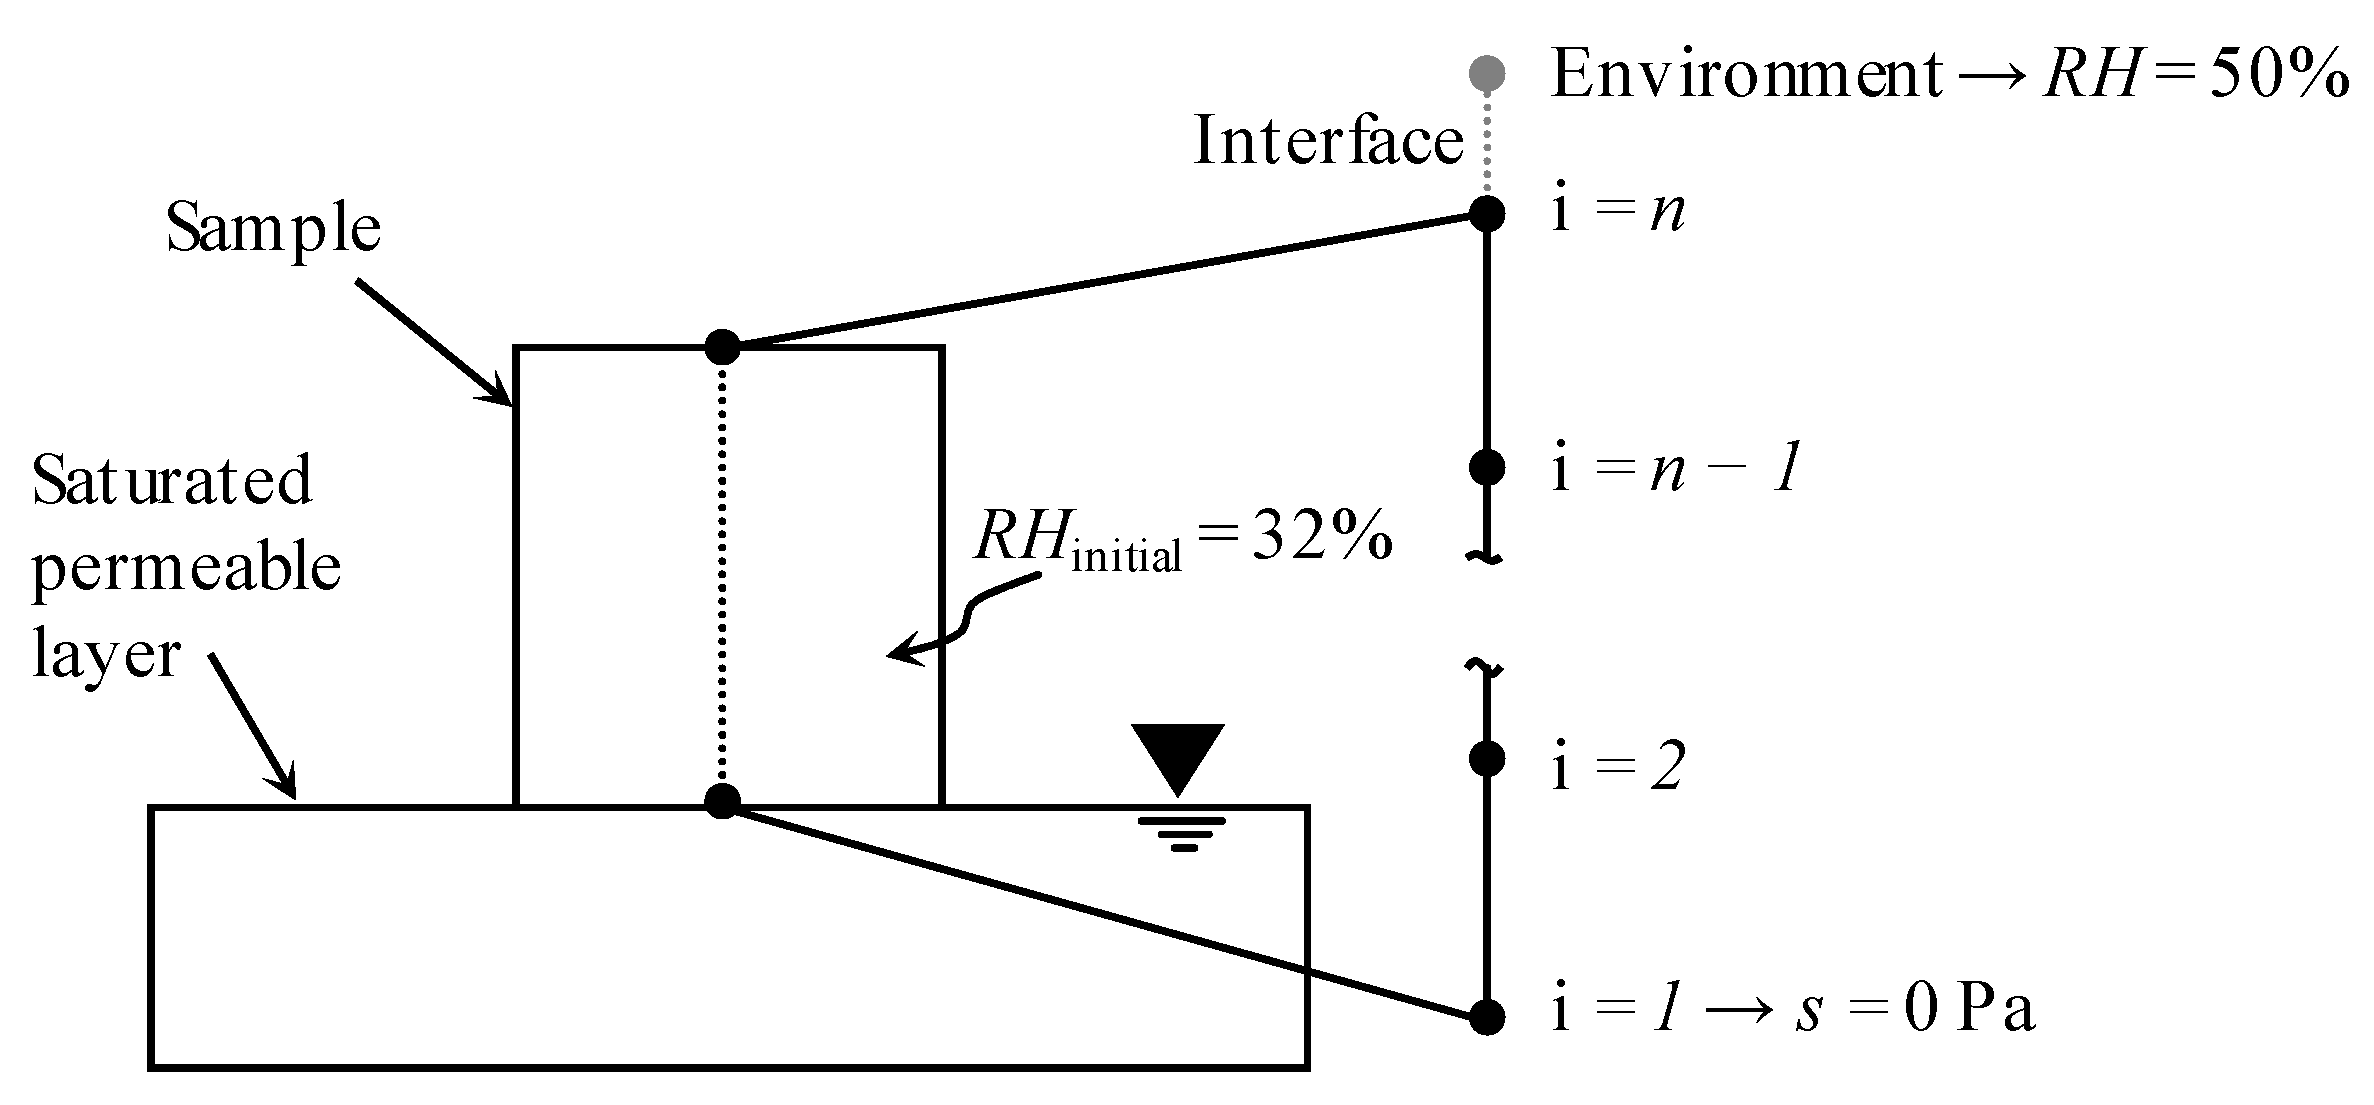
Figure 1. System abstraction discretization, boundary and initial conditions. RH: relative humidity.
Applsci 10 05090 g001
Figure 2. FLoW1D (One-Dimensional Water Flow) interface. (a) Input data. (b) FLoW1D function. (c) Water content function. (d) Total water content.
Applsci 10 05090 g002
Figure 3. Suction isochrones (s) obtained with FLoW1D vs. reference solution. (a) Analytic and (b) SEEP/W-Geoslope®. Markers, reference solution; solid lines, FLoW1D results.
Applsci 10 05090 g003
Figure 4. Water content isochrones (w) obtained with FLoW1D vs. reference solution (HAMSTAD Benchmark 2). Markers, reference solution; solid lines, FLoW1D results.
Applsci 10 05090 g004
Figure 5. Ornamental porous stone (OPS) (1) and structural porous stone (SPS) (2). Sample (a) and picture from an optical microscope (b).
Applsci 10 05090 g005
Figure 6. Evolution of the cumulative water mass in (a) OPS and (b) SPS. Markers, experimental data (wtot,obs); solid line, FLoW1D results (wtot,cal).
Applsci 10 05090 g006
Table 1. Parameters and dimensions of the simulated material samples.
ParametersQualification Exercises
Liquid TransportLiquid and Vapor Transport
QE1 AnalyticQE2 Seep/WQE3 HAMSTAD.
Benchmark 2
Parameters and Dimensions
L (m)0.010.010.20
ϕ 0.32410.32410.1160
Water retention function S r = b s a s s S r = ( 1 + ( α   s ) n ) m S r = ( 1 + ( α   s ) n ) m
a s (Pa−1)4.13 × 10⁻⁶--
α (Pa−1)-2.30 × 10−46.26 × 10−8
b s 1--
n -1.390.869
m- m = 1 1 / n m = 1 1 / n
κ1 κ = S r 3 -
K (m2)3.10 × 10−153.10 × 10⁻¹⁵-
D w (m2 s−1)--6.00 × 10⁻¹⁰
T ^ (°C)222220
δ p (s)--1.00 × 10⁻¹⁵
Initial and boundary conditions
Initial conditions = 100 kPas = 100 kPaRH = 95%
Top condition g w = 3.27 × 10 4   kg   m 2 s 1 g w = 3.27 × 10 4   kg   m 2 s 1 RH = 65%
Bottom conditions = 100 kPas = 100 kPaRH = 45%
Table 2. Water absorption by capillarity (WAC) coefficients for samples.
SampleWAC Coefficient (kg m−2 s−1/2)R2
OPS0.91570.976
SPS0.16550.998
Table 3. Material parameters of samples.
SampleK (m2)n (–)m (–)α (Pa−1)
OPS1.27 × 10−130.840.704.68 × 10−5
SPS8.38 × 10−150.620.667.08 × 10−5