Article

Agricultural Evolution: Process, Pattern and Water Resource Effect

1
State Key Laboratory of Resources and Environmental Information System, Institute of Geographical Sciences and Natural Resources Research, Chinese Academy of Sciences, Beijing 100101, China
2
Key Laboratory of Land Surface Pattern and Simulation, Institute of Geographic Sciences and Natural Resources Research, Chinese Academy of Sciences, Beijing 100101, China
*
Author to whom correspondence should be addressed.
Appl. Sci. 2020, 10(15), 5065; https://doi.org/10.3390/app10155065
Submission received: 21 June 2020 / Revised: 18 July 2020 / Accepted: 22 July 2020 / Published: 23 July 2020
(This article belongs to the Special Issue Remote Sensing and Geoscience Information Systems in Applied Sciences)

Abstract

:

Featured Application

An integrated method was applied in this study to analyze the processes of agricultural evolution. Our methods can be an exemplary for other agro-pastoral ecotone or ecologically fragile area in other world’s regions, highlighting the application of an integrated method for land-use change analysis.

Abstract

Assessing historical landscape change and its related land–use changes is necessary for understanding agricultural evolution processes and their ecological effects. In our study, the landscape patterns of paddy fields and dry farmland were studied using information obtained from remote-sensing data. Land-use changes related to cultivated land were analyzed based on transition probability index and trajectory computing method. Furthermore, the possible driving force and water resource effect of cultivated land changes were discussed. The results indicated that paddy field and dry farmland expanded by 56.99% and 10.92% in the West Songnen Plain, respectively, compared with their own area in 1990. Trajectory analyses showed that dry farmland was usually more stable than paddy field. Climate warming, wind speed reduction, population growth, technological development, as well as land use policies all drove cultivated land changes. The net water consumption of cultivated land showed an increased trend. To achieve the sustainable development of land-system, optimizing land-use structure as well as configuration between water and soil resources should be given more attention in the future.

1. Introduction

Land use and land cover change (LULCC) is widely regarded as a fundamental element and driving force of global changes [1,2,3]. LULCC influences key functions of ecosystem services (ES), playing an important role in global sustainability [4,5]. Human activities in the past decades have significantly changed the global environment, primarily because of the transformation from natural ecosystems (forest, grassland and wetland etc.) to agricultural land or developed area [6,7,8,9,10]. Human-induced LULCC greatly affects global climate warming, carbon cycle, ES, and hydrological cycle [2,4,11]. Estimating the spatio–temporal characteristics of historical LULCC especially human-induced LULCC quantitatively as a basic ecological process is of great significance for predicting future LULCC and providing a decision–making basis for the sustainable use of land resources [7,12].
As one kind of transitional land-use type, the agro-pastoral ecotone transforms from livestock grazing to farming, where land-use is diversified and undergoes land–use change more frequently [9,13]. The agro-pastoral ecotone of Northern China, as an ecological fragile region, is quite vulnerable to global changes and anthropogenic disturbances [13,14,15]. Anthropogenic disturbances including over-reclamation, excessive grazing, over-cutting, and farmland abandonment has generated serious environmental impacts in this region, especially the destruction of grassland ecosystem has constantly drained ES [13,15,16]. Large-scale natural ecosystems especially grassland were reclaimed as cultivated land promoting by population increase, climate change, and policy shifts in Northern China, leading to continual changes of land-use distribution in the agro-pastoral ecotone [17,18]. Grassland in Northern China plays a significant role in servicing social-economics of pasture and ecological development of this region. With the encroachment of cultivated land on traditional pastoral areas, the landscape of balanced pasture ecology has been destroyed [13,17]. Consequently, it is necessary to deeply understand land-use pattern changes, especially the cultivated land expansion processes for future sustainability.
Cultivated land is strongly influenced by human activities [9]. Agricultural landscape stands for the spatial distribution of cultivated land, influencing the stability, vulnerability and productivity of cultivated land [19,20,21]. Assessing the historical landscape change and its related land-use changes is necessary for understanding the agricultural evolution processes and its ecological, environmental and water resource effects [21,22,23,24]. As an important type of cropland, paddy field serves over half of the world’s population with approximately 15% of the world’s cropland [6]. Paddy field also shares the attributes of wetlands as a kind of human–made wetlands [25,26,27]. Sharing both attributes of wetlands and cropland, paddy field affects food security, carbon storage, water security, as well as zoonotic infectious disease transmission [27,28,29]. Growing on flooded soil, paddy rice consumes a large–amount of water resources, regardless of being irrigated or rainfed rice, which affects local water scarcity [30,31]. Paddy rice planting contributed to more than 10% of global methane (CH4) emissions [32,33,34]. In addition, paddy field is a significant habitat for waterfowl, affecting the spread of disease such as avian influenza virus [27,35]. Considering the difference between paddy and dry farmland [36,37], it is vital to monitor and analyze paddy and dry farmland distribution separately. Studies have been monitoring paddy distribution maps at local, national and global scales [27,38]. Some studies also researched the mutual transformation between these two types of cultivated land. However, few studies linked paddy and dry farmland to different land-use changes, especially in agro-pastoral ecotone.
The West Songnen Plain, which is located in the central part of Northeast China, is an important food and agricultural base of China [39]. Located in the agro-pastoral ecotone, land-use change is quite frequent in the West Songnen Plain [17,40]. Under the effect of global climate warming and human disturbance, cultivated land has spread continuously while the natural ecosystem especially grassland has been shrinking and fragmented in this region in recent decades [17]. Much attention has been paid to land-use pattern, wetland loss, grassland fragmentation, lake and reservoir changes and the influence of these changes on ES in this area [17,40,41,42]. However, previous studies analyzed cultivated land as a whole and did not separate paddy field and dry farmland distribution. Therefore, studies regarding landscape change of paddy/dry farmland and linking paddy/dry farmland changes to other land-use changes are lacking. The objectives of this study were to (1) characterize the landscape pattern of paddy field and dry farmland during 1990–2015 in the West Songnen Plain, (2) explore land-use changes related to different cultivated land types (paddy field and dry farmland) using transition cumulative transition probability and trajectory computing method from 1990 to 2015, and (3) to discuss possible causes of cultivated land change in the West Songnen Plain since 1990.

2. Materials and Methods

2.1. Study Area

This study selects the West Songnen Plain, which is located in the agro-pastoral ecotone, as the study area (Figure 1). Including 14 counties, it covers an area of about 7.1 million ha [42]. The study area has a temperate semi-arid monsoon climate, which has four obvious seasons. Spring is dry, less rainfall, and windy while summer has intensive rainfall and high temperature [17]. There is less rainfall in autumn and winter. The average annual temperature varies between 2 and 5.6 °C [41]. The precipitation in the West Songnen Plain ranges between 500 and 650 mm while the evaporation varies from 1500 to 1900 mm. Additionally, the precipitation mainly concentrated from mid-June to mid-August. The frost-free days of the West Songnen Plain vary from 130 to 165 days. Water resources of the West Songnen are relatively rich, including the Songhua River, Nenjiang River, Tao’er River and Huolin River, which provide facilities for agricultural planting [42]. The main crop types in this area include maize, rice and soybean. Haplic Chernozem, Haplic Kastanozem and Eutric Vertisol are widely distributed in the West Songneng Plain. The Quaternary sediment ranges from 50 to 100 mm in the study area. The upper levels consist of alluvial and lacustrine loess-like sandy clay and silty sand while the central level consists of lacustrine silty clay. The lower levels consist of lacustrine sand and gravel. A large area of natural landscape, such as grassland and marsh, has been transformed to cultivated land in this region in recent decades [17,40].

2.2. Data Preprocessing

According to our previous work [21,43,44], land-use maps in the West Songnen Plain for four periods, 1990, 2000, 2010, and 2015, were developed. Land-use maps in 1990, 2000 and 2010 were obtained from China’s land-use data in previous publications. Additionally, we updated the data to 2015 according to the same methodology published in previous papers. Landsat Thematic Mapper (TM) images were applied to map land-use patterns in 1990, 2000, and 2010 while Landsat-8 Operational Land Imager (OLI) images were used to update the land-use map in 2015. The resolution of both TM and OLI images is 30 m.
ERDAS and ArcGIS software were applied to process data in our study. Landsat TM/OLI images obtained from June to October were chosen to identify different land-use types because plants in the West Songnen Plain grow vigorously during this period. The standard false color composition which combine bands 4 (Red), 3 (Green), 2 (Blue) for TM images and 5 (Red), 4 (Green), 3 (Blue) for OLI images, respectively, was applied to produce the original images for interpretation. The standard coordinate and projection system, the Beijing 1954 Krasovsky_Albers projection, was used to keep consistency of all spatial data. The primary method to acquire land-use patterns in different periods is visual interpretation which digitizes remote-sensing images after geometric rectification and ortho-rectification [21]. Geometric rectification of related remote-sensing images was done based on ground control points, with the Root Mean Squared (RMS) Error less than 1.5 pixels (45 m). In this study, the smallest mapping unit and the minimum edge are larger than 6 × 6 pixels (3.24 ha) and 4 pixels (120 m), respectively. Additionally, land-use vector outlines were drawn through comparing images between two years to identify real land–use changes in order to decrease the errors resulting from post-classification comparison.
Standard quality control was used to ensure the accuracy of the land-use data. Interpreting samples were produced by field surveys before interpretation of remote-sensing images. Then, interpreters were trained uniformly to recognize remote-sensing image characteristics of various land-use categories. After interpretation, the accuracy was mainly checked by verification points generated by substantial field survey photos and Google Earth images. In addition, we selected the verification points randomly at a ratio of 10%. Unmanned aerial vehicle (UAV) were also used to carry out field surveys in 2015. UAV can fly to places that are difficult for humans to reach such as marshy wetlands. Therefore, it is very helpful for field surveys. UAV photos have a resolution of 5–6 m when our UAV flies to 200 m. The overall accuracy of the six first-level classes was larger than 94.3%, and that of the 25 land-use sub-classes was larger than 91.2% [21]. We used the same first-level classification system as Liu et al. [21]. The difference is that we separated paddy and dry farmland to analyze cultivated land changes. Considering the wide distribution of marshy wetlands in the study area, we separated marshy wetland from unused land to analyze land-use changes.

2.3. Indicators/Methods for Assesing the Land Use and Land Cover Changes

2.3.1. Spatiotemporal Changes

We used two indices (Annual Change Area and Annual Change Rate) to analyze historical cultivated land changes [45] as follows:
C A = ( A b A a ) / T × 100 %
C R = ( A b A a ) / A a T × 100 %
where CA and CR are the annual change area (ha/y) and change rate (CR,%/y), respectively. Aa and Ab stand for the area of different land–use types at the time A and time B, respectively, and T represent the interval years.
The gravity centroid index of Equations (2) and (3) is used to represent the spatial movement of land–use [25]:
X = i = 1 n ( C t i × X i ) / i = 1 n C t i ,
Y = i = 1 n ( C t i × Y i ) / i = 1 n C t i ,
where X and Y represent the longitude and latitude of the gravity center, respectively; C t i is the area of the ith patch while n stands for the patch number of different land–use categories.
Cumulative transition probabilities P i j were used to describe the intensities of various land–use change categories:
p i j = ( i = 1 n S i j t S T )   ×   100 % ,
where i and j are different land–use categories; S i j t is the area transformed from land–use type i to j from time t to t + 1; and ST is the whole area of the West Songnen Plain.

2.3.2. Landscape Pattern

Considering the relative complexity of landscape pattern, multiple indices were chosen to identify the landscape pattern changes of cultivated land by Fragstats 4.2 software. Mean area (MA), largest patch index (LPI), patch density (PD) were used to analyze space configuration characteristics while other indices including patch cohesion (COHESION), splitting (SPLIT), and aggregation (AI) were used to illustrate aggregation characteristics of cultivated land.

2.3.3. Change Trajectory

Codes Yi Equation (5) was used to represent different change trajectories:
Y i = ( G 1 ) i × 10 n 1 + ( G 2 ) i × 10 n 2 + ( G n ) i × 10 n n
where (G1)i and n represent different land-use category codes of polygon i and the number of time periods, respectively. In this study, paddy field and dry farmland are represented by code 1 and code 2, respectively. Additionally, forest, grassland, water, settlement, marsh, and other unused land are represented by codes 3-8, respectively. Taking code “4222” as an example, it represents “Grassland–Dry farmland–Dry farmland–Dry farmland”.

3. Results

3.1. Spatiotemporal Changes of Cultivated Land

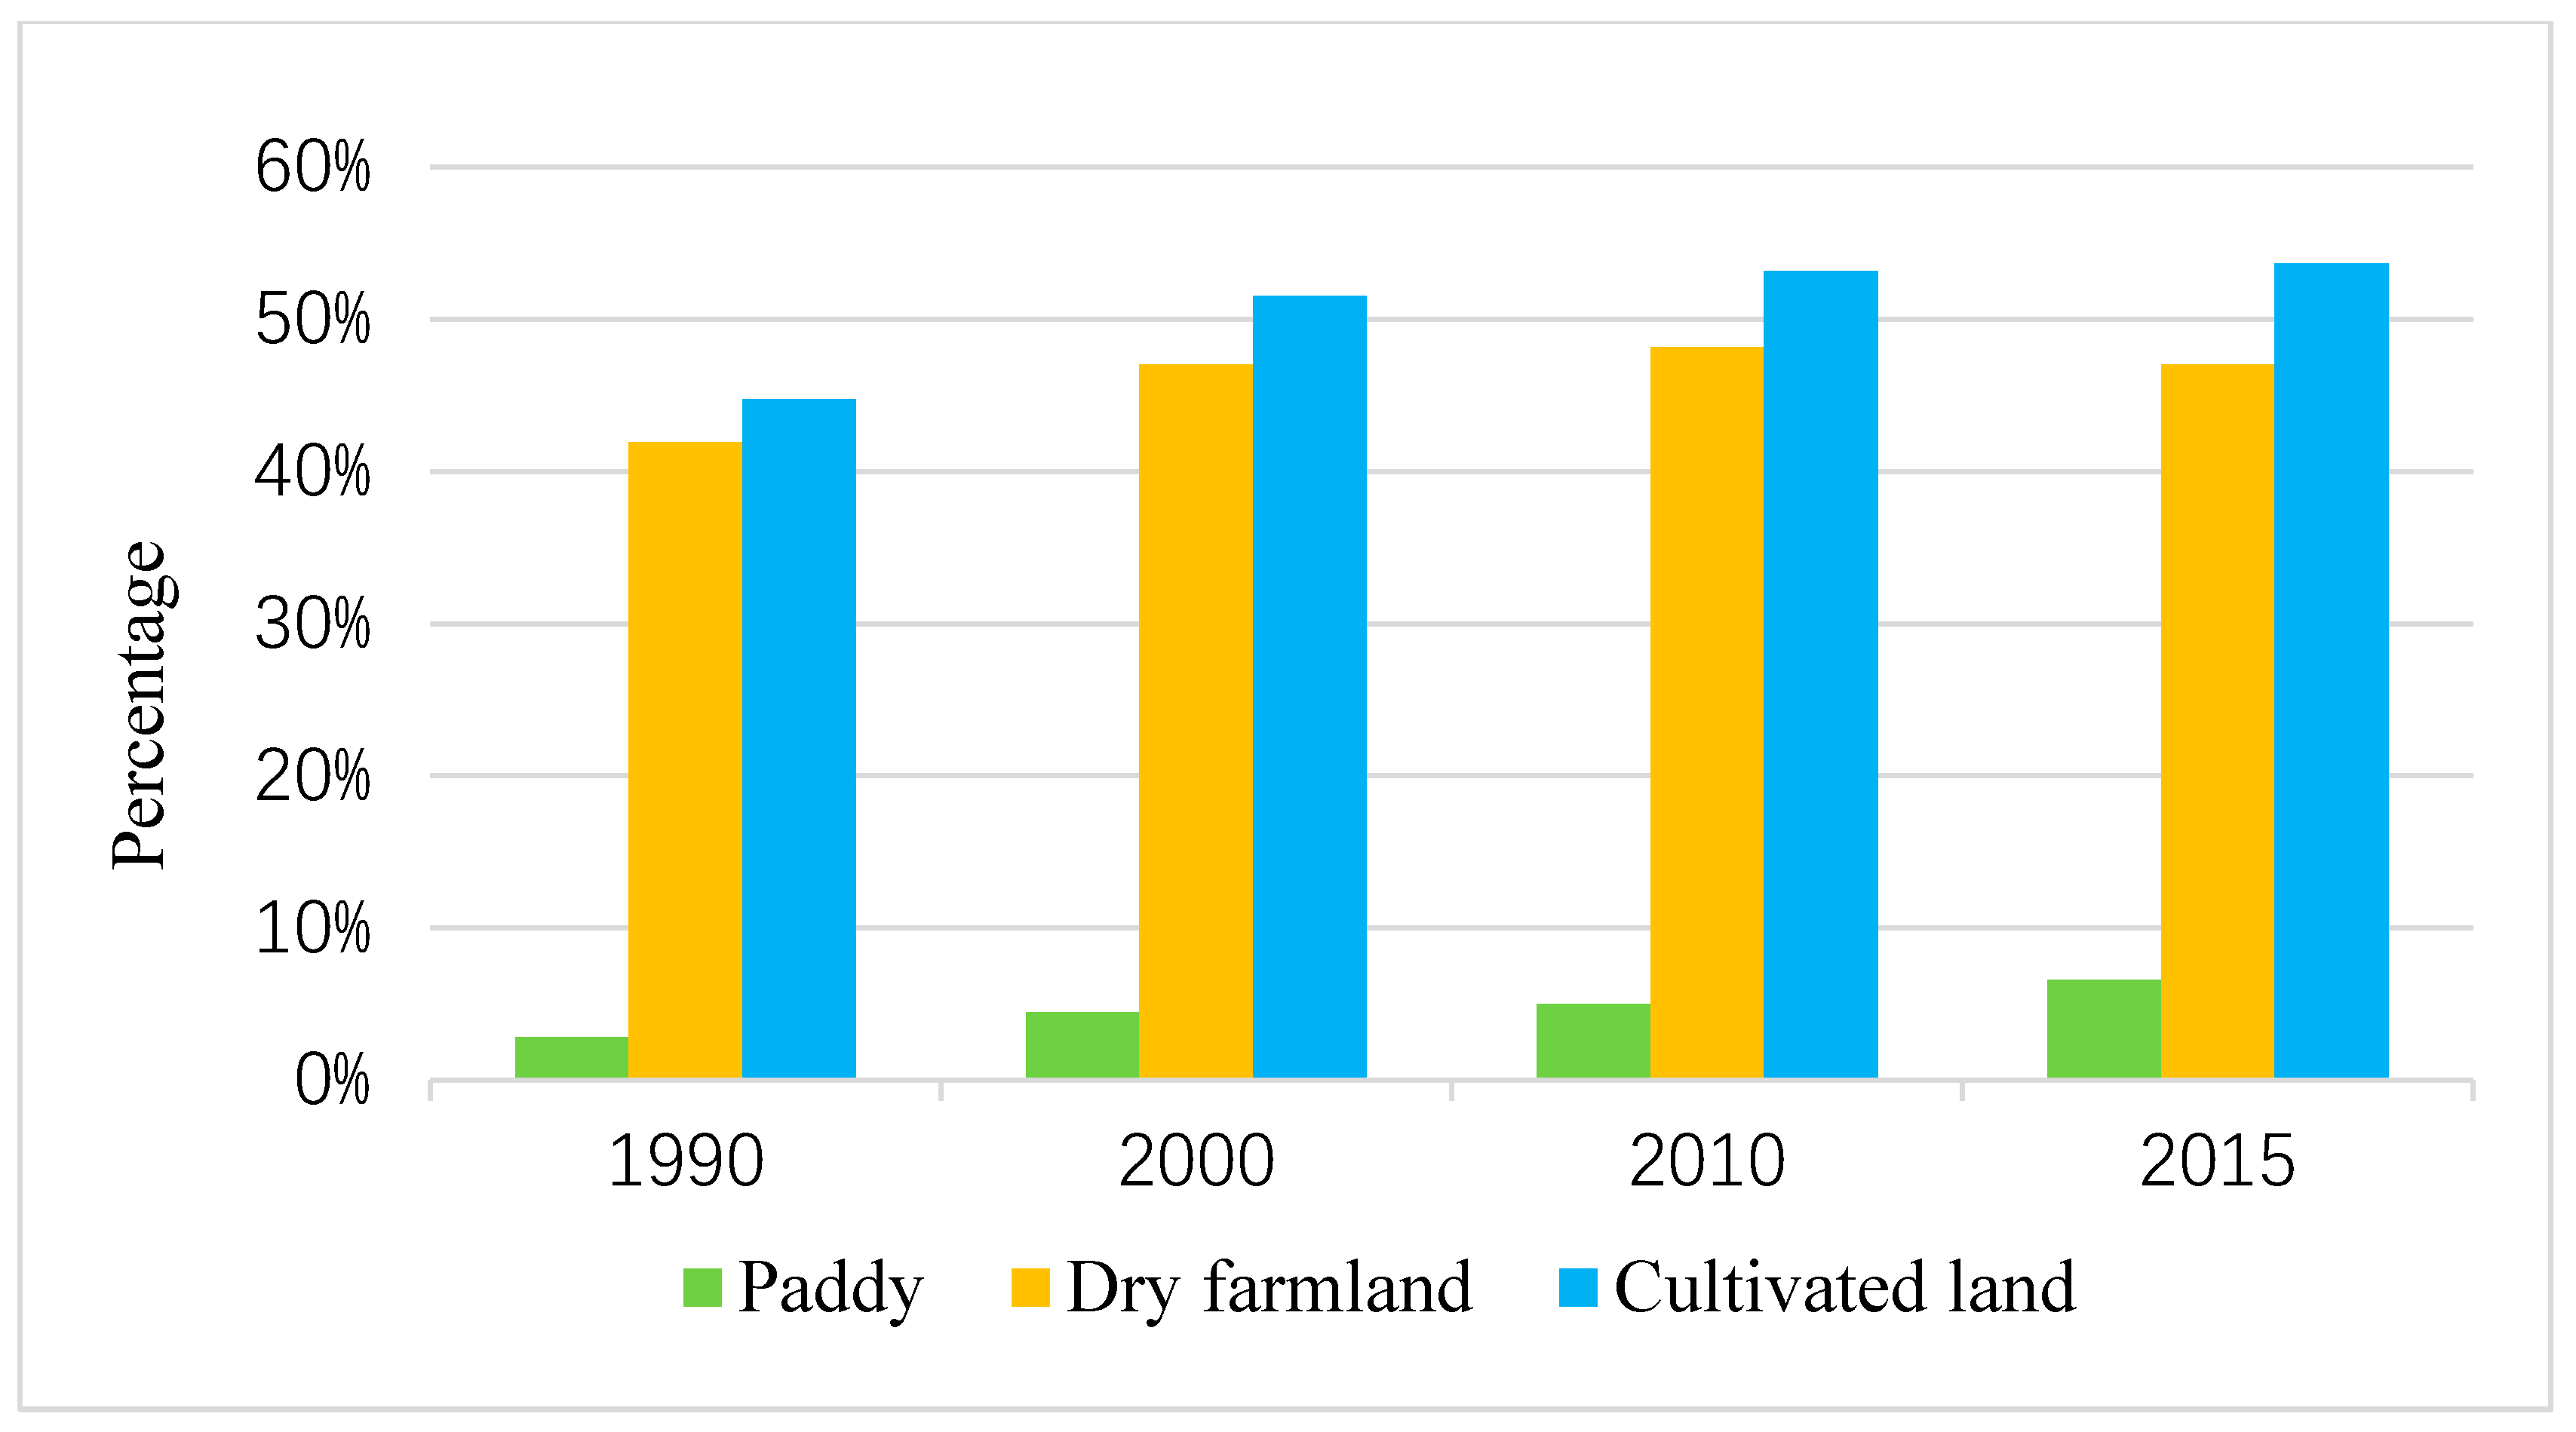
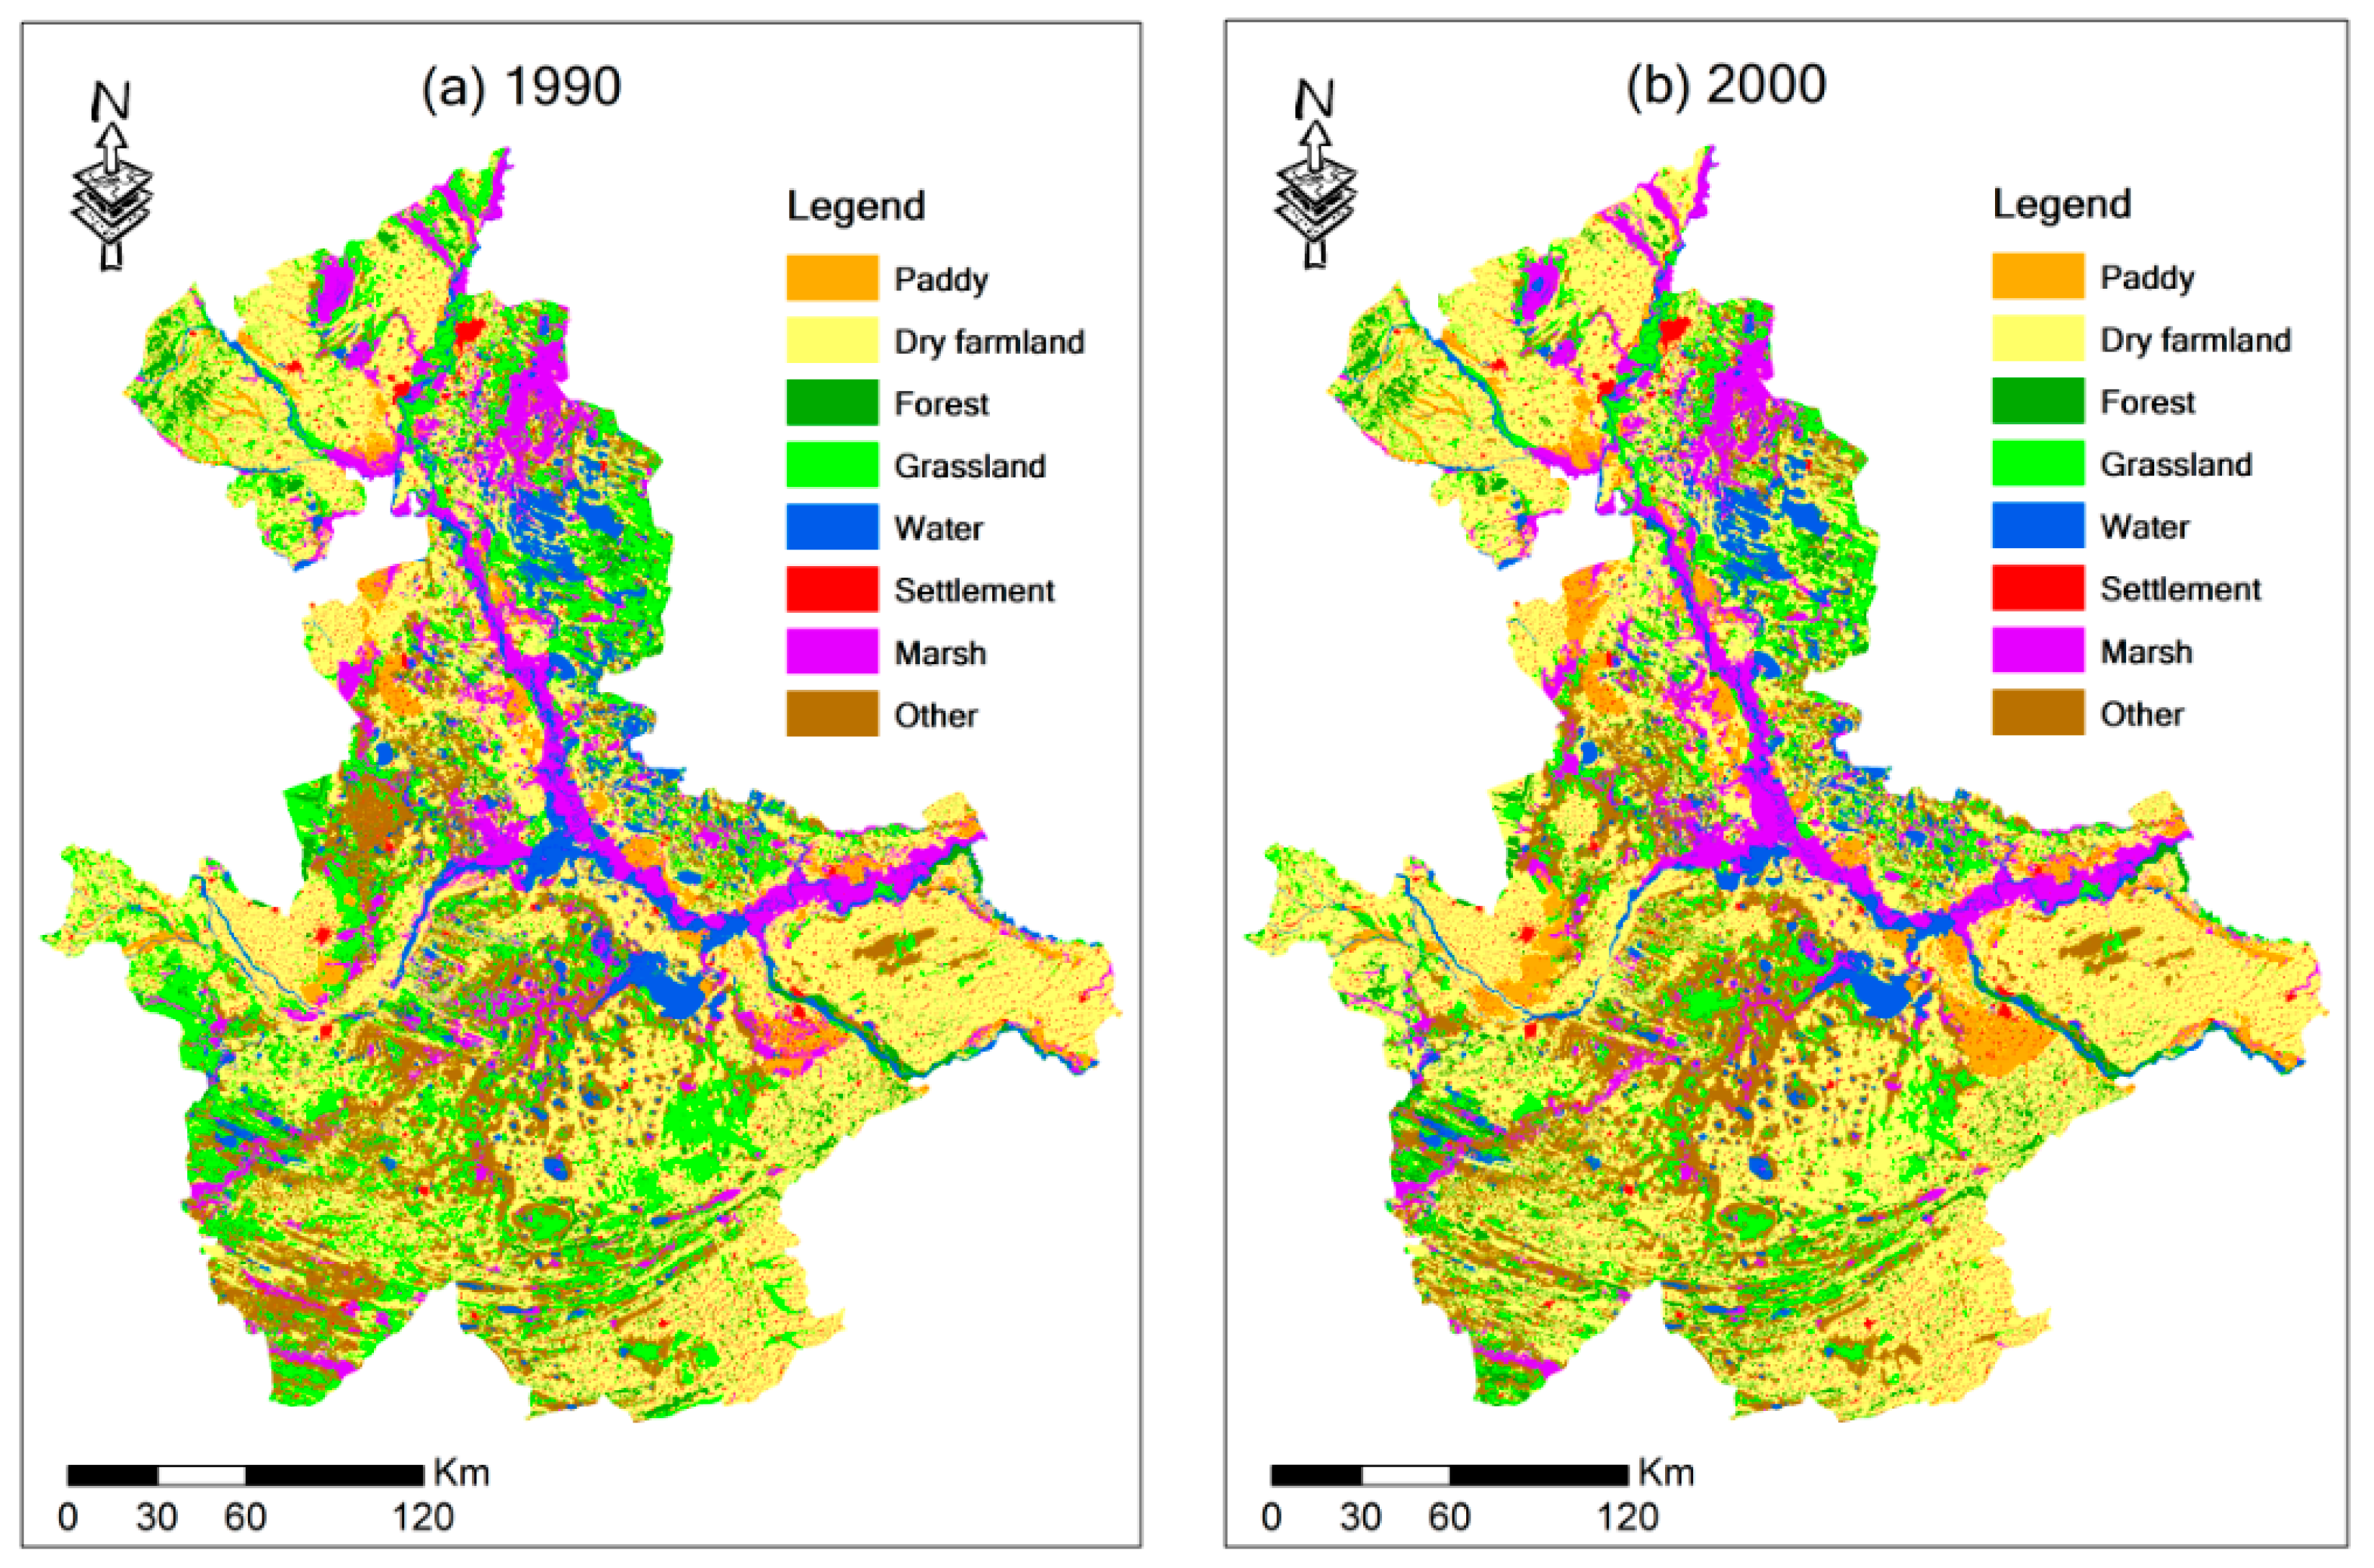
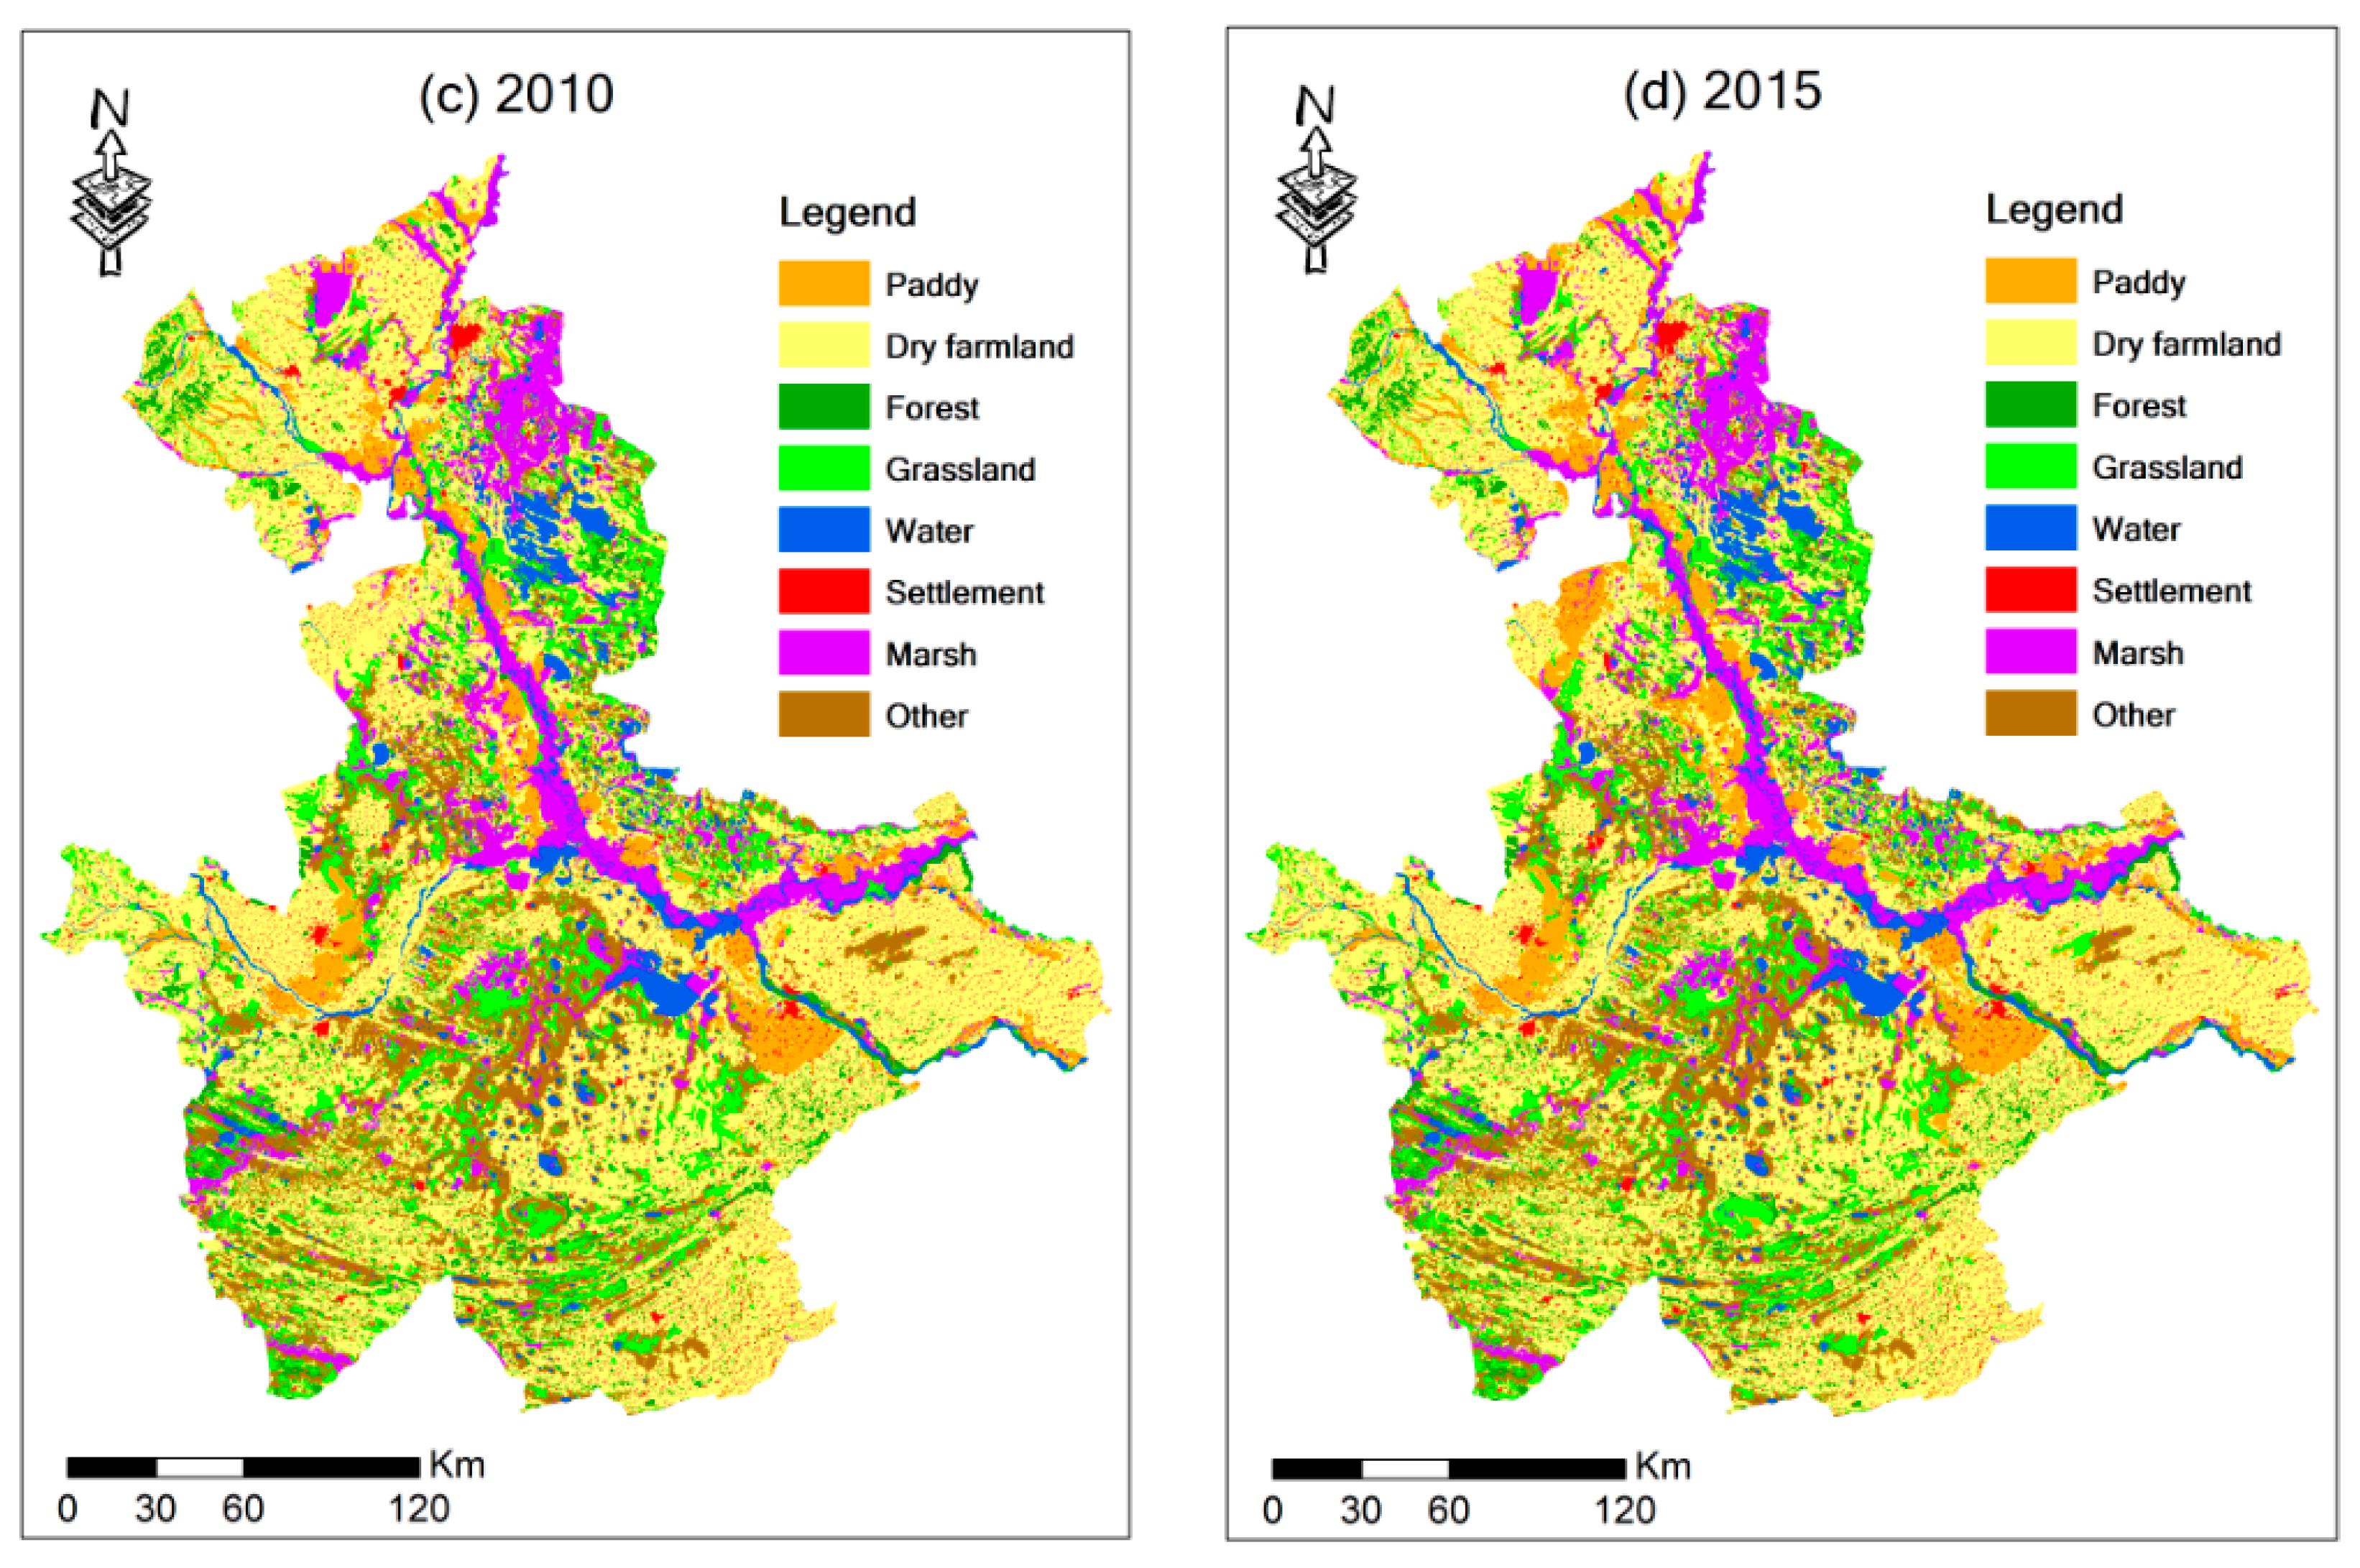
3.1.1. Cultivated Land Evolution Process

The evolution of the structure of the cultivated land from 1990 to 2015 in the West Songnen Plain is shown in Figure 2. Over the last 25 years, cultivated land increased from 3,175,947 ha in 1990 to 3,807,719 ha in 2015, increasing by 19.89% (about 631,772 ha). Among which, paddy field and dry farmland expanded by 56.99% and 10.92%, respectively, compared with their own area in 1990. The area of paddy field showed a continuously rising trend since 1990 while dry farmland showed an increasing trend during 1990–2010 and a decreasing trend from 2010 to 2015. The proportion of paddy to cultivated land increased from 6.35% to 12.32% while that of dry farmland decreased from 93.65% to 87.68%.
Figure 3 describes the spatial distribution of land-use pattern in four time-intervals (1990, 2000, 2010, 2015) in the study area, indicating an expansion trend of cultivated land, especially the northward movement of paddy field in the past 25 years. The paddy rice planting has moved to the northernmost part of the Songnen Plain in the study period. It can also be intuitively seen that the proportion of cultivated land is quite large.

3.1.2. Change Area and Rate

The average CA and CR per year of cultivated land in different time periods are described in Table 1. In the first stage (1990–2000), paddy field and dry farmland all showed increasing trends. In the second stage (2000–2010), the growth rate of paddy field and dry farmland has slowed down. In the third stage (2010–2015), the area of paddy field increased while that of dry farmland decreased. In detail, cultivated land area expanded by 48,032.89 ha/y with a change rate of 1.51%/y from 1900 to 2000, which was the largest among three time periods. Since 2000, cultivated land area still showed an increased trend but the increasing speed became slower. Paddy area continued to increase in the study period. The change rate of paddy field decreased first and then increased in the last 25 years. The CA and CR of dry farmland showed a decreasing trend in the study periods. During 2010–2015, the change area of dry farmland reached −15,810.98 ha/y, with a change rate of −0.46 %/y.

3.1.3. Landscape Pattern

The spatial configuration characteristic of paddy and dry farmland are shown in Table 2 by the PD, LPI, and MA indices. For paddy field, the PD index indicated a declining trend while LPI index and MA showed an increasing trend during the study period. In detail, PD always indicated a growth trend while LPI increased during 1990–2010 and then decreased slightly from 2010 to 2015. MA showed a fluctuant upward trend, with a slight decline in 2010. For dry farmland, PD decreased in 1990–2000, with a slight increase in 2000–2010 and 2010–2015. LPI index of dry farmland grew from 1990 to 2000 and decreased since 2000. MA index showed an increasing trend during 1990–2010, especially during 1990–2000, and then indicated a declining trend during 2010–2015.
Three indices were applied to describe the aggregation features of paddy and dry farmland as is shown in Table 3. Larger values of COHESION and AI represent more aggregation, while a smaller value of SPLIT represents more aggregation. For paddy field, COHESION and AI index indicated a growth trend while SPLIT index showed a downward trend during the study period. In detail, AI showed a growth trend all the time while COHESION showed a slight decreased trend during 2000–2010 and indicated an increasing trend during other periods. SPLIT showed a decreased trend. The changes of these indices indicated that paddy in the West Songnen plain have become aggregated since 1990. For dry farmland, the changes of these indices are not as regular as paddy field. In general, COHESION and AI index indicated a growth trend while SPLIT index indicated a downward trend during the study period. COHESION increased in 1990–2000, with a slight growth in 2000–2010 and a slight decline 2010–2015. AI index of dry farmland increased from 1990 to 2010 and decreased since 2010. SPLIT index showed a decreasing trend during 1990–2000 and then showed an increasing trend during 2000–2015. Dry farmland in the West Songnen plain have become aggregated since 1990, but not as obvious as paddy. Dry farmland aggregated first and then was split slightly.

3.1.4. Changes in Gravity Center

The changes in gravity centers of paddy and dry farmland from 1990 to 2015 are displayed in Table 4. Paddy field transferred from (45.97° N, 124.01° E) in 1990 to (46.11° N, 123.88° E) in 2015 while dry farmland moved from (45.97° N, 124.01° E) to (46.11° N, 123.88° E) during 1990–2015. The gravity centers of paddy have moved northwestward while dry farmland has moved southwestward since 1990 in the West Songnen Plain.
The migration distance and speed of gravity center of cultivated land were calculated as shown in Table 5. The migration distance and speed of paddy was much larger than that of dry farmland in different periods. For example, the migration distance was 13.37 km and the speed was 1.34 km/a for paddy during 2000–2010 while that of dry farmland were 4.04 km and 0.40 km/a, respectively. The migration speed for both paddy and dry farmland showed an increasing trend since 1990, especially for paddy.

3.2. Land Use Changes Related to Cultivated Land

3.2.1. Change Trajectory

In our study, the initials of different land use categories were adopted to stand for different types to better illustrate cultivated land trajectories. For instance, “F” and “G” were applied to take the place of “forest” and “grassland”, respectively.
For dry farmland, the percentage of unchanged dry farmland is the largest. In detail, “DDDD”, namely “Dry farmland–Dry farmland–Dry farmland–Dry farmland”, occupied the largest percentage of land-use changes related to dry farmland changes (74.46%), following by “GDDD” (9.02%), namely “Grassland–Dry farmland–Dry farmland–Dry farmland”, and “UDDD” (1.95%), namely “Other unused land–Dry farmland–Dry farmland–Dry farmland ”.
For paddy field (Table 6), “PPPP”, namely “Paddy–Paddy–Paddy–Paddy ”, occupied the largest percentage of land use changes related to paddy changes (30.32%), followed by “2111” (9.39%), namely “Dry farmland–Paddy–Paddy–Paddy ”, and “MPPP” (7.17%), namely “Marsh–Paddy–Paddy–Paddy”.
Trajectory changes are classified as four types according to their steps, namely, unchanged, one-step, two-step and three-step changes. One-step changes accounted for the largest percentage (51.87%), followed by unchanged types (30.32%) and two-step changes (17.07%). Twenty-seven categories were contained in the one-step change types, including the conversion from marsh, dry farmland and grassland to paddy field (Table S1 in the Supplementary Materials). In addition, the transformation from unused land to paddy field also accounted for certain percentage such as “UPPP” (Unused land–Paddy–Paddy–Paddy) and “UUPP” (Unused land–Unused land–Paddy–Paddy). The transformation from unused land to paddy mostly indicated the conversion from saline-alkali land to paddy. Fifty-four categories and nine categories were included in two-step and three-step changes, respectively. For instance, the two-step change “GDDP” (Grassland–Dry farmland–Dry farmland–Paddy) means the transformation from grassland to dry farmland, and then from dry farmland to paddy field.
Unchanged types accounted for the largest percentage (74.46%), followed by one-step types (22.26%) and two-step changes (2.58%). The percentage of unchanged types of dry farmland (74.46%) was much larger than that of paddy field (30.32%) while percentage of one-step changes of dry farmland was much smaller than that of paddy field (Table 6). Paddy fields need more water resources to survive their life than dry farmland. Therefore, dry farmland is usually more stable than paddy field. Thirty-two types were included in the one-step change types of dry farmland, including the transformation between grassland/marsh/paddy/unused land and dry farmland (Table S2 in the Supplementary Materials). The transformation from unused land to dry farmland such as “UDDD” (Unused land–Dry farmland–Dry farmland–Dry farmland) and “UUDD” (Unused land–Unused land–Dry farmland–Dry farmland) mostly indicated d the transformation from saline-alkali land to dry farmland. The number of two-step changes and three-step changes of dry farmland was much smaller than that of paddy field, mostly because dry farmland was usually more stable than paddy field.

3.2.2. Cumulative Transition Probability

Cumulative transition probability of different land-use types was calculated by formula 4. Results (Table 7) indicated that Pij between paddy and other land-use categories was 0.89% (from paddy to other categories) and 4.65% (from other categories to paddy) of the total area, respectively, while that of dry farmland was 4.73% (from dry farmland to other types) and 9.86% (from other types to dry farmland), respectively. The dry farmland gain accounted for the largest percentage (9.86%), following by the transformation from grassland to other land-use categories and from dry farmland to other land-use categories. Table 7 indicated that paddy expansion mainly contributed by dry farmland (about 52.66% of the transformation from other land-use categories to paddy), followed by marsh and grassland. Dry farmland had the greatest contribution to paddy decrease (about 84.45%). The mutual transformation between two cultivated land types was the dominant land-use categories of cultivated land conversions.

4. Discussion

4.1. Cultivated Land Changes Greatly Affect Landscape Patterns

Agricultural activities have greatly affected local land-use patterns. In the West Songnen Plain, the percentage of cultivated land contributed to about half (53.66% in 2015) of the whole area. Agricultural land expansion could be associated with depletion of other important natural resources such as wetland, grassland and forestland, leading to the change of land-use and landscape patterns. Previous studies also indicated that natural landscape such as grassland and marshland all indicated a downward trend in the study area [17,18,40,41]. Wang et al. found that approximately 64% of grassland in 1954 was removed by 2000 and pointed out that agricultural activity was one of the main drivers of grassland loss [17]. Our trajectory analysis also captured the conversion from grassland to dry farmland (e.g., “Grassland–Dry farmland–Dry farmland–Dry farmland” and “Grassland–Grassland–Dry farmland–Dry farmland”) and paddy field (e.g., “Grassland–Paddy–Paddy–Paddy” and “Grassland–Grassland–Paddy–Paddy”). Marshland in the West Songnen Plain showed shrinkage and fragmentation characteristic since the mid-1950s, which had a relationship with climate change, population growth, economic development and government policies [40]. This study captured the conversion from marshland to cultivated land such as “Marsh–Paddy–Paddy–Paddy”, indicating that agricultural activity promoted marshland loss to some extent in the study area. Previous studies in other study area also clarified that agricultural cultivation was one of the dominant reasons for marshland loss [40,41].
It should be noticed that cultivated land abandonment also accounted for a certain proportion with the acceleration of urban expansion. Labor force attracted from agricultural activities to other economic activities is one reason for cultivated land abandonment. Therefore, historical land-use change trajectories could be used for future policy decision to promote the sustainability of land-use. Facing the intensification of land degradation globally, it is necessary to optimize future land-use structure to achieve green development.

4.2. Driving Force of Cultivated Land Changes

Significant climate warming since the 1950s in the Northeast China has been reported in previous studies [38,44,46]. Previous studies reported increasing yearly temperature and decreasing wind speed in the West Songnen Plain [17,40], which were favorable for agricultural activities especially paddy planting. Population increase and technological development also provided great convenience for agricultural activities [17]. The population in the West Songnen Plain showed an increasing trend since the 1950s, making agricultural expansion easier. Technological development including modern agricultural machinery, water conservancy projects, cold–tolerant seed of rice have provided convenience for large-scale reclamation and the northward movement of rice cultivation [38,42].
On the West Songnen Plain, shifts in land-use policies also played an important role in the progress of cultivated land changes. At the beginning of the 1980s, the Chinese government reformed the land tenure policy and introduced a system of household contract responsibility, in which land-use rights were granted to individuals [18]. Under the encouragement of government, farmers reclaimed a large area of grassland, marshland and sandy land for cultivated land. In 1992, market economy was adopted in China [17]. Due to the higher price of rice than other crop such as maize and wheat, more paddy field was reclaimed in the West Songneng Plain, resulting in the conversion from grassland, marshland, and saline-alkali land to paddy field to some extent [18]. Additionally, more cultivated land was reclaimed by local farmers to obtain economic returns. During 1992–1995, the “to promote dry farmland to paddy” policy was implemented in the Northeast China [38]. Under this new policy, a large-area of paddy appeared at the expense of dry farmland loss. For example, trajectory code “DPPP” (Dry farmland–Paddy–Paddy–Paddy), “DDPP” (Dry farmland–Dry farmland–Paddy–Paddy) and “DDDP” (Dry farmland–Dry farmland–Dry farmland–Paddy) indicated the changes from dry farmland to paddy. Irrigation projects also contributed cultivated land changes in the West Songnen Plain. The number of reservoirs with areas larger than 1 km2 in the West Songneng Plain increased from 79 in 1990 to 152 in 2013, which provided great convenience for agricultural irrigation [47]. Some dams were also established to improve irrigation conditions. Some ecological restoration policies nationally or locally also influenced cultivated land changes such as “Grain for Green” and ”Wetland restoration” [44]. On one hand, these policies promoted the conversion from agricultural land to grassland/wetland. On the other hand, they reduced the transformation from natural resources to agricultural land.

4.3. Water Resource Effect Caused by Cultivated Land Changes

Based on cultivated land area and water consumption per unit area, the water consumption of cultivated land in different period was calculated in our study. The values of water consumption per unit area of paddy field and dry farmland in the study area were sourced from Wu et al. [48]. Results indicated that net water consumption of cultivated land increased from 529,048.97 m3/km2 in 1990 to 775,852.29 m3/km2 in 2015, mostly contributed by paddy expansion (Table 8). Water consumption of paddy field increased from 151,328.68 m3/km2 in 1990 to 351,852.24 m3/km2 in 2015 while that of dry farmland increased from 377,720.29 m3/km2 in 1990 to 424,000.05 m3/km2.
Dry farmland is still the dominant landscape in the West Songneng Plain. However, the area growth of paddy field in the past cannot be ignored. The water consumption per unit area of paddy field is about six times that of dry farmland. Paddy expansion has brought considerable pressure on water resources. Studies have indicated that yearly precipitation decreased by 14.7 mm per decade during 1950–2000 [17] and cultivated land expansion has brought drought in the West Songnen Plain [49]. More large dams and reservoirs have been constructed in the West Songnen Plain to irrigate cultivated land in recent decades [47,50]. These dams and reservoirs increased the food yield while also caused serious land salinization and alkalinization in the study area [18,51]. For example, the building of Xingfu Dam in early 1970s was the main reason for rapid increase of salinized land from 1954 to 1975 in the northern part of Da’an County, which is located in the middle of the Songnen Plain [51]. Agricultural crops usually consume a lot of water resources, especially rice which grows on flooded soil, leading to an effect on regional water security. In this study, our results also indicated that agricultural expansion caused an increase in water consumption by 529,048.97 m3/km2 in the West Songnen Plain. For future sustainability, irrigation mechanisms should be standardized and water use efficiency should be improved based on cultivated land distribution. In the future, according to evaluation of regional water and land carrying capacity comprehensively, the rational configuration of water and soil resources should be carried out to achieve ecological and sustainable development.

5. Conclusions

Time series Landsat images were used in our study to characterize the agricultural evolution processes from 1990 to 2015. Our results reveal a rapid increase in cultivated land, especially paddy field expansion, in the West Songnen Plain. An integrated method was applied in our study to analyze the spatiotemporal changes of agricultural land. Paddy and dry farmland were separated from cultivated land to better understand the processes of agricultural evolution. The water resource effect of agricultural expansion was also analyzed and discussed to describe its ecological effect. Results indicate that cultivated land changes greatly affect landscape patterns and water resources. Located in the agro-pastoral ecotone, the West Songnen Plain is a typical ecologically fragile area. Therefore, although our results are specific to the West Songnen Plain, our methods can be an exemplary for other agro-pastoral ecotone or ecologically fragile areas in other regions worldwide, highlighting the application of an integrated method for land-use change analysis. Agriculture could also affect the biogeochemical processes, regional climate as well as carbon recycling. In this study, we only discussed water resource effects. Future studies should also pay attention to other ecological effects. Additionally, optimizing future land-use structure and configuring water and soil resources in areas with rapid agricultural expansion are necessary and urgent to achieve green and sustainable development.

Supplementary Materials

The following are available online at https://www.mdpi.com/2076-3417/10/15/5065/s1, Table S1: Trajectory changes of paddy field (>0.02%), 1990–2015., Table S2: Trajectory changes of dry farmland (>0.02%), 1990–2015.

Author Contributions

Conceptualization, F.Y. and F.S.; methodology, F.Y. and J.N.; data curation, F.Y. and J.N.; writing—original draft preparation, F.Y.; writing—review and editing, F.Y., J.N. and F.S.; funding acquisition, F.S. and F.Y. All authors have read and agreed to the published version of the manuscript.

Funding

This research was jointly supported by the National Natural Science Foundation of China (41890854, 41901383) and the major consulting project of China Academy of Engineering (NO. 2018-ZD-08-5).

Acknowledgments

The authors thank the Research Group of Land System by Remote Sensing in Northeast Institute of Geography and Agricultural Ecology, Chinese Academy of Sciences for data preparation for this study. The authors thank the three reviewers for their constructive comments and suggestions which greatly improved this study.

Conflicts of Interest

The authors declare no conflict of interest.

References

  1. Wingate, V.R.; Phinn, S.R.; Kuhn, N.; Bloemertz, L.; Dhanjal-Adams, K.L. Mapping Decadal Land Cover Changes in the Woodlands of North Eastern Namibia from 1975 to 2014 Using the Landsat Satellite Archived Data. Remote Sens. 2016, 8, 681. [Google Scholar] [CrossRef] [Green Version]
  2. Daunt, A.B.P.; Silva, T.S.F. Beyond the park and city dichotomy: Land use and land cover change in the northern coast of Sao Paulo (Brazil). Landsc. Urban. Plan. 2019, 189, 352–361. [Google Scholar] [CrossRef]
  3. Ruelland, D.; Tribotte, A.; Puech, C.; Dieulin, C. Comparison of methods for LUCC monitoring over 50 years from aerial photographs and satellite images in a Sahelian catchment. Int. J. Remote Sens. 2011, 32, 1747–1777. [Google Scholar] [CrossRef]
  4. Clerici, N.; Cote-Navarro, F.; Escobedo, F.J.; Rubiano, K.; Villegas, J.C. Spatio-temporal and cumulative effects of land use-land cover and climate change on two ecosystem services in the Colombian Andes. Sci. Total. Environ. 2019, 685, 1181–1192. [Google Scholar] [CrossRef]
  5. Gurjar, S.K.; Tare, V. Estimating long-term LULC changes in an agriculture-dominated basin using CORONA (1970) and LISS IV (2013-14) satellite images: A case study of Ramganga River, India. Environ. Monit. Assess. 2019, 191, 217. [Google Scholar] [CrossRef]
  6. Frolking, S.; Qiu, J.; Boles, S.; Xiao, X.; Liu, J.; Zhuang, Y.; Li, C.; Qin, X. Combining remote sensing and ground census data to develop new maps of the distribution of rice agriculture in China. Glob. Biogeochem. Cycles 2002, 16, 38-1–38-10. [Google Scholar] [CrossRef] [Green Version]
  7. Song, D.X.; Huang, C.Q.; Sexton, J.O.; Channan, S.; Feng, M.; Townshend, J.R. Use of Landsat and Corona data for mapping forest cover change from the mid-1960s to 2000s: Case studies from the Eastern United States and Central Brazil. Isprs. J. Photogramm. 2015, 103, 81–92. [Google Scholar] [CrossRef] [Green Version]
  8. Tappan, G.G.; Hadj, A.; Wood, E.C.; Lietzow, R.W. Use of Argon, Corona, and Landsat imagery to assess 30 years of land resource changes in west-central Senegal. Photogramm. Eng. Remote Sens. 2000, 66, 727–735. [Google Scholar]
  9. Mottet, A.; Ladet, S.; Coqué, N.; Gibon, A. Agricultural land-use change and its drivers in mountain landscapes: A case study in the Pyrenees. Agric. Ecosyst. Environ. 2006, 114, 296–310. [Google Scholar] [CrossRef]
  10. Grădinaru, S.R.; Fan, P.; Iojă, C.I.; Niță, M.R.; Suditu, B.; Hersperger, A.M. Impact of national policies on patterns of built-up development: An assessment over three decades. Land Use Policy 2020, 94, 104510. [Google Scholar] [CrossRef]
  11. Huang, A.; Xu, Y.Q.; Sun, P.L.; Zhou, G.Y.; Liu, C.; Lu, L.H.; Xiang, Y.; Wang, H. Land use/land cover changes and its impact on ecosystem services in ecologically fragile zone: A case study of Zhangjiakou City, Hebei Province, China. Ecol. Indic. 2019, 104, 604–614. [Google Scholar] [CrossRef]
  12. Silveira, E.M.D.; de Mello, J.M.; Acerbi, F.W.; de Carvalho, L.M.T. Object-based land-cover change detection applied to Brazilian seasonal savannahs using geostatistical features. Int. J. Remote Sens. 2018, 39, 2597–2619. [Google Scholar] [CrossRef]
  13. Xu, D.; Li, C.; Song, X.; Ren, H. The dynamics of desertification in the farming-pastoral region of North China over the past 10years and their relationship to climate change and human activity. Catena 2014, 123, 11–22. [Google Scholar] [CrossRef]
  14. Yang, Y.; Zhang, S.; Wang, D.; Yang, J.; Xing, X. Spatiotemporal Changes of Farming-Pastoral Ecotone in Northern China, 1954–2005: A Case Study in Zhenlai County, Jilin Province. Sustainability 2014, 7, 1–22. [Google Scholar] [CrossRef] [Green Version]
  15. Liu, L.Y.; Li, X.Y.; Shi, P.J.; Gao, S.Y.; Wang, J.H.; Ta, W.Q.; Song, Y.; Liu, M.X.; Wang, Z.; Xiao, B.L. Wind erodibility of major soils in the farming-pastoral ecotone of China. J. Arid Environ. 2007, 68, 611–623. [Google Scholar] [CrossRef]
  16. Liu, J.-h.; Gao, J.-x.; Lv, S.-H.; Han, Y.-w.; Nie, Y.-h. Shifting farming–pastoral ecotone in China under climate and land use changes. J. Arid Environ. 2011, 75, 298–308. [Google Scholar] [CrossRef]
  17. Wang, Z.; Song, K.; Zhang, B.; Liu, D.; Ren, C.; Luo, L.; Yang, T.; Huang, N.; Hu, L.; Yang, H.; et al. Shrinkage and fragmentation of grasslands in the West Songnen Plain, China. Agric. Ecosyst. Environ. 2009, 129, 315–324. [Google Scholar] [CrossRef]
  18. Wang, L.; Seki, K.; Miyazaki, T.; Ishihama, Y. The causes of soil alkalinization in the Songnen Plain of Northeast China. Paddy Water Environ. 2009, 7, 259–270. [Google Scholar] [CrossRef]
  19. Gepts, P.; Famula, T.R.; Bettinger, R.L.; Brush, S.B.; Damania, A.B.; McGuire, P.E.; Qualset, C.O. Biodiversity in Agriculture: Domestication, Evolution, and Sustainability; Cambridge University Press: New York, NY, USA, 2012; p. 606. [Google Scholar]
  20. Woodward, G.O. Ecosystems in a Human-Modified Landscape: A European Perspective; Academic Press: Waltham, MA, USA, 2011; p. 374. [Google Scholar]
  21. Liu, J.; Liu, M.; Tian, H.; Zhuang, D.; Zhang, Z.; Zhang, W.; Tang, X.; Deng, X. Spatial and temporal patterns of China’s cropland during 1990–2000: An analysis based on Landsat TM data. Remote Sens. Environ. 2005, 98, 442–456. [Google Scholar] [CrossRef]
  22. Yang, Y.; Zhang, S. Historical Arable Land Change in an Eco-Fragile Area: A Case Study in Zhenlai County, Northeastern China. Sustainability 2018, 10, 3940. [Google Scholar] [CrossRef] [Green Version]
  23. Ferng, J.-J. Local sustainable yield and embodied resources in ecological footprint analysis—A case study on the required paddy field in Taiwan. Ecol. Econ. 2005, 53, 415–430. [Google Scholar] [CrossRef]
  24. Zhang, Y.; Wang, C.; Wu, J.; Qi, J.; Salas, W.A. Mapping paddy rice with multitemporal ALOS/PALSAR imagery in southeast China. Int. J. Remote Sens. 2009, 30, 6301–6315. [Google Scholar] [CrossRef]
  25. Liu, X.; Dong, G.; Wang, X.; Xue, Z.; Jiang, M.; Lu, X.; Zhang, Y. Characterizing the spatial pattern of marshlands in the Sanjiang Plain, Northeast China. Ecol. Eng. 2013, 53, 335–342. [Google Scholar] [CrossRef]
  26. Yan, F.Q.; Liu, X.T.; Chen, J.; Yu, L.X.; Yang, C.B.; Chang, L.P.; Yang, J.C.; Zhang, S.W. China’s Wetland Databases Based on Remote Sensing Technology. Chin. Geogr. Sci. 2017, 27, 374–388. [Google Scholar] [CrossRef] [Green Version]
  27. Dong, J.; Xiao, X.; Kou, W.; Qin, Y.; Zhang, G.; Li, L.; Jin, C.; Zhou, Y.; Wang, J.; Biradar, C.; et al. Tracking the dynamics of paddy rice planting area in 1986–2010 through time series Landsat images and phenology-based algorithms. Remote Sens. Environ. 2015, 160, 99–113. [Google Scholar] [CrossRef]
  28. Xiao, X.; Boles, S.; Liu, J.; Zhuang, D.; Frolking, S.; Li, C.; Salas, W.; Moore, B. Mapping paddy rice agriculture in southern China using multi-temporal MODIS images. Remote Sens. Environ. 2005, 95, 480–492. [Google Scholar] [CrossRef]
  29. Zhang, B.; Tian, H.; Ren, W.; Tao, B.; Lu, C.; Yang, J.; Banger, K.; Pan, S. Methane emissions from global rice fields: Magnitude, spatiotemporal patterns, and environmental controls. Glob. Biogeochem. Cycles 2016, 30, 1246–1263. [Google Scholar] [CrossRef] [Green Version]
  30. Gashaw, T.; Tulu, T.; Argaw, M.; Worqlul, A.W. Modeling the hydrological impacts of land use/land cover changes in the Andassa watershed, Blue Nile Basin, Ethiopia. Sci. Total Environ. 2018, 619–620, 1394–1408. [Google Scholar] [CrossRef]
  31. Schilling, K.E.; Jha, M.K.; Zhang, Y.K.; Gassman, P.W.; Wolter, C.F. Impact of land use and land cover change on the water balance of a large agricultural watershed: Historical effects and future directions. Water Resour. Res. 2008, 44, 1–12. [Google Scholar] [CrossRef]
  32. Win, K.T.; Nonaka, R.; Toyota, K.; Motobayashi, T.; Hosomi, M. Effects of option mitigating ammonia volatilization on CH4 and N2O emissions from a paddy field fertilized with anaerobically digested cattle slurry. Biol. Fertil. Soils 2010, 46, 589–595. [Google Scholar] [CrossRef]
  33. Zhang, A.F.; Cui, L.Q.; Pan, G.X.; Li, L.Q.; Hussain, Q.; Zhang, X.H.; Zheng, J.W.; Crowley, D. Effect of biochar amendment on yield and methane and nitrous oxide emissions from a rice paddy from Tai Lake plain, China. Agric. Ecosyst. Environ. 2010, 139, 469–475. [Google Scholar]
  34. Huang, Y.A.O.; Sun, W.; Zhang, W.E.N.; Yu, Y.; Su, Y.; Song, C. Marshland conversion to cropland in northeast China from 1950 to 2000 reduced the greenhouse effect. Glob. Chang. Biol. 2010, 16, 680–695. [Google Scholar] [CrossRef]
  35. Gilbert, M.; Golding, N.; Zhou, H.; Wint, G.R.W.; Robinson, T.P.; Tatem, A.J.; Lai, S.; Zhou, S.; Jiang, H.; Guo, D.; et al. Predicting the risk of avian influenza A H7N9 infection in live-poultry markets across Asia. Nat. Commun. 2014, 5, 4116. [Google Scholar] [CrossRef] [PubMed] [Green Version]
  36. Natuhara, Y. Ecosystem services by paddy fields as substitutes of natural wetlands in Japan. Ecol. Eng. 2013, 56, 97–106. [Google Scholar] [CrossRef]
  37. Yan, F.; Zhang, S.; Su, F. Variations in ecosystem services in response to paddy expansion in the Sanjiang Plain, Northeast China. Int. J. Agric. Sustain. 2019, 17, 158–171. [Google Scholar] [CrossRef]
  38. Yan, F.; Yu, L.; Yang, C.; Zhang, S. Paddy Field Expansion and Aggregation Since the Mid-1950s in a Cold Region and Its Possible Causes. Remote Sens. 2018, 10, 384. [Google Scholar] [CrossRef] [Green Version]
  39. Dong, Z.; Wang, Z.; Liu, D.; Li, L.; Ren, C.; Tang, X.; Jia, M.; Liu, C. Assessment of habitat suitability for waterbirds in the West Songnen Plain, China, using remote sensing and GIS. Ecol. Eng. 2013, 55, 94–100. [Google Scholar] [CrossRef]
  40. Wang, Z.; Huang, N.; Luo, L.; Li, X.; Ren, C.; Song, K.; Chen, J.M. Shrinkage and fragmentation of marshes in the West Songnen Plain, China, from 1954 to 2008 and its possible causes. Int. J. Appl. Earth Obs. Geoinf. 2011, 13, 477–486. [Google Scholar] [CrossRef]
  41. Liu, D.; Wang, Z.; Song, K.; Zhang, B.; Hu, L.; Huang, N.; Zhang, S.; Luo, L.; Zhang, C.; Jiang, G. Land use/cover changes and environmental consequences in Songnen Plain, Northeast China. Chin. Geogr. Sci. 2009, 19, 299–305. [Google Scholar] [CrossRef]
  42. Zhang, B.; Song, X.; Zhang, Y.; Han, D.; Tang, C.; Yu, Y.; Ma, Y. Hydrochemical characteristics and water quality assessment of surface water and groundwater in Songnen plain, Northeast China. Water Res. 2012, 46, 2737–2748. [Google Scholar] [CrossRef]
  43. Liu, J.; Kuang, W.; Zhang, Z.; Xu, X.; Qin, Y.; Ning, J.; Zhou, W.; Zhang, S.; Li, R.; Yan, C.; et al. Spatiotemporal characteristics, patterns, and causes of land-use changes in China since the late 1980s. J. Geogr. Sci. 2014, 24, 195–210. [Google Scholar] [CrossRef]
  44. Yan, F.; Zhang, S. Ecosystem service decline in response to wetland loss in the Sanjiang Plain, Northeast China. Ecol. Eng. 2019, 130, 117–121. [Google Scholar] [CrossRef]
  45. Song, K.; Wang, Z.; Li, L.; Tedesco, L.; Li, F.; Jin, C.; Du, J. Wetlands shrinkage, fragmentation and their links to agriculture in the Muleng-Xingkai Plain, China. J. Environ. Manag. 2012, 111, 120–132. [Google Scholar] [CrossRef] [PubMed]
  46. Chen, C.; Qian, C.; Deng, A.; Zhang, W. Progressive and active adaptations of cropping system to climate change in Northeast China. Eur. J. Agron. 2012, 38, 94–103. [Google Scholar] [CrossRef]
  47. Luo, L.; Mao, D.H.; Wang, Z.M.; Zhang, B.; Ren, C.; Jia, M.M. Analysis of dynamics and driving forces of lakes and reservoirs in western Songnen Plain. Trans. Chin. Soc. Agric. Eng. 2015, 31, 285–291. [Google Scholar]
  48. Wu, W.J.; Xia, T.; Hu, Q. Study on mutual transformation spatial and temporal pattern and its water resources effect between paddy field and dry land in Heilongjiang Province from 1980 to 2015. Chin. J. Agric. Resour. Reg. Plan. 2019, 40, 142–151. [Google Scholar]
  49. Chu, Z.; Ma, L.J.; Ma, J.; Ma, Y. Change of cultivated land in Songnen Plain during 1980–2000 and its impacts on drought. J. Nat. Disasters 2013, 22, 109–115. [Google Scholar]
  50. Luo, X.Z.; Zhu, T.; Sun, G.Y. Influence of human activities on ecological environment of the Songnen Plain. Chin. Popul. Resour. Environ. 2002, 12, 94–99. [Google Scholar]
  51. Li, X.Y.; Wang, Z.M.; Song, K.S.; Zhang, B.; Liu, D.W.; Guo, Z.X. Assessment for Salinized Wasteland Expansion and Land Use Change Using GIS and Remote Sensing in the West Part of Northeast China. Environ. Monit. Assess. 2007, 131, 421–437. [Google Scholar] [CrossRef]
Figure 1. Location map of the West Songnen Plain which includes 14 counties.
Applsci 10 05065 g001
Figure 2. The evolution of the structure of the cultivated land from 1990 to 2015.
Applsci 10 05065 g002
Figure 3. Land-use distribution in different years. (a) 1990; (b) 2000; (c) 2010; (d) 2015.
Applsci 10 05065 g003aApplsci 10 05065 g003b
Table 1. Change area and change rate of cultivated land during different time periods.
Time PeriodsCultivated LandPaddyDry Farmland
CA(ha/y)CR(%/y)CA(ha/y)CR(%/y)CA(ha/y)CR(%/y)
1990−200048,032.891.5111,543.225.7236,489.671.23
2000−201011,762.210.323905.641.237856.570.24
2010−20156764.260.1822,575.246.34−15,810.98−0.46
Table 2. The indices (PD, LPI and MA) applied to describe the patch features of paddy and dry farmland.
TypeTimePDLPIMA
Paddy19900.05260.315454.0416
20000.00610.673734.314
20100.00690.6741722.6863
20150.00820.6691804.7028
Dry farmland19900.19489.2081215.1724
20000.033112.93211419.6731
20100.033210.46131450.6182
20150.036710.34581282.0991
Notes: PD and LPI represent patch density and largest patch index, respectively. MA means Mean Area.
Table 3. The indices (COHESION, SPLIT, and AI) applied to describe the aggregation features of paddy and dry farmland.
TypeTimeCOHESIONSPLITAI
Paddy199099.325736,869.888796.1885
200099.573112,089.139597.7839
201099.559812,070.06797.8907
201599.66655762.867497.9792
Dry farmland199099.907770.178297.3831
200099.935444.064597.9354
201099.9352.766497.9605
201599.927455.984897.9052
Notes: COHESION and SPLIT represent patch cohesion and splitting, respectively. AI means aggregation.
Table 4. Historical changes in gravity centers location.
Type TimeLongitude (E)Latitude (N)
Paddy1990124.0145.97
2000123.9645.9
2010123.9746.02
2015123.8846.11
Dry farmland1990123.8145.61
2000123.7545.61
2010123.7445.62
2015123.7545.6
Table 5. Historical changes in migration distance and speed of gravity center.
TypeTime Distance (km)Speed (km/a)
1990−20008.690.87
Paddy2000−201013.371.34
2010−201512.182.44
1990−20001.560.16
Dry farmland2000−20104.040.40
2010−20152.360.47
Table 6. Proportion of different kinds of change trajectories (paddy and dry farmland).
TypeUnchanged One-Step Two-Step Three-Step
Paddy30.32%51.87%17.07%0.14%
Dry farmland74.46%22.26%2.58%0.25%
Table 7. Cumulative transition probability of different land-use change types (unit: %).
TypePaddyDryForestGrasslandWaterSettlementMarshUnusedTotal
Paddy-0.750.000.050.010.020.040.000.89
Dry farmland2.45-1.350.340.060.210.250.074.73
Forest0.010.79-0.090.000.010.030.010.94
Grassland0.686.040.85-0.080.060.861.159.73
Water0.050.240.010.27-0.001.170.742.49
Settlement0.000.000.000.000.00-0.000.000.01
Marsh1.310.870.010.880.330.01-0.443.86
Unused0.151.160.190.950.170.060.82-3.51
Total4.659.862.422.580.660.383.182.42
Note: unused mean other unused land.
Table 8. Water consumption of cultivated land in different period (Unit: m3/km2).
TypePaddy FieldDry FarmlandTotal
199015,1328.6837,7720.2952,9048.97
200023,7902.8142,4062.1866,1964.99
201026,7195.1043,4040.0370,1235.12
201535,1852.2442,4000.0577,5852.29

